master thesis in international marketing: ef0705 - …357758/fulltext01.pdfmaster thesis in...
TRANSCRIPT

Master Thesis in International Marketing: EF0705
School of Sustainable Development of Society and Technology
Attitude of Thai customers toward the country of origin
in low involvement product
(Case study of chocolate)
Group Number: 2501
Paisan Vaikoontapan (850516)
Waraporn Srisanguansat (850712)
Supervisor: Jean-Charles Languilaire
Examiner: Ole Liljefors
Seminar Date: June 28, 2010

Abstract
Date June 28, 2010
Program MIMA – International Marketing
Course Name Master Thesis (EF0705)
Title Attitude of Thai customers toward the country of origin
in low involvement product (Case study of chocolate)
Authors Paisan Vaikoontapun Waraporn Srisanguansat
[email protected] [email protected]
850516 850712
Supervisor Jean-Charles Languilaire
Research Problem Is the country of origin affecting on the attitude of Thai customers
toward chocolate products?
Purpose This study is to investigate how country of origin affects Thai
customers’ attitude of Low involvement product which is chocolate in
Thailand.
Method The quantitative research has been used to accomplish the purpose of
this thesis. The collection of data was mainly emphasized on primary
data through survey method by distributing questionnaires.
Conclusion Country of origin has two; Firstly, country of manufacturing Thai
customers have positive attitudes toward chocolate produced in USA
and Belgium, however Thai customer have negative attitude toward
chocolate produced in China. Secondly, country of the brand Thai
customers have positive attitude toward brand of chocolate from USA,
England, and Switzerland. Especially, chocolate from Switzerland
have very strong positive attitude.
Keyword Country of origin, Chocolate, Low involvement
Acknowledgements
Over the period of conduction this research would not been possible without those people. We
would like to take the opportunity to express our gratitude to our thesis supervisor, Jean-Charles
Languilaire for his help and guidance throughout this thesis course. We also would like to thank
our opposition groups for giving useful comment for our thesis. Additionally, we are truly
grateful of respondents who took time out of their busy schedules to participate in this thesis.
Paisan Vaikoontapan
Waraporn Srisanguansat
5 July 2010

Table of content
1. Introduction 1
1.1 Background 1
1.2 Thailand Chocolate Market 2
1.3 Problem discussion 3
1.4 Purpose 3
1.5 Limitation 3
1.6 Thesis Structure 4
2. Theoretical Framework 5
2.1 Literature Review 5
2.1.1 Consumer Behavior 5
2.1.2 The Process of Making Decision 6
2.1.3 What is Attitude? 7
2.1.4 Country of Origin (COO) 8
2.1.5 The Effects of Country Image 9
2.1.6 Product Evaluation of Country of Origin 10
2.2 Conceptual Framework 10
3. Method 11
3.1 Choices of Research Approach 11
3.1.1 Qualitative method 11
3.1.2 Quantitative method 11
3.2 Choices of Data Collection 12
3.2.1 Primary data 12
3.2.1.1 Select Primary data method 13
3.2.2 Secondary data 17
3.3 Reliability 17

3.4 Validity 18
3.5 Develop analysis method and interpret the data collected 18
4. Research Findings and Data Analysis 20
4.1 The Analysis of Experience in Consumption 20
4.1.1 Brand Recognition Ranking 20
4.1.2 Frequently Brand Purchased 22
4.1.3 Country of manufacturing 24
4.1.4 Country of the brand 25
4.1.5 Comparison of the Origin Brand Country 26
4.1.6 Comparison of the Production Country 27
4.2 The Analysis of Specific Brand Perception regarding Country of Origin 28
4.2.1 Hershey 29
4.2.2 Cadbury 31
4.2.3 Lindt 33
4.2.4 Country of The Brand 35
4.3 The comparison of customer perception among different demographic information 38
4.3.1 The concentration of country of manufacturing in decision making 38
4.3.2 The concentration of country of the brand in decision making 40
5. Conclusion 44
5.1 The answer to the purpose of research 44
5.2 Reflection 44
5.3 Contribution to practice 45
5.4 Suggestion for the further research 45
6. References 46
7. Appendix A 50
Appendix B 58

List of figures and tables
Figures
2.1: Conceptual Framework 10
3.1: Estimating margin of error on sample survey results 14
Tables
3.1: The characteristic of scale measurement 16
4.1: Brand Recognition 21
4.2: Frequently Brand Purchased 23
4.3: Country of manufacturing 24
4.4: Country of the brand 25
4.5: Comparison of the Origin Brand Country 26
4.6: Comparison of the Production Country 27
4.7: Comparison of chocolate brand 28
4.8: Country of manufacturing effect to the taste of Hershey chocolate 29
4.9: Country of manufacturing effect to the brand image of Hershey chocolate 30
4.10: Country of manufacturing effect to the price of Hershey chocolate 30
4.11: Country of manufacturing effect to the taste of Cadbury chocolate 31
4.12: Country of manufacturing effect to the brand image of Cadbury chocolate 32
4.13: Country of manufacturing effect to the price of Cadbury chocolate 32
4.14: Country of manufacturing effect to the taste of Lindt chocolate 33
4.15: Country of manufacturing effect to the brand image of Lindt chocolate 34
4.16: Country of manufacturing effect to the price of Lindt chocolate 34
4.17: Attitude toward chocolate from country of the brand; in term of taste 35
4.18: Attitude toward chocolate from country of the brand; in term of brand image 36
4.19: Attitude toward chocolate from country of the brand; in term of price 36
4.20: Purchase decision 37
4.21: Country of manufacturing – Gender 38
4.22: Country of manufacturing – Age range 39
4.23: Country of manufacturing – Occupation 39
4.24: Country of manufacturing – Income Level 40
4.25: Country of the brand– Gender 41
4.26: Country of the brand– Age range 41
4.27: Country of the brand– Occupation 42
4.28: Country of the brand– Income level 42

1
1. Introduction
This chapter presents the background of the topic, followed by discussion on problems about
chocolate in Thai market, purpose of this study, limitations, and the structure of the thesis
respectively.
1.1 Background
Globalization creates intense competition for manufactures in the world’s market. The amount of
brands that are competing in the markets and the amount of customers who accept those brands
illustrate the intensive business competition. Furthermore, the numbers of firms that produce
foreign brand products in local countries are increased by local and international-based firms
(Samiee, 1994). Moreover, globalization has created opportunity for company to trade freely
with another country due to the result of Free Trade Agreement, such as NAFTA and ASEAN
(Ahmed et al., 2004). Hence, the level of domestic competition of any countries is high because
products that are available in each market come from both domestic and foreign countries, which
provide many varieties of products for customer. Globalization has created greater demand in the
market, but customers lose some confidence in knowing from where product has come. Actually
customers do not really know from where the product is coming, i.e., they do not know where
the product is produced. It is important for certain value to make customers tend to look back
where product or brands are produced or originated (Samiee, 1994). Customers are more aware
of the country of origins (COO) as an important factor that affects their purchasing decision
(Cateora & Graham, 2006). Previous studies show that the country of origins is an attribute that
customers around the world use for evaluating products (Bilkey & Nes, 1982; Ahmed, 2002).
According to Cateora and Graham (2006), COO is known as any positive or negative attitudes of
customer perception caused by country of manufacture, assembly, or design. With more
customer awareness of COO, it is understandable that customers will rely on the place of
production in order to perceive brand or product image. Furthermore, customers tend to judge the
characteristics of products and countries related to stereotypes. Since they had experience or
heard some information about product, for example, the best tea is made in England, perfume in
France, leather in Italy and so on. These stereotypes focus on particular types of the products

2
from certain countries, and do not spread out to others product categories. In addition,
customer’s stereotypes also perceive that products producing in developed countries have higher
quality than those in developing country. In this study, the authors would like to focus on
Thailand market.
Thailand is classified as developing country (Ministry of Foreign Affairs, 2005) and in 2008
Gross national income (GNI) per capita stand at $7,770 which is lower than developed countries,
for example United States stands at $46,790 (The World Bank, 2010). However, it can be
considered that Thailand has lower purchasing power comparing to other developed countries.
Low involvement products can be reached by all groups of people because these products do not
have high price and require less time to think before making purchasing decision. As most
authors have studied about the effect of COO which concerns high involvement products
(Ahmed et al., 2004), it becomes interesting for the authors to investigate COO effects on the
low involvement products, such as chocolate, in Thailand.
1.2 Chocolate in Thai Market
Predicted by KASIKORN RESEARCH CENTER (KResearch)-covered the year 2010, Thailand
chocolate market will have value around THB 3.5-3.8 billion, the growth rate is almost 20
percent in 2009 (Kasikornresearch, 2010) and the chocolate market value is accounted for 29
percent of the confectionery domestic market. The chocolate market is growing continuously
average at least 10 percent per year due to significant supporting factors in development of
varieties of the product to match consumer markets. The market continuously launches seasonal
products to conform with festivals and thorough several product distribution channels
(Kasikornresearch, 2010).
The development of varieties of product to match customer’s needs is diversified. For children
and teenagers, the product will focus on chocolate that looks appetizing, with various flavors,
stuffed with fruit/ cereal/ gelatin, colorful packaging and inexpensive (Positioning, 2010). For

3
university students, workers and adults, the product will focus on healthy elements, the formula
is mixed in a high proportion of cocoa, the quantity of sugar and milk is low-which it can be
called dark chocolate. Moreover, some producers create a fine piece of chocolate to make it
convenient to eat, clean packaging along with stated clear nutrition labeling due to customers are
becoming more aware of their health (Positioning, 2010).
1.3 Problem discussion
COO has an effect on high involvement products due to the fact that customers have to spend
more time and effort to search the information about the product (Cateora & Graham, 2006).
Customers know that which country has specialization in producing what kind of product, such
as automobile from Germany would have the highest value when compared to the automobile
from other countries. And automobile form Korea and Malaysia are known for the low price.
This is also the perception of Thai customer (Thanasuta & Chaimahawong, 2009). However in
the low involvement product, it is not clear that country of origin has an effect to the perception
and attitude or not. Due to Cateora and Graham (2006), it explains that customer spends less time
in making the purchasing decision on low involvement product and purchases it routinely in
daily life. This problem can create main problem to this study “Is the country of origin affecting
on the attitude of Thai customers toward chocolate products?”
1.4 Purpose
The purpose of this study is to investigate how COO affects the Thai customers’ attitude toward
Low involvement product which is chocolate in Thailand.
1.5 Limitation
Limitation of this research topic can be incurred from respondents. The large unit of target
respondent (422) is very difficult to control. Moreover, the e-mail survey is one of difficult task
in controlling sample’s participation.

4
1.6 Thesis Structure
Introduction • Background
• Problem discussion
• purpose
• Limitations
Theoretical Framework • Literature Review
• Conceptual Framework
Method • Choice of research approach
• Data Collection
• Validity and Reliability
• Data Analysis
Empirical Findings and
Analysis
• The Analysis of Respondent’s experience in
Consumption
• The Analysis of Specific Brand Perception regarding
Country of Origin
• The comparison of customer perception among different
demographic information
Conclusion • The answer to the research question
• The reflection
• Contribution to practice
• Suggestion for further research

5
2. Theoretical framework
This part of research consists of literatures relevant to the study, which includes topics on
consumer behavior, the process of making decision, attitude, product, brand, price, country of
origin, effects of country image, product evaluation of country of origin, and the conceptual
framework.
2.1 Literature review
Consumer behavior is a wide concept therefore in this study, authors focus on the attitude which
is an essential part of the consumer behavior. It is important to understand the concept of
consumer behavior first, and then the perspective of attitudes are explained afterwards.
2.1.1 Consumer Behavior
Consumer behavior is about how consumer exchanges their resources (money, time, effort) with
items. It includes what product that consumers purchase, why they purchase it, where they buy
the product, how often they buy and use it. Consumer behavior is influenced by psychology,
sociological and economic factors. These three elements have affected to all of consumer
decisions process such as acquisition, consumption, disposition of goods, services, and activities
(Schiffman & Kanuk, 2000; Hoyer & Maclnnis, 2007). In the first stage, consumers can acquire
an offer by buying, trading, renting, bartering, gift giving and finding. In this stage consumer
evaluates the factors that influence their acquisition. The second stage is about how consumer
uses the product or service. The third stage concerns how consumer gets rid of an offering they
previously acquired (Hoyer & Maclnnis, 2007).
In this study, authors would like to understand and investigate the consumer attitude towards
brand, price and product. In order to understand the consumer attitude, the process of making
decisions should be understood clearly. Then the impact of country of origin on consumer
attitude will be explained later.

6
2.1.2 The Process of Making Decision
o Problem recognition
The general process of making decision begins when customers have problem which need to be
solved. The problem occurs when customers have difference between idea state and actual state.
Idea state is the way customer would like to be or would like to feel. The actual state is the real
situation that customer has at the present time, for example; he needs a new cloth because his
cloth is too old (Hoyer & Maclnnis, 2007, p. 195). Moreover, need of recognition can be
influenced by Environmental influences and Individual differences. Environmental influences
consist of culture, social class, personal influences, family and situation. Individual differences
consist of customer resources, motivation, knowledge, attitudes, personality, values and lifestyle
(Blackwell, Miniard & Engel, 2006, p. 71).
o Information search
After customers have problem and try to solve the problem, the next step is the internal search.
Internal search occurs when a customer searches the information from his/her memory, feeling
and the past experiences to find solutions for their problem. Moreover, if the solution cannot be
found, the customer will use external search. External search is the source that is relevant to the
problem of customer such as trusted friend, dealers, published sources, advertisement, and
product information (Hoyer & Maclnnis, 2007, p. 195).
o Pre-purchase Evaluation of alternatives
The customers use the information from internal and external to evaluate the alternatives.
Customers compare what they know about different products and brands that are the most
important to them before they make a decision. Different persons have different evaluation
criteria, so customers’ evaluation of their choices is influenced by both individual and
environment (Blackwell, Miniard & Engel, 2006, p. 80).

7
o Purchase decision
Customers evaluate what kind of product or service they would like to buy. Customers move
through two phases. The first phase, customers select where they are going to buy such as
retailer, catalogs, internet, or direct sale. The second phase involves decision in stores, influenced
by sale persons, product displays, electronic media, and point-of-purchase. Therefore, sometime
customers plan or intend to buy particular product or brand but purchase another thing that
different from the product that they intended to buy (Blackwell, Miniard & Engel, 2006, p. 81).
o Post purchase behavior
Customers evaluate the product or service from their satisfaction or dissatisfaction. Satisfaction
occurs when customers’ expectations are matched with perceived performance. Dissatisfaction
occurs when customers’ expectations are higher than the perceived performance. The outcomes
are important because the customers are going to keep the evaluation in their memory. This
impacts their future decisions (Blackwell, Miniard & Engel, 2006, p. 84).
2.1.3 What is Attitude?
Attitude is about the evaluation of experience and learned predisposition. It leads customer to
like or dislike the objective. The word “objective” in customer-oriented is defined as
consumption and marketing related concept such as brand, price, product and so on (Schiffman
& Kanuk, 2000). The attitude has affected on the overall evaluation of something that are
relevant to the set of associations linked to it. For example; attitude toward brand, product
categories, advertise and so on (Hoyer & Maclnnis, 2007). Moreover, attitudes can also influence
customer’s purchasing (Blackwell, Miniard & Engel, 2006). The attitude is important because it
guides customer thoughts, influences customer feeling, and affects customer behaviors.
Customers decide which TV advertising to see, where to buy the product, where the restaurant to
eat, based on their attitudes (Hoyer & Maclnnis, 2007).
The attitude formation suggests that attitude is based on cognitions or belief. It means that
attitudes depend on thought, by receiving information from the external sources such as

8
advertising salespeople, internet, trusted friends, price, or country of origin, and also the past
experiences (Hoyer & Maclnnis, 2007).
The objective of this study is to see how the matter of country of origin could have effects on
attitude towards product, price, and brand. In order to understand it clearly, the authors would
like to explain concepts of product, brand and price.
o Product
Product is anything that can be offered to the market to gain attention for acquisition by using or
consumption from customers. Product can satisfy requirement and need of customer. Product
includes both tangible and intangible goods (Kotler, 2008, p. 218). It is beneficial that customer
receives and yields customer satisfaction. “These include where it’s from, taste, color, odor, and
texture” (Cateora & Graham, 2006, p. 343).
o Brand
Brand is a name, term, sign, symbol, design, or a combination of these. Brand identifies product
and service to be different from the other competitors in the customer’s mind. Branding helps
customer in many ways, for example, the name of a brand helps customer to be able to identify
the product, and branding can refer to product quality as well (Kotler, 2008, p. 225).
o Price
Price is amount of money which customer exchanges to get product or service. More broadly,
price is the sum of all the value that customer exchange for the benefit of product or service that
stratify their need (Kotler, 2008, p. 284).
2.1.4 Country of Origin (COO)
The country of origin of product has been defined as “The impact which generalizations and
perceptions about a country have on a person’s evaluations of the country’s products or/and
brands” (Lampert & Jaffe, 1998). According to Bilkey and Nes (1982) also have defined the
COO of product as “Made in (name of country)” and COO has an effect on consumer product

9
evaluation. Ahmed et al. (2004) stated that customer judges any famous brand products related to
the discriminative countries, although that product was not produced in the brand’s original
country. For example, brands that are considered as Japanese include Toshiba, Sony, Honda and
Toyota. All of these brands have their own manufacturing plants which are not only in Japan but
also in other countries. It means that country of origin of the brand and manufacturing may not
be always the same countries. The study of Iyer & Kalita (1997) shows that the country of origin
of the brand (COB) and country origin of manufacture (COM) play an important role in
customer evaluation of product quality, product value and willingness-to-buy. COB is defined as
the countries that originally produce and create the product or brand (Phau & Prendergast, 2000).
COM is defined as the country of manufacture or assembly that produces the product in term of
“made in” (Cateora & Graham, 2006).
2.1.5 The Effects of Country Image
According to Cateora and Graham (2006), the country of origin can affect the image of brand
and product essentially. Country image refers to pictures, reputation, and stereotype that
businessmen and consumers attach to products from one particular country. The image can be
created by variables such as representative products, characteristics of nations, economic and
political background, history, as well as traditions (Nagashima, 1970). The similar definition of
country image is defined by Roth and Romeo (1992), as the customer’s perception about product
that come from specific country, which is found in their antecedent perception of that country’s
production and marketing strengths and weaknesses.
According to Johansson et al. (1985), the image of country can act as the “halo effect”. It has
been considered that customer judges the quality of product based on his or her stereotyped
beliefs about COO (Erickson et al., 1984). Halo effect has directly affects customer’s belief
about products when they are not familiar with the country of that product. And halo also
indirectly affects evaluation process by passing on these beliefs. This can trigger customer’s
feeling about the product in negative or positive ways (Johansson et al., 1985). Furthermore,
there is a summary shows that it has direct effect on customer’s attitudes towards the brand when
they are familiar with the country of that product (Han, 1989; Ahmed et al., 2004).

10
2.1.6 Product Evaluation of Country of Origin
According to Bilkey and Nes (1982), country of origin can truly make an impact on customer’s
product evaluation. Customer’s judgment of product quality are influenced by the systematic of
acquisition and integrating process, and evaluating for product information or cues (Ahmed et
al., 2004). The stereotype is a source of consumer product evaluation which it related to product
and the country of producing. It depends on different kinds of countries such as industrialized,
industrializing, and developed countries. The stereotyping affects customer perception on
product, for example, belief that the product has been produced in developed countries has better
effect than that produced in less developed or developing countries (Cateora & Graham, 2006, p.
364-365)
2.2 Conceptual Framework
The conceptual framework is to identify theories and clarify concepts that authors put it together.
It consists of how to link all concepts to each other. There are many types of relationship such as
cause and effect, stages in a process, hierarchical relationships, maps and coordinates, pairs of
opposites, exchange and equilibrium, similarity, and thing to watch out for (Fisher, 2007, p. 126-
132). The type of this framework is cause and effect of the independent (cause) variable, as the
arrow pointing towards the dependent variable (effect) (Fisher, 2007, p. 127).
According to our study based on the literature review, the authors created the model below that
shows the relationship between country of origin (independent variable) and attitude (dependent
variable). Authors would like to study the effect of country of origin that influences customers’
attitude towards brand, product and price.
Figure 2.1: Conceptual Framework (developed by the authors)
Country of
origin
Attitude
- Brand
- Product Quality
- Price

11
3. Method
This chapter will present method used in the research, describe the method used for conducting
the study, collecting choice of data, the process of select country and brand, and sampling.
3.1 Choices of Research Approach
It is important to choose the right method for researching because it will affect the relevant data
that are used for the research. According to Fisher (2007), the research method can be divided
into two types, namely, the qualitative research method and the quantitative research method.
3.1.1 Qualitative method
Qualitative method gains more problem details for study, with less structure than the quantitative
research, and also based on a small size of the sample (Malhotra, 2004, p.137). However it is not
appropriate to present the large-scale field studies (Aaker, Kumar & Day, 1995). Qualitative
research method is composed of in-depth interviews, focus groups, metaphor analysis, collage
research, and projective techniques. The researcher should have highly interviewer-analyst to
effectively analyze the finding (Schiffman & Kanuk, 2000, p.15).
3.1.2 Quantitative method
Quantitative method seeks to quantify and measure the data by using statistical analysis from the
sample of the population of interest. Quantitative method is more structured than the qualitative
and hence it is appropriate to present the large numbers of representative cases (Malhotra, 2004,
p.137) (Kotler 2008, p.284). The researchers use the quantitative research to understand the
variable effect of the customer, and to predict customer behaviors (Schiffman & Kanuk, 2000,
p.15).

12
According to the purpose and the research question of this study, it is appropriate to choose the
quantitative method because this study is presented in the large number of representative’s case.
Moreover, it is appropriate to measure attitude of Thai customer.
3.2 Choices of Data Collection
3.2.1 Primary data
Primary data is data that researcher generates for using in particular purpose by surveys,
interview and direct observations (Malhotra, 2004, p.103). The advantage of this collection is it
can solve problems at hand. The collection process requires the step of marketing research.
However, it provides some disadvantage such as high cost of collection and it takes long time to
obtain primary data (Malhotra, 2004, p.103).
Survey Method is derived by conducting the questionnaires and analyzing
quantitatively. It has many formats. Firstly, pre-coded questions have a lot of choices that
the respondent can tick in boxes to answer the question, such as dichotomous questions,
multiple choice questions, rating scales, and ranking questions. Secondly, open question
provides space for the respondents to write their own words (Fisher, 2007, p.193-198).
Interview Method is consisted of personal interview, telephone interview, and email
interview. Moreover, interview methods can be separated in three categories.
o Open interview, the interviewer engages in conversation with the respondent in the
area of interest. The interviewee leads the direction of interview (Fisher, 2007, p.159)
o Pre-coded interviews, it is controlled by the interviewer, who has prepared the
questions and script before conducting the interview. The questions are organized into
a logical sequence (Fisher, 2007, p.159).
o Semi-structured interview is the combination between open interview and pre-code
interview. The interviewer prepares scripts of the topic. However, the interviewer
needs to cover by the respondent and respondent feel free to answer the question that
they want (Fisher, 2007, p.159).

13
Observation method is to observe behaviors of people. There are four types of this
method.
o Unstructured observation is done when the researcher sits, watches and listens in
order to understand the behavior of respondent (Fisher, 2007, p.161).
o Semi-structured is done when the researcher uses checklists to observe the behavior
of the respondent (Fisher, 2007, p.162).
o Structured approach, several categories are used in the observation process to
understand the behavior of respondent (Fisher, 2007, p.163).
o Very highly structured: This technique uses activities to understand the behavior of
the respondent. It is the opposite side from the unstructured observation (Fisher,
2007, p.164).
3.2.1.1 Select Primary data method
According to the purpose and research question of this study, it is appropriate to use the survey
method to collect data and answer the purpose. For this research, the authors used questionnaires
that consisted of pre-code and open formats in order to understand the attitude of the
respondents. The process, which includes selection of the countries, brands, targets and sample
size of respondent, is shown as following;
I. The Process of Select Country and Brand
Brands of the chocolate selected are Hershey, Cadbury and Lindt. Due to the fact that all of those
brands are selling in supermarkets and retail stores in Thailand, and all of them come from
different countries. Hershey comes from USA (Hershey, 2010), Cadbury comes from England
(Cadbury, 2010), and Lindt comes from Switzerland (Lindt, 2010). The manufacture’s countries
are including China, Belgium and USA. China is developing country which has not strong
positive image of producing product for Thai customers, while Belgium and USA are developed
countries which have stronger positive image of producing product for Thai customers.

14
II. Sampling
The purpose of sampling is to select a group of respondent and representative of the whole
population to answer questionnaires, without having trouble by asking everyone. The
appropriated sample size for the research depends on the population size and the margin of the
error that researcher can accept. For example, if the population is 1000 people and the acceptable
margin of error is +/- 5, so the sample size should be 278 people (Fisher, 2007, p.189). The
whole population of Thai people is 63 million (Department of strategic & evaluation Thailand,
2008). The authors accept the margin of error at +/-5, due to the limited time and resource.
Therefore, the authors had set sample size at 384 respondents. However, 450 questionnaires were
distributed to the target respondents, to be sure that 384 questionnaires will return on time.
Figure 3.1: Estimating margin of error on sample survey results (Fisher, 2007, p.190).

15
III. Sampling frame
For this research, the target group of this study is Thai chocolate customers. The data collection
was completed from April 30th
to May 11th
2010, by using online questionnaire. Since the
authors are currently studying in Sweden, the questionnaires were distributed by posting on the
website and e-mailing to Thai respondents.
First question from the questionnaire asked whether the respondent has ever bought chocolate or
not. If the answer was “yes”, then respondent will go on to complete all the rest questions. 422
questionnaires were return. 8 questionnaires answered “no” in the first question, and 3
uncompleted responses. Therefore, 411 questionnaires were valid for the data analysis.
IV. Sample Technique
Sample techniques are methods of distributing questionnaires to target samples. In general, there
are two types of sampling techniques, which are probability and non-probability sampling
techniques. Regarding to probability sample technique, it is the process that does not use the
opportunity in target selection procedure. The author can fix the specific of respondent under the
research objective criteria. The second one is Non-probability sampling technique which the
procedure of each respondent in specific group of respondent under the research objective
(Mcburney & Middleton, 1994).
According to this research, the authors applied Non-probability sampling as significant method.
Moreover, Snowball technique was specified as common strategy in conducting process. This
type of sampling technique represents the un-equity chance of all population being chosen. Only
samples that are suitable for this research would be selected as target respondent (Malhotra et al.,
1999). In additional of Snowball technique, the first group of target sample will be selected by
the authors and asked them to choose the same characteristic in continuing participation. In
distribution of this survey, the authors will select the group of sample who preferred chocolate
product as snack. This behavior will influence them to join the survey and response the effective
result of study. After that they will be asked to send the questionnaire to their friend or others in
participation

16
V. Questionnaire design
At this research study, the authors have selected survey method as main technique for data
collection. This method will be applied as primary source of data collection and specify the
appropriate method of research instrument. According to this research topic, the author has
designed quantitative questionnaire survey as research instrument. The appropriate quantitative
instrument will be selected as questionnaire survey. The questionnaire has many benefits in term
of structural procedure cost and time saving. However, the disadvantage is also important as
lacking of theory, because there is no scientific principle that guarantees the ideal questionnaire
(Malhotra et al., 1999). Furthermore, the questions must be designed qualitatively and
quantitatively with the aims of supporting data measurement and scaling. The measurement
scaling can be used with different purposed under following purposed.
Scale Measurement Basic Characteristic
Nominal Number identified and Classified objective.
Ordinal Number that indicate the relative positions but not the
magnitude of differences between them.
Interval Different between objects can be compared; zero is
arbitrary.
Ratio Zero point is fixed; ratio of scale value can be computed.
Table 3.1: The characteristic of scale measurement(Malthora, 1999, p.249).
According to this research, the authors have designed the questionnaire survey by using various
scale of measurement based on characteristic of questions. At the first part of questionnaire
“Introduction”, the authors have designed questions in order to know attitudes and behaviors
toward chocolate. The questions are consisted of dichotomous question, multiple choices and
open-ended question. All these are used the nominal and ordinal scales in collecting data.
As the second and third parts, the questions are designed in order to examine concept of country
of origin effect to attitudes toward chocolate. In second part, it is focused on first element of

17
country of origin as manufacturing based country while third part is focused on country of brand
origin. All questions are designed by using the interval scale in measurement.
Finally of questionnaire designed, this aimed to identify target sample of this study. The
questions are scoped to personal information as demographic data and use the dichotomous and
multiple-choice question for measurement scaling.
3.2.2 Secondary data
Secondary data provide some advantages to authors. It is easy and inexpensive to access the data,
and the data is ready to use. However, secondary data have some disadvantages when the
secondary data was collected for other purpose, it may not be directly suitable or usable to the
current problem of research (Malhotra, 2004, p.103).
In this research authors used secondary data in the part of theory and process of doing research,
however, this is not related directly to the research problem. Secondary data used in this research
includes online articles from Emerald data base, and the books such as “International marketing”
by Cateora & Graham, and “Country of origins effects on Product evaluation” by Bilkey.
Moreover, in this research, the book “Researching and Writing a Dissertation: A Guidebook for
Business Students” by Fisher (2007) is used as a guideline to writing a thesis.
3.3 Reliability
Reliability in quantitative research depends on the possibility of replication. It means that if the
same method with same sample is used, so the results should be the same. In qualitative
reliability, it can be regarded as an adequate between what researcher recorded as data and what
actually occurs in the natural setting that is being researched (Cohen, Manion & Morrison,
2000).
For this research the authors used questionnaire method as the primary data, which are
quantitative. In order to get the reliable result, authors distributed 450 questionnaires and 422

18
were return. Authors did not use 13 questionnaires that are not valid for the data analysis.
Therefore, 411 questionnaires were suitable for the data analysis, and according to those 411
questionnaires it could represent the whole population of Thai chocolate’s customer. Thus it can
contribute reliability to the result. For the secondary data, authors used academic journals, text
book and data from the internet that related to the research. Authors also searched a lot of
literatures, studying former researches in similar area to increase reliability of research.
3.4 Validity
Validity is an important key to effective research and it requires both quantitative and qualitative
research. In qualitative data, validity depends on the honesty, depth, richness and scope of the
data achieved, as well as the participants approached, the extent of triangulation and the
disinterestedness or objectivity of the researcher. In quantitative, the validity can be improved
through careful sampling, appropriate instrumentation and appropriate statistical treatments of
the data (Cohen, Manion & Morrison, 2000).
In this research, authors selected theoretical concepts relevant to our purpose from academic
journals. The method that authors used is questionnaire that is appropriate to measure the attitude
of customer, and questions in the questionnaire are related to those conceptual framework.
Moreover, authors used the SPSS program that is an appropriate statistic tool to measure the
data.
3.5 Develop analysis method and interpret the data collected
According to this process of data analysis and interpretation, there are two main steps;
1.) Data preparation
2.) Data analysis.
For data preparation, all data collected form questionnaire survey will be edited, coded, with
transcription and verification. Gilbert A. Churchill Jr. and Dawn Iacobucci (2002) stated that all
data collection must be edited or corrected as a significant source on data analysis. The authors
have to prepare this before the coding procedure. After that, Data analysis would be developed as

19
significant method. This procedure will be analyzed through specific software as Statistical
Package for Social Science (SPSS). This program can help the authors to summarize all data as
numeric information. After the numeric information is done, the authors have to interpret it with
significant meaning related to the research objectives. In additional, all data analysis will be
interpreted by descriptive statistic method. The method describes all sample’s characteristics,
experience behavior and insight attitudes.

20
4. Research Findings and Data Analysis
In this section, all data collected from questionnaire survey will be re-coded in order to record
and correct any errors from collection process. After all data are available, it would be coded in
specific research program as SPSS and explore all relevant data findings related to the research
objectives. Refers to chapter 1, the main purpose of this topic is to focus on an impact of country
origin towards attitude of buying chocolate. Based on this data analysis, three parts will be
investigated, buying attitudes & behavior. All these parts are demonstrated in details as follow.
4.1 - The Analysis of Respondent’s Demographic Data and Experience in Consumption
According to the first part of the research analysis, the authors aimed to study customer
consumption behavior. All data collected will be analyzed as the buying attitudes and behaviors
toward chocolate purchase. All relevant data analysis can be analyzed as following.
4.1.1 Brand Recognition Ranking
In this part, the authors have to investigate the most familiar brand from respondent’s perception.
This is aimed to know the brand that has more awareness level towards targeted customer. The
result is illustrated in the following table.

21
When talking about chocolate, which brand comes first to your mind?
136 33.1 33.1 33.1
84 20.4 20.4 53.5
38 9.2 9.2 62.8
31 7.5 7.5 70.3
28 6.8 6.8 77.1
20 4.9 4.9 82.0
12 2.9 2.9 84.9
10 2.4 2.4 87.3
5 1.2 1.2 88.6
5 1.2 1.2 89.8
4 1.0 1.0 90.8
4 1.0 1.0 91.7
3 .7 .7 92.5
3 .7 .7 93.2
3 .7 .7 93.9
3 .7 .7 94.6
2 .5 .5 95.1
2 .5 .5 95.6
1 .2 .2 95.9
1 .2 .2 96.1
1 .2 .2 96.4
1 .2 .2 96.6
1 .2 .2 96.8
1 .2 .2 97.1
1 .2 .2 97.3
1 .2 .2 97.6
1 .2 .2 97.8
1 .2 .2 98.1
1 .2 .2 98.3
1 .2 .2 98.5
1 .2 .2 98.8
1 .2 .2 99.0
1 .2 .2 99.3
1 .2 .2 99.5
1 .2 .2 99.8
1 .2 .2 100.0
411 100.0 100.0
Fererro
Hershey
Kit Kat
M&M
Lindt
Toblerone
Royce
Godiva
Cadbury
Van Housten
Almond
Glico
Alfie
Mars
Milo
Nestle
Oreo
Snicker
Chocobaby (Meiji)
Doste
Dove
Euroshopper
Fazer
Frozen Haute Chocol
Guylian
Hamlet
Home made
Kisses
Marabou
Meiji
Nutella
S&P
SDFA
Thedera
Thornton
Timtam
Total
Valid
Frequency Percent Valid Percent
Cumulative
Percent
Table 4.1: Brand Recognition
As of the data ranking, Ferrero Rocher is the most familiar brand, which is perceived as first
place by 33% of all respondents. The second rank is Hershey with frequency rate of 20%
approximately. For the third one (low familiarity), there are three brands perceived in similar
level (5 – 10 percent), they are Kit-Kat, M&M and Lindt. Finally, the least familiar brands, with
the rate of familiarity is not higher than 5 percent, are Toblerone, Royce, Godiva and so on.

22
On the other hand, this result can be concluded that Thai customers recognize Ferrero Rocher
and Hershey more than other brands. Both brands have positive image in terms of quality, brand
and other marketing factors.
4.1.2 Frequently Brand Purchased
For the next study, the research had been explored the brand which is often purchased by Thai
customers. Regarding to this question, the authors investigated the brands which are often
bought. The result is illustrated in the following table;

23
What is the one chocolate brand you buy most frequently?
99 24.1 24.1 24.1
75 18.2 18.2 42.3
37 9.0 9.0 51.3
35 8.5 8.5 59.9
28 6.8 6.8 66.7
19 4.6 4.6 71.3
18 4.4 4.4 75.7
11 2.7 2.7 78.3
9 2.2 2.2 80.5
6 1.5 1.5 82.0
6 1.5 1.5 83.5
5 1.2 1.2 84.7
5 1.2 1.2 85.9
5 1.2 1.2 87.1
5 1.2 1.2 88.3
5 1.2 1.2 89.5
5 1.2 1.2 90.8
4 1.0 1.0 91.7
3 .7 .7 92.5
3 .7 .7 93.2
2 .5 .5 93.7
2 .5 .5 94.2
1 .2 .2 94.4
1 .2 .2 94.6
1 .2 .2 94.9
1 .2 .2 95.1
1 .2 .2 95.4
1 .2 .2 95.6
1 .2 .2 95.9
1 .2 .2 96.1
1 .2 .2 96.4
1 .2 .2 96.6
1 .2 .2 96.8
1 .2 .2 97.1
1 .2 .2 97.3
1 .2 .2 97.6
1 .2 .2 97.8
1 .2 .2 98.1
1 .2 .2 98.3
1 .2 .2 98.5
1 .2 .2 98.8
1 .2 .2 99.0
1 .2 .2 99.3
1 .2 .2 99.5
1 .2 .2 99.8
1 .2 .2 100.0
411 100.0 100.0
Fererro
Hershey
None
Kit Kat
M&M
Lindt
Toblerone
Milo
Glico
Meiji
Van Housten
Alfie
Cadbury
Mars
Nestle
Royce
Twix
Oreo
Almond
Pockey
Godiva
Snicker
Buenos
Cadberry
California
Chocobaby (Meiji)
Doste
Euroshopper
Ghirardeli
Hamlet
Ikea
Kinder
Kisses
Klex
Maltesers
Marabou
Marchmelo
Moronaga
none
Nutella
Rausch
SDFA
Thedera
Thornton
Timtam
Tinny
Total
Valid
Frequency Percent Valid Percent
Cumulative
Percent
Table 4.2: Frequently Brand Purchased

24
As the same result of the brand familiarity, Ferrero Rocher is ranked in top level, with frequency
rate of 24%. Then it follows by Hershey at 18%. While Kit-Kat and M&M are classified in third
level, with the rate between 5 – 10 percent. On the other hand, this result can be concluded that
Thai customers have good experiences with Ferrero Rocher and Hershey. Both brands are
continually purchased and become loyalty brand for Thai customers.
Regarding to last two questions, the authors have concentrated on country of origin model. As of
literature study, country of origin model is consisted of two types; manufacturing and brand of
origin. In order to know the significant aspects of these components, the authors asked all
respondents about their concern of country of origin factor before buying chocolate.
4.1.3 Country of manufacturing
When you buying chocolate, you look for production country
119 29.0 29.0 29.0
81 19.7 19.7 48.7
76 18.5 18.5 67.2
76 18.5 18.5 85.6
59 14.4 14.4 100.0
411 100.0 100.0
Sometime
Rarely
Never
Most of time
Always
Total
Valid
Frequency Percent Valid Percent
Cumulative
Percent
Table 4.3: Country of manufacturing
In term of the country of manufacturing, the finding showed that most of target respondents, 29
percent, have perceived the effect of country of manufacturing at moderate level (Sometime). On
the other hand, the country of manufacturing is occasionally determined as element of decision
making. Moreover, in the ranking of other levels, which are rarely, never, and most of the time
are also indicated by around 19 percent of the customers. But the level of always is counted for
only 14 percent. It means that most of the target sample did not look for the country of
manufacturing when they buying chocolate.

25
4.1.4 Country of the brand
When you buying chocolate, you look for where's the brand come from
119 29.0 29.0 29.0
103 25.1 25.1 54.0
80 19.5 19.5 73.5
73 17.8 17.8 91.2
36 8.8 8.8 100.0
411 100.0 100.0
Sometime
Rarely
Most of time
Never
Always
Total
Valid
Frequency Percent Valid Percent
Cumulative
Percent
Table 4.4: Country of the brand
In term of brand origin, that is mainly referred to brand image of chocolate. However, the result
is also illustrated with the same result from manufacturing of origin factor. Most of the target
sample does not perceive this factor as main factor in decision making. There are 29 percents of
target sample who concerned on brand origin occasionally, while 25 percents rarely adopt it in
their purchase decision. In contrast, there are only 9 percent who always use this factor in
decision process.
Although, the above finding represents the unnecessary of country of the brand and country of
manufacturing, there are some different in result of the study. Some of respondents also concern
both variables in their decision process. In the next step of this study, the authors have to
investigate the respondent’s attitude towards country of origin of chocolate.
The country of origin is consisted of two significant elements, which are images from country of
the brand and country of the manufacturing. In this research, both elements would be necessary
points of study, which will be examined through customer’s attitude. Moreover, the authors also
compare respondent’s different attitudes towards country of the brand and country of the
manufacturing. In terms of country of the brand, there are three countries which were selected as
the famous countries for chocolate. These are England, Switzerland and USA. In term of
manufacturing country, there are also three countries; China, Belgium and USA. Finally, the
brand images, there are three target brand names of chocolate in this study; Hershey, Cadbury

26
and Lindt. Regarding to the research purpose, all three elements will be analyzed independently
in the following sections.
4.1.5 Comparison of the Origin Brand Country
At this aim, the authors have examined customer’s attitude towards three countries of the brands,
which are England, Switzerland and USA. The result of descriptive means is represented in the
following table.
Descriptive Statistics
411 1 5 3.73 .695
411 1 5 4.28 .745
411 1 5 3.57 .706
411
chocolate product
from England
chocolate product
from Switzerland
chocolate product
from US
Valid N (listwise)
N Minimum Max imum Mean Std. Dev iation
Table 4.5: Comparison of the Origin Brand Country
In comparison of all three countries of the brands, the chocolate brand from Switzerland gains
the highest level of customer perception. The mean score of Switzerland is indicated by 4.28,
which are meant as very good and very positive image. On the other hand, it can be concluded
that customers always perceive chocolate brand from Switzerland with positive attitude. The
second country is England, which is illustrated the mean score of 3.73. While the USA is
perceived by 3.57 of mean score. Although the last two countries have significantly less mean
score than Switzerland, but the scores of England and the USA are still positive. This can be
concluded that people also believe in brand from both countries as good image.

27
4.1.6 Comparison of the Production Country
In term of production country, there are three countries involved; China, Belgium and USA. In
comparison of these countries, the result can be illustrated in the following table.
Descriptive Statistics
411 1 5 2.19 .836
411 2 5 4.03 .766
411 1 5 3.63 .670
411
Chocolate
produced from
China
Chocolate
produced from
Belgium
Chocolate
produced from US
Valid N (listwise)
N Minimum Max imum Mean Std. Dev iation
Table 4.6: Comparison of the Production Country
Due to the above information, the result shows that chocolate produced in Belgium is ranked
with the highest score of 4.03. People have very good image about Belgium, as a chocolate
production country. For the second country, it is USA, with 3.63 mean score. The score is quite
good, thus USA is also classified as a good country in producing chocolate. Finally, China, the
result is different. Because the mean score of respondent’s attitude towards China is 2.19, that is
ranked in negative level. This means that most of people do not believe in chocolate produced
from China.
Finally of this part, the authors have classified three necessary brands of chocolate in order to
study respondent’s perception. These brands are consisted of Hershey, Cadbury and Lindt. The
result of data analysis can be illustrated as following table.

28
Descriptive Statistics
411 1 5 4.03 .747
411 1 5 3.55 .728
411 1 5 3.81 .838
411
How would you rate the
chocolate brand Hershey
How would you rate the
chocolate brand Catbury
How would you rate the
chocolate brand Lindt
Valid N (listwise)
N Minimum Max imum Mean Std. Dev iation
Table 4.7: Comparison of chocolate brand
According to the above analysis, the result illustrated that all brands are perceived in positive
values. Especially Hershey, this brand is perceived by highest score at 4.03. It means that
Hershey has strong position in this market. Most respondents believe in this brand rather than
other brands. For the other brands (Lindt and Cadbury), the products are also perceived in
positive level, which has strong position in this market.
However, the above findings are only the wide study of country of origin towards chocolate
products. In the main study purpose, the country image will be promoted through some
marketing factors. In this research topic, there are three main marketing factors which are
indicated in all studies, namely Taste, Brand Image and Price. All factors are developed in this
study and be related with two elements of country of origin (country of the brand, and country of
manufacturing).The study will be developed based on customer perception in the following part;
Part 4.2 - The Analysis of Specific Brand Perception regarding Country of Origin
According to this section, the authors have to investigate the respondent’s attitude toward
country of origin of chocolate. All factors will be studied in depth with each marketing factors
that are introduced in above paragraph.
Initially of this section, all marketing variables are examined with each brand (Hershey, Cadbury
and Lindt) that produced from different countries (China, Belgium and USA). This can help the
authors to know the different values of production country through each brand name.

29
4.2.1 Hershey
First of all, the authors have examined the brand Hershey which is represented as highly
familiarity by target respondents. Regarding to Hershey’s chocolate, it must be accepted that this
brand are produced in many production countries. In this research, the study will focus on three
countries, which are Belgium, USA and China. The results can be demonstrated in following
sections.
I. Taste
Descriptive Statistics
411 1 5 3.93 .702
411 1 5 3.76 .668
411 1 5 2.91 .812
411
Hershey chocolate bar
produced in Belgium -
taste
Hershey chocolate bar
produced in US - taste
Hershey chocolate bar
produced in China - taste
Valid N (listwise)
N Minimum Maximum Mean Std. Dev iation
Table 4.8: Country of manufacturing effect to the taste of Hershey chocolate
In term of taste, the result illustrated that Hershey produced in Belgium has more positive value,
with 3.93 mean score, and follow by USA with 3.76. Both countries have positive image in
developing taste of chocolate flavor. While Hershey produced in China is determined by the
mean score of 2.91, which is positioned in negative level. This means that product from China
has low quality of taste rather than other two countries.

30
II. Brand Image
Descriptive Statistics
411 2 5 3.99 .705
411 1 5 3.82 .687
411 1 5 2.87 .869
411
Hershey chocolate bar
produced in Belgium -
brand image
Hershey chocolate bar
produced in US -
brand image
Hershey chocolate bar
produced in China -
brand image
Valid N (listwise)
N Minimum Max imum Mean Std. Dev iation
Table 4.9: Country of manufacturing effect to the brand image of Hershey chocolate
In term of brand image, Hershey from Belgium and USA are perceived as positive perception.
The mean scores are 3.99 and 3.82 respectively. Both countries have good image in producing
Hershey chocolate to target customers. While, product from China is not the same, Hershey from
China is perceived as negative response with 2.87 mean score. On the other hand, most
respondents believed that brand image of Hershey from China is not good.
III. Price
Descriptive Statistics
411 1 5 3.70 .691
411 1 5 3.52 .753
411 1 5 2.84 .768
411
Hershey chocolate bar
produced in US - price
Hershey chocolate bar
produced in Belgium-
price
Hershey chocolate bar
produced in China - price
Valid N (listwise)
N Minimum Maximum Mean Std. Dev iation
Table 4.10: Country of manufacturing effect to the price of Hershey chocolate
In term of price perception, the result is also the same positive image as two above marketing
factors, but Hershey from USA have better image than Belgium. The mean score are 3.70 and

31
3.52 respectively. However, product from China is still perceived by negative response as 2.84
mean score. Most respondents believed that brand image of Hershey from China are not good.
As of above analysis of Hershey brand name, respondents have perceived Hershey’s chocolate
which is made from Belgium to be the best in taste and brand image. As while, the price of USA
production is most accepted. However, Hershey from China is seen as negative perception in all
marketing factor.
This is directly connected with the analysis of first part in comparison between three countries of
production as Belgium, USA and China. At that part, respondents perceived any chocolate
product from Belgium and USA in positive level and China production will be perceived the
negative value.
4.2.2 Cadbury
Secondly of Cadbury’s chocolate, the results are demonstrated by same characteristic and
demonstrated in following table;
I. Taste
Descriptive Statistics
411 1 5 3.71 .717
411 1 5 3.68 .715
411 1 5 2.80 .870
411
Cadbury chocolate bar
produced in Belgium -
taste
Cadbury chocolate bar
produced in US - taste
Cadbury chocolate bar
produced in China - taste
Valid N (listwise)
N Minimum Maximum Mean Std. Dev iation
Table 4.11: Country of manufacturing effect to the taste of Cadbury chocolate
In term of taste, the result illustrated that Cadbury which produce in Belgium have more positive
value with 3.71 mean score and follow by USA by 3.68. Both countries have more
standardization image in controlling taste of chocolate production. As while, the product from

32
China is determined the mean score by 2.80 that is positioned in negative level. This means that
product from china has low quality of taste rather than other countries.
II. Brand Image
Descriptive Statistics
411 1 5 3.76 .734
411 1 5 3.71 .723
411 1 5 2.79 .868
411
Cadbury chocolate bar
produced in Belgium -
brand image
Cadbury chocolate bar
produced in US -
brand image
Cadbury chocolate bar
produced in China -
brand image
Valid N (listwise)
N Minimum Max imum Mean Std. Dev iation
Table 4.12: Country of manufacturing effect to the brand image of Cadbury chocolate
In term of brand imaged, Cadbury from Belgium and USA are perceived by same positive level
as 3.7 approximately. Both countries have good better image in producing chocolate product
than other country as China. The product from China is perceived by negative mean as 2.79. In
the other hands, most respondents believed that brand image of Cadbury from China must be
improved for higher acceptable.
III. Price
Descriptive Statistics
411 1 5 3.64 .700
411 1 5 3.64 .711
411 1 5 2.81 .777
411
Cadbury chocolate bar
produced in US - price
Cadbury chocolate bar
produced in Belgium-
price
Cadbury chocolate bar
produced in China - price
Valid N (listwise)
N Minimum Maximum Mean Std. Dev iation
Table 4.13: Country of manufacturing effect to the price of Cadbury chocolate

33
In term of price perception, the result is also the same positive image as two above marketing
factors. Cadbury from USA and Belgium have been perceived by the same positive level. The
mean score are 3.64. However, product from China is still perceived by negative response as
2.81 mean score. Most respondents believed that brand image of Cadbury from China not good.
In concluding of Cadbury’s chocolate, produce from Belgium and USA are perceived at same
perception in all marketing variables as taste, brand image and price. For a while, the product
from China is also the same as other brand which staged in negative perception if all marketing
variables.
4.2.3 Lindt
Finally of Lindt’s chocolate, each factors and related results can be demonstrated in following
table
I. Taste
Descriptive Statistics
411 2 5 3.82 .758
411 1 5 3.71 .700
411 1 5 2.81 .911
411
Lindt chocolate bar
produced in Belgium -
taste
Lindt chocolate bar
produced in US - taste
Lindt chocolate bar
produced in China - taste
Valid N (listwise)
N Minimum Maximum Mean Std. Dev iation
Table 4.14: Country of manufacturing effect to the taste of Lindt chocolate
In term of taste, the result is illustrated that Lindt which produce in Belgium have most positive
value with 3.82 mean score and follow by USA at 3.71 mean score. Both countries have more
standardization image in controlling taste of chocolate production. As while, the product from
China is determined the mean score by 2.81 that is positioned in negative level. This means that
Lindt from china has low quality of taste rather than other countries.

34
II. Brand Image
Descriptive Statistics
410 2 5 3.91 .772
411 1 5 3.74 .733
410 1 5 2.77 .897
409
Lindt chocolate bar
produced in Belgium
- brand image
Lindt chocolate bar
produced in US -
brand image
Lindt chocolate bar
produced in China -
brand image
Valid N (listwise)
N Minimum Maximum Mean Std. Dev iation
Table 4.15: Country of manufacturing effect to the brand image of Lindt chocolate
In term of brand imaged, Lindt from Belgium has best positive level as 3.91 mean score and
following by Lindt from USA with 3.74 mean score. Both countries have good image in
producing chocolate product than China. The product from China is perceived by negative mean
as 2.77. In the other hands, most respondents believed that brand image of Lindt from China
must be improved for higher acceptable.
III. Price
Descriptive Statistics
411 1 5 3.75 .736
411 1 5 3.67 .695
411 1 5 2.82 .854
411
Lindt chocolate bar
produced in Belgium-
price
Lindt chocolate bar
produced in US - price
Lindt chocolate bar
produced in China - price
Valid N (listwise)
N Minimum Maximum Mean Std. Dev iation
Table 4.16: Country of manufacturing effect to the price of Lindt chocolate
In term of Lindt’s price perception, the result is also the same positive image as two above
marketing factors. Lindt from USA and Belgium have been perceived by the same positive level.
The mean score are 3.75 and 3.67 respectively. However, product from China is still perceived

35
by negative response as 2.82 mean score. Most respondents believed that brand image of Lindt
from China are not good.
According to all of this section, the results are illustrated that product from Belgium (Europe)
and USA will be perceived the image of all marketing variable by positive value but while, the
product from China is absolutely perceived by negative level. This can be related to the first
section that authors have compared the production quality of these countries. The result of that
section demonstrated that people do not believe any chocolate product from China. This can
conclude that production country have more impact the customer’s perception toward chocolate
flavor from different countries.
4.2.4 Country of the Brand
For the next section, the authors have focused on product from different branding country. The
country of brand will be classified by three countries; England, Switzerland, and USA. It must be
accepted that the country of brand is a significant element of country of origin. Thus, this
variable will be explored through three marketing variables, which are taste, brand image, and
price.
I. Taste
Descriptive Statistics
411 1 5 4.33 .683
411 1 5 3.95 .649
411 1 5 3.83 .670
411
Chocolate product from
Switzerland - taste
Chocolate product from
England - taste
Chocolate product from
US - taste
Valid N (listwise)
N Minimum Maximum Mean Std. Dev iation
Table 4.17: Attitude toward chocolate from country of the brand; in term of taste
In term of taste, the country of brand as Switzerland has the best image in this marketing
variable. The mean score is shown as 4.33, which is very high level. In this point of study, it can
36
be concluded that taste of chocolate from Switzerland is more delicious than other countries.
However, the taste of product form England and USA are not bad. The perceptual level is also
indicated by positive attitude as 3.95 and 3.83 respectively.
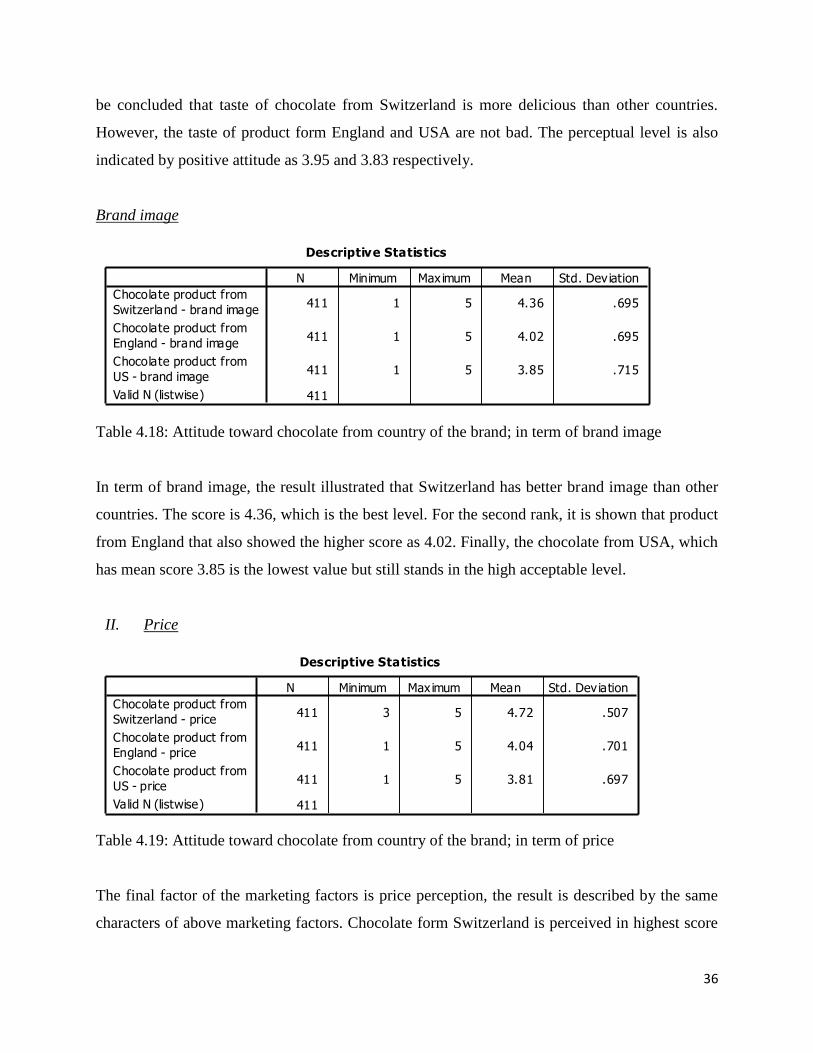
Brand image
Descriptive Statistics
411 1 5 4.36 .695
411 1 5 4.02 .695
411 1 5 3.85 .715
411
Chocolate product from
Switzerland - brand image
Chocolate product from
England - brand image
Chocolate product from
US - brand image
Valid N (listwise)
N Minimum Max imum Mean Std. Dev iation
Table 4.18: Attitude toward chocolate from country of the brand; in term of brand image
In term of brand image, the result illustrated that Switzerland has better brand image than other
countries. The score is 4.36, which is the best level. For the second rank, it is shown that product
from England that also showed the higher score as 4.02. Finally, the chocolate from USA, which
has mean score 3.85 is the lowest value but still stands in the high acceptable level.
II. Price
Descriptive Statistics
411 3 5 4.72 .507
411 1 5 4.04 .701
411 1 5 3.81 .697
411
Chocolate product from
Switzerland - price
Chocolate product from
England - price
Chocolate product from
US - price
Valid N (listwise)
N Minimum Maximum Mean Std. Dev iation
Table 4.19: Attitude toward chocolate from country of the brand; in term of price
The final factor of the marketing factors is price perception, the result is described by the same
characters of above marketing factors. Chocolate form Switzerland is perceived in highest score

37
as 4.72, and followed by England with score of 4.04. The product from USA is perceived in
lowest positive level as 3.81.
In concluding of this section, the result is also related to the comparison between three countries.
At that result, it was shown that chocolate from Switzerland is perceived in highest level. The
second is England and last as USA.
Based on the above research study, it can conclude that the country of manufacturing and brand
can be perceived in high positive level when people believe in product quality (taste), brand
image and price. All of these marketing factors are good impact variable which people use to
determine the product from different countries. In widely explanation of these variables, the
authors have added one more question that related to the marketing variable and country of
origin towards purchase decision making. In developing the questionnaire surveys, there are
seven variables which would be examined as taste, price, package, brand image, pack size,
manufacturing country and country of brand. The question aims to rank the necessary level of
each variable in buying decision. The result is shown in the following table;
Descriptive Statistics
411 2 5 4.25 .694
411 1 5 3.96 .631
411 1 5 3.85 .759
411 1 5 3.69 .689
411 1 5 3.62 .892
411 1 5 3.51 .859
411 1 5 3.42 .781
411
Taste
Pack size
Brand
Package
Manufacturing country
Country of the Brand
Price
Valid N (listwise)
N Minimum Max imum Mean Std. Dev iation
Table 4.20: Purchase decision
Regarding to the above finding table, the result illustrated that “taste” is the most significant
variable in buying chocolate. The mean score of taste is shown as 4.25, which is very strong
relationship. This can be proved that people are always interested in chocolate’s taste before they
make purchase. The second factor is pack size, with the mean value as 3.96. The brand is stated
in the third level at 3.85 mean score. However, all other variables are also indicated the positive

38
value at higher than 3.00. Thus, this can be concluded that all are the marketing criteria on
decision making for the chocolate product.
Part 4.3 – The comparison of customer perception among different demographic
information
In the final part of data analysis, the authors have explored customer’s perception among
different groups of demographic, such as gender, age, occupation and income level. This aims to
classify the main group of chocolate’s customer through above criteria. The data findings can be
illustrated as following sections.
4.3.1 The concentration of country of manufacturing in decision making
According to this factor, it is classified as significant element of country of origin. In data
analysis, the concern of production country is not the main factor in buying chocolate. However,
this is not same for different groups of customers. It is very necessary for the authors in
determining the result through four different sample’s characteristics as following table;
I. Gender
Group Statistics
158 2.71 1.313 .104
253 3.03 1.280 .080
Gender
Male
Female
When you buying
chocolate, you look for
country production
N Mean Std. Deviation
Std. Error
Mean
Table 4.21: Country of manufacturing – Gender
As of the above table finding, the result illustrated that not all customer perceived this variable in
negative level. The result is shown that female have more focused on production country than
male with mean score 3.03 and 2.71 respectively.

39
II. Age Range
Descriptives
When you buying chocolate, you look for country production
29 3.14 1.302 .242 2.64 3.63 1 5
352 2.87 1.290 .069 2.73 3.00 1 5
20 3.05 1.432 .320 2.38 3.72 1 5
8 3.00 1.512 .535 1.74 4.26 1 5
2 4.00 1.414 1.000 -8.71 16.71 3 5
411 2.91 1.300 .064 2.78 3.03 1 5
Less than 21 years old
21 - 30 years old
31 - 40 years old
41 - 50 years old
More than 50 years old
Total
N Mean Std. Deviation Std. Error Lower Bound Upper Bound
95% Confidence Interval for
Mean
Minimum Maximum
Table 4.22: Country of manufacturing – Age range
In term of age range and production country, all age range of sample focused on production
country in decision making, except the age between 21 – 30 years old. They showed the negative
mean score as 2.87. Especially to highest age level of 50 years old and above, the mean score is
absolutely positive as 3.00-4.00.
III. Occupation
Descriptives
When you buying chocolate, you look for country production
158 2.87 1.276 .101 2.67 3.07 1 5
44 2.93 1.453 .219 2.49 3.37 1 5
192 2.92 1.290 .093 2.74 3.11 1 5
9 3.11 1.764 .588 1.76 4.47 1 5
8 2.75 .707 .250 2.16 3.34 2 4
411 2.91 1.300 .064 2.78 3.03 1 5
Student
Owner/proprietor
Employee
Governor’s Employee
Retired
Total
N Mean Std. Deviation Std. Error Lower Bound Upper Bound
95% Confidence Interval for
Mean
Minimum Maximum
Table 4.23: Country of manufacturing – Occupation
In term of occupation, all occupation, except government’s employee, have rejected the
production country in buying decision. The mean score is shown in negative level at lower than
3.00. As while, the score of government’s employee is highest level at 3.11.

40
IV. Income Level
Descriptives
When you buying chocolate, you look for country production
157 2.84 1.248 .100 2.64 3.04 1 5
169 2.83 1.276 .098 2.64 3.03 1 5
58 3.28 1.335 .175 2.92 3.63 1 5
14 3.50 1.557 .416 2.60 4.40 1 5
13 2.31 1.437 .398 1.44 3.18 1 5
411 2.91 1.300 .064 2.78 3.03 1 5
Below 15,000 Baht
15,000-30,000 Baht
30,001-50,000 Baht
50,001-70,000 Baht
More than 70,000 Baht
Total
N Mean Std. Dev iation Std. Error Lower Bound Upper Bound
95% Confidence Interval for
Mean
Minimum Maximum
Table 4.24: Country of manufacturing – Income Level
There are two groups of income which concern the production country. They are people with
30,001 – 50,000 baht and 50,001 – 70,000 baht. The mean scores are indicated by 3.28 and 3.50
respectively.
From the above data analysis, group of the target customer who concern about promoting
production country of chocolate will be female who are aged in higher level and gain personal
income in higher level. However, the other group does not have the effect of country of
production. The scores are not absolutely bad. The mean value is also close to the middle score
of 3.00. Thus, production country can be used to promote through all customer groups, in order
to create market opportunities as well.
4.3.2 The concentration of country of the brand in decision making
The country of origin does not consist only production country but is also included the country of
brand. In order to achieve the research objective, the country of brand would also be examined
through demographic information

41
I. Gender
Group Statistics
158 2.59 1.222 .097
253 2.87 1.185 .075
Gender
Male
Female
When you buying
chocolate, you look
for where's the
brand come from
N Mean Std. Dev iation
Std. Error
Mean
Table 4.25: Country of the brand– Gender
Regarding to the country of the brand, both of male and female do not concern much on this
variable. The mean values are indicated in lower than 3.00 for both groups. However, female
tend to concern this factor rather than male.
II. Age Range
Descriptives
When you buying chocolate, you look for where's the brand come from
29 2.86 1.093 .203 2.45 3.28 1 5
352 2.74 1.201 .064 2.61 2.86 1 5
20 2.90 1.373 .307 2.26 3.54 1 5
8 2.88 1.458 .515 1.66 4.09 1 5
2 4.00 1.414 1.000 -8.71 16.71 3 5
411 2.76 1.206 .059 2.65 2.88 1 5
Less than 21 years old
21 - 30 years old
31 - 40 years old
41 - 50 years old
More than 50 years old
Total
N Mean Std. Deviation Std. Error Lower Bound Upper Bound
95% Confidence Interval for
Mean
Minimum Maximum
Table 4.26: Country of the brand– Age range
In term of age range, there is only one group of people who perceived the country of brand as
significant factor in decision making. That group is the people who aged as elderly. However,
other groups do not show the absolute rejection. The mean score is negative but quite good.

42
III. Occupation
Descriptives
When you buying chocolate, you look for where's the brand come from
158 2.85 1.194 .095 2.67 3.04 1 5
44 2.57 1.437 .217 2.13 3.01 1 5
192 2.75 1.171 .085 2.58 2.92 1 5
9 2.56 1.236 .412 1.61 3.51 1 5
8 2.63 .916 .324 1.86 3.39 1 4
411 2.76 1.206 .059 2.65 2.88 1 5
Student
Owner/proprietor
Employee
Governor’s Employee
Retired
Total
N Mean Std. Deviation Std. Error Lower Bound Upper Bound
95% Confidence Interval for
Mean
Minimum Maximum
Table 4.27: Country of the brand– Occupation
In term of occupation, the result illustrated that occupation does not concern the country of brand
in decision making. All occupations have perceived this factor in negative mean score. This
means that the occupation does not impact the customer decision making through country of the
brand.
IV. Income Level
Descriptives
When you buying chocolate, you look for where's the brand come from
157 2.67 1.134 .091 2.49 2.85 1 5
169 2.75 1.174 .090 2.57 2.93 1 5
58 3.10 1.238 .163 2.78 3.43 1 5
14 3.14 1.657 .443 2.19 4.10 1 5
13 2.15 1.463 .406 1.27 3.04 1 5
411 2.76 1.206 .059 2.65 2.88 1 5
Below 15,000 Baht
15,000-30,000 Baht
30,001-50,000 Baht
50,001-70,000 Baht
More than 70,000 Baht
Total
N Mean Std. Dev iation Std. Error Lower Bound Upper Bound
95% Confidence Interval for
Mean
Minimum Maximum
Table 4.28: Country of the brand– Income level
Regarding income level, the result is also same as production country. There are two groups of
income levels which perceived county of brand can impact the decision making. This is
consisted of group between 30,001 – 50,000 baht and 50,001 – 70,000 baht. Both groups
indicated the means score at same positive level as approximately 3.1.

43
In conclusion, this can be concluded that the country of origin can be promoted by focusing on
some criteria of demographic characteristics such as gender, age and monthly income. This can
help the marketer to gain high market opportunity in developing their chocolate product strategy.

44
5. Conclusion
5.1 The answer to the purpose of research
According to the purpose of the research; how the COO affects the attitude of Low involvement
product, which is chocolate in Thailand. COO including country of manufacturing and country
of the brand.
In term of country of manufacturing, Thai customer stereotype that china have bad image in term
of production. So it leads Thai customers to have negative attitudes toward chocolate produced
in China, which has low product quality and low price which give negative image to the brand.
However Thai customers stereotype that USA and Belgium as good countries in term of
production. So chocolate produced from the USA and Belgium gain positive attitude towards
product, price and brand.
In term of the country of the brand, Thai customer stereotype that Switzerland has very good
country image in term of brand of chocolate. So it leads Thai customer to have positive attitude
toward chocolate brand from Switzerland. Among the three countries investigated in this
research; USA, England, and Switzerland, Switzerland gained very strong positive attitude
towards product, price and brand.
However, the most important factor that affected Thai customer decision making when they
choose any chocolate is the taste of the chocolate, package and brand respectively. Moreover,
country of manufacturing and country the brand also have effect on purchase decision, but both
of them are not the important factors.
5.2 Reflection
According to questionnaires that we have done, the questions in the questionnaires were
supported by theories from academic journals. And all data collected from questionnaire will be
re-coded in order to record and correct any errors from collection process. After all data are

45
available, it would be coded in specific research program as SPSS and explore all relevant
findings related to the purpose.
5.3 Contribution to practice
The outcome of the research provides benefit to the marketers in the chocolate industry, to
understand customer’s attitude about country of origin. Since authors have done questionnaire,
the result is shown that country of origin have an effect on the attitude of Thai customers. The
market should identify the country of origin when they are going to promote the product such as
chocolate from Switzerland, which is the country with positive attitude. So marketers should add
this detail of positive country of origin to the advertising the products, or attach on the design of
package.
5.4 Suggestion for the further research
Low involvement product consists of many kinds of products. However, in this research authors
studied only chocolate. It could be a further study on the other products in low involvement such
as snakes and food.
Country of origin in this research study concern only 5 countries; China, Switzerland, USA,
England and Belgium, so more countries could be also investigated in further study.
In this research the area of study is Thailand, so the same topic could be studied in other
countries as well.
46
6. References
Aaker D., Kumar, V. & Day, G., 2007. Marketing Research. 5th
ed. John Wiley & Sons, Inc.
Ahmed, Z.U., 2002. Country-of-origin and brand effects on consumers’ evaluations of cruise
lines. International Marketing Review, 19(3), pp.279-302.
Ahmed, Z.U., Johnson, J.P., Yang, X., Chen K.F., Teng, H.S. & Boon, L.C., 2004. Does country
of origin matter for low-involvement products? International Marketing Review, 21(1),
pp.102-120.
Bilkey, W.J. & Nes, E., 1982. Country-of-origins effects on Product evaluations. Journal of
International Business Studies, 13, pp.89-100.
Blackwell, R.D., Miniard, P.W. & Engel, J.F., 2006. Consumer behavior. 10th
ed. Thomson
South-Western.
Cadbury, 2010. Our story. [Online] Available at
http://www.cadbury.co.uk/cadburyandchocolate/ourstory/Pages/ourstoryFlash.aspx#/1820_18
60/family/1801_john_cadbury_born [Accessed 14 May 2010]
Cateora, R. & Graham, L., 2006, International Marketing. 13th
ed. McGraw-Hill Irwin.
Churchill, G. & Lacobucci, D., 2002. Marketing research; methodological foundations. Mason:
Harcourt College Publishers.
Cohen, L. Manion, L. & Morrison, K., 2000. Research methods in education. 5th
ed. London:
Routhledgefalmer.
Department of strategic & evaluation Thailand, 2008. [Online] Available at

47
http://203.155.220.217/pipd/07Stat%28Th%29/Stat%28th%2951/00_index/index_2551.pdf
[Accessed 09 April, 2010]
Erickson, G.M., Johansson, J.K. & Chao, P., 1984. Image variables in multi-attribute product
evaluations: country-of-origin effects. The Journal of Consumer Research, 11(2), pp.694-699.
Fisher, C., 2007. Researching and Writing a Dissertation: A Guidebook for Business Students.
2nd
ed. Essex: Pearson Education Limited.
Han, C.M. & Terpstra, V., 1988. Country-of-origin effects for uni-national and bi-national
products. Journal of International Business Studies, 19(2), pp.235-255.
Hershey, 2010. The History of Hershey. [Online] Available at
http://www.thehersheycompany.com/about/history.asp [Accessed 14 May 2010]
Hoyer, W.D. & Maclnnis, D.J., 2001. Consumer Behavior. 4th
ed. Boston: Houghton Mifflin
Company.
Iyer, G.R. & Kalita, J.K., 1997. The impact of country-of-origin and country-of-manufacturer
cues on consumer perceptions of quality and value. Journal of Global Marketing, 11(1), pp.7-
28.
Johansson, J.K., Douglas, S.P. & Nonaka, I., 1985. Assessing the impact of country of origin on
product evaluations: a new methodological perspective. Journal of Marketing Research,
22(4), pp.388-396.
Kasikornresearh, 2010. Chocolate 2010 New Products Boosting Market. [Online] Available at
http://www.kasikornresearch.com/EN/K-
Econ%20Analysis/Pages/ViewSummary.aspx?docid=24771 [Accessed 01 May 2010]
Kotler, P., Armstrong, G., Wong, V. & Saunders, J., 2008. Principles of Marketing. 12th
ed.

48
Edinburgh: Prentice Hall.
Lampert, S.I. & Jaffe, E. D., 1998. A dynamic approach to country of origin effect. European
Journal of Marketing, 32(1/2), pp.61-78.
Lindt, 2010. The Lindt & Sprungli History. [Online] Available at
http://www.lindt.com/int/noswf/eng/company/history/ [Accessed 14 May 2010]
Malhotra, N.K. & Birks, D., 1999. Marketing Research: an application approach, 1st ed.
Harlow: Prentice Hall.
Malhotra, N.K., 2004. Marketing research: An applied orientation. New Jersey USA: Pearson
Education Inc.
Mcburney, D. & Middleton, P., 1994. Research method. 3rd
ed. California: Brooks/Cole
Company.
Ministry of Foreign Affairs, 2005. Share of Aid to Low-Income Neighbors Kingdom tops Region
for Lowest Tariffs to Poorest Countries [Online] Available at
www.mfa.go.th/web/1613.php?id=14021 [Accessed 06 April 2010].
Nagashima, A., 1970. A Comparison of Japanese and US Attitudes towards Foreign Products.
Journal of Marketing, 34(1), pp.66-74.
Phau, I. & Prendergast, G., 2000. Conceptualizing the country of origin of brand. Journal of
marketing Communications, 6(3), pp.159-170.
Positioning, 2010. Report rating. [Online] Available at:
http://www.positioningmag.com/prnews/PRNews.aspx?id=85255#ixzz0nXuRFUq7
[Accessed May 01, 2010]
Roth, M.S. & Romeo, J.B., 1992. Matching product category and country image perceptions: a

49
framework for managing country-of-origin effects. Journal of International Business Studies,
23(3), pp.477-497.
Samiee, S., 1994. Consumer evaluation of products in a global market. Journal of International
Business Studies, 35(3), pp.579-604.
Schiffman, L.G. & Kanuk, L.L., 2000. Consumer Behavior. 7th
ed. New Jersey: Prentice Hall.
Thanasuta K., Patoomsuwan T., Chaimahawong V. & Chiaravutthi Y., 2009. Brand and country
of origin valuations of automobiles. Asia Pacific Journal of Marketing and Logistics, 21(3),
pp. 355-375.
The World Bank, 2010. GNI per capita. [Online] Available at:
http://data.worldbank.org/indicator/NY.GNP.PCAP.PP.CD [Accessed 26 April 2010]
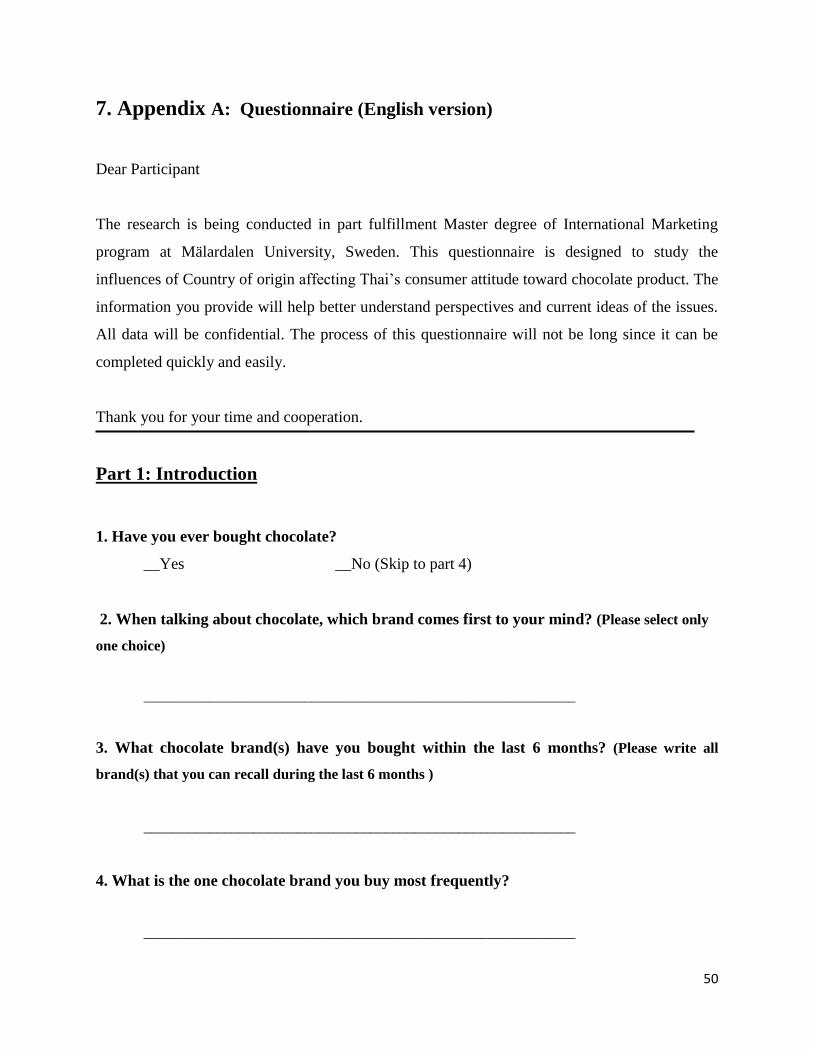
50
7. Appendix A: Questionnaire (English version)
Dear Participant
The research is being conducted in part fulfillment Master degree of International Marketing
program at Mälardalen University, Sweden. This questionnaire is designed to study the
influences of Country of origin affecting Thai’s consumer attitude toward chocolate product. The
information you provide will help better understand perspectives and current ideas of the issues.
All data will be confidential. The process of this questionnaire will not be long since it can be
completed quickly and easily.
Thank you for your time and cooperation.
Part 1: Introduction
1. Have you ever bought chocolate?
__Yes __No (Skip to part 4)
2. When talking about chocolate, which brand comes first to your mind? (Please select only
one choice)
___________________________________________________________
3. What chocolate brand(s) have you bought within the last 6 months? (Please write all
brand(s) that you can recall during the last 6 months )
___________________________________________________________
4. What is the one chocolate brand you buy most frequently?
___________________________________________________________

51
5. When you buying chocolate, do you look for information about country?
Always Most of Sometime Rarely Never
the time
I look for country
Production
I know where is the
brand come from
6. How would you rate the chocolate brand from the following country?
Very Good Good Neutral Bad Very Bad
England
Switzerland
USA
7. How would you rate the chocolate produced in the following country?
Very Good Good Neutral Bad Very Bad
China
Belgium
USA
8. How would you rate the chocolate brand in the following?
Very Good Good Neutral Bad Very Bad
Hershey
Cadbury
Lindt
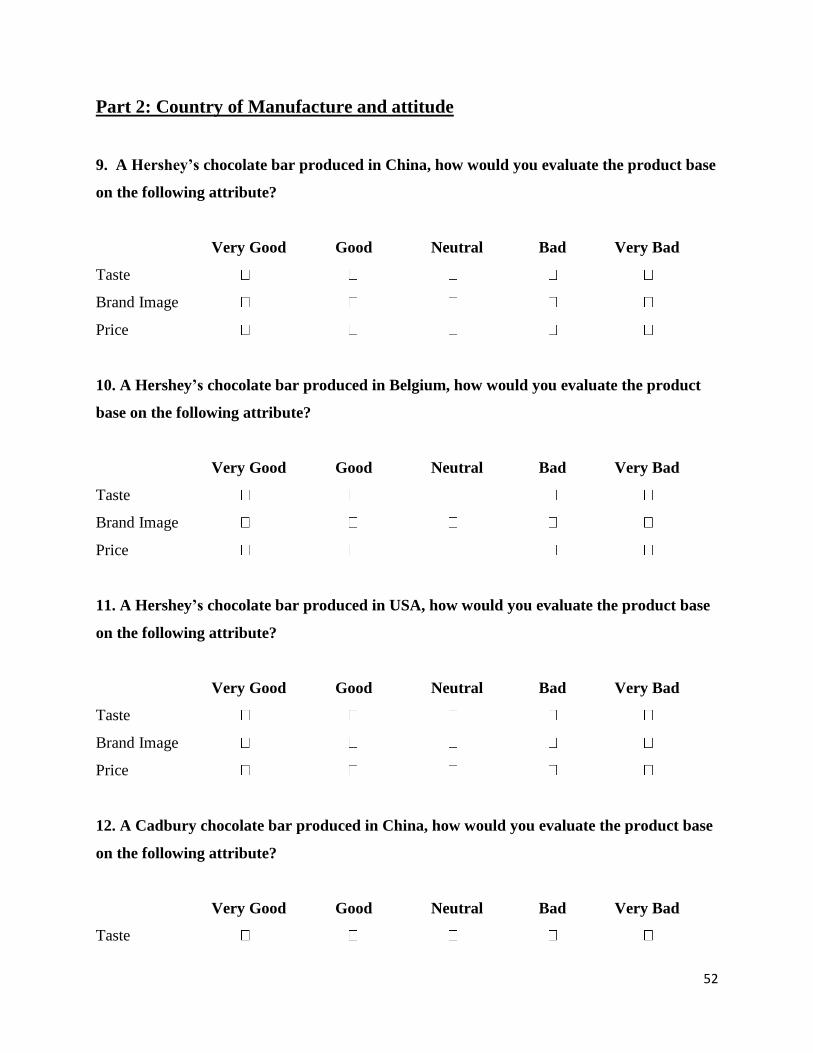
52
Part 2: Country of Manufacture and attitude
9. A Hershey’s chocolate bar produced in China, how would you evaluate the product base
on the following attribute?
Very Good Good Neutral Bad Very Bad
Taste
Brand Image
Price
10. A Hershey’s chocolate bar produced in Belgium, how would you evaluate the product
base on the following attribute?
Very Good Good Neutral Bad Very Bad
Taste
Brand Image
Price
11. A Hershey’s chocolate bar produced in USA, how would you evaluate the product base
on the following attribute?
Very Good Good Neutral Bad Very Bad
Taste
Brand Image
Price
12. A Cadbury chocolate bar produced in China, how would you evaluate the product base
on the following attribute?
Very Good Good Neutral Bad Very Bad
Taste

53
Brand Image
Price
13. A Cadbury chocolate bar produced in Belgium, how would you evaluate the product
base on the following attribute?
Very Good Good Neutral Bad Very Bad
Taste
Brand Image
Price
14. A Cadbury chocolate bar produced in USA, how would you evaluate the product base
on the following attribute?
Very Good Good Neutral Bad Very Bad
Taste
Brand Image
Price
15. A Lindt chocolate bar produced in China, how would you evaluate the product base on
the following attribute?
Very Good Good Neutral Bad Very Bad
Taste
Brand Image
Price

54
16. A Lindt chocolate bar produced in Belgium, how would you evaluate the product base
on the following attribute?
Very Good Good Neutral Bad Very Bad
Taste
Brand Image
Price
17. A Lindt chocolate bar produced in USA, how would you evaluate the product base on
the following attribute?
Very Good Good Neutral Bad Very Bad
Taste
Brand Image
Price

55
Part 3: Country of the brand and attitude
18. Chocolate brand from England, how would you evaluate the product base on the
following attribute?
Very Good Good Neutral Bad Very Bad
Taste
Brand Image
Price
19. Chocolate brand from Switzerland, how would you evaluate the product base on the
following attribute?
Very Good Good Neutral Bad Very Bad
Taste
Brand Image
Price
20. Chocolate brand from USA, how would you evaluate the product base on the following
attribute?
Very Good Good Neutral Bad Very Bad
Taste
Brand Image
Price

56
21. How important are each of the following attributes to you when choosing chocolate?
Very Important Neutral Not Not
Important Important Important
At ALL
Taste
Price
Package
Brand
Pack size
Manufacturing
Country of
the brand
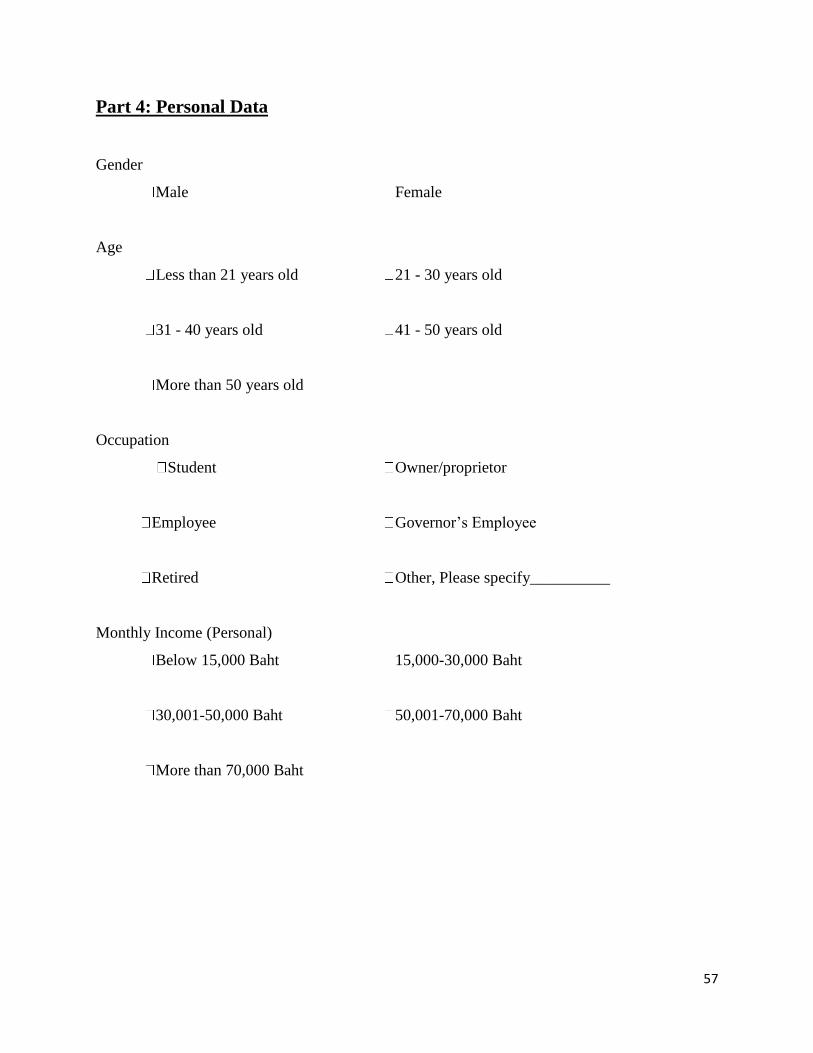
57
Part 4: Personal Data
Gender
Male Female
Age
Less than 21 years old 21 - 30 years old
31 - 40 years old 41 - 50 years old
More than 50 years old
Occupation
Student Owner/proprietor
Employee Governor’s Employee
Retired Other, Please specify__________
Monthly Income (Personal)
Below 15,000 Baht 15,000-30,000 Baht
30,001-50,000 Baht 50,001-70,000 Baht
More than 70,000 Baht

58
Appendix B: Questionnaire (Thai version)
แบบสอบถามเรองอทธพลของประเทศแหลงก าเนดมผลการเลอกซอชอกโกแลต การส ารวจครงนจดท าขนเพอเปนสวนหนง
ของวทยานพนธปรญญาโทดานการตลาดระหวางประเทศ ของมหาวทยาลยแมลาดอเลน ประเทศสวเดน
แบบสอบถามไดจดท าขนเพอศกษาอทธพลของประเทศแหลงก าเนดมผลกระทบตอคนไทยในการเลอกซอชอกโกแลต ผจดท า
วจยขอเรยนวาขอมลความคดเหนของทานจะมประโยชนอยางยงในการเขาใจทศนคตของการเลอกซอชอกโกแลตของคนไทย
และขอมลนจะไมมการเปดเผยและจะถกน าไปใชในการวเคราะหเพอการศกษาในดานการตลาดและสงคมศาสตรเทานน
ขอบพระคณทกรณาสละเวลาและใหความรวมมอ
สวนท1: ขอมลทวไป
1. คณเคยซอชอกโกแลตใชหรอไม
เคย ไมเคย (ขามไปสวนท5)
2. เมอพดถง ชอกโกแลต คณคดถงยหอใดเปนอนดบแรก (กรณาเลอกตอบเพยงขอเดยว)
___________________________________________________________
3. ภายในชวงเวลา 6 เดอน คณไดซอชอกโกแลตยหอใดบาง (กรณาเขยนทกยหอทคณสามารถจ าได)
___________________________________________________________
4. ชอกโกแลตยหอไหน ทคณซอบอยมากทสด
___________________________________________________________

59
5. เวลาคณซอชอกโกแลต คณดฉลากเพอทจะรวาชอกโกแลต ผลตทประเทศไหน และ คณรหรอไมวา ยหอของ ชอกโกแลต ทคณซอ ม
แหลงก าเนด มาจากประเทศใด
สม าเสมอ สวนมาก บางครง สวนนอย ไมเคย
ฉนดฉลากเพอจะรวา
ชอกโกแลตผลตทประเทศไหน
ฉนรวายหอชอกโกแลต
มาจากประเทศไหน
6. คณคดอยางไรกบยหอชอกโกแลตทมาจากประเทศตอไปน
ดมาก ด ปานกลาง ไมด ไมดมาก
องกฤษ
สวตเซอรแลนด
อเมรกา
7. คณคดอยางไรกบชอกโกแลตทผลตจากประเทศตอไปน
ดมาก ด ปานกลาง ไมด ไมดมาก
จน
เบลเยยม
อเมรกา
8. คณคดอยางไรกบชอกโกแลตยหอดงตอไปน
ดมาก ด ปานกลาง ไมด ไมดมาก
Hershey
Cadbury
Lindt

60
สวนท2: ประเทศทตงของผผลต และ ทศนคต
9. คณมทศนคตอยางไรกบ ชอกโกแลตยหอ Hershey ทผลตในประเทศจน
ดมาก ด ปานกลาง ไมด ไมดมาก
รสชาต
ภาพลกษณยหอ
ราคา
10. คณมทศนคตอยางไรกบชอกโกแลตยหอ Hershey ทผลตในประเทศเบลเยยม
ดมาก ด ปานกลาง ไมด ไมดมาก
รสชาต
ภาพลกษณยหอ
ราคา
11. คณมทศนคตอยางไรกบชอกโกแลตยหอ Hershey ทผลตในประเทศอเมรกา
ดมาก ด ปานกลาง ไมด ไมดมาก
รสชาต
ภาพลกษณยหอ
ราคา
12. คณมทศนคตอยางไรกบ ชอกโกแลตยหอ Cadbury ทผลตในประเทศจน
ดมาก ด ปานกลาง ไมด ไมดมาก
รสชาต
ภาพลกษณยหอ
ราคา
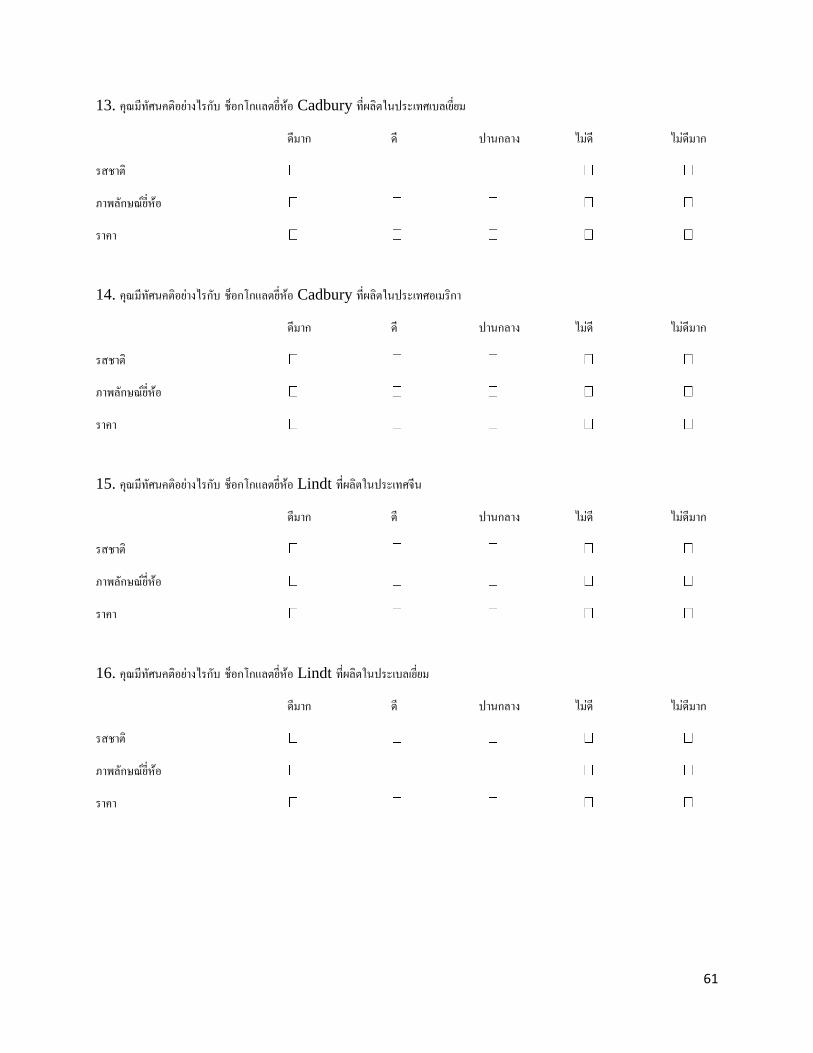
61
13. คณมทศนคตอยางไรกบ ชอกโกแลตยหอ Cadbury ทผลตในประเทศเบลเยยม
ดมาก ด ปานกลาง ไมด ไมดมาก
รสชาต
ภาพลกษณยหอ
ราคา
14. คณมทศนคตอยางไรกบ ชอกโกแลตยหอ Cadbury ทผลตในประเทศอเมรกา
ดมาก ด ปานกลาง ไมด ไมดมาก
รสชาต
ภาพลกษณยหอ
ราคา
15. คณมทศนคตอยางไรกบ ชอกโกแลตยหอ Lindt ทผลตในประเทศจน
ดมาก ด ปานกลาง ไมด ไมดมาก
รสชาต
ภาพลกษณยหอ
ราคา
16. คณมทศนคตอยางไรกบ ชอกโกแลตยหอ Lindt ทผลตในประเบลเยยม
ดมาก ด ปานกลาง ไมด ไมดมาก
รสชาต
ภาพลกษณยหอ
ราคา

62
17. คณมทศนคตอยางไรกบ ชอกโกแลตยหอ Lindt ทผลตในประเทศอเมรกา
ดมาก ด ปานกลาง ไมด ไมดมาก
รสชาต
ภาพลกษณยหอ
ราคา
สวนท3: ประเทศของตราสนคา และ ทศนคต
18. คณคดอยางไรกบยหอชอกโกแลตทผลตจากประเทศองกฤษ
ดมาก ด ปานกลาง ไมด ไมดมาก
รสชาต
ภาพลกษณยหอ
ราคา
19. คณคดอยางไรกบยหอชอกโกแลตทผลตจากประเทศสวตเซอรแลนด
ดมาก ด ปานกลาง ไมด ไมดมาก
รสชาต
ภาพลกษณยหอ
ราคา
20. คณคดอยางไรกบยหอชอกโกแลตทผลตจากประเทศอเมรกา
ดมาก ด ปานกลาง ไมด ไมดมาก
รสชาต
ภาพลกษณยหอ
ราคา

63
21. ปจจยทมผลตอการเลอกซอชอกโกแลต
ส าคญอยางยง ส าคญ เฉยๆ ไมส าคญ ไมส าคญอยางยง
รสชาต
ราคา
บรรจภณฑ
ยหอ
ขนาดของบรรจภณฑ
ประเทศทผลตสนคา
ประเทศของยหอนน
สวนท4: ขอมลสวนตว
เพศ
ชาย หญง
อาย
ต ากวา 21 ป 21-30 ป
31-40 ป 41-50 ป
มากกวา 50ป
อาชพ
นกศกษา เจาของกจการ
พนกงานบรษท ขาราชการ
เกษยร อนๆ โปรดระบ ____________
รายไดตอเดอน
ต ากวา 15,000 บาท 15,000 - 30,000 บาท
30,001- 50,000 บาท 50,001 - 70,000 บาท
มากกวา 70,000 บาท