matb344 applied statistics chapter 5 several useful discrete distributions
TRANSCRIPT

MATB344 Applied StatisticsMATB344 Applied Statistics
Chapter 5
Several Useful Discrete Distributions

Key ConceptsKey ConceptsI.I. The Binomial Random VariableThe Binomial Random Variable
II.II. The Poisson Random VariableThe Poisson Random Variable

IntroductionIntroduction• Discrete random variables take on only a
finite or countable number of values.• Three discrete probability distributions serve
as models for a large number of practical applications:
The binomialbinomial random variable
The PoissonPoisson random variable
The hypergeometrichypergeometric random variable
The binomialbinomial random variable
The PoissonPoisson random variable
The hypergeometrichypergeometric random variable

The Binomial Random VariableThe Binomial Random Variable• The coin-tossing experimentcoin-tossing experiment is a simple
example of a binomial random variable. binomial random variable. Toss a fair coin n = 3 times and record x = number of heads. Probability distribution is as follows.
x p(x)
0 1/8
1 3/8
2 3/8
3 1/8

The Binomial Random VariableThe Binomial Random Variable• Many situations in real life resemble the coin
toss, but the coin is not necessarily fair, so that P(H) 1/2.
• Example: Example: A geneticist samples 10 people and counts the number who have a gene linked to Alzheimer’s disease.
Person• Coin:Coin:
• Head:Head:
• Tail:Tail:
• Number of tosses:Number of tosses:
• P(H):P(H):Has gene
Doesn’t have gene
n = 10
P(has gene) = proportion in the population who have
the gene.

The Binomial ExperimentThe Binomial Experiment1. The experiment consists of nn identical trials. identical trials.2. Each trial results in one of two outcomesone of two outcomes, success (S)
or failure (F) i.e: mutually exclusive.3. The probability of success on a single trial is p and
remains constantremains constant from trial to trial. The probability of failure is q = 1 – p.
4. The trials are independentindependent.5. We are interested in xx, the number of successes in , the number of successes in n n
trials.trials.

Binomial or Not?Binomial or Not?• Very few real life applications satisfy
these requirements exactly.
• Select two people from the U.S. population, and suppose that 15% of the population has the Alzheimer’s gene.• For the first person, p = P(gene) = .15• For the second person, p P(gene) = .15,
even though one person has been removed from the population.

The Binomial Probability The Binomial Probability DistributionDistribution
• For a binomial experiment with n trials and probability p of success on a given trial, the probability of k successes in n trials is
.1!01)2)...(2)(1(!
)!(!
!
.,...2,1,0)!(!
!)(
and with
Recall
for
nnnn
knk
nC
nkqpknk
nqpCkxP
nk
knkknknk
.1!01)2)...(2)(1(!
)!(!
!
.,...2,1,0)!(!
!)(
and with
Recall
for
nnnn
knk
nC
nkqpknk
nqpCkxP
nk
knkknknk

The Mean and Standard The Mean and Standard DeviationDeviation
• For a binomial experiment with n trials and probability p of success on a given trial, the measures of center and spread are:
npq
npq
np
:deviation Standard
:Variance
:Mean2
npq
npq
np
:deviation Standard
:Variance
:Mean2

Example 1aExample 1a• A fair coin is flipped 6 times. What is the
probability of obtaining exactly 3 heads? • For this problem, N =6, k=3, and p = .5,
therefore,

Example 1bExample 1b• Determine the probability of obtaining 3
or more successes with n=6 and p = .3.• P(x >=3) = P(3) + P(4) + P(5) + P(6).
=
= .1852 + .0595 + .0102 + .0007 = .2556.

n = p = x =success =
Example 2aExample 2aA rifle shooter hits a target 80% of the time. He fires five shots at the target. What is the probability that exactly 3 shots hit the target?
333)3()3( nn qpCPxP
5 .8hit # of hits
353 )2(.)8(.!2!3
!5
2048.)2(.)8(.10 23
AppletApplet

Example 2bExample 2bWhat is the probability that more than 3 shots hit the target?
55555
45454)5()4()3( qpCqpCPPxP
0514 )2(.)8(.!0!5
!5)2(.)8(.
!1!4
!5
7373.)8(.)2(.)8(.5 54
AppletApplet

Example 2cExample 2cFor the same rifle shooter, if he fires 20 shots at the target. What is the probability that more than 5 shots hit the target?
0202020
416206
20
6
...)5( qpCqpCqpCxPk
kknnk
AppletApplet
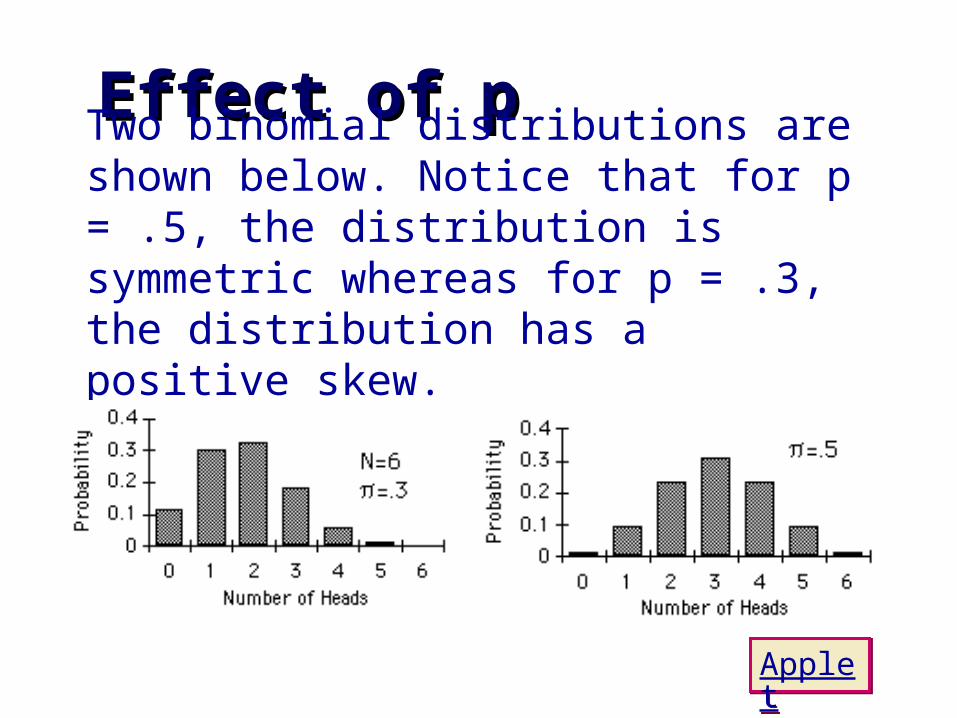
Effect of pEffect of pTwo binomial distributions are shown below. Notice that for p = .5, the distribution is symmetric whereas for p = .3, the distribution has a positive skew.
AppletApplet

Probability TablesProbability Tables• We can use the binomial probability tablesbinomial probability tables
to find probabilities for selected binomial distributions.
• They can either be a) Probability tables for each x = k orb) Cumulative probability tables
Binomial tableBinomial table

Probability table for each x = k(part of)

Cumulative Probability table(part of) (for n= 5)
Probability table for each x = k (for n = 5) 0.263 ~ 0.000 + 0.006 + 0.051 + 0.205

Cumulative Probability TablesCumulative Probability TablesWe can use the cumulative probability tablescumulative probability tables to find probabilities for selected binomial distributions.
Find the table for the correct value of n.
Find the column for the correct value of p.
The row marked “k” gives the cumulative probability, P(x k) = P(x = 0) +…+ P(x = k)
Find the table for the correct value of n.
Find the column for the correct value of p.
The row marked “k” gives the cumulative probability, P(x k) = P(x = 0) +…+ P(x = k)

Example 2a (using table)Example 2a (using table)What is the probability that exactly 3 shots hit the target?
Find the table for the correct value of n.Find the table for the correct value of n.
Find the column for the correct value of p.Find the column for the correct value of p.
Row “k” gives the cumulative probability, P(x k) = P(x = 0) +…+ P(x = k)Row “k” gives the cumulative probability, P(x k) = P(x = 0) +…+ P(x = k)

Example 2a continuedExample 2a continued
k p = .80
0 .000
1 .007
2 .058
3 .263
4 .672
5 1.000
P(P(xx = 3) = 3) = P(x 3) – P(x 2)= .263 - .058= .205
P(P(xx = 3) = 3) = P(x 3) – P(x 2)= .263 - .058= .205
Check from formula: P(x = 3) = .2048

Example 2b continuedExample 2b continued
k p = .80
0 .000
1 .007
2 .058
3 .263
4 .672
5 1.000
What is the probability that more than 3 shots hit the target?
P(P(xx > 3) > 3) = 1 - P(x 3)= 1 - .263 = .737P(P(xx > 3) > 3) = 1 - P(x 3)= 1 - .263 = .737
Check from formula: P(x > 3) = .7373

ExampleExample• Here is the probability distribution
for x = number of hits. What are the mean and standard deviation for x?
89.)2)(.8(.5
4)8(.5
npq
np
:deviation Standard
:Mean
89.)2)(.8(.5
4)8(.5
npq
np
:deviation Standard
:Mean

ExampleExample• Would it be unusual to find
that none of the shots hit the target? 89.;4 89.;4
• The value x = 0 lies
49.489.
40
x
z 49.489.
40
x
z
• more than 4 standard deviations below the mean. Very unusual.
AppletApplet

The Poisson Random VariableThe Poisson Random Variable• The Poisson random variable x is a model for
data that represent the number of occurrences of a specified event in a given unit of time or space.
• Examples:Examples:
• The number of calls received by a switchboard during a given period of time.
• The number of machine breakdowns in a day
• The number of traffic accidents at a given intersection during a given time period.
The Poisson Probability DistributionThe Poisson Probability Distribution
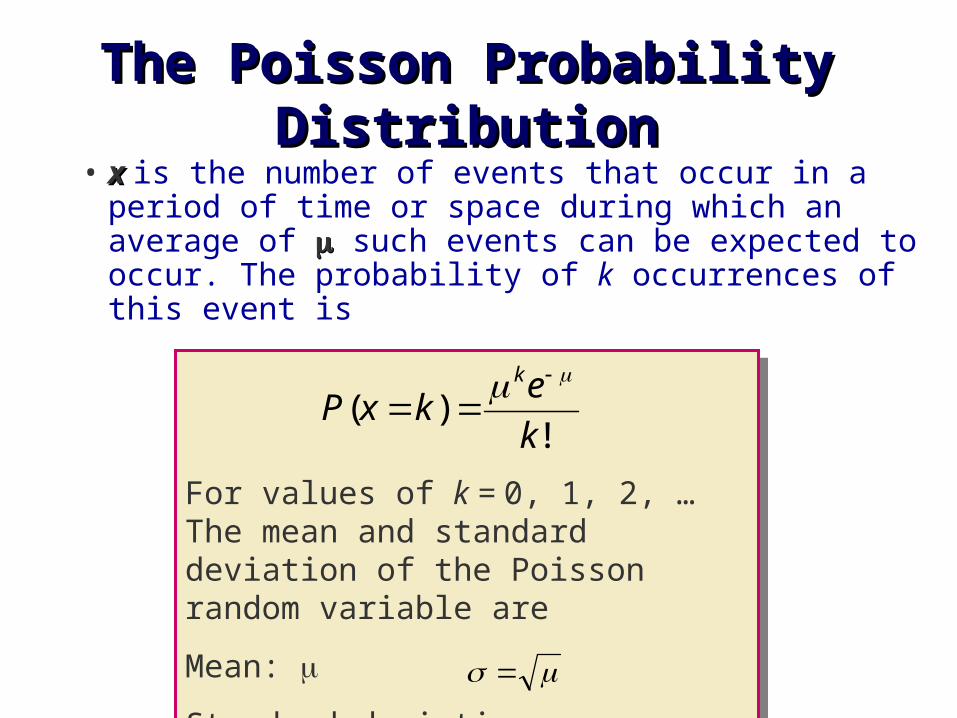
• xx is the number of events that occur in a period of time or space during which an average of such events can be expected to occur. The probability of k occurrences of this event is
For values of k = 0, 1, 2, … The mean and standard deviation of the Poisson random variable are
Mean:
Standard deviation:
For values of k = 0, 1, 2, … The mean and standard deviation of the Poisson random variable are
Mean:
Standard deviation:
!)(
k
ekxP
k

ExampleExampleThe average number of traffic accidents on a certain section of highway is two per week. Find the probability of exactly one accident during a one-week period.
!)1(
k
exP
k
2707.2!1
2 221
ee

Cumulative Cumulative Probability TablesProbability Tables
You can use the cumulative probability cumulative probability tablestables to find probabilities for selected Poisson distributions.
Find the column for the correct value of .
The row marked “k” gives the cumulative probability, P(x k) = P(x = 0) +…+ P(x = k)
Find the column for the correct value of .
The row marked “k” gives the cumulative probability, P(x k) = P(x = 0) +…+ P(x = k)

ExampleExample
k = 2
0 .135
1 .406
2 .677
3 .857
4 .947
5 .983
6 .995
7 .999
8 1.000
What is the probability that there is exactly 1 accident?
Find the column for the correct value of .
Find the column for the correct value of .

ExampleExample
k = 2
0 .135
1 .406
2 .677
3 .857
4 .947
5 .983
6 .995
7 .999
8 1.000
What is the probability that there is exactly 1 accident?
P(P(xx = 1) = 1) = P(x 1) – P(x 0)= .406 - .135= .271
P(P(xx = 1) = 1) = P(x 1) – P(x 0)= .406 - .135= .271
Check from formula: P(x = 1) = .2707

ExampleExample
What is the probability that 8 or more accidents happen?
P(P(xx 8) 8) = 1 - P(x < 8)= 1 – P(x 7) = 1 - .999 = .001
P(P(xx 8) 8) = 1 - P(x < 8)= 1 – P(x 7) = 1 - .999 = .001
k = 2
0 .135
1 .406
2 .677
3 .857
4 .947
5 .983
6 .995
7 .999
8 1.000
This would be very unusual (small probability) since x = 8 lies
standard deviations above the mean.
This would be very unusual (small probability) since x = 8 lies
standard deviations above the mean.
24.4414.1
28
x
z

Key ConceptsKey ConceptsI. The Binomial Random VariableI. The Binomial Random Variable
1. Five characteristics: n identical independent trials, each resulting in either success S or failure F; probability of success is p and remains constant from trial to trial; and x is the number of successes in n trials.
2. Calculating binomial probabilities
a. Formula:
b. Cumulative binomial tables
c. Individual and cumulative probabilities using Minitab
3. Mean of the binomial random variable: np
4. Variance and standard deviation: 2 npq and
knknk qpCkxP )(
npq npq

Key ConceptsKey ConceptsII. The Poisson Random VariableII. The Poisson Random Variable
1. The number of events that occur in a period of time or space, during which an average of such events are expected to occur
2. Calculating Poisson probabilities
a. Formula:b. Cumulative Poisson tables
c. Individual and cumulative probabilities using Minitab
3. Mean of the Poisson random variable: E(x) 4. Variance and standard deviation: 2 and
5. Binomial probabilities can be approximated with Poisson probabilities when np 7, using np.
!)(
k
ekxP
k
!)(
k
ekxP
k