matched mirna and mrna signatures from an hesc- based in ... · (srivastava and ieda, 2012),...
TRANSCRIPT

Journ
alof
Cell
Scie
nce
Matched miRNA and mRNA signatures from an hESC-based in vitro model of pancreatic differentiationreveal novel regulatory interactions
Xiaoyan Liao1,2,3, Haipeng Xue1,2,3,4, Yu-Chieh Wang2,3, Kristopher L. Nazor2,3, Shuren Guo1,2,3,5,
Neha Trivedi1,*, Suzanne E. Peterson2,3, Ying Liu1,2,3,4, Jeanne F. Loring2,3 and Louise C. Laurent1,2,3,`
1Department of Reproductive Medicine, University of California, San Diego, California, USA2Department of Chemical Physiology, The Scripps Research Institute, La Jolla, California, USA3Center for Regenerative Medicine, The Scripps Research Institute, La Jolla, California, USA4Department of Neurosurgery, University of Texas Health Science Center, Houston, Texas, USA5Zhongnan Hospital of Wuhan University, Wuhan, China
*Present address: Rady Children’s Specialists of San Diego, San Diego, California, USA`Author for correspondence ([email protected])
Accepted 20 May 2013Journal of Cell Science 126, 3848–3861� 2013. Published by The Company of Biologists Ltddoi: 10.1242/jcs.123570
SummaryThe differentiation of human pluripotent stem cells (hPSCs) to insulin-expressing beta islet-like cells is a promising in vitro model
system for studying the molecular signaling pathways underlying beta cell differentiation, as well as a potential source of cells for thetreatment of type 1 diabetes. MicroRNAs (miRNAs) are a class of small non-coding RNAs that regulate many biological processes,including cellular differentiation. We studied the miRNA and mRNA expression profiles of hPSCs at five stages of in vitro
differentiation along the pancreatic beta cell lineage (definitive endoderm, primitive gut tube, posterior foregut, pancreatic progenitorand hormone-expressing endocrine cells) in the context of samples of primary human fetal pancreas and purified adult islet cells usingmicroarray analysis. Bioinformatic analysis of the resulting data identified a unique miRNA signature in differentiated beta islet cells,and predicted the effects of key miRNAs on mRNA expression. Many of the predicted miRNA–mRNA interactions involved mRNAs
known to play key roles in the epithelial–mesenchymal transition process and pancreatic differentiation. We validated a subset of thepredictions using qRT-PCR, luciferase reporter assays and western blotting, including the known interaction between miR-200 andZEB2 (involved in epithelial–mesenchymal transition) and the novel interaction between miR-200 and SOX17 (a key transcription
factor in specification of definitive endoderm). In addition, we found that miR-30d and let-7e, two miRNAs induced duringdifferentiation, regulated the expression of RFX6, a transcription factor that directs pancreatic islet formation. These findings suggestthat precise control of target mRNA expression by miRNAs ensures proper lineage specification during pancreatic development.
Key words: Beta cell, Gene expression, miRNA, Pancreatic differentiation, Stem cell
IntroductionType I diabetes, also known as juvenile diabetes, is a chronic
condition characterized by autoimmune destruction of the insulin-
producing beta islet cells in the pancreas. The death of these cells
leads to insulin deficiency, hyperglycemia and dependence on insulin
replacement therapy. Whole-pancreas transplantation or infusion of
islet cells into the portal vein are effective treatments, but limited by
the scarce supply of materials and the necessity for life-long
immunosuppression (Guo and Hebrok, 2009). The generation of
pancreatic beta-like cells from human pluripotent stem cells (hPSCs),
which include embryonic stem cells (hESCs) and induced PSCs
(hiPSCs), is a potential alternative source of insulin-producing cells
for cell therapy (D’Amour et al., 2006). Other options may involve
direct reprogramming of other somatic cell types to beta islet-like
cells by forced expression of beta cell-specific transcription factors,
which has been achieved in an in vivo mouse model (Zhou et al.,
2008), but has not been successfully performed in vitro.
Using defined growth factors and small molecules, beta islet-
like cells can be obtained from hESCs using a five-stage
protocol: (1) definitive endoderm (DE); (2) primitive gut tube;
(3) posterior foregut; (4) pancreatic progenitor; and (5) pancreatic
endoderm (D’Amour et al., 2006; Kroon et al., 2008; Van Hoof
et al., 2009). This method mimics the in vivo process of
pancreatic development, and has been utilized in experiments
designed to identify cell-surface markers for the isolation of
pancreatic progenitor cells (Kelly et al., 2011). It is important to
note that the hormone-producing cells generated in this manner
express only low levels of insulin, glucagon, or both (D’Amour
et al., 2006), which suggests that these cells are either immature
or have followed an aberrant differentiation trajectory. However,
transplantation of hESC-derived pancreatic endoderm cells into a
mouse model of type I diabetes results in generation of beta-islet
like cells that secreted high levels of insulin in a glucose-
responsive manner (Kroon et al., 2008; Xie et al., 2013). These
results suggest that the hESC-derived pancreatic endoderm
population contains cells that can mature into fully functional
beta cells, supporting the notion that in vitro differentiation of
hESCs can be used as a model system to study early pancreatic
3848 Research Article

Journ
alof
Cell
Scie
nce
differentiation. Furthermore, we postulate that comparisons madebetween hESC-derived pancreatic endoderm cells and bona fide
beta islet cells from the human pancreas can be used to instructthe development of methods for in vitro maturation of hESC-derived pancreatic endoderm cells into functional beta cells.
MicroRNA (miRNA) repression of mRNAs is an important
mechanism for regulation of expression during cell fatespecification, apoptosis, and metabolism (Bartel, 2004). Thesesmall (,22 nt) non-coding RNAs bind to partially
complementary sequences on target mRNAs (most commonlyin their 39UTRs), and lead to post-transcriptional gene repression.miRNAs are classified in two ways: (1) by families, which share
similar target recognition motifs, or seed sequences, located atpositions 2–8 from the 59-end of mature miRNAs (Bartel, 2009;Doench and Sharp, 2004; Lewis et al., 2003); and (2) by clusters,which are miRNAs encoded by sequences found in close
proximity in the genome. High complementarity betweenmiRNAs and cognate sequences in the target mRNAs,commonly seen in plants, generally leads to direct mRNA
cleavage. In contrast, partial complementarity, the most commoncase in metazoans, results in alteration of mRNA stabilitythrough de-adenylation, translational repression, or other
mechanisms (Bartel, 2004). Work from our lab and others hasshown that hPSCs have a unique miRNA signature, which playsan important role in regulation of the pluripotent state, and that
cell fate can be changed by altering the miRNA content of cells(Ivey et al., 2008; Lin et al., 2008). In fact, it has recently beenshown that overexpression of a few miRNA(s) can directlyreprogram fibroblasts into iPSCs (Liao et al., 2011), or help
other transcription factors to directly reprogram fibroblasts intofunctional neurons (Ambasudhan et al., 2011) or cardiomyocytes(Srivastava and Ieda, 2012), indicating that miRNAs are powerful
regulators of cell lineage specification.
As is the case in other lineages, miRNAs play an importantrole in pancreatic organogenesis and functional maturation. In a
mouse study, conditional deletion of Dicer1, a critical enzyme formiRNA and siRNA biogenesis, from the pancreas led to grossdefects in all pancreatic lineages, especially beta islet cells, withthe endocrine defects associated with persistent overexpression of
progenitor genes such as Neurog3 (Lynn et al., 2007). In otherstudies, it has been shown that miR-375, one of the mostabundant miRNAs in the endocrine pancreas, regulates insulin
secretion by regulating myotrophin expression (Poy et al., 2004),while miR-30d regulates the response of beta cells to glucose andinhibits the epithelial–mesenchymal transition (EMT) in human
beta islet cells during prolonged in vitro culture (Joglekar et al.,2009; Ozcan, 2009). The miR-200 family, which inhibits EMTby directly targeting ZEB1 and ZEB2, two transcription factors
that repress E-cadherin (CDH1) expression during EMT (Gregoryet al., 2008), is abundantly expressed in both the mouse and humanpancreas and has been implicated in pancreatic carcinogenesis(Brabletz et al., 2011). While these studies have revealed some of
the roles that miRNAs play in pancreatic development anddifferentiation, the discrepancy between the catastrophic effect ofpancreatic lineage-specific loss of Dicer1 and the more subtle
effects of perturbations in miR-375, miR-200 and miR-30dexpression suggests that many critical miRNA/target mRNAinteractions regulating this process remain to be uncovered.
In this study, WA09 hESCs were differentiated into pancreaticendoderm cells following a published five-stage differentiationprotocol (D’Amour et al., 2006). Differentiated cells at each stage
were collected and compared to undifferentiated hESCs, fetalpancreatic tissue, and purified adult islets, which consist of
,70% beta cells, ,20% alpha cells, ,10% delta cells, and smallpercentages of pancreatic polypeptide producing (PP) and epsiloncells (Brissova et al., 2005; Cabrera et al., 2006). These samples
were subjected to genome-wide microarray-based miRNA andmRNA expression profiling, and the resulting data werebioinformatically analyzed. We focused on identifyingtranscripts and miRNAs with two expression patterns: those
with differential expression among the five stages of hESCdifferentiation, and therefore are more likely to have roles inearly pancreatic differentiation; and those that were differentially
expressed between the hESC-derived pancreatic endoderm andadult islet samples, which are candidates for beta cell maturationfactors. We found that cells in the early and late stages of hESC
differentiation possessed distinct miRNA signatures. In addition,we used integrated miRNA and mRNA analyses to identifycritical miRNA–mRNA interactions occurring during thedifferentiation process. qRT-PCR and dual luciferase
experiments were used to validate functional roles for miR-200a in regulating both the EMT process and definitiveendoderm specification during early stages of differentiation. In
addition, we verified that miR-30d and let-7e, two miRNAs thatare induced during differentiation, regulate the expression ofRFX6, a pancreatic progenitor (Smith et al., 2010). Our findings
suggest precise control of target mRNA expression by miRNAcontributes to proper lineage specification during the process ofpancreatic differentiation.
ResultsStepwise in vitro differentiation of hESCs to insulin-producing beta islet cells
The WA09 cell line was cultured without feeder cells in Stempro
(Invitrogen) medium on Geltrex (Invitrogen) and was differentiatedinto pancreatic beta islet-like cells using a modification of apublished five-stage differentiation protocol (D’Amour et al., 2006)(Fig. 1A). Biological replicates were collected at each stage, with
efficient differentiation confirmed by immunocytochemical stainingand quantitative real-time PCR (qRT-PCR) with stage-specificdifferentiation markers (Fig. 1B–D).
Dynamic changes in miRNA expression duringdifferentiation
Twenty-three samples were included in the miRNA expressionanalysis, including two to five replicates of: undifferentiated
hESCs; hESCs differentiated toward beta islet-like cells (stages1–5); fetal pancreatic tissue; and adult islets (supplementarymaterial Table S1). To characterize changes in miRNAexpression during differentiation, we first divided the 16
undifferentiated and differentiated hESC samples into sixgroups according to their differentiation status (undifferentiatedand Stages 1–5) for ANOVA, followed by hierarchical clustering.
The initial ANOVA resulted in a total of 220 differentiallyexpressed miRNA probes (Pearson correlation coefficient as thedistance measure, FDR,0.05; Fig. 2A,B). Bi-directional
hierarchical clustering indicated that Stage 1 and 2 samplesclustered together with, and shared some expression patterns withundifferentiated hESCs (see Fig. 2B, lower portion of miRNA
Group 1 and also Group 4), while samples from Stages 3, 4and 5 grouped together in a separate cluster (Fig. 2B). Wethus considered Stages 1 and 2 to represent early stage
miRNA signatures in beta cell 3849
Journ
alof
Cell
Scie
nce
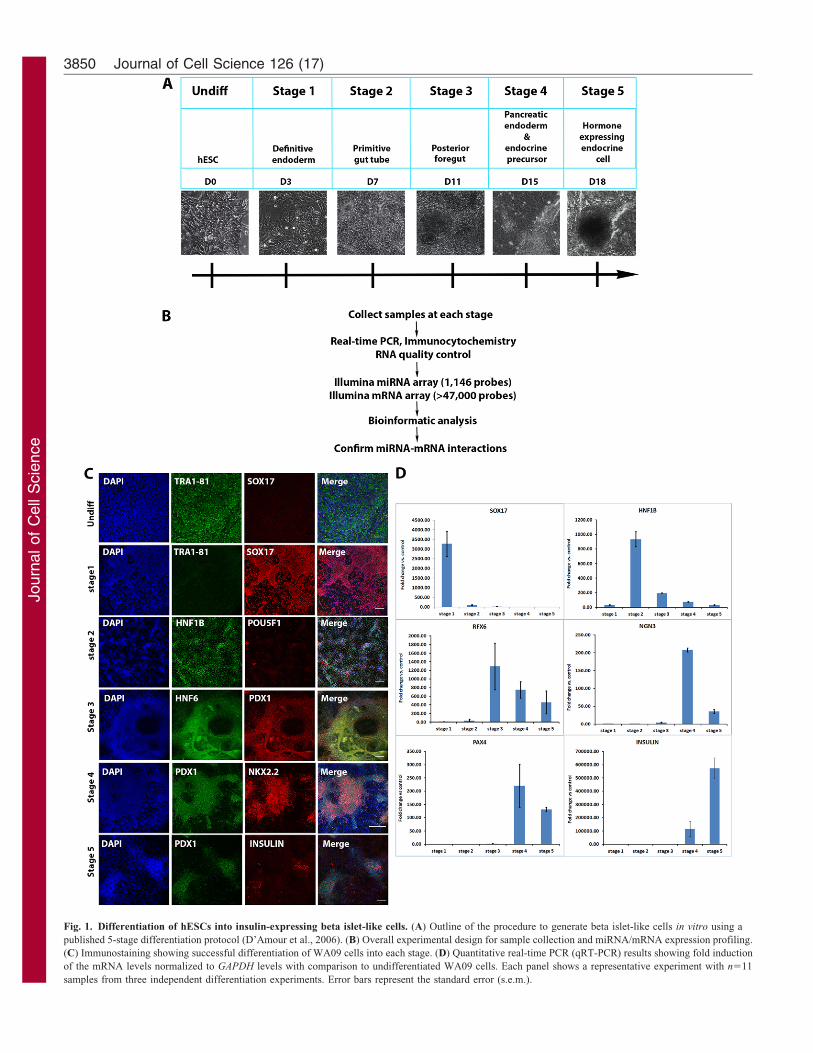
Fig. 1. Differentiation of hESCs into insulin-expressing beta islet-like cells. (A) Outline of the procedure to generate beta islet-like cells in vitro using a
published 5-stage differentiation protocol (D’Amour et al., 2006). (B) Overall experimental design for sample collection and miRNA/mRNA expression profiling.
(C) Immunostaining showing successful differentiation of WA09 cells into each stage. (D) Quantitative real-time PCR (qRT-PCR) results showing fold induction
of the mRNA levels normalized to GAPDH levels with comparison to undifferentiated WA09 cells. Each panel shows a representative experiment with n511
samples from three independent differentiation experiments. Error bars represent the standard error (s.e.m.).
Journal of Cell Science 126 (17)3850

Journ
alof
Cell
Scie
nce
differentiation, and Stages 3, 4 and 5 to represent late stage
differentiation. The 220 probes were separated into four major
groups by the hierarchical clustering analysis (Fig. 2B, labeled 1–
4 on left side of figure): hESC-specific miRNAs that decreased in
expression with differentiation (Group 1); miRNAs that were
induced in the early stages of differentiation (Group 2); miRNAs
enriched in both undifferentiated cells and late stage
differentiated cells, but downregulated at early stages of
differentiation (Group 3); and miRNAs that were induced only
at late stages of differentiation (Group 4).
Fig. 2. Analysis of differential miRNA expression during in vitro pancreatic beta islet cell differentiation. (A) Illustration of the statistical and bioinformatic
analysis workflow. (B) Hierarchical clustering of 220 differentially expressed miRNA probes in undifferentiated WA09 cell and differentiated derivatives.
miRNAs in the same family or in the same cluster share the same text colors. (C) Chromosome locations of selected miRNA families/clusters are shown. The
C19MC miRNA cluster and miR-371/372/373 family are located quite close to each other on chromosome 19. (D) Hierarchical clustering analysis of the 92
miRNA probes induced during late stage differentiation of fetal pancreas and adult islet cells.
miRNA signatures in beta cell 3851

Journ
alof
Cell
Scie
nce
The 108 hESC-specific miRNA probes in Group 1 were furtherdivided into two subgroups, which were rapidly (Fig. 2B, top) or
gradually (Fig. 2B, bottom) downregulated upon differentiation.Inspection of the genomic positions of these miRNAs revealedthat more than 40 miRNAs in the rapid downregulation groupwere located on chromosome (chr) 19q13.42 (Fig. 2C). This
particular miRNA cluster is known as the chromosome 19miRNA cluster (C19MC), which contains 54 miRNAs and spans96 kb. miRNAs from this cluster have been demonstrated to be
highly expressed in both hESCs and placenta (Laurent et al.,2008; Miura et al., 2010; Ren et al., 2009; Zhu et al., 2009). Inaddition, consistent with a previous report (Hinton et al., 2010),
expression of the hESC-specific miR-371/372/373 family, whichis located 100 kb distal to the C19MC on chr19q13, graduallydecreased during differentiation (Fig. 2B,C). Another hESC-specific miRNA family, the miR-302 family located on chr4q25,
showed an expression pattern similar to the miR-371/372/373cluster, raising the possibility that these two miRNA familiesmay be regulated by a common mechanism that differs from the
regulation of C19MC (Fig. 2C). Interestingly, all three of thesemiRNA families are highly expressed in hESCs and share similarseed sequences, and hence are likely to regulate a common set of
downstream mRNAs (Laurent et al., 2008). In addition, membersof the miR-302 and miR-371/372/373 families (or theirhomologues in mouse) have been shown to play an important
role in regulation of the ESC cell cycle (Wang et al., 2008a) andpromote reprogramming of somatic cells to pluripotency (Judsonet al., 2009). Taken in the context of these prior findings, ourresults suggest that miRNA regulation of differentiation may be
more complex than previously suspected, and that the multiplepluripotency-associated miRNAs containing similar, but notidentical, seed sequences may have different roles, which are
influenced by the precise timing of downregulation duringdifferentiation and subtle differences in target specificity.
Twenty miRNA probes (Group 2) were significantly induced
at early stages of differentiation, Stage 1 in particular (Fig. 2B).Among these miRNAs, induction of miR-489 appeared to beendoderm specific, while miR-375 was immediately elevated inStage 1 definitive endoderm cells and remained at a high level
of expression throughout the entire differentiation process(Fig. 2B).
Thirty miRNA probes (Group 3), including miR-200a/429,
miR-30a and miR-29a/b, had a more complex pattern ofexpression, and were highly expressed in undifferentiated cells,downregulated at early stages of differentiation, and then
upregulated at later stages of differentiation (Fig. 2B).
Sixty-two miRNA probes (Group 4) showed increasedexpression specifically during late stages of differentiation, andcontained several miRNA clusters than have been previously
recognized for their roles in differentiation of other lineages(Fig. 2B–D). Among these were the let-7e/miR-99b/125a-5pcluster on chr19 (2MB upstream of the C19MC), which is
intergenic and has been shown to be involved in the regulation ofhematopoietic differentiation (Cabrera et al., 2006; Gerrits et al.,2012; Guo et al., 2010), the miR-23b/24/27b cluster on chr9,
which is intronic and involved in hepatocellular differentiation(Rogler et al., 2009), and the miR-532/501/362/500/660 clusteron chrX, which is intronic and as yet has no known functions. We
observed discordant expression patterns among members ofseveral miRNA families, including the miR-30 family and let-7family, with only miR-30c/d and let-7e/f specifically induced at
late stages of differentiation (Fig. 2D). In addition, unlike miR-200a, which showed a transient dip in expression in the early
stages of differentiation, miR-200c was upregulated at thebeginning of differentiation and maintained its increasedexpression throughout the entire differentiation process,
suggesting (as in the case with the C19MC, miR-302, and miR-371/372/373 miRNAs) that miRNAs with similar seed sequences(in this case miR-200c and miR-200a/429) are regulated bydifferent mechanisms during pancreatic differentiation.
To confirm the dynamic changes of miRNA expression indifferentiated samples, we performed quantitative RT-PCR of
selected miRNAs in each group. Our data confirmed theexpression patterns of miR-372 (Group 1), miR-375 (Group 2),miR-200a (Group 3), miR-30d and let-7e (Group 4) thatcorrelates well with the microarray expression pattern
(supplementary material Fig. S1).
Comparison between cells differentiated in vitro andhuman pancreatic tissue samples
To identify miRNAs induced during the process of differentiation
that are likely to be important for pancreatic development, westudied the 92 miRNA probes that were highly expressed in thelate stages of hESC differentiation (Groups 3 and 4) in the
context of bona fide pancreas tissue, including fetal pancreas andadult beta islet samples. Hierarchical clustering showed that,among the 92 probes, 53 miRNA probes, including the miR-200a/c/429 (miR-200 family), miR-30b/c/d (the miR-30 family),
let-7e/99b/125a and miR-23b/24/27b, were enriched in both thelate stage differentiated derivatives and adult islet cells (Fig. 2D;Table 1), indicating that these miRNAs are likely to be bona fide
beta islet cell-associated miRNAs that are functionally involvedin the differentiation or maturation of human islet cells. The other39 miRNA probes, including the miR-532/501/362/500/660
cluster on chrX, were not enriched in the human adult isletsamples, but a large subset was highly expressed in the fetalpancreatic tissue samples, indicating that they may be transientlyexpressed during differentiation.
Changes in mRNA expression patterns duringdifferentiation
To identify gene expression changes involved in differentiationof human beta islet cells, genome-wide mRNA expression
profiling was performed using Illumina HT-12v4 expressionBeadChips on the same samples as the miRNA analysis. UsingANOVA, we identified 10,063 probes for genes differentially
expressed among the differentiated hESC samples (FDR,0.05,supplementary material Fig. S2A). As seen in the miRNAanalysis, bi-directional hierarchical clustering separated thehESC samples into two clusters, with the Stage 1 and 2
samples representing early stages of differentiation thatclustered together with undifferentiated hESCs, while the Stage3, 4, and 5 samples were clustered together and represented late
stage differentiation. Clustering of the probes resulted in fourdistinct categories (supplementary material Fig. S2B), with 3601probes upregulated during late stage differentiation. We then
studied these 3601 probes in the context of the same fetalpancreas and adult beta islet samples as were used in the miRNAanalysis, and identified 1524 mRNA probes that were highly
expressed both in the late stage hESC differentiation and humanpancreatic tissue samples (supplementary material Fig. S2A,C),suggesting that the corresponding transcripts may have functional
Journal of Cell Science 126 (17)3852
Journ
alof
Cell
Scie
nce
roles in differentiation to pancreatic beta islet cells. Gene
ontology (GO) analysis revealed that this set of 1524 genes is
enriched for genes in several relevant biological processes,
including the regulation of insulin secretion (supplementary
material Fig. S2D).
Integrated miRNA–mRNA analysis
Post-hoc ANOVA pair-wise comparisons were performed using
Tukey’s test to identify miRNAs and mRNAs that were uniquely
upregulated and downregulated at each stage of differentiation of
hESCs into beta islet-like cells (Tukey P-value ,0.05 and
expression fold-change .1.5; Fig. 3A). As expected, compared
to the undifferentiated hESCs, the derivatives from Stage 5
had the highest number of significantly upregulated and
downregulated miRNA and mRNA probes (Fig. 3B). To
discover factors that regulate the passage from one stage to the
next during islet cell differentiation, we also compared each
differentiation stage to the following stage. As shown in Fig. 3B,
there were 98 miRNA probes and 982 mRNA that were
differentially expressed between undifferentiated hESCs and
Stage 1 cells. The top 50 miRNAs and mRNAs are shown in
Fig. 3C, and include mir-200a/429 and the known definitive
endoderm-associated genes SOX17 and FOXA2. Comparison of
Stage 2 to Stage 3 revealed upregulation of critical pancreatic
progenitor genes, such as PDX1, ONECUT2 and RFX6 in the
Stage 3 samples, consistent with a transition between early stage
and late stage differentiation. In this way, we were able to
identify miRNAs and mRNAs associated with each transition
during pancreatic differentiation. Detailed information on all
significantly differentially expressed miRNA and mRNA probes
is provided in supplementary material Table S2 and Table S3.
To identify potential regulatory effects of miRNAs on gene
expression at each stage of differentiation, we performed
integrative analysis of the miRNA and mRNA expression data
in GALAXY, using bioinformatically predicted miRNA–mRNA
interactions from TargetScan 6.1 to link the two datasets. For
each predicted miRNA–mRNA interaction, the miRNA and
mRNA expression levels measured by the microarray analyses
were used to calculate a correlation coefficient (supplementary
material Table S4). We were most interested in two transitions:
between the pluripotent and definitive endoderm stages; and
between early and late differentiation. Given the interesting
expression patterns of the miR-200 and miR-30 miRNA families
as noted above, we focused on identifying the potential mRNA
targets of miR-200a/429 in the undifferentiated to Stage 1
transition, and mRNA targets of miR-30d in the Stage 2 to Stage
3 transition. Depending on the overall intracellular milieu, which
may contain other regulatory factors, and the specific mechanism
of miRNA repression at work for a particular miRNA–mRNA
pair, it is possible for miRNAs and their direct mRNA targets to
show anti-correlated, correlated, or uncorrelated expression. We
reasoned that anti-correlation might indicate a predominant effect
of the miRNA on regulation of the cognate mRNA at a specific
stage of differentiation, while correlation might indicate either an
indirect effect or ‘priming’ of the levels of miRNA to enable
rapid repression of the cognate mRNA at a later stage of
differentiation. Therefore we chose some anti-correlated and
some correlated miRNA–mRNA pairs for further study, and used
luciferase reporter assays to distinguish between direct and
indirect interactions.
Functional role of miR-200a in EMT and endoderm
specification
It is well known that the EMT process is required for germ layer
formation during early embryonic development (Arnold et al.,
2008). To investigate the potential role of the miR-200 family,
which has previously been described to regulate EMT in other
systems (Gregory et al., 2008), in endoderm specification via
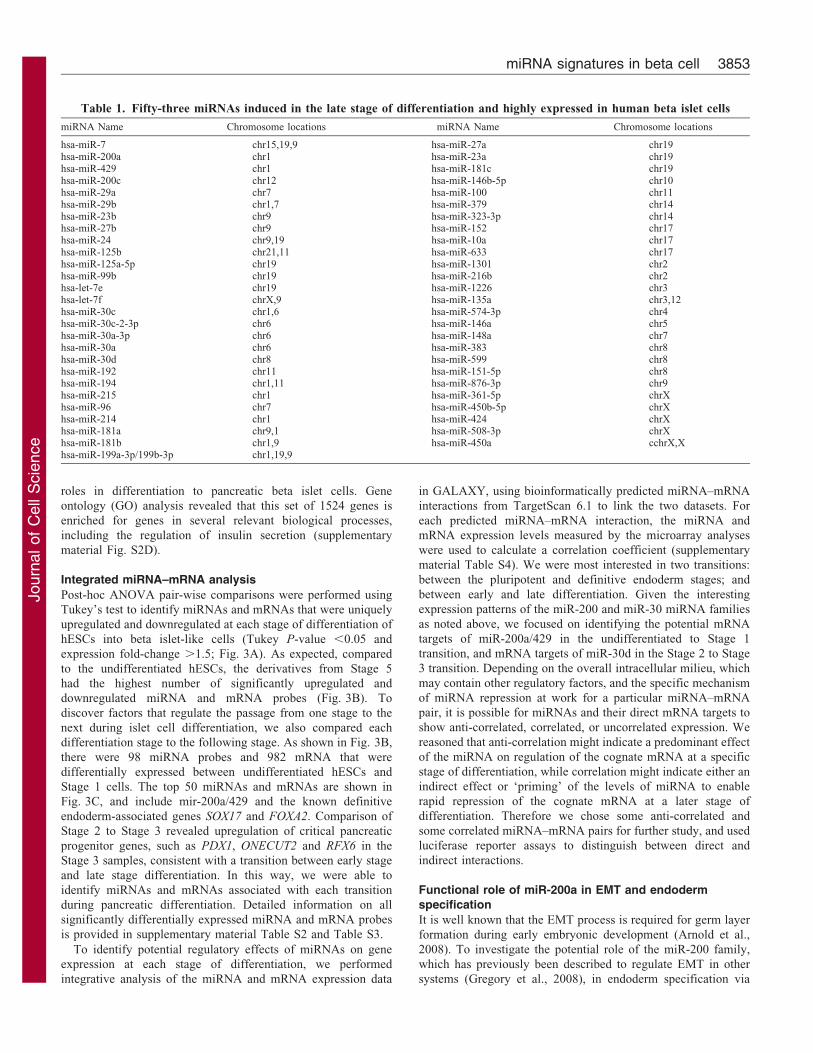
Table 1. Fifty-three miRNAs induced in the late stage of differentiation and highly expressed in human beta islet cells
miRNA Name Chromosome locations miRNA Name Chromosome locations
hsa-miR-7 chr15,19,9 hsa-miR-27a chr19hsa-miR-200a chr1 hsa-miR-23a chr19hsa-miR-429 chr1 hsa-miR-181c chr19hsa-miR-200c chr12 hsa-miR-146b-5p chr10hsa-miR-29a chr7 hsa-miR-100 chr11hsa-miR-29b chr1,7 hsa-miR-379 chr14hsa-miR-23b chr9 hsa-miR-323-3p chr14hsa-miR-27b chr9 hsa-miR-152 chr17hsa-miR-24 chr9,19 hsa-miR-10a chr17hsa-miR-125b chr21,11 hsa-miR-633 chr17hsa-miR-125a-5p chr19 hsa-miR-1301 chr2hsa-miR-99b chr19 hsa-miR-216b chr2hsa-let-7e chr19 hsa-miR-1226 chr3hsa-let-7f chrX,9 hsa-miR-135a chr3,12hsa-miR-30c chr1,6 hsa-miR-574-3p chr4hsa-miR-30c-2-3p chr6 hsa-miR-146a chr5hsa-miR-30a-3p chr6 hsa-miR-148a chr7hsa-miR-30a chr6 hsa-miR-383 chr8hsa-miR-30d chr8 hsa-miR-599 chr8hsa-miR-192 chr11 hsa-miR-151-5p chr8hsa-miR-194 chr1,11 hsa-miR-876-3p chr9hsa-miR-215 chr1 hsa-miR-361-5p chrXhsa-miR-96 chr7 hsa-miR-450b-5p chrXhsa-miR-214 chr1 hsa-miR-424 chrXhsa-miR-181a chr9,1 hsa-miR-508-3p chrXhsa-miR-181b chr1,9 hsa-miR-450a cchrX,Xhsa-miR-199a-3p/199b-3p chr1,19,9
miRNA signatures in beta cell 3853
Journ
alof
Cell
Scie
nce
Fig. 3. See next page for legend.
Journal of Cell Science 126 (17)3854
Journ
alof
Cell
Scie
nce
EMT, we explored the expression of E-cadherin (CDH1), a cell
adhesion protein that is expressed on epithelial cells, during
differentiation from the pluripotent state to definitive endoderm,
using expression of the endoderm-specific transcription factor
SOX17 to verify proper differentiation to definitive endoderm.
As shown in Fig. 4A, the expression of CDH1 was significantly
downregulated in the definitive endoderm cells. Moreover, the
expression of SOX17 and CDH1 in the cells was anti-correlated,
suggesting that EMT may be required for SOX17 expression and
endoderm-lineage specification (Fig. 4B). Interestingly, the
expression of CDH1 rebounded in the Stage 2 samples, with
mRNA levels (Fig. 4C) increasing more dramatically than
protein levels (Fig. 4B). We then examined the expression of
ZEB1 and ZEB2, two CDH1 repressors that were previously
shown to be negatively regulated by the miR-200 family, in the
early stage differentiation samples. qRT-PCR analysis revealed
that the expression of ZEB1 increased at Stage 1 but then
decreased at Stage 2, while ZEB2 was increased at Stage 2
(Fig. 4C), suggesting that the previously described regulatory
system consisting of miR-200a/429, ZEB1/ZEB2 and CDH1
might be involved in the regulation of EMT during endoderm
specification.
Since the 39UTRs of the endoderm-associated transcription
factors SOX17 and FOXA2 contained the miR-200a binding
sequence and had expression levels that were anti-correlated with
the miR-200a levels, we performed luciferase-based reporter
assays (Fig. 5A) to functionally test the regulatory effect of miR-
200a on SOX17 and FOXA2, and used a ZEB2 39UTR construct
as a positive control. Synthetic miR-200a mimics or inhibitors
were transiently co-transfected into human neonatal fibroblasts or
undifferentiated WA09 cells with reporter plasmids containing
the Renilla luciferase cDNA linked to the 39UTRs of ZEB2,
FOXA2, SOX17 or a mutated SOX17 39UTR (Fig. 5A).
Constitutive Firefly luciferase expression, encoded on the same
plasmid, was used to normalize transfection efficiency among
samples. As shown in Fig. 5B, the normalized luciferase
activities in the cells transfected with the SOX17 and ZEB2
39UTR reporter plasmids were significantly decreased by
treatment with miR-200a mimics and increased by treatment
with miR-200a inhibitors, indicating direct repression of these
transcripts by miR-200a. In contrast, the luciferase activities in
cells transfected with the FOXA2 or the mutated SOX17 39UTR
reporter plasmid were not affected by miR-200a mimics or
inhibitors (Fig. 5B). We further tested how the endogenous
miRNA content of cells undergoing differentiation changed the
normalized luciferase activities in cells transfected with the
39UTRs of SOX17, FOXA2 and other pancreatic differentiation-
related genes (supplementary material Fig. S3A). As shown in
Fig. 5C, the Stage 1 cells containing the SOX17 39UTR reporter
plasmid showed an increase in normalized luciferase activity
compared to the undifferentiated cells, with specificity
demonstrated by significant blockage of this effect by co-transfection of a synthetic miR-200a mimic (Fig. 5D). Incontrast, the mutated SOX17 39UTR reporter plasmid showed a
significantly lower increase in normalized luciferase activitycompared to wild-type SOX17 39UTR (Fig. 5C). The fact that themutated SOX17 39UTR reporter plasmid showed some increasein luciferase activity with differentiation suggests that there are
other sequences (outside the miR-200a binding site) regulatingSOX17 expression. This finding is consistent with the observationin Fig. 5D, showing that the addition of miR-200a mimic only
partially blocks the induction of the wild-type SOX17 reporterwith differentiation. Cells receiving the FOXA2 39UTR reporterplasmid also showed increased normalized luciferase activity on
days 2 and 3 of differentiation, but this increase could not beblocked by miR-200a treatment, further suggesting that miR-200a directly interacts with SOX17, but not FOXA2, and that
there is likely a different miRNA or other repressive factor thatinteracts with the FOXA2 39UTR (supplementary material Fig.S3B,C). Moreover, overexpression of miR-200a during earlystage differentiation resulted in a population of CDH1+/SOX172
cells, which is not normally seen during the differentiationprocess (Fig. 5E). Real-time PCR and western blotting furtherconfirmed the opposite regulation of SOX17 and CDH1 after
miR-200a treatment (Fig. 5F,G). These results suggest that miR-200a is critically involved in the normal regulation of EMT andendoderm lineage commitment through direct repression of ZEB2
and SOX17.
Functional role of miR-30d/let-7e in the maturation of betaislet precursor cells
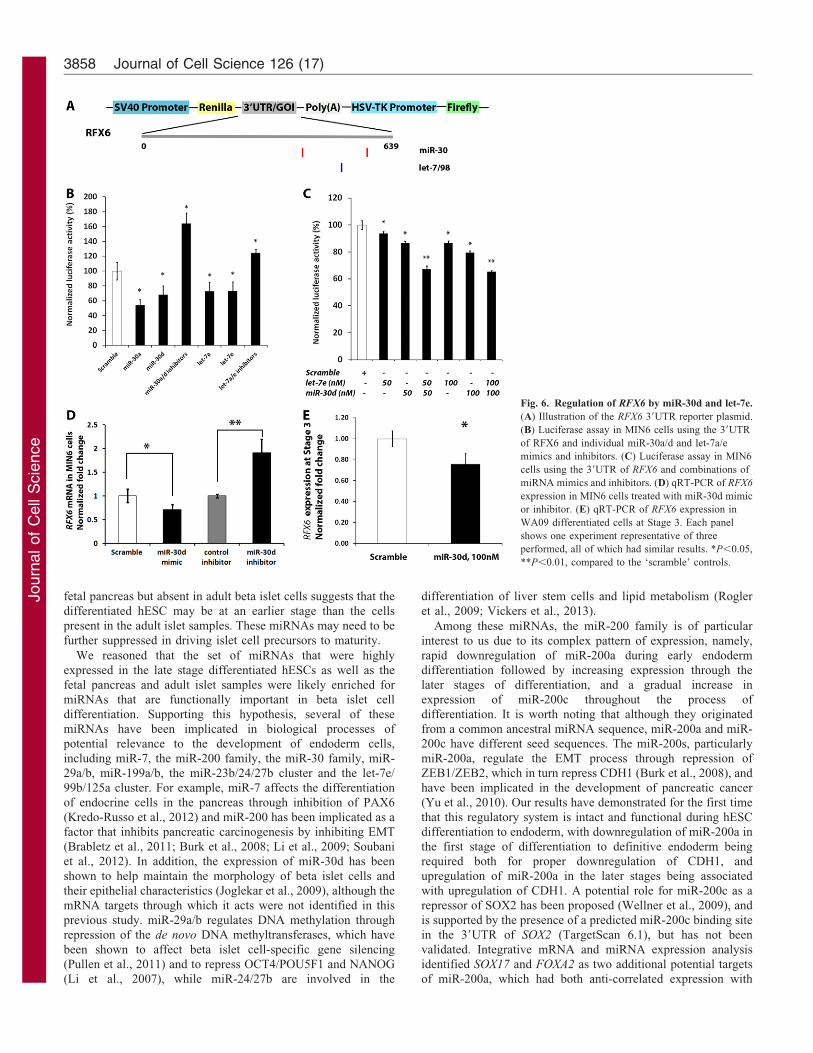
To understand miRNA–mRNA interactions during the transitionbetween early and late stage differentiation, we focused on miR-30d because it is one of the miRNAs highly expressed in both latestage differentiation and human islet cells (Fig. 2D; Table 1). Its
rapid induction during the transition from Stage 2 to Stage 3 wasparadoxically positively correlated with RFX6 expression, apancreatic beta cell progenitor gene that has two predicted
binding sites for miR-30d in its 39UTR (Fig. 6A). RFX6 is also apredicted target of the let-7 family, and we demonstrated in ourmicroarray profiling that let-7e and let-7f were significantly
induced during late stage differentiation (Fig. 2B). To validatethe predicted miR-30 and let-7 binding sites in the RFX6 39UTR,we performed luciferase assays using the RFX6 39UTR-
containing reporter plasmid in undifferentiated WA09 cells,MIN6 cells and fibroblasts. Our results demonstrated robust anddose-dependent repression of the normalized luciferase activityin all cells transfected with the RFX6 39UTR-containing reporter
by the miR-30d and let-7e mimics, and significant induction ofluciferase activity for the same reporters by the miR-30d inhibitor(data in MIN6 cells are shown in Fig. 6B,C). RT-PCR confirmed
the inhibitory effects of miR-30d on endogenous RFX6 mRNA inboth MIN6 and human islet cells (data in MIN6 cells are shownin Fig. 6D). We further demonstrated that treatment with miR-
30d mimics at Stage 3 of differentiation muted the stage-specificinduction of the RFX6 transcript normally seen during in vitro
differentiation of hESCs to beta islet-like cells by 25% (Fig. 6E).
DiscussionIn this study, we differentiated WA09 hESCs into pancreaticendoderm cells in a staged manner as a model system to identify
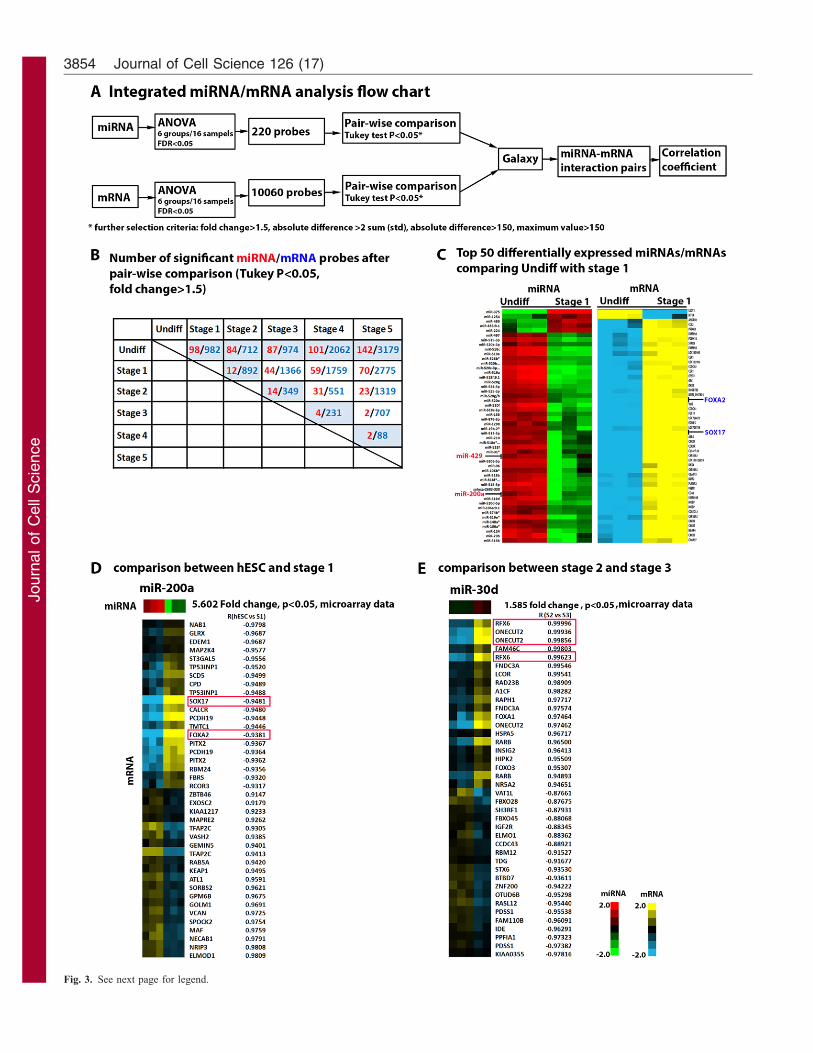
Fig. 3. Integrative miRNA–mRNA analysis. (A) Illustration of the analysis
workflow. (B) Tallies of significant miRNA and mRNA probes after filtering
using Tukey’s P-value (,0.05) and fold change (.1.5). (C) The top 50
differentially expressed miRNAs and mRNAs obtained by comparing
undifferentiated hESCs to Stage 1 definitive endoderm (ranked according to
fold-change and expression level in hESCs). (D) Top 20 positively and 20
anti-correlated mRNA targets of miR-200a from comparison between
undifferentiated hESCs and Stage 1 cells. (E) Top 20 positively and 20 anti-
correlated mRNA targets of miR-30d from comparison between Stage 2 and
Stage 3 cells.
miRNA signatures in beta cell 3855

Journ
alof
Cell
Scie
nce
the miRNA and mRNA expression signatures specific to eachstage of differentiation, and to identify the functional elements of
these signatures by comparing them to data from fetal and adult
pancreas samples.
Although previous studies have reported on the miRNA (Poy
et al., 2004; Rosero et al., 2010) or mRNA (Webb et al., 2000)
profiles of beta islet cells and fetal pancreas, or examined theeffects of global miRNA deficiency (Lynn et al., 2007;
Melkman-Zehavi et al., 2011) or specific miRNAs (Baroukh
et al., 2007; El Ouaamari et al., 2008; Melkman-Zehavi et al.,2011) on pancreatic development and expression of beta-cell
specific proteins, this report is the first to use matched miRNA
and mRNA data from an in vitro model of beta cell
differentiation in the context of bona fide fetal pancreas andadult islet samples. The analysis of these data enabled us
to identify several patterns of miRNA expression in
the differentiated hESCs, including loss of expression ofpluripotency-associated miRNAs and gain of expression
of some, but not all, of the pancreas-specific miRNAs. In terms
of the pluripotency-associated miRNAs, we noted that they weredownregulated in response to differentiation cues at variable
rates. In contrast to the rapid downregulation of certain miRNAs
(e.g. C19MC miRNA cluster), the expression of the miR-371/
372/373 and miR-302 families showed a more gradual trajectory.The sustained expression of these pluripotency-associated
families during early stage differentiation (definitive endoderm
in particular) is consistent with findings from a previous study(Hinton et al., 2010), and suggests that endoderm formation may
actually require persistent expression of certain pluripotency-
associated miRNAs.
We observed that hESCs that had undergone differentiation to
the later stages of the protocol (Stages 3, 4, and 5) acquired a
portion of the fetal pancreas-specific signatures, as well as aportion of the signatures shared by the fetal pancreas and adult
islet samples, suggesting that these differentiated hESCs were
following a trajectory toward the beta islet cell lineage, butwere at an immature stage. The identification of miRNAs that
were highly expressed in late stage differentiated samples and
Fig. 4. Differentiation of hESCs into definitive endoderm was
associated with downregulation of CDH1 and upregulation of
SOX17. (A). Immunocytochemistry showing undifferentiated
hESCs were positive for CDH1 and negative for SOX17.
(B) Double immunostaining showing that undifferentiated hESCs
co-expressed NANOG and CDH1. (C) qRT-PCR results showing
dynamic expression of SOX17, ZEB1, ZEB2 and CDH1 in
hESCs. Each panel shows one experiment that is representative
of three performed, all of which had similar results. Values are
means 6 s.e.m. of three samples. *P,0.05 for comparisons
between differentiated cells and control undifferentiated hESCs.
Journal of Cell Science 126 (17)3856

Journ
alof
Cell
Scie
nce
Fig. 5. Regulation of EMT and SOX17 expression by miR-200a during endoderm differentiation. (A) Illustration of the psiCHECK2 plasmid constructs
used for the dual luciferase assays and the relationship between the predicted miR-200a binding site in the SOX17 39UTR, the mir-200 seed sequence, and the
deletion in the mutated reporter. (B) Luciferase assay in undifferentiated hESCs performed using the 39 UTRs of FOXA2, SOX17 and ZEB2 and the miR-200a
mimic and inhibitor. (C) Luciferase assay in undifferentiated and differentiated hESCs using the 39UTRs of FOXA2 or SOX17 and the miR-200a inhibitor.
(D) Luciferase assay in undifferentiated and differentiated hESCs using the 39UTRs of FOXA2 or SOX17 and the miR-200 mimic. (E) Stage 1 definitive
endoderm cells immunostained for CDH1 and SOX17 with and without miR-200a mimic. (F) qRT-PCR for SOX17 and CDH1 mRNAs with and without
miR-200a mimic from Stage 1 definitive endoderm cells. For B–E, one representative experiment is shown. There were three replicates per experiment. The error
bars indicate the s.e.m.; *P,0.05. (G) Western blotting of Stage 1 definitive endoderm cells for SOX17, CDH1 and b-actin with and without the miR-200a mimic.
Two independent western blotting experiments were performed, and one blot is shown. The scatter plot shows the relative ratio between miR-200a and the
control mimics. The image intensity of the western blot was quantified using ImageJ. The ratios of SOX17 and CDH1 normalized to b-actin are shown. The points
are the individual ratios, and the horizontal bars are the means of the ratios.
miRNA signatures in beta cell 3857
Journ
alof
Cell
Scie
nce
fetal pancreas but absent in adult beta islet cells suggests that the
differentiated hESC may be at an earlier stage than the cells
present in the adult islet samples. These miRNAs may need to be
further suppressed in driving islet cell precursors to maturity.
We reasoned that the set of miRNAs that were highly
expressed in the late stage differentiated hESCs as well as the
fetal pancreas and adult islet samples were likely enriched for
miRNAs that are functionally important in beta islet cell
differentiation. Supporting this hypothesis, several of these
miRNAs have been implicated in biological processes of
potential relevance to the development of endoderm cells,
including miR-7, the miR-200 family, the miR-30 family, miR-
29a/b, miR-199a/b, the miR-23b/24/27b cluster and the let-7e/
99b/125a cluster. For example, miR-7 affects the differentiation
of endocrine cells in the pancreas through inhibition of PAX6
(Kredo-Russo et al., 2012) and miR-200 has been implicated as a
factor that inhibits pancreatic carcinogenesis by inhibiting EMT
(Brabletz et al., 2011; Burk et al., 2008; Li et al., 2009; Soubani
et al., 2012). In addition, the expression of miR-30d has been
shown to help maintain the morphology of beta islet cells and
their epithelial characteristics (Joglekar et al., 2009), although the
mRNA targets through which it acts were not identified in this
previous study. miR-29a/b regulates DNA methylation through
repression of the de novo DNA methyltransferases, which have
been shown to affect beta islet cell-specific gene silencing
(Pullen et al., 2011) and to repress OCT4/POU5F1 and NANOG
(Li et al., 2007), while miR-24/27b are involved in the
differentiation of liver stem cells and lipid metabolism (Rogler
et al., 2009; Vickers et al., 2013).
Among these miRNAs, the miR-200 family is of particular
interest to us due to its complex pattern of expression, namely,
rapid downregulation of miR-200a during early endoderm
differentiation followed by increasing expression through the
later stages of differentiation, and a gradual increase in
expression of miR-200c throughout the process of
differentiation. It is worth noting that although they originated
from a common ancestral miRNA sequence, miR-200a and miR-
200c have different seed sequences. The miR-200s, particularly
miR-200a, regulate the EMT process through repression of
ZEB1/ZEB2, which in turn repress CDH1 (Burk et al., 2008), and
have been implicated in the development of pancreatic cancer
(Yu et al., 2010). Our results have demonstrated for the first time
that this regulatory system is intact and functional during hESC
differentiation to endoderm, with downregulation of miR-200a in
the first stage of differentiation to definitive endoderm being
required both for proper downregulation of CDH1, and
upregulation of miR-200a in the later stages being associated
with upregulation of CDH1. A potential role for miR-200c as a
repressor of SOX2 has been proposed (Wellner et al., 2009), and
is supported by the presence of a predicted miR-200c binding site
in the 39UTR of SOX2 (TargetScan 6.1), but has not been
validated. Integrative mRNA and miRNA expression analysis
identified SOX17 and FOXA2 as two additional potential targets
of miR-200a, which had both anti-correlated expression with
Fig. 6. Regulation of RFX6 by miR-30d and let-7e.
(A) Illustration of the RFX6 39UTR reporter plasmid.
(B) Luciferase assay in MIN6 cells using the 39UTR
of RFX6 and individual miR-30a/d and let-7a/e
mimics and inhibitors. (C) Luciferase assay in MIN6
cells using the 39UTR of RFX6 and combinations of
miRNA mimics and inhibitors. (D) qRT-PCR of RFX6
expression in MIN6 cells treated with miR-30d mimic
or inhibitor. (E) qRT-PCR of RFX6 expression in
WA09 differentiated cells at Stage 3. Each panel
shows one experiment representative of three
performed, all of which had similar results. *P,0.05,
**P,0.01, compared to the ‘scramble’ controls.
Journal of Cell Science 126 (17)3858

Journ
alof
Cell
Scie
nce
miR-200a and contained miR-200a binding sites in their 39UTRs.We experimentally demonstrated for the first time that SOX17,but not FOXA2, is directly repressed by miR-200a. Taken
together, these results suggest that complex patterns ofexpression and targeting of the different miR-200 familymembers appears to promote endoderm lineage differentiation
through coordinated repression of a pluripotency factor (SOX2),promotion of EMT, and de-repression of SOX17.
RFX6 contains predicted binding sites for miR-30d and let-7,but unexpectedly had an expression pattern that was positively
correlated with those of these miRNAs. Since we were able toexperimentally validate direct repression of RFX6 by miR-30dand let-7, we hypothesize that the inhibitory effects of miR-30d
and let-7e were counteracted during hESC differentiation fromStage 2 to Stage 3 by other regulatory mechanisms. When cellswere further differentiated into Stage 4 pancreatic precursors, theexpression of RFX6 and the miRNAs were anti-correlated,
mostly due to decreased RFX6 expression. This pattern of RFX6
expression was also observed in a mouse study, in which RFX6
was initially expressed in all pancreatic and gut endoderm cells
and then became progressively restricted to the endocrine lineageby an unknown regulatory mechanism (Smith et al., 2010; Soyeret al., 2010). Our results, including the novel findings that RFX6
is a direct target of miR-30d and let-7, and that expression levelsof the RFX6 transcript and these miRNAs are correlated in somecontexts and anti-correlated in others, suggest that there are
multiple competing regulatory factors controlling the expressionof RFX6 expression during the course of pancreatic development,and that the interplay among these factors may influence theorder and timing of the events in this process.
In conclusion, we performed comprehensive miRNA and
mRNA expression profiling to identify the dynamic expressionspatterns that are present during in vitro differentiation of hESCs tobeta islet-like cells, to assess the relationships between
differentiated hESCs and bona fide pancreatic tissue samples(fetal pancreas and adult islets), and to identify novel miRNA–mRNA interactions that regulate the differentiation process.
Experimental confirmation of miRNA–mRNA interactionsestablished a critical role of miR-200a in regulating both EMTand definitive endoderm formation, through direct repression of
ZEB2 and SOX17, during early stage differentiation. In addition,we found that miR-30d and let-7e regulate the pancreaticprogenitor gene RFX6 during late stage differentiation. Our datahighlight the importance of precise control of target mRNA
expression by miRNAs to ensure proper lineage specificationduring the differentiation process. The miRNA signaturesidentified in this study may also be useful for future
investigations aimed at characterizing specific miRNAs involvedin pancreatic beta islet cell regeneration and pathogenesis.
Materials and MethodsCell culture and tissue samples
Undifferentiated WA09 cells were maintained in the absence of feeder cells onGeltrex (1:200, Life Technologies) at 37 C̊, 5% CO2 in DMEM/F12 mediumsupplemented with 2% Stempro supplement (Life Technologies, Carlsbad, CA), 2%BSA, 4 ng/ml recombinant human FGF2 (R&D Systems), 2-mercaptoethanol(0.55 mM, Life Technologies) and 1% Glutamax. Cells were plated at a density of60,000–100,000 cells per well in 24-well Geltrex-coated tissue culture plates and feddaily with fresh medium. Differentiation was carried out as previously described(D’Amour et al., 2006) with minor modifications. Briefly, 1% BSA and 1% NEAAwere added in the first 3 days of treatment to increase cell viability. The ABI-13Dcell line and hiPSCs were cultured and differentiated in the same conditions asWA09. MIN6 was cultured as previously described (Tang et al., 2009). Fetalpancreas samples were collected according to an approved IRB protocol at UCSD
(IRB #081510ZX) in collaboration with Planned Parenthood of the PacificSouthwest. Purified human beta islet cells were obtained through subscription tothe Integrated Islet Distribution Program (IIDP, http://iidp.coh.org/).
Immunocytochemistry
Cultured cells were fixed for 15 minutes at room temperature in 4% paraformaldehydedissolved in 16 phosphate-buffered saline (PBS). After fixation, cells were washedthree times in PBS, and blocked for 1 hour in blocking solution that contains 0.1%Triton X-100, 2% BSA and 2% low fat milk in PBS. Primary antibodies diluted in thesame blocking solution were incubated for 1–2 hours at room temperature orovernight at 4 C̊. Secondary antibodies diluted in blocking solution were incubated for0.5–1 hour at room temperature. The following antibodies and dilutions were used:primary mouse monoclonal anti-TRA-181 IgG 1:100 (Santa Cruz Biotechnology, sc-21706); mouse anti-POU5F11:100 (Santa Cruz Biotechnology, SC-9081); goat anti-SOX17, 1:100 (R&D system, AF1924); goat anti-HNF1b, 1:100 (Santa CruzBiotechnology, SC-7411); goat anti-PDX1, 1:100 (R&D system, AB3243); rabbitanti-HNF6, 1:100 (Santa Cruz Biotechnology, SC-13050); mouse anti-NKX2-2, 1:10(Developmental Studies Hybridoma Bank, 74.5A5); mouse anti-NKX6-1 (F55A12);guinea pig anti-insulin, 1:200 (Dako, A0564), mouse anti-E-Cadherin (R&D,MAB1838). Cy3- and Cy5-conjugated donkey antibodies against mouse, rabbit andguinea pig (Jackson ImmunoResearch Laboratories), or Alexa-Fluor-488- and Alexa-Fluor-555-conjugated donkey antibodies against mouse, rat, rabbit, guinea pig or goat(Molecular Probes) were used at 1:400 dilution.
RNA purification and real-time quantitative PCR
Total RNA, including miRNA, was purified from all cell types using themirVANA miRNA Isolation Kit (Ambion, Austin, TX). RNA quantitation wasperformed using QubitH RNA Assay Kit (Life Technologies). RNA quality wasassessed using the Agilent 2100 Bioanalyzer. For cells cultured in dishes, the RIN(RNA integrity number) was always more than 9.0. For tissue samples, RIN .8.0was accepted. For real-time quantitative PCR of mRNA, 500 ng RNA was firstreverse transcribed into cDNA using QuantiTect reverse transcription kit (Qiagen).PCR reactions were carried out in duplicate with QuantiTect SYBR Green mastermix (Qiagen) according to the manufacturer’s instructions. Quantified values foreach gene of interest were normalized against the input determined by twohousekeeping genes (GAPDH and b-actin). For real-time quantitative PCR ofmiRNA, 10 ng RNA was reverse transcribed using RNA-specific stem-looped RTprimers and amplifications were carried out by Taqman probes (AppliedBiosystems Inc.). RNU44 were used as endogenous control for real-timequantification of miRNA according to the manufacturer’s instructions. Afternormalization, the samples were plotted relative to control samples in the datasetand the standard deviation of at least three gene expression measurements wasreported. Information about primer sequences is provided in supplementarymaterial Table S5.
Microarray analysis and data processing
The miRNA expression data were acquired on the Illumina Human v2 miRNAplatform (with 1146 miRNA probes) and the mRNA expression data was acquiredon the Illumina Human HT-12 v4 gene expression microarray (.40,000 mRNAtranscripts), using 200 ng total RNA per sample each. Gene expression valueswere first filtered by detection P-value in Genome studio with a cutoff value of,0.01 in at least one sample. The miRNA expression data was then quantilenormalized using CLC bio (Muehltal, Germany), while the mRNA data wasnormalized using robust spline normalization (RSN) with lumi in R 2.13.1 (scriptsavailable upon request). ANOVA and post-hoc ANOVA Tukey’s tests wereperformed using SAS 9.3 software (scripts are available upon request).Hierarchical clustering was performed by Cluster 3.0 with uncenteredcorrelation and complete linkage (Eisen et al., 1998), or by Expander 6.0CLICK clustering module with homogeneity value set up as 1.0. The heatmapswere produced by Java Treeview (after cluster 3.0) or by Expander 6.0 afterCLICK clustering. The integrated miRNA and mRNA data analysis was performedin GALAXY. The miRNA target prediction algorithms were set as TargetScan 6.1.Gene ontology analysis was performed using DAVID Bioinformatics Resources6.7 (http://david.abcc.ncifcrf.gov/).
Construction of reporter plasmids
psiCHECK2 vector was purchased from Promega. To generate reporter plasmidsof multiple genes simultaneously, the Multisite Gateway system (LifeTechnologies) was used following the manufacturer’s instructions. Briefly,10 mg of psiCHECK2 DNA was digested using EcoRI and blunt-ended withKlenow I DNA polymerase. The R1-ccdB-chloramphenicol-R2 (R1R2) cassettewas purified from pLenti 6.2V5 (Life Technologies) after being digested withEcoRV. The R1R2 cassette was then ligated into psiCHECK2 to create a destvector for future use. Genomic DNA from WA09 hESCs was isolated using theQiagen DNAeasy Blood and Tissue kit, to serve as template for the following PCRreactions. The full length 39UTR sequences of human genes RFX6, NKX2_2,ONECUT, FOXA2, SOX17, PAX6, NEUROD, ISL1 and ZEB2 were obtained from
miRNA signatures in beta cell 3859

Journ
alof
Cell
Scie
nce
GenBank and amplified respectively using standard procedures with the primerslisted in supplementary material Table S6. BP reactions were set up using thepDONR221 vector (Life Technologies) and the above PCR products containingB1B2 adapters. The products were L1L2 entry vectors for each gene. To generatethe mutated SOX17 39UTR reporter plasmid, we eliminate the binding site ofSOX17 39UTR (cagtgtt) with primer pairs designed to amplify the entry vectorp221 L1-Sox17 39UTR-L2 using PlatinumH PCR SuperMix High Fidelity (cat. no.12532-016 Invitrogen). Finally, these entry vectors were cloned into R1R2 destvector respectively to assemble the 39UTR sequences downstream of the Renillaluciferase expression cassette, which allows assessment of the effect of the 39UTRon transcript stability by Renilla luciferase activity. Firefly luciferase expression isdriven off the HSV-TK promoter on the same plasmid to control for well-to-wellvariation in transfection efficiency. All of the reporter constructs were verified bysequencing.
miRNA and/or reporter plasmid transfectionWA09 cells of passages 40–60 maintained feeder-free on Geltrex-coated plateswere fed daily with Stempro medium (Life Technologies) and split ,1:6 whenconfluent using Accutase (Life Technologies). About 60,000–100,000 cells wereplated in each well of a 24-well tissue culture plate coated with Geltrex. On day 1,cells were transfected with 4 mg reporter plasmid with or without 50–100 nMmiRNA mimics or hairpin inhibitors (Dharmacon). The transfection reagent usedfor hESCs, including WA09, ABI-13D and iPSCs was FuGene HD (Roche) at 2–4 ml/well in 24-well plates. Dy547-labeled miRNA inhibitor (Dharmacon) wasused as a transfection control. Synthetic miRNA mimics or hairpin inhibitors wereall purchased from Dharmacon.
Luciferase assayAdherent cells transfected with miRNA reporter plasmids with or without miRNAmimics or inhibitors were processed using the Promega Dual Luciferase ReporterAssay Kit according to the manufacturer’s instructions. The assay was performedon a Synergy HT Multi-Mode Microplate Reader (Biotek) using injectorspreprogrammed according to the manufacturer’s recommendations (Gen5). Datawas first normalized to the constitutively expressed firefly luciferase gene and thencompared to scramble control (for mimics) or control inhibitors (for hairpininhibitors). Data was reported as a percentage with control being 100.
Western blot assayDifferentiating WA09 cells were transfected with miR-200a mimics (200 nM) onday 0 and day 2 of differentiation and harvested on day 3 in RIPA buffercontaining 1% NP40, 0.5% sodium deoxycholate, 0.1% SDS, 0.5 mMphenylmethylsulfonyl fluoride, and 1% HaltTM protease inhibitor cocktail(Thermo Scientific). Equivalent amounts of proteins (,10 ng) were resolved bySDS-PAGE and then transferred to nitrocellulose membranes for immunoblottingas described previously (Wang et al., 2008b). The primary antibodies (SOX17 andCDH1) used here were the same as used for immunocytochemistry. ACTINantibody was purchased from MP Biomedicals. The intensity of western blot bandswas quantified with ImageJ software.
Statistical analysisFor experiments with three independent replicates, a paired two-tailed t-test wasused to test for significance between the controls and experimental samples. In allfigures, the mean 6 standard deviation was plotted. A single asterisk indicatesP#0.05 and a double asterisk indicates P#0.01 in the t-test.
AcknowledgementsThe authors thank Candace Lynch, Ha Tran, Trevor R. Leonardo,Sergio Mora Castilla and Francesca S. Boscolo for technicalassistance, and Robert Morey, Rathi Thiagarajan and IvkaAfrikanova for critical reading of this manuscript. The fetal tissueswere obtained under UCSD IRB approval through a collaborationwith Planned Parenthood of the Pacific Southwest, with theassistance of Mana Parast and Sandra Leon-Garcia. The adult isletswere obtained from the NIH-supported Islet Cell Resource.
Author contributionsX.L. and L.C.L. designed the study. X.L. performed the experimentswith assistance of H.X., Y.-C.W., S.G. and N.T. X.L., K.N., Y.C.W.and L.C.L. analyzed the data. X.L. and L.C.L. wrote the manuscriptwith assistance of Y.C.W., S.E.P., Y.L., and J.F.L.
FundingThis work was supported by the Hartwell Foundation [IndividualBiomedical Research Award to L.C.L., supporting L.C.L., X.L., and
H.X.]; a Marie and Jimmy Mayer Award for Melanoma Researchfrom the Marie Mayer Foundation [postdoctoral fellowship awardsupporting Y.C.W.]; an Autism Speaks Dennis Weatherstonefellowship [supporting K.L.N.]; the California Institute forRegenerative Medicine [grant numbers RT1-01108, TR1-01250,CL1-00502 to J.F.L. and S.E.P.]; the National Institutes of Health[grant number R21 MH087925 to J.F.L. and S.E.P.]; the EstherO’Keeffe Foundation [supporting J.F.L. and S.E.P.]; a CaliforniaInstitute for Regenerative Medicine Tools and Technology Award[grant number RT1-011071 to Y.L. and supporting Y.L. and H.X.];UTHealth Department funds [postdoctoral fellowship awardsupporting Y.L. and H.X.]; and a National Institutes of Health/National Institute of Child Health and Human Development CareerDevelopment Award [grant number K12 HD001259 to L.C.L.].Deposited in PMC for release after 12 months.
Supplementary material available online at
http://jcs.biologists.org/lookup/suppl/doi:10.1242/jcs.123570/-/DC1
ReferencesAmbasudhan, R., Talantova, M., Coleman, R., Yuan, X., Zhu, S., Lipton, S. A. and
Ding, S. (2011). Direct reprogramming of adult human fibroblasts to functional
neurons under defined conditions. Cell Stem Cell 9, 113-118.
Arnold, S. J., Hofmann, U. K., Bikoff, E. K. and Robertson, E. J. (2008). Pivotal
roles for eomesodermin during axis formation, epithelium-to-mesenchyme transition
and endoderm specification in the mouse. Development 135, 501-511.
Baroukh, N., Ravier, M. A., Loder, M. K., Hill, E. V., Bounacer, A., Scharfmann,
R., Rutter, G. A. and Van Obberghen, E. (2007). MicroRNA-124a regulates Foxa2
expression and intracellular signaling in pancreatic beta-cell lines. J. Biol. Chem. 282,
19575-19588.
Bartel, D. P. (2004). MicroRNAs: genomics, biogenesis, mechanism, and function. Cell
116, 281-297.
Bartel, D. P. (2009). MicroRNAs: target recognition and regulatory functions. Cell 136,
215-233.
Brabletz, S., Bajdak, K., Meidhof, S., Burk, U., Niedermann, G., Firat, E., Wellner,
U., Dimmler, A., Faller, G., Schubert, J. et al. (2011). The ZEB1/miR-200 feedback
loop controls Notch signalling in cancer cells. EMBO J. 30, 770-782.
Brissova, M., Fowler, M. J., Nicholson, W. E., Chu, A., Hirshberg, B., Harlan, D. M.
and Powers, A. C. (2005). Assessment of human pancreatic islet architecture and
composition by laser scanning confocal microscopy. J. Histochem. Cytochem. 53,
1087-1097.
Burk, U., Schubert, J., Wellner, U., Schmalhofer, O., Vincan, E., Spaderna, S. and
Brabletz, T. (2008). A reciprocal repression between ZEB1 and members of the miR-
200 family promotes EMT and invasion in cancer cells. EMBO Rep. 9, 582-589.
Cabrera, O., Berman, D. M., Kenyon, N. S., Ricordi, C., Berggren, P. O. and
Caicedo, A. (2006). The unique cytoarchitecture of human pancreatic islets has
implications for islet cell function. Proc. Natl. Acad. Sci. USA 103, 2334-2339.
D’Amour, K. A., Bang, A. G., Eliazer, S., Kelly, O. G., Agulnick, A. D., Smart,
N. G., Moorman, M. A., Kroon, E., Carpenter, M. K. and Baetge, E. E. (2006).
Production of pancreatic hormone-expressing endocrine cells from human embryonic
stem cells. Nat. Biotechnol. 24, 1392-1401.
Doench, J. G. and Sharp, P. A. (2004). Specificity of microRNA target selection in
translational repression. Genes Dev. 18, 504-511.
Eisen, M. B., Spellman, P. T., Brown, P. O. and Botstein, D. (1998). Cluster analysis
and display of genome-wide expression patterns. Proc. Natl. Acad. Sci. USA 95,
14863-14868.
El Ouaamari, A., Baroukh, N., Martens, G. A., Lebrun, P., Pipeleers, D. and van
Obberghen, E. (2008). miR-375 targets 39-phosphoinositide-dependent protein
kinase-1 and regulates glucose-induced biological responses in pancreatic beta-cells.
Diabetes 57, 2708-2717.
Gerrits, A., Walasek, M. A., Olthof, S., Weersing, E., Ritsema, M., Zwart, E., van
Os, R., Bystrykh, L. V. and de Haan, G. (2012). Genetic screen identifies
microRNA cluster 99b/let-7e/125a as a regulator of primitive hematopoietic cells.
Blood 119, 377-387.
Gregory, P. A., Bert, A. G., Paterson, E. L., Barry, S. C., Tsykin, A., Farshid, G.,
Vadas, M. A., Khew-Goodall, Y. and Goodall, G. J. (2008). The miR-200 family
and miR-205 regulate epithelial to mesenchymal transition by targeting ZEB1 and
SIP1. Nat. Cell Biol. 10, 593-601.
Guo, T. and Hebrok, M. (2009). Stem cells to pancreatic beta-cells: new sources for
diabetes cell therapy. Endocr. Rev. 30, 214-227.
Guo, S., Lu, J., Schlanger, R., Zhang, H., Wang, J. Y., Fox, M. C., Purton, L. E.,
Fleming, H. H., Cobb, B., Merkenschlager, M. et al. (2010). MicroRNA miR-125a
controls hematopoietic stem cell number. Proc. Natl. Acad. Sci. USA 107, 14229-14234.
Hinton, A., Afrikanova, I., Wilson, M., King, C. C., Maurer, B., Yeo, G. W., Hayek,
A. and Pasquinelli, A. E. (2010). A distinct microRNA signature for definitive
endoderm derived from human embryonic stem cells. Stem Cells Dev. 19, 797-807.
Journal of Cell Science 126 (17)3860
Journ
alof
Cell
Scie
nce
Ivey, K. N., Muth, A., Arnold, J., King, F. W., Yeh, R. F., Fish, J. E., Hsiao, E. C.,
Schwartz, R. J., Conklin, B. R., Bernstein, H. S. et al. (2008). MicroRNA regulationof cell lineages in mouse and human embryonic stem cells. Cell Stem Cell 2, 219-229.
Joglekar, M. V., Patil, D., Joglekar, V. M., Rao, G. V., Reddy, D. N., Mitnala, S.,
Shouche, Y. and Hardikar, A. A. (2009). The miR-30 family microRNAs conferepithelial phenotype to human pancreatic cells. Islets 1, 137-147.
Judson, R. L., Babiarz, J. E., Venere, M. and Blelloch, R. (2009). Embryonic stem cell-specific microRNAs promote induced pluripotency. Nat. Biotechnol. 27, 459-461.
Kelly, O. G., Chan, M. Y., Martinson, L. A., Kadoya, K., Ostertag, T. M., Ross,
K. G., Richardson, M., Carpenter, M. K., D’Amour, K. A., Kroon, E. et al.
(2011). Cell-surface markers for the isolation of pancreatic cell types derived fromhuman embryonic stem cells. Nat. Biotechnol. 29, 750-756.
Kredo-Russo, S., Mandelbaum, A. D., Ness, A., Alon, I., Lennox, K. A., Behlke,
M. A. and Hornstein, E. (2012). Pancreas-enriched miRNA refines endocrine celldifferentiation. Development 139, 3021-3031.
Kroon, E., Martinson, L. A., Kadoya, K., Bang, A. G., Kelly, O. G., Eliazer, S.,
Young, H., Richardson, M., Smart, N. G., Cunningham, J. et al. (2008). Pancreaticendoderm derived from human embryonic stem cells generates glucose-responsiveinsulin-secreting cells in vivo. Nat. Biotechnol. 26, 443-452.
Laurent, L. C., Chen, J., Ulitsky, I., Mueller, F. J., Lu, C., Shamir, R., Fan, J. B. and Loring,
J. F. (2008). Comprehensive microRNA profiling reveals a unique human embryonic stem cellsignature dominated by a single seed sequence. Stem Cells 26, 1506-1516.
Lewis, B. P., Shih, I. H., Jones-Rhoades, M. W., Bartel, D. P. and Burge, C. B.
(2003). Prediction of mammalian microRNA targets. Cell 115, 787-798.
Li, J. Y., Pu, M. T., Hirasawa, R., Li, B. Z., Huang, Y. N., Zeng, R., Jing, N. H.,
Chen, T., Li, E., Sasaki, H. et al. (2007). Synergistic function of DNAmethyltransferases Dnmt3a and Dnmt3b in the methylation of Oct4 and Nanog.Mol. Cell. Biol. 27, 8748-8759.
Li, Y., VandenBoom, T. G., 2nd, Kong, D., Wang, Z., Ali, S., Philip, P. A. and Sarkar,
F. H. (2009). Up-regulation of miR-200 and let-7 by natural agents leads to the reversalof epithelial-to-mesenchymal transition in gemcitabine-resistant pancreatic cancercells. Cancer Res. 69, 6704-6712.
Liao, B., Bao, X., Liu, L., Feng, S., Zovoilis, A., Liu, W., Xue, Y., Cai, J., Guo, X.,
Qin, B. et al. (2011). MicroRNA cluster 302-367 enhances somatic cellreprogramming by accelerating a mesenchymal-to-epithelial transition. J. Biol.
Chem. 286, 17359-17364.
Lin, S. L., Chang, D. C., Chang-Lin, S., Lin, C. H., Wu, D. T., Chen, D. T. and Ying,
S. Y. (2008). Mir-302 reprograms human skin cancer cells into a pluripotent ES-cell-like state. RNA 14, 2115-2124.
Lynn, F. C., Skewes-Cox, P., Kosaka, Y., McManus, M. T., Harfe, B. D. and
German, M. S. (2007). MicroRNA expression is required for pancreatic islet cellgenesis in the mouse. Diabetes 56, 2938-2945.
Melkman-Zehavi, T., Oren, R., Kredo-Russo, S., Shapira, T., Mandelbaum, A. D.,
Rivkin, N., Nir, T., Lennox, K. A., Behlke, M. A., Dor, Y. et al. (2011). miRNAscontrol insulin content in pancreatic b-cells via downregulation of transcriptionalrepressors. EMBO J. 30, 835-845.
Miura, K., Miura, S., Yamasaki, K., Higashijima, A., Kinoshita, A., Yoshiura,
K. and Masuzaki, H. (2010). Identification of pregnancy-associated microRNAs inmaternal plasma. Clin. Chem. 56, 1767-1771.
Ozcan, S. (2009). MiR-30 family and EMT in human fetal pancreatic islets. Islets 1,283-285.
Poy, M. N., Eliasson, L., Krutzfeldt, J., Kuwajima, S., Ma, X., Macdonald, P. E.,
Pfeffer, S., Tuschl, T., Rajewsky, N., Rorsman, P. et al. (2004). A pancreatic islet-specific microRNA regulates insulin secretion. Nature 432, 226-230.
Pullen, T. J., da Silva Xavier, G., Kelsey, G. and Rutter, G. A. (2011). miR-29a andmiR-29b contribute to pancreatic beta-cell-specific silencing of monocarboxylatetransporter 1 (Mct1). Mol. Cell. Biol. 31, 3182-3194.
Ren, J., Jin, P., Wang, E., Marincola, F. M. and Stroncek, D. F. (2009). MicroRNAand gene expression patterns in the differentiation of human embryonic stem cells.J. Transl. Med. 7, 20.
Rogler, C. E., Levoci, L., Ader, T., Massimi, A., Tchaikovskaya, T., Norel, R. and
Rogler, L. E. (2009). MicroRNA-23b cluster microRNAs regulate transforminggrowth factor-beta/bone morphogenetic protein signaling and liver stem celldifferentiation by targeting Smads. Hepatology 50, 575-584.
Rosero, S., Bravo-Egana, V., Jiang, Z., Khuri, S., Tsinoremas, N., Klein, D.,Sabates, E., Correa-Medina, M., Ricordi, C., Domı́nguez-Bendala, J. et al. (2010).MicroRNA signature of the human developing pancreas. BMC Genomics 11, 509.
Smith, S. B., Qu, H. Q., Taleb, N., Kishimoto, N. Y., Scheel, D. W., Lu, Y., Patch,A. M., Grabs, R., Wang, J., Lynn, F. C. et al. (2010). Rfx6 directs islet formationand insulin production in mice and humans. Nature 463, 775-780.
Soubani, O., Ali, A. S., Logna, F., Ali, S., Philip, P. A. and Sarkar, F. H. (2012). Re-expression of miR-200 by novel approaches regulates the expression of PTEN andMT1-MMP in pancreatic cancer. Carcinogenesis 33, 1563-1571.
Soyer, J., Flasse, L., Raffelsberger, W., Beucher, A., Orvain, C., Peers, B.,
Ravassard, P., Vermot, J., Voz, M. L., Mellitzer, G. et al. (2010). Rfx6 is an Ngn3-dependent winged helix transcription factor required for pancreatic islet celldevelopment. Development 137, 203-212.
Srivastava, D. and Ieda, M. (2012). Critical factors for cardiac reprogramming. Circ.
Res. 111, 5-8.Tang, X., Muniappan, L., Tang, G. and Ozcan, S. (2009). Identification of glucose-
regulated miRNAs from pancreatic beta cells reveals a role for miR-30d in insulintranscription. RNA 15, 287-293.
Van Hoof, D., D’Amour, K. A. and German, M. S. (2009). Derivation of insulin-producing cells from human embryonic stem cells. Stem Cell Res. 3, 73-87.
Vickers, K. C., Shoucri, B. M., Levin, M. G., Wu, H., Pearson, D. S., Osei-Hwedieh, D.,
Collins, F. S., Remaley, A. T. and Sethupathy, P. (2013). MicroRNA-27b is a regulatoryhub in lipid metabolism and is altered in dyslipidemia. Hepatology 57, 533-542.
Wang, Y., Baskerville, S., Shenoy, A., Babiarz, J. E., Baehner, L. and Blelloch, R.
(2008a). Embryonic stem cell-specific microRNAs regulate the G1-S transition andpromote rapid proliferation. Nat. Genet. 40, 1478-1483.
Wang, Y. C., Kulp, S. K., Wang, D., Yang, C. C., Sargeant, A. M., Hung, J. H., Kashida,
Y., Yamaguchi, M., Chang, G. D. and Chen, C. S. (2008b). Targeting endoplasmicreticulum stress and Akt with OSU-03012 and gefitinib or erlotinib to overcomeresistance to epidermal growth factor receptor inhibitors. Cancer Res. 68, 2820-2830.
Webb, G. C., Akbar, M. S., Zhao, C. and Steiner, D. F. (2000). Expression profilingof pancreatic beta cells: glucose regulation of secretory and metabolic pathway genes.Proc. Natl. Acad. Sci. USA 97, 5773-5778.
Wellner, U., Schubert, J., Burk, U. C., Schmalhofer, O., Zhu, F., Sonntag, A.,
Waldvogel, B., Vannier, C., Darling, D., zur Hausen, A. et al. (2009). The EMT-activator ZEB1 promotes tumorigenicity by repressing stemness-inhibitingmicroRNAs. Nat. Cell Biol. 11, 1487-1495.
Xie, R., Everett, L. J., Lim, H. W., Patel, N. A., Schug, J., Kroon, E., Kelly, O. G.,
Wang, A., D’Amour, K. A., Robins, A. J. et al. (2013). Dynamic chromatinremodeling mediated by polycomb proteins orchestrates pancreatic differentiation ofhuman embryonic stem cells. Cell Stem Cell 12, 224-237.
Yu, J., Ohuchida, K., Mizumoto, K., Sato, N., Kayashima, T., Fujita, H., Nakata,K. and Tanaka, M. (2010). MicroRNA, hsa-miR-200c, is an independent prognosticfactor in pancreatic cancer and its upregulation inhibits pancreatic cancer invasion butincreases cell proliferation. Mol. Cancer 9, 169.
Zhou, Q., Brown, J., Kanarek, A., Rajagopal, J. and Melton, D. A. (2008). In vivoreprogramming of adult pancreatic exocrine cells to beta-cells. Nature 455, 627-632.
Zhu, X. M., Han, T., Sargent, I. L., Yin, G. W. and Yao, Y. Q. (2009).Differential expression profile of microRNAs in human placentas frompreeclamptic pregnancies vs normal pregnancies. Am. J. Obstet. Gynecol. 200,661.e1-661.e7.
miRNA signatures in beta cell 3861