material comparators for end-of-waste decisions - gov.uk · material comparators for end-of-waste...
TRANSCRIPT

Material comparators for end-of-waste decisions
Materials for fuels: coal
Report – SC130040/R9
Version 2

ii Product comparators for fuels: coal
We are the Environment Agency. We protect and improve the environment and make it a better place for people and wildlife.
We operate at the place where environmental change has its greatest impact on people’s lives. We reduce the risks to people and properties from flooding; make sure there is enough water for people and wildlife; protect and improve air, land and water quality and apply the environmental standards within which industry can operate.
Acting to reduce climate change and helping people and wildlife adapt to its consequences are at the heart of all that we do.
We cannot do this alone. We work closely with a wide range of partners including government, business, local authorities, other agencies, civil society groups and the communities we serve.
This report is the result of research commissioned and funded by the Environment Agency.
Published by: Environment Agency, Horizon House, Deanery Road, Bristol, BS1 5AH www.gov.uk/government/organisations/environment-agency ISBN: 978-1-84911-342-7 © Environment Agency – August 2016 All rights reserved. This document may be reproduced with prior permission of the Environment Agency. The views and statements expressed in this report are those of the author alone. The views or statements expressed in this publication do not necessarily represent the views of the Environment Agency and the Environment Agency cannot accept any responsibility for such views or statements. Further copies of this report are available from our publications catalogue: www.gov.uk/government/publications or our National Customer Contact Centre: T: 03708 506506 Email: [email protected]
Author(s): Mike Bains and Lucy Robinson Dissemination Status: Publicly available Keywords: Coal, end-of-waste, chemical analysis Research Contractor: URS Infrastructure & Environment Ltd 12 Regan Way, Chetwynd Business Park, Chilwell, Nottingham NG9 6RZ Tel: 0115 9077000 Environment Agency’s Project Manager: Bob Barnes, Evidence Directorate Project Number: 130726SH/EoW/C/C Product Code: SC130040/R9

Product comparators for fuels: coal iii
Executive summary This report details the work undertaken to characterise coal, a key comparator. This information will inform end-of-waste assessments for waste-derived materials intended to replace coal as a fuel.
The Waste Framework Directive (Article 6) provides criteria for identifying when a waste material has become a product and no longer needs to be regulated as a waste. Through Article 6 the case law requires the Environment Agency to consider the environmental and human health impacts from materials in comparison with their non-waste material alternatives.
‘It should be enough that the holder has converted the waste material into a distinct, marketable product, which can be used in exactly the same way as a [non-waste material], and with no worse environmental effects.’
Market research was used to define coal as an ordinary comparator and a literature review was used to identify any existing published data.
A limited number of suitable pre-existing datasets were found during the literature review.
Twenty samples of coal were collected from various suppliers across England. Analytical data from these samples are presented in this report.
We recommend comparing the concentrations of analytes in the comparators dataset to the concentrations in the waste-derived material, paying attention to the higher values. This comparison does not constitute a pass/fail test or an end of waste view. It will provide an indication of whether the waste material contains similar levels of analytes to non-waste materials and whether an end-of-waste application may be appropriate or that further analysis or improved treatment processes may be warranted.

iv Product comparators for fuels: coal
Acknowledgements The authors would like to thank the following organisations and individuals for their assistance in producing this report:
Bob Barnes – Environment Agency, Project Manager – Evidence Directorate
Sue Hornby – Environment Agency, Senior Advisor – Environment and Business
Jenny Scott – Environment Agency, Legal Advisor
Will Fardon – National Laboratory Service
Carl Dunne – National Laboratory Service, Key Account Manager
Graham Winter – Environment Agency, Senior Advisor – Environment and Business
Mat Davis – Environment Agency – Soil Protection
John Henderson – Environment Agency, Senior Advisor – Site Based Regulation
Gareth Scott – Environment Agency, Technical Advisor – Illegals and Waste
Amin Anjum – Environment Agency, Technical Advisor – Site Based Regulation
Howard Leberman – Environment Agency, Senior Advisor - Site Based Regulation
Robert McIntyre – Environment Agency, Technical Advisor – Site Based Regulation
Alan Holmes – Environment Agency, Senior Advisor – Illegals and Waste
David Canham – Environment Agency, Technical Advisor – Site Based Regulation

Product comparators for fuels: coal v
Contents
1 Introduction 1
2 Definition 1
2.1 Material properties relevant to use 1
3 Comparator sub-types 3
4 Material sources and sampling procedure 5
5 Analytical parameters 5
6 Existing data 7
7 Primary data 10
7.1 Statistical analysis of data 10
7.2 Using the data tables 11
7.3 Primary data tables 11
References 32
List of abbreviations 34
Table 5.1 Analysis: physical properties 5 Table 5.2 Proximate analysis (composition) and calorific value 6 Table 5.3 Ultimate (elemental) analysis 6 Table 5.4 Analysis: metals 7 Table 5.5 Analysis: organic contaminants 7 Table 6.1 Calorific value, proximate and ultimate analysis: coal 8 Table 6.2 Chlorine, fluorine and metal analysis: coal (mg/kg DW) 9 Table 6.3 Metal analysis: coal (mg/kg DW) 9 Table 7.1 Primary data for domestic coal: physical properties 12 Table 7.2 Primary data for domestic coal: metals (mg/kg DW) 13 Table 7.3 Primary data for domestic coal: PAHs (g/kg DW) 15 Table 7.4 Primary data for domestic coal: BTEX 17 Table 7.5 Primary data for domestic coal: calorific value and proximate analysis (composition) 18 Table 7.6 Primary data for domestic coal: ultimate analysis 19 Table 7.7 Primary data for steam coal: physical properties 20 Table 7.8 Primary data for steam coal: metals (mg/kg DW) 21 Table 7.9 Primary data for steam coal: PAHs (g/kg DW) 22 Table 7.10 Primary data for steam coal: BTEX 24 Table 7.11 Primary data for steam coal: calorific value and proximate analysis (composition) 25 Table 7.12 Primary data for steam coal: ultimate analysis 25 Table 7.13 Primary data for coking coal: physical properties 26 Table 7.14 Primary data for coking coal: metals (mg/kg DW) 27 Table 7.15 Primary data for coking coal: PAHs (g/kg DW) 28 Table 7.16 Primary data for coking coal: BTEX 30 Table 7.17 Primary data for coking coal: calorific value and proximate analysis (composition) 31 Table 7.18 Primary data for coking coal: ultimate analysis 31 Figure 3.1 Number of coal samples by sub-type 4 Figure 3.2 Number of steam coal samples by origin 4 Figure 3.3 Number of domestic coal samples by sub-type 4 Figure 7.1 Boxplot of phosphorus, coal 11


Product comparators for fuels: coal 1
1 Introduction To define end-of-waste criteria, the Environment Agency requires a set of ordinary material comparator data for use as a benchmark against which other materials and wastes can be assessed.
The Waste Framework Directive (Article 6) provides criteria for identifying when a waste material has become a product and no longer needs to be regulated as a waste. Through Article 6 the case law requires the Environment Agency to consider the environmental and human health impacts from materials in comparison with their non-waste material alternatives.
‘It should be enough that the holder has converted the waste material into a distinct, marketable product, which can be used in exactly the same way as a [non-waste material], and with no worse environmental effects.’
The purpose of this report is to provide an evidence base of the composition and characteristics of coal which is defined as an ordinary material comparator that is currently permitted for use as a fuel.
This report provides the results from the primary analysis of 20 coal samples.
Three other reports cover ordinary material comparators for fuel:
biomass
charcoal
natural gas
2 Definition
2.1 Material properties relevant to use
Coal is a fossil fuel. It is a combustible rock, composed of lithified plant remains. It is formed by the alteration of dead plant material that initially accumulates as a surficial deposit of peat and is then buried beneath layers of younger sediment. The initial peat may be sequentially altered by the process of coalification through brown coals, which include lignite and sub-bituminous coals, to black coals or hard coals that comprise bituminous coal, semi anthracite and anthracite (BGS 2010a).
The chemical and physical properties (or ‘coal quality’) determine whether and how a coal can be used commercially. The most fundamental property (as for any fuel) is calorific value (CV), the energy given off by a unit quantity of fuel. Peat has a CV of around 15 MJ/kg, brown coals have a CV of around 25 MJ/Kg and black coals (bituminous and anthracite) have a CV of around 35 MJ/Kg (BGS 2010b).
Chlorine is detrimental in coal as it causes corrosion in boilers as well as causing pollution. Sulphur is another serious impurity in coal, causing both corrosion and atmospheric pollution when released as sulphur dioxide. The sulphur content of English coals is relatively high compared with world traded coals and those found in Scotland and Wales (BGS 2010b).

2 Product comparators for fuels: coal
2.1.1 Origin
All the coal produced in the UK and imported into the UK is bituminous, semi-anthracite or anthracite. The UK has deposits of lignite but deposits are not mined.
Based on the physical properties of different bituminous coals, a fundamental distinction is made worldwide between steam coal (thermal coal), used for burning in boilers (chiefly for electricity generation) and coking coal, which is used for the metallurgical industries (BGS 2010b).
Around 71% (in 2009) of the UK coal market was supplied by imports; the remaining 29% came from indigenous sources. In 2008 the chief sources (82%) of steam coal in the UK were Russia, Columbia and South Africa. Australia provided 49.5% of coking coal imports (BGS 2010b). Anthracite is imported from Indonesia, South Africa, Vietnam and Russia.1 House coal is imported from Poland and Columbia.2
2.1.2 Uses
The main uses of coal are:
electricity generation
industrial heat generation
coke manufacture
blast furnaces
patent fuel manufacture
domestic heating
2.1.3 Lignite/sub-bituminous coal/brown coal
Lignite and sub-bituminous coals are brown coals. There are about 500 million tonnes of lignite resources in the UK, mainly in Northern Ireland, although none is mined or consumed at present (Eurocoal 2013). The low calorific value of lignite makes transport uneconomic over longer distances and lignite power stations are only developed adjacent to lignite mines (Eurocoal 2013).
2.1.4 Bituminous coal
Bituminous coal is known as black or hard coal and is split into two main categories: steam coal and coking coal. Total UK coal supply, predominantly bituminous (imports and indigenous production) totalled 64 million tonnes in 2012 (DECC 2013), of which:
steam coal consumption for electricity generation totalled 54.8 million tonnes
coking coal consumption for coke manufacture totalled 4.9 million tonnes
Bituminous coal for domestic consumption is referred to as house coal. The total consumption of all coal types for domestic (that is, household) purposes in the UK in
1 http://www.coalmerchantsfederation.co.uk/products/imported-boiler-fuel 2 http://www.coalmerchantsfederation.co.uk/products/house-coal

Product comparators for fuels: coal 3
2012 was 0.68 million tonnes. Note that this figure includes bituminous coal and anthracite.
2.1.5 Semi-anthracite
Semi-anthracite coal is a black or hard coal. Semi-anthracite has a higher calorific value than bituminous coal but a lower calorific value than anthracite. It tends to be used for domestic purposes.
Welsh dry steam coal is a naturally occurring semi-smokeless fuel currently produced in South Wales and is sold for domestic use as well as in steam-powered vehicles.3
2.1.6 Anthracite
Anthracite coal is a black or hard coal, and is a naturally occurring smokeless fuel, extremely slow burning with a high heat output used in the domestic environment. The largest UK anthracite producer is located in South Wales, but there are also several private anthracite producers which supply fuel for the domestic market. Various sizes of anthracite are available (large nuts, small nuts, beans and grains).4
2.1.7 Manufactured smokeless fuels
Manufactured smokeless fuels, also known as smokeless ovoids or smokeless ovals, are a smokeless anthracite based solid fuel for use on open fires and in multi-fuel stoves and selected cookers. There are a number of smokeless fuel products available on the market.5 Some manufactured smokeless fuels include renewable materials (for example, Ecoal50).
2.1.8 Manufactured non-smokeless fuels
Economy non-smokeless ovoids or ovals are a solid fuel which generally lights easily. They are most suitable for burning on open fires that are not in smoke-controlled areas, or on multi-fuel stoves and suitable room heaters. There are several economy non-smokeless fuel products available on the market.6
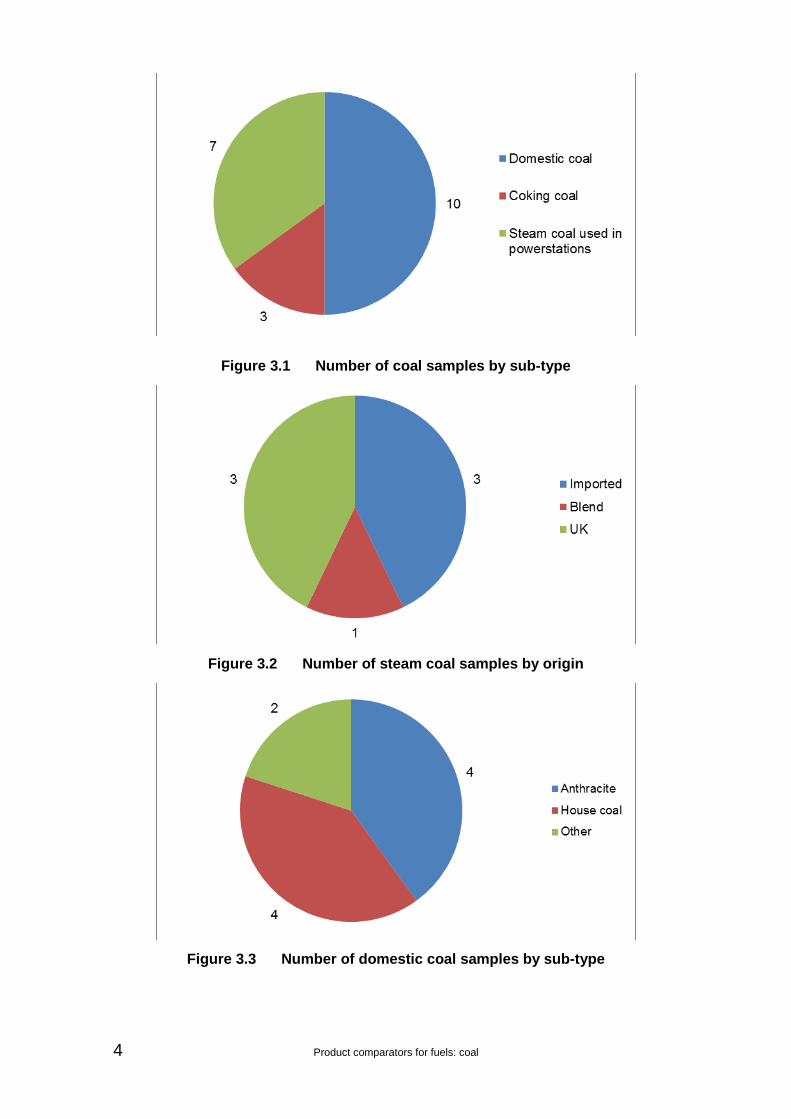
3 Comparator sub-types Twenty coal samples were obtained from a variety of suppliers across England to provide a cross-section of coal types. Sampling was split evenly between domestic and industrial use. Figures 3.1 to 3.3 show breakdowns of the samples by sub-type.
3 http://www.coalmerchantsfederation.co.uk/products/welsh-dry-steam 4 http://www.coalmerchantsfederation.co.uk/products/anthracite 5 http://www.coalmerchantsfederation.co.uk/products/smokeless-ovoids 6 http://www.coalmerchantsfederation.co.uk/products/economy-non-smokeless-ovoids
4 Product comparators for fuels: coal
Figure 3.1 Number of coal samples by sub-type
Figure 3.2 Number of steam coal samples by origin
Figure 3.3 Number of domestic coal samples by sub-type

Product comparators for fuels: coal 5
4 Material sources and sampling procedure
An internet search and the Coal Merchants Federation approved coal merchant map (Coal Merchants Federation 2013) were used to produce a list of coal suppliers. Coal samples were requested from all these suppliers to ensure a cross-section of coal types were sampled. Samples were collected from those willing to participate.
Coal samples were taken in accordance with BS 4845-2:1979 (BSI 1979) and BS ISO 18283:2006 (BSI 2006).
5 Analytical parameters The main parameters determined, together with units of measurement, are summarised in Tables 5.1 to 5.5.
Testing was carried out in accordance with in-house methods documented by the Environment Agency’s National Laboratory Service (NLS) which meet the requirements of the performance standards of the Environment Agency’s monitoring certification scheme (MCERTS). Specific tests used are outlined in the tables. Other test methods are available.
In the tables, ‘LE’ refers to the NLS Leeds laboratory, ‘SAL’ refers to Scientific Laboratories Ltd and ‘ESG’ refers to Environmental Scientifics Group Limited.
Table 5.1 Analysis: physical properties
Parameter/ determinand
Test method used Unit
Particle size distribution (PSD)
SAL determination of percentage particles. The particle size distribution calculates the percentage of a sample which is distributed via sieving between 2 and 20 mm, between 20 and 50 mm, and over 50 mm. The determination is performed on the >2 mm fraction of the sample (that is, the fraction of the sample that does not pass through the 2 mm sieve).
%
Bulk density The test portion is filled into a standard container of a given size and shape, and is weighed afterwards. The density is calculated from the net weight per standard volume and reported.
kg/m3

6 Product comparators for fuels: coal
Table 5.2 Proximate analysis (composition) and calorific value
Parameter/ determinand
Test method used Unit
Moisture content ESG documented in-house method based on ISO 687 and ISO11722
%
Ash content ESG documented in-house method based on ISO 1171:2010
%
Volatile matter ESG documented in-house method based on ISO 562:2010
%
Fixed carbon Parameter by calculation % Net calorific value (LHV)
ESG documented in-house method based on ISO 1928
kJ/kg
Gross calorific value (HHV)
ESG documented in-house method based on ISO 1928
kJ/kg
Table 5.3 Ultimate (elemental) analysis
Parameter/ determinand
Test method used Unit
Carbon ESG documented in-house method by Exeter CE440 elemental analyser
%
Hydrogen ESG documented in-house method by Exeter CE440 elemental analyser
%
Nitrogen ESG documented in-house method by Exeter CE440 elemental analyser
%
Oxygen Calculated % Sulphur ESG documented in-house methods by
instrumental analysis using Eltra Helios sulphur analyser
%
Chlorine ESG documented in-house method based on method described in Vol. 115 of the Analyst (November 1990) using wavelength dispersive X-ray fluorescence (XRF)
%
Fluorine Following calorific value test (see Table 5.2) – the washings from the bomb calorimeter are submitted for analysis.
%
Bromine Following calorific value test (see Table 5.2) – the washings from the bomb calorimeter are submitted for analysis by ion-selective electrode.
%

Product comparators for fuels: coal 7
Table 5.4 Analysis: metals
Parameter/ determinand
Test method used Unit
Aluminium, antimony, arsenic, barium, beryllium, boron, cadmium, calcium, chromium, cobalt, copper, iron, lead, lithium, magnesium, manganese, mercury, molybdenum, nickel, phosphorus, potassium, selenium, silver, sodium, strontium, thallium, tin, titanium, vanadium, zinc
LE I metals (ICP-OES) 01 – digestion block aqua regia extracted under reflux; determined by inductively coupled plasma optical emission spectrometry (ICP-OES)
mg/kg
Chromium VI Hexavalent chromium by spectrophotometry mg/kg
Table 5.5 Analysis: organic contaminants
Parameter/ determinand
Test method used Unit
Polycyclic aromatic hydrocarbons (PAHs) (USEPA16)1
Organics dichloromethane (DCM) extracted; hexane exchange determined by gas chromatography–mass spectrometry (GCMS) (scan mode)
g/kg
Benzene, toluene, ethylbenzene and xylenes (BTEX)
Organics DCM extracted; hexane exchange determined by GCMS (scan mode)
g/kg
Notes: 1 List of 16 PAHs classified by the US Environmental Protection Agency (USEPA)
as priority pollutants.
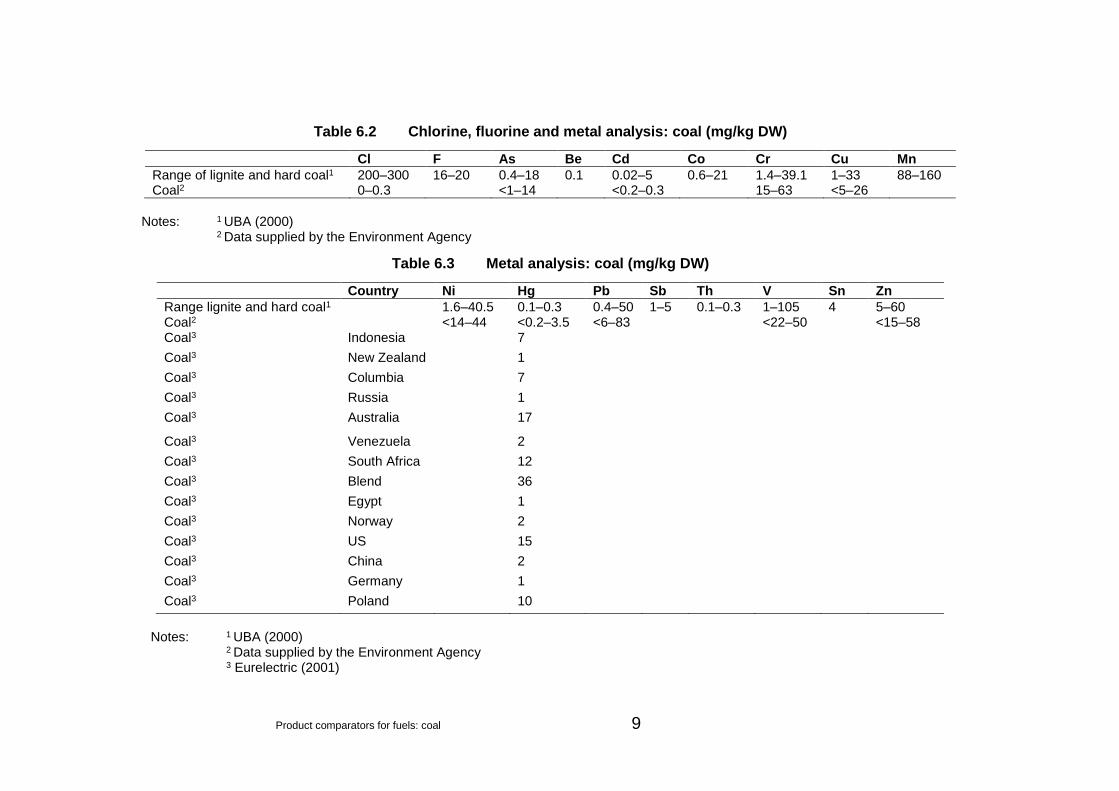
6 Existing data A limited number of existing datasets relating to coal were identified during the literature review. These are presented in Tables 6.1 to 6.3.

8 Product comparators for fuels: coal
Table 6.1 Calorific value, proximate and ultimate analysis: coal
Net CV Bulk density
Moisture content
Ash content
Volatile matter
Fixed carbon
Total carbon
Hydrogen Nitrogen Sulphur Oxygen
MJ/kg kg/m3 %
Range lignite and hard coal1 7–38
3–60 3–17 17–60 19 60–80 3–9 0.5–2 0.5–3
Black lignite2 17.8
29.2 10.25
Lignite3
30–70 5–40 40–66 35–60 60–80 4.5–6.5
0.5–4.7 12–30 Bituminous coal3 26–32
2–20 1–30 >22 55–85 80–95 4.5–6.5
0.3–4.5 1.5–14
Low volatile bituminous and semi anthracite3
25–32.3
2–20 1–30 8–22 85–92 90–95 3.5–4.5
0.5–1 1.2–6
Steam coal (Polish)4 28.7 1350 10 14 25–35
1 <1
Coal 5
7–15 10–22
0.1–3
Coal6
0.5 – 2
House coal7 25.0
House coal8 29 850 Anthracite and dry steam coal7
28.7
Anthracite8 32.1 1100 Anthracite3 30–31.4 2–20 1–30 <8 >92 92–95 3–8 0.5–0.8 1.2–5
Notes: 1 UBA (2000) 2 European Commission (2006) 3 Eurelectric (2001) 4 Finnish Environment Institute (2001) 5 Data supplied by the Environment Agency 6 Joint Research Centre (2013) 7 DECC (2012) 8 Carbon Trust (2009)
Product comparators for fuels: coal 9
Table 6.2 Chlorine, fluorine and metal analysis: coal (mg/kg DW)
Cl F As Be Cd Co Cr Cu Mn
Range of lignite and hard coal1 200–300 16–20 0.4–18 0.1 0.02–5 0.6–21 1.4–39.1 1–33 88–160 Coal2 0–0.3
<1–14
<0.2–0.3
15–63 <5–26
Notes: 1 UBA (2000) 2 Data supplied by the Environment Agency
Table 6.3 Metal analysis: coal (mg/kg DW)
Country Ni Hg Pb Sb Th V Sn Zn
Range lignite and hard coal1 1.6–40.5 0.1–0.3 0.4–50 1–5 0.1–0.3 1–105 4 5–60 Coal2 <14–44 <0.2–3.5 <6–83 <22–50 <15–58 Coal3 Indonesia 7
Coal3 New Zealand 1
Coal3 Columbia 7
Coal3 Russia 1
Coal3 Australia 17
Coal3 Venezuela 2
Coal3 South Africa 12
Coal3 Blend 36
Coal3 Egypt 1
Coal3 Norway 2
Coal3 US 15
Coal3 China 2
Coal3 Germany 1
Coal3 Poland 10
Notes: 1 UBA (2000) 2 Data supplied by the Environment Agency 3 Eurelectric (2001)

10 Product comparators for fuels: coal
7 Primary data
7.1 Statistical analysis of data
All ‘less than’ values were taken as the measured value. The mean, median, minimum, maximum and 90th percentile were calculated for each analyte.
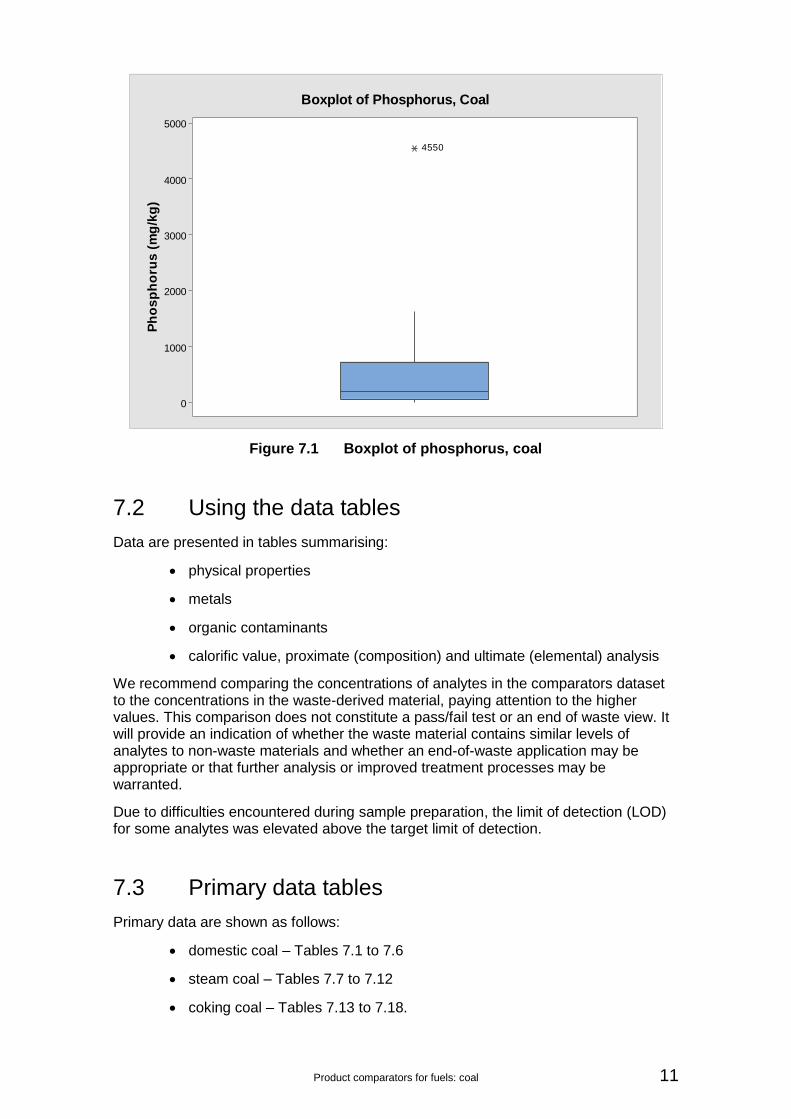
Box plots can be used to graphically represent groups of quantitative data. The sample minimum, lower quartile (Q1), median (Q2), upper quartile (Q3) and sample maximum are used. The median is indicated by the horizontal line that runs across the box. The top of the box is 75th percentile (upper quartile or Q3). The bottom of the box is the 25th percentile (lower quartile or Q1). The interquartile range is represented by the height of the box (Q3 – Q1). A smaller interquartile range indicates less variability in the dataset while a larger interquartile range indicates a variable dataset. Whiskers extend out of the box to represent the sample minimum and maximum. Outliers are plotted as asterisks and are defined as data points that are 1.5 times the interquartile range.
Outliers can adversely affect the statistical analysis by:
giving serious bias or influence to estimates that may be of less interest
increasing the error variance and reducing the power of statistical tests
decreasing normality (if non-random) and altering the odds of type I and II errors
A box and whisker plot of phosphorus concentration in coal is shown in Figure 7.1. This diagram demonstrates the issue of outliers in the dataset.
It is important to provide a reasonable sized dataset for comparison purposes. Where there is sufficient sample size (≥10) to calculate a 90th percentile of the data, the 90th percentile has been calculated.
Product comparators for fuels: coal 11
5000
4000
3000
2000
1000
0
Ph
os
ph
oru
s (
mg
/kg
)4550
Boxplot of Phosphorus, Coal
Figure 7.1 Boxplot of phosphorus, coal
7.2 Using the data tables
Data are presented in tables summarising:
physical properties
metals
organic contaminants
calorific value, proximate (composition) and ultimate (elemental) analysis
We recommend comparing the concentrations of analytes in the comparators dataset to the concentrations in the waste-derived material, paying attention to the higher values. This comparison does not constitute a pass/fail test or an end of waste view. It will provide an indication of whether the waste material contains similar levels of analytes to non-waste materials and whether an end-of-waste application may be appropriate or that further analysis or improved treatment processes may be warranted.
Due to difficulties encountered during sample preparation, the limit of detection (LOD) for some analytes was elevated above the target limit of detection.
7.3 Primary data tables
Primary data are shown as follows:
domestic coal – Tables 7.1 to 7.6
steam coal – Tables 7.7 to 7.12
coking coal – Tables 7.13 to 7.18.

12 Product comparators for fuels: coal
Table 3.1 Primary data for domestic coal: physical properties
Sample ID
Dry solids @ 30°C
PSD 2–20 mm
PSD 20–50 mm
PSD >50 mm
Loose bulk density
% % % % kg/m3
Coal 01 98.6 26.2 <0.1 <0.1 – Coal 02 97.4 14.1 <0.1 <0.1 – Coal 03 95.2 39.6 <0.1 <0.1 663 Coal 04 97.4 22.2 <0.1 <0.1 756 Coal 05 97.9 27.4 <0.1 <0.1 715 Coal 06 95.9 38.7 <0.1 <0.1 – Coal 07 96.9 34.4 <0.1 <0.1 – Coal 08 91.7 17.0 <0.1 <0.1 679 Coal 09 98.2 24.6 <0.1 <0.1 730 Coal 10 97.3 31.8 <0.1 <0.1 –
Mean 96.7 27.6 0.1 0.1 709 Median 97.4 26.8 0.1 0.1 715 Minimum 91.7 14.1 0.1 0.1 663 Maximum 98.6 39.6 0.1 0.1 756
No. of samples 10 10 10 10 5 90th percentile 98.2 38.8 0.1 0.1 n/a LOD 0.5 n/a n/a n/a n/a
Notes: – Particle size reduced, loose bulk density test not conducted n/a = not applicable

Product comparators for fuels: coal 13
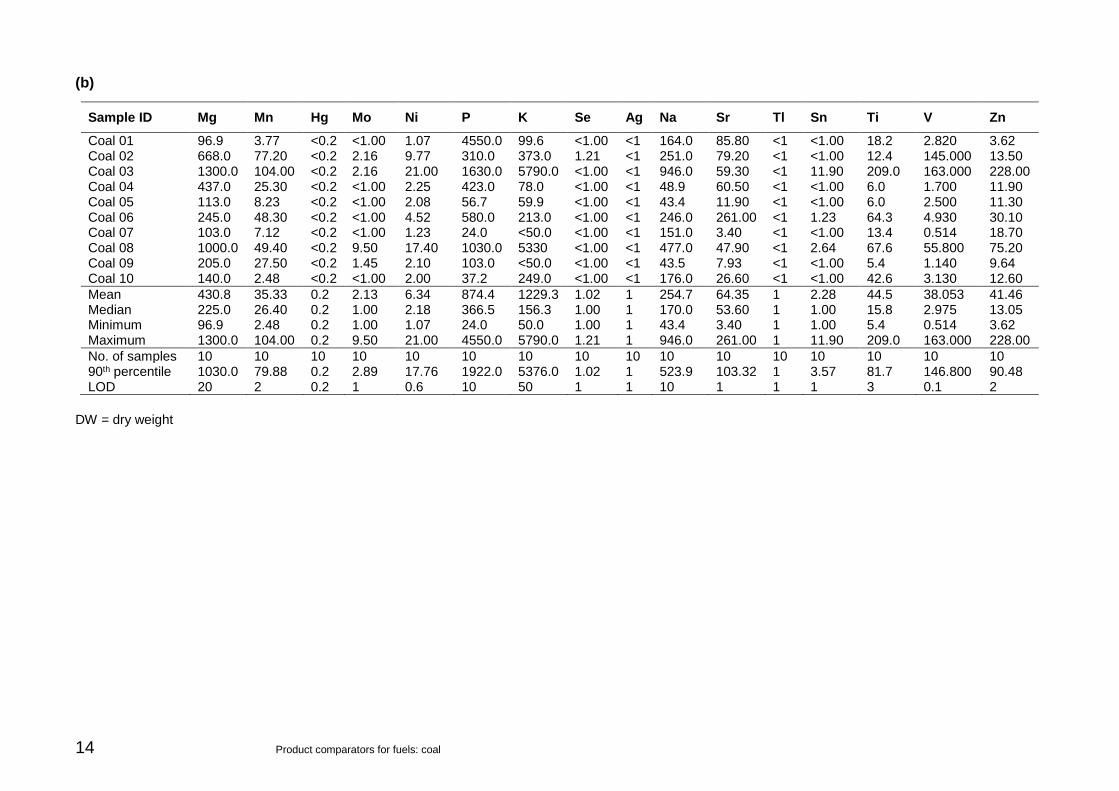
Table 7.2 Primary data for domestic coal: metals (mg/kg DW)
(a)
Sample ID Al Sb As Ba Be Bo Cd Ca Cr Cr VI Co Cu Fe Pb Li
Coal 01 1900 <1.00 0.673 35.1 0.159 52.20 <0.200 7710 0.772 <0.6 0.337 3.70 518 1.05 1.54 Coal 02 1620 <1.00 5.820 69.5 0.376 10.60 <0.200 2520 3.440 <0.6 3.040 16.10 2610 9.59 4.06 Coal 03 2250 <5.00 2.460 91.6 0.176 11.20 0.661 11000 15.000 <0.6 5.950 116.00 2520 65.80 3.64 Coal 04 792 <1.00 4.720 105.0 0.153 4.97 <0.200 1580 1.470 <0.6 1.340 17.90 1980 7.01 1.64 Coal 05 363 <1.00 2.900 19.5 0.124 2.37 <0.200 480 0.800 <0.6 1.960 13.90 760 3.98 <1.00 Coal 06 2040 <1.00 1.100 167.0 0.420 28.90 <0.200 1960 3.120 <0.6 0.940 17.30 842 10.50 2.09 Coal 07 129 <1.00 <0.500 10.3 <0.100 45.70 <0.200 537 1.020 <0.6 0.483 7.68 269 1.99 <1.00 Coal 08 1150 1.24 3.420 58.4 0.201 4.78 0.301 5020 5.230 <0.6 4.280 43.50 1520 20.40 3.03 Coal 09 295 <1.00 1.700 14.7 <0.100 1.25 <0.200 510 0.530 <0.6 1.710 13.40 1560 6.62 <1.00 Coal 10 860 <1.00 4.330 131.0 <0.100 74.10 <0.200 409 1.270 <0.6 0.452 3.13 612 1.35 <1.00
Mean 1140 1.42 2.762 70.2 0.191 23.61 0.256 3173 3.265 0.6 2.049 25.26 1319 12.83 2.00 Median 1005 1.00 2.680 64.0 0.156 10.90 0.200 1770 1.370 0.6 1.525 15.00 1181 6.82 1.59 Minimum 129 1.00 0.500 10.3 0.100 1.25 0.200 409 0.530 0.6 0.337 3.13 269 1.05 1.00 Maximum 2250 5.00 5.820 167.0 0.420 74.10 0.661 11000 15.000 0.6 5.950 116.00 2610 65.80 4.06
No. of samples 10 10 10 10 10 10 10 10 10 10 10 10 10 10 10 90th percentile 2061 1.62 4.830 134.6 0.380 54.39 0.337 8039 6.207 0.6 4.447 50.75 2529 24.94 3.68 LOD 50 1 0.5 0.5 0.1 1 0.2 60 0.5 0.6 0.1 1 200 1 1
14 Product comparators for fuels: coal
(b)
Sample ID Mg Mn Hg Mo Ni P K Se Ag Na Sr Tl Sn Ti V Zn
Coal 01 96.9 3.77 <0.2 <1.00 1.07 4550.0 99.6 <1.00 <1 164.0 85.80 <1 <1.00 18.2 2.820 3.62 Coal 02 668.0 77.20 <0.2 2.16 9.77 310.0 373.0 1.21 <1 251.0 79.20 <1 <1.00 12.4 145.000 13.50 Coal 03 1300.0 104.00 <0.2 2.16 21.00 1630.0 5790.0 <1.00 <1 946.0 59.30 <1 11.90 209.0 163.000 228.00 Coal 04 437.0 25.30 <0.2 <1.00 2.25 423.0 78.0 <1.00 <1 48.9 60.50 <1 <1.00 6.0 1.700 11.90 Coal 05 113.0 8.23 <0.2 <1.00 2.08 56.7 59.9 <1.00 <1 43.4 11.90 <1 <1.00 6.0 2.500 11.30 Coal 06 245.0 48.30 <0.2 <1.00 4.52 580.0 213.0 <1.00 <1 246.0 261.00 <1 1.23 64.3 4.930 30.10 Coal 07 103.0 7.12 <0.2 <1.00 1.23 24.0 <50.0 <1.00 <1 151.0 3.40 <1 <1.00 13.4 0.514 18.70 Coal 08 1000.0 49.40 <0.2 9.50 17.40 1030.0 5330 <1.00 <1 477.0 47.90 <1 2.64 67.6 55.800 75.20 Coal 09 205.0 27.50 <0.2 1.45 2.10 103.0 <50.0 <1.00 <1 43.5 7.93 <1 <1.00 5.4 1.140 9.64 Coal 10 140.0 2.48 <0.2 <1.00 2.00 37.2 249.0 <1.00 <1 176.0 26.60 <1 <1.00 42.6 3.130 12.60
Mean 430.8 35.33 0.2 2.13 6.34 874.4 1229.3 1.02 1 254.7 64.35 1 2.28 44.5 38.053 41.46 Median 225.0 26.40 0.2 1.00 2.18 366.5 156.3 1.00 1 170.0 53.60 1 1.00 15.8 2.975 13.05 Minimum 96.9 2.48 0.2 1.00 1.07 24.0 50.0 1.00 1 43.4 3.40 1 1.00 5.4 0.514 3.62 Maximum 1300.0 104.00 0.2 9.50 21.00 4550.0 5790.0 1.21 1 946.0 261.00 1 11.90 209.0 163.000 228.00
No. of samples 10 10 10 10 10 10 10 10 10 10 10 10 10 10 10 10 90th percentile 1030.0 79.88 0.2 2.89 17.76 1922.0 5376.0 1.02 1 523.9 103.32 1 3.57 81.7 146.800 90.48 LOD 20 2 0.2 1 0.6 10 50 1 1 10 1 1 1 3 0.1 2
DW = dry weight

Product comparators for fuels: coal 15
Table 7.3 Primary data for domestic coal: PAHs (g/kg DW)
(a)
Sample ID
Acen
ap
hth
en
e
Acen
ap
hth
yle
ne
An
thra
cen
e
Ben
zo
(a)a
nth
racen
e
Ben
zo
(a)p
yre
ne
Ben
zo
(b)f
luo
ran
then
e
Ben
zo
(gh
i)p
ery
len
e
Ben
zo
(k)f
luo
ran
then
e
Coal 01 59.4 <20.0 <400 835 <400 845 204 <400 Coal 02 182.0 105.0 1070 7930 12400 5190 10000 962 Coal 03 38.2 22.4 <400 1380 2090 1230 1770 <400 Coal 04 14.8 <20.0 <400 <400 <400 <400 <100 <400 Coal 05 12.6 <20.0 <400 <400 <400 <400 165 <400 Coal 06 230.0 132.0 632 1140 477 904 565 <400 Coal 07 469.0 259.0 2020 1080 459 472 268 <400 Coal 08 58.6 <20.0 428 2460 5220 2920 18100 594 Coal 09 12.5 <20.0 <400 <400 <400 <400 103 <400 Coal 10 162.0 67.9 574 <400 <400 <400 <100 <400
Mean 123.9 68.6 672 1643 2265 1316 3138 476 Median 59.0 21.2 414 958 430 659 236 400 Minimum 12.5 20.0 400 400 400 400 100 400 Maximum 469.0 259.0 2020 7930 12400 5190 18100 962
No. of samples 10 10 10 10 10 10 10 10 90th percentile 253.9 144.7 1165 3007 5938 3147 10810 631 LOD 0.1 1 20 20 20 20 6 20

16 Product comparators for fuels: coal
(b)
Sample ID
Ch
rys
en
e
Dib
en
zo
(ah
)an
thra
cen
e
Flu
ora
nth
en
e
Flu
ore
ne
Ind
en
o(1
,2,3
-cd
)py
ren
e
Nap
hth
ale
ne
Ph
en
an
thre
ne
Pyre
ne
Coal 01 <600 60.5 3070 <200 <600 <200 <400 1450 Coal 02 11800 4700.0 2330 906 3680 4340 7290 10300 Coal 03 2240 707.0 <400 <200 581 1280 1870 1120 Coal 04 <600 <60.0 <400 <200 <600 258 <400 <400 Coal 05 <600 <60.0 <400 <200 <600 353 547 <400 Coal 06 1010 84.2 3560 1390 <500 680 6110 2000 Coal 07 904 <60.0 1690 1020 <600 <300 4170 2100 Coal 08 4480 2830.0 444 259 2550 1940 2530 2140 Coal 09 <600 <60.0 <400 <200 <600 <200 <400 <400 Coal 10 <600 <60.0 532 910 <600 6150 1060 <400
Mean 2343 868.2 1323 549 1091 1570 2478 2071 Median 752 60.3 488 230 600 517 1465 1285 Minimum 600 60.0 400 200 500 200 400 400 Maximum 11800 4700.0 3560 1390 3680 6150 7290 10300
No. of samples 10 10 10 10 10 10 10 10 90th percentile 5212 3017.0 3119 1057 2663 4521 6228 2956 LOD 30 3 20 10 30 10 20 20

Product comparators for fuels: coal 17
Table 7.4 Primary data for domestic coal: BTEX
Sample ID
1,2
-Dim
eth
ylb
en
zen
e
[o-X
yle
ne
]
Ben
zen
e
Dim
eth
ylb
en
zen
e
Eth
ylb
en
zen
e
To
luen
e
[Meth
ylb
en
zen
e]
g/kg (DW) g/kg (DW) g/kg (DW) sum of (1,3- 1,4-isomers) g/kg (DW) g/kg (DW)
Coal 01 <3.0 <3.00 <5 1.21 <8 Coal 02 <4.0 <4.0 <7 <2.00 <10 Coal 03 <4.0 <10.00 <9 <2.00 <10 Coal 04 <4.0 <4.00 <7 <2.00 <10 Coal 05 <3.0 6.51 <7 <2.00 <10 Coal 06 <3.0 <3.00 <7 <2.00 <10 Coal 07 <4.0 <10.00 <8 <2.00 <10 Coal 08 <4.0 <4.00 <9 <2.00 <10 Coal 09 <3.0 3.47 <6 <2.00 <9 Coal 10 44.3 4.06 169 33.00 103
Mean 7.6 5.20 23 5.02 19 Median 4.0 4.00 7 2.00 10 Minimum 3.0 3.00 5 1.21 8 Maximum 44.3 10.00 169 33.00 103
No. of samples 10 10 10 10 10 90th percentile 8.0 10.00 25 5.10 19 LOD 1 1 2 0.5 3

18 Product comparators for fuels: coal
Table 7.5 Primary data for domestic coal: calorific value and proximate analysis (composition)
Sample ID Calorific value (gross) Calorific value (net) Total moisture Ash Volatile matter Fixed carbon
kJ/kg kJ/kg % % % %
Coal 01 28496 27306 8.7 5.5 34.3 51.5 Coal 02 30079 29127 6.5 6.4 17.2 69.9 Coal 03 30528 29614 8.9 5.1 11.1 74.9 Coal 04 30528 29614 5.1 3.5 7.7 83.7 Coal 05 33904 33070 3.7 2.6 7.2 86.5 Coal 06 28313 27131 10.2 5.4 30.9 53.5 Coal 07 29443 28132 12.1 1.0 35.7 51.2 Coal 08 29058 28082 12.0 4.7 10.4 72.9 Coal 09 32928 32133 3.5 5.0 5.9 85.6 Coal 10 28050 26856 10.3 5.9 32.0 51.8
Mean 30133 29107 8.1 4.5 19.2 68.2 Median 29761 28630 8.8 5.1 14.2 71.4 Minimum 28050 26856 3.5 1.0 5.9 51.2 Maximum 33904 33070 12.1 6.4 35.7 86.5
No. of samples 10 10 10 10 10 10 90th percentile 33026 32227 12.0 6.0 34.4 85.7 LOD 100 100 0.1 0.1 1.1 n/a

Product comparators for fuels: coal 19
Table 7.6 Primary data for domestic coal: ultimate analysis
Sample ID Bromine Carbon Chlorine Fluorine Hydrogen Nitrogen Oxygen Sulphur
mg/kg % % mg/kg % % % %
Coal 01 <100 69.31 0.02 22.8 4.43 2.13 9.6 0.31 Coal 02 <100 75.36 0.04 24.8 3.37 1.49 5.3 1.52 Coal 03 <100 76.01 0.17 46.4 2.95 1.41 3.8 1.67 Coal 04 <100 83.60 0.01 47.3 3.01 1.29 2.7 0.78 Coal 05 <100 86.84 0.02 22.2 3.15 1.33 1.5 0.86 Coal 06 <100 69.45 0.01 42.5 4.15 2.06 8.4 0.29 Coal 07 <100 71.77 0.02 <10.0 4.66 1.59 8.5 0.38 Coal 08 <100 74.59 0.13 48.8 2.86 1.19 3.0 1.52 Coal 09 <100 84.10 0.02 72.3 2.94 1.17 2.3 1.01 Coal 10 <100 64.58 0.01 <10.0 3.94 1.53 13.4 0.33
Mean 100 75.56 0.05 34.7 3.55 1.52 5.9 0.87 Median 100 74.98 0.02 33.7 3.26 1.45 4.6 0.82 Minimum 100 64.58 0.01 10.0 2.86 1.17 1.5 0.29 Maximum 100 86.84 0.17 72.3 4.66 2.13 13.4 1.67
No. of samples 10 10 10 10 10 10 10 10 90th percentile 100 84.37 0.13 51.2 4.45 2.07 10.0 1.54 LOD 100 0.41 0.01 10 0.06 0.1 Calculated 0.02

20 Product comparators for fuels: coal
Table 4.7 Primary data for steam coal: physical properties
Sample ID
Dry solids @ 30°C
PSD 2–20 mm
PSD 20–50 mm
PSD >50 mm
Loose bulk density
% % % % kg/m3
Coal 11 86.3 20.3 <0.1 <0.1 682 Coal 12 92.1 6.5 <0.1 <0.1 740 Coal 13 98.9 <0.1 8.6 <0.1 853 Coal 14 98.1 <0.1 13.5 <0.1 847 Coal 15 97.5 <0.1 18.3 <0.1 851 Coal 16 96.6 <0.1 18.0 <0.1 797 Coal 17 96.0 38.4 <0.1 <0.1 –
Mean 95.1 9.4 8.4 0.1 795 Median 96.6 0.1 8.6 0.1 822 Minimum 86.3 0.1 0.1 0.1 682 Maximum 98.9 38.4 18.3 0.1 853
No. of samples 7 7 7 7 6 LOD 0.5 n/a n/a n/a n/a
Notes: – Particle size reduced, loose bulk density test not conducted n/a = not applicable

Product comparators for fuels: coal 21
Table 7.8 Primary data for steam coal: metals (mg/kg DW)
(a)
Sample ID Al Sb As Ba Be Bo Cd Ca Cr Cr VI Co Cu Fe Pb Li
Coal 11 3810 <1 14.90 53.9 0.596 14.6 0.489 1320 4.86 <0.6 7.31 42.10 8850 19.80 15.70 Coal 12 5450 <1 24.10 52.3 0.832 14.6 0.760 2120 8.84 <0.6 7.67 46.70 13000 26.60 17.20 Coal 13 3500 <1 6.37 58.4 1.090 45.4 <0.200 2350 8.23 <0.6 4.51 17.90 7490 8.50 5.70 Coal 14 3200 <1 2.58 166.0 0.290 43.6 <0.200 7620 3.74 <0.6 1.29 5.05 3230 4.82 2.42 Coal 15 4780 <1 5.86 47.4 1.090 33.9 <0.200 8750 10.50 <0.6 7.83 40.50 5990 36.10 11.80 Coal 16 2480 <1 7.79 52.9 0.524 26.9 0.363 1090 8.70 <0.6 2.61 8.54 6190 3.49 2.48 Coal 17 338 <1 3.60 2.8 0.499 31.2 <0.200 498 1.62 <0.6 5.25 14.40 2730 62.00 <1.00
Mean 3365 1 9.31 62.0 0.703 30.0 0.3446 3393 6.64 0.6 5.21 25.03 6783 23.04 8.04 Median 3500 1 6.37 52.9 0.596 31.2 0.200 2120 8.23 0.6 5.25 17.90 6190 19.80 5.70 Minimum 338 1 2.58 2.8 0.290 14.6 0.200 498 1.62 0.6 1.29 5.05 2730 3.49 1.00 Maximum 5450 1 24.10 166.0 1.090 45.4 0.760 8750 10.50 0.6 7.83 46.70 13000 62.00 17.20
No. of samples 7 7 7 7 7 7 7 7 7 7 7 7 7 7 7 LOD 50 1 0.5 0.5 0.1 1 0.2 60 0.5 0.6 0.1 1 200 1 1
(b)
Sample ID Mg Mn Hg Mo Ni P K Se Ag Na Sr Tl Sn Ti V Zn
Coal 11 803 40.1 <0.2 3.20 19.1 18.7 955 1.60 <1 2420 27.2 <1 <1.00 24.5 19.9 28.3 Coal 12 1170 58.7 <0.2 3.51 26.9 51.8 1190 <1.00 <1 1770 32.0 <1 <1.00 44.9 38.7 32.9 Coal 13 580 43.4 <0.2 2.27 11.5 65.2 778 3.69 <1 217 36.5 <1 <1.00 59.9 15.9 19.8 Coal 14 1450 70.0 <0.2 <1.00 5.1 280.0 736 <1.00 <1 708 134.0 <1 <1.00 34.1 6.4 15.3 Coal 15 3310 242.0 <0.2 <1.00 20.6 123.0 718 1.87 <1 235 32.2 <1 <1.00 45.8 39.6 43.5 Coal 16 650 55.4 <0.2 2.51 10.6 58.1 479 3.87 <1 291 27.5 <1 <1.00 47.3 15.9 23.4 Coal 17 104 21.4 <0.2 <1.00 20.8 32.6 112 1.39 <1 50.4 4.7 <1 7.51 26.0 10.6 12.8
Mean 1152 75.9 0.2 2.07 16.4 89.9 710 2.06 1 813 42.0 1 1.93 40.4 21.0 25.1 Median 803 55.4 0.2 2.27 19.1 58.1 736 1.60 1 291 32.0 1 1.00 44.9 15.9 23.4 Minimum 104 21.4 0.2 1.00 5.1 18.7 112 1.00 1 50.4 4.7 1 1.00 24.5 6.4 12.8 Maximum 3310 242.0 0.2 3.51 26.9 280.0 1190 3.87 1 2420 134.0 1 7.51 59.9 39.6 43.5
No. of samples 7 7 7 7 7 7 7 7 7 7 7 7 7 7 7 7 LOD 20 2 0.2 1 0.6 10 50 1 1 10 1 1 1 3 0.1 2

22 Product comparators for fuels: coal
Table 7.9 Primary data for steam coal: PAHs (g/kg DW)
(a)
Sample ID
Acen
ap
hth
en
e
Acen
ap
hth
yle
ne
An
thra
cen
e
Ben
zo
(a)a
nth
racen
e
Ben
zo
(a)p
yre
ne
Ben
zo
(b)f
luo
ran
then
e
Ben
zo
(gh
i)p
ery
len
e
Ben
zo
(k)f
luo
ran
then
e
Coal 11 878 386.0 1710 919 381 415 300 <300 Coal 12 1120 388.0 1530 1470 795 775 961 <300 Coal 13 933 423.0 746 1180 1140 1490 2010 <400 Coal 14 260 93.0 <400 401 <400 <400 176 <400 Coal 15 2320 150.0 2660 2840 2680 2200 3460 741 Coal 16 204 87.4 956 761 406 422 282 <100 Coal 17 2020 159.0 2590 2940 2250 2330 3750 576
Mean 1105 240.9 1513 1502 1150 1147 1563 402 Median 933 159.0 1530 1180 795 775 961 400 Minimum 204 87.4 400 401 381 400 176 100 Maximum 2320 423.0 2660 2940 2680 2330 3750 741
No. of samples 7 7 7 7 7 7 7 7 LOD 0.1 1 20 20 20 20 6 20
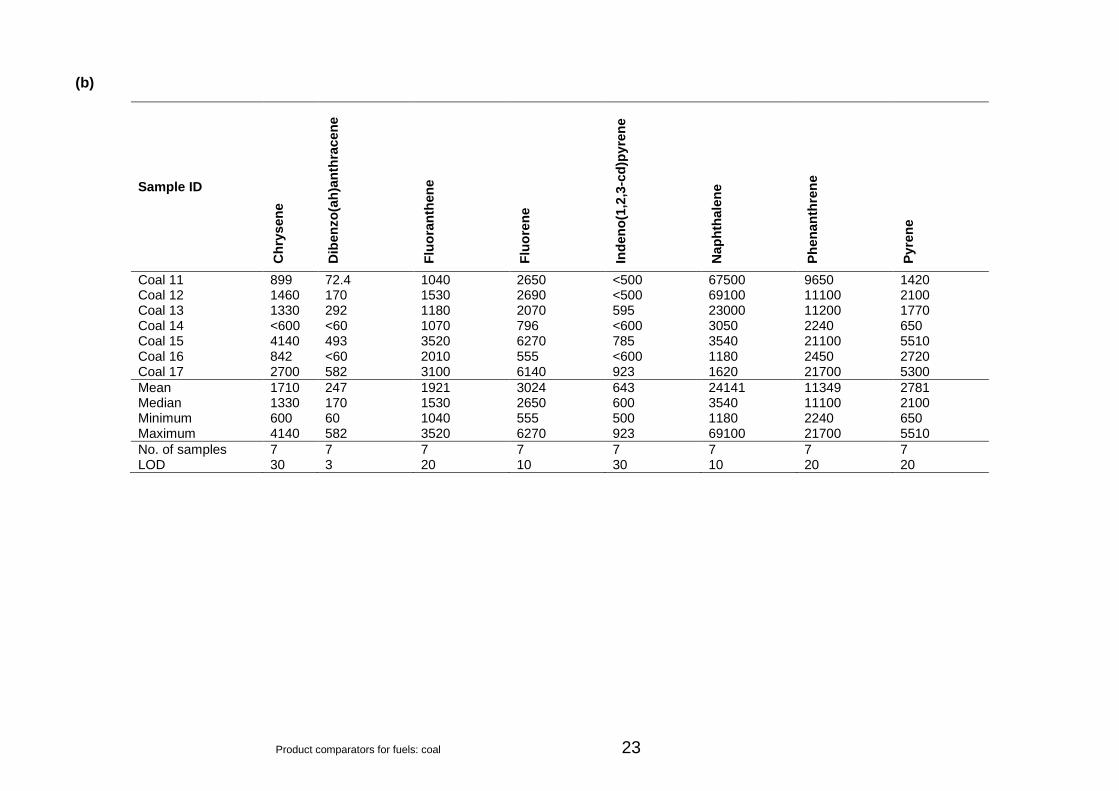
Product comparators for fuels: coal 23
(b)
Sample ID
Ch
rys
en
e
Dib
en
zo
(ah
)an
thra
cen
e
Flu
ora
nth
en
e
Flu
ore
ne
Ind
en
o(1
,2,3
-cd
)py
ren
e
Nap
hth
ale
ne
Ph
en
an
thre
ne
Pyre
ne
Coal 11 899 72.4 1040 2650 <500 67500 9650 1420 Coal 12 1460 170 1530 2690 <500 69100 11100 2100 Coal 13 1330 292 1180 2070 595 23000 11200 1770 Coal 14 <600 <60 1070 796 <600 3050 2240 650 Coal 15 4140 493 3520 6270 785 3540 21100 5510 Coal 16 842 <60 2010 555 <600 1180 2450 2720 Coal 17 2700 582 3100 6140 923 1620 21700 5300
Mean 1710 247 1921 3024 643 24141 11349 2781 Median 1330 170 1530 2650 600 3540 11100 2100 Minimum 600 60 1040 555 500 1180 2240 650 Maximum 4140 582 3520 6270 923 69100 21700 5510
No. of samples 7 7 7 7 7 7 7 7 LOD 30 3 20 10 30 10 20 20
24 Product comparators for fuels: coal
Table 7.10 Primary data for steam coal: BTEX
Sample ID
1,2
-Dim
eth
ylb
en
ze
ne
[o-X
yle
ne
]
Ben
zen
e
Dim
eth
ylb
en
zen
e
Eth
ylb
en
zen
e
To
luen
e
[Meth
ylb
en
zen
e]
g/kg (DW) g/kg (DW) g/kg (DW) sum of (1,3- 1,4-isomers) g/kg (DW) g/kg (DW)
Coal 11 877.00 1050.00 1740.00 544.00 3300.0 Coal 12 270.00 177.00 691.00 192.00 672.0 Coal 13 4.94 37.70 7.54 3.68 37.9 Coal 14 2.28 10.40 4.03 1.67 13.6 Coal 15 <5.00 1.44 <10.00 <3.00 <20.0 Coal 16 <5.00 1.58 <10.00 <3.00 <20.0 Coal 17 <2.00 <2.00 <5.00 <1.00 <7.0
Mean 166.60 182.87 352.51 106.91 581.5 Median 5.00 10.40 10.00 3.00 20.0 Minimum 2.00 1.44 4.03 1.00 7.0 Maximum 877.00 1050.00 1740.00 544.00 3300.0
No. of samples 7 7 7 7 7 LOD 1 1 2 0.5 3
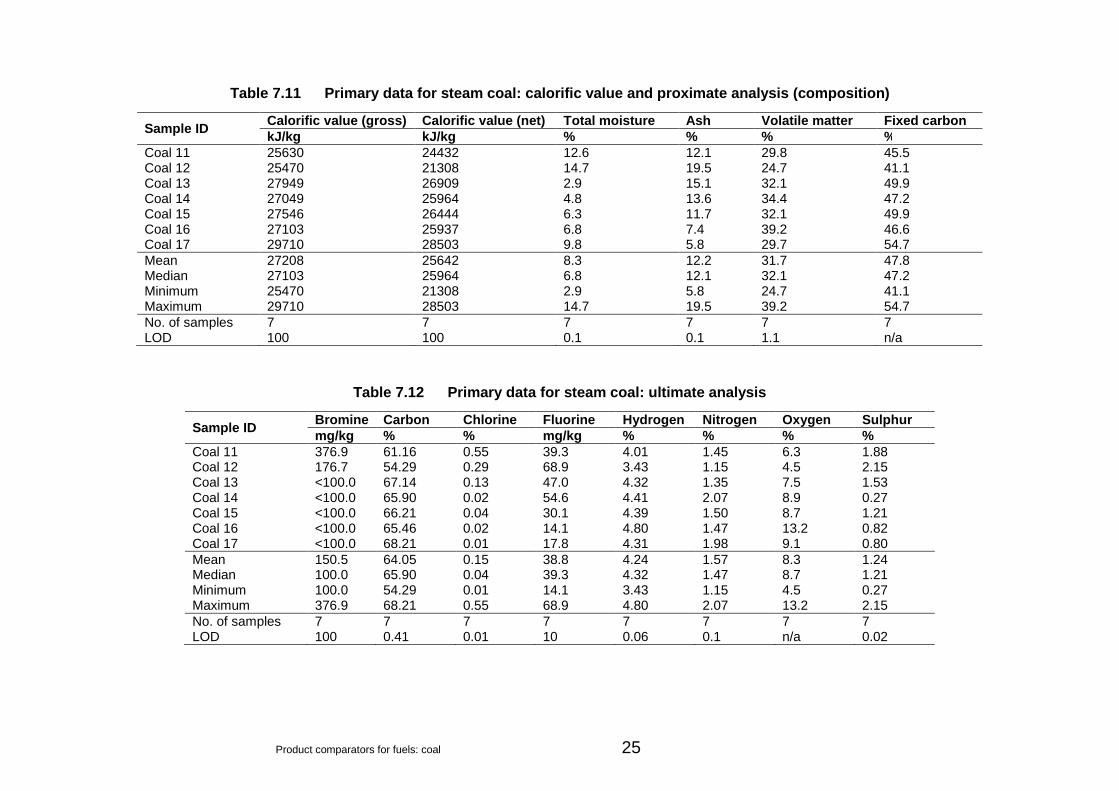
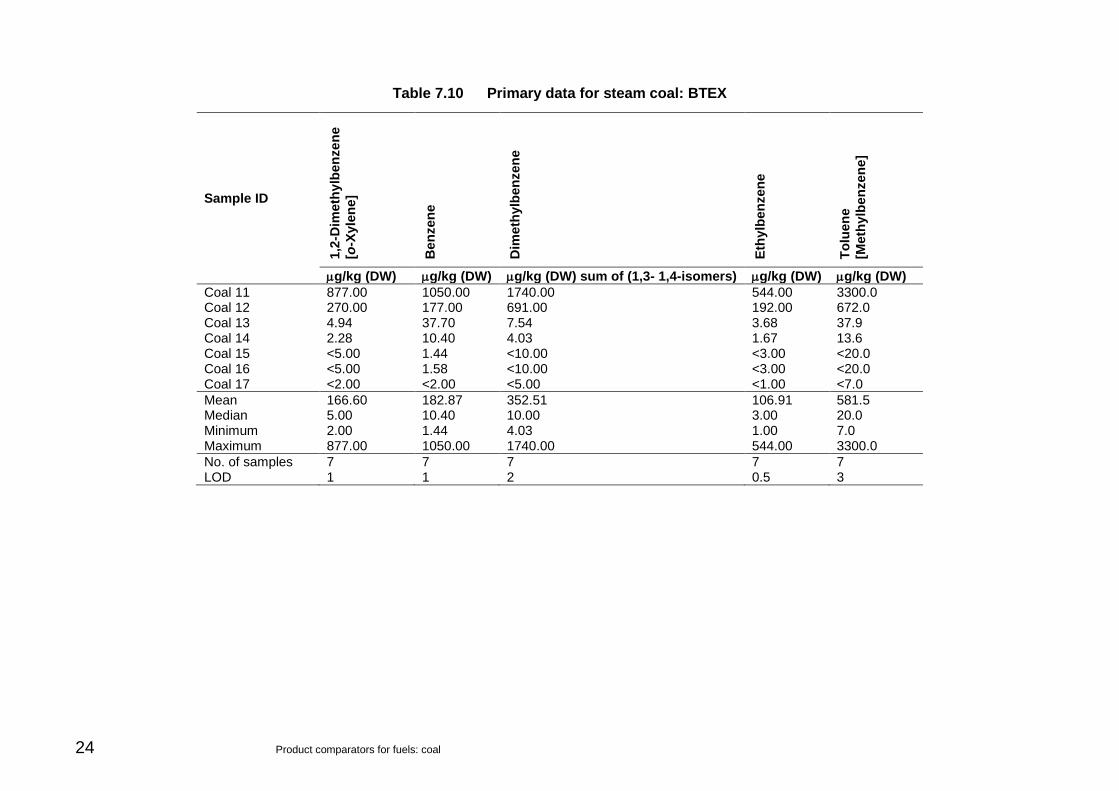
Product comparators for fuels: coal 25
Table 7.11 Primary data for steam coal: calorific value and proximate analysis (composition)
Sample ID Calorific value (gross) Calorific value (net) Total moisture Ash Volatile matter Fixed carbon
kJ/kg kJ/kg % % % %
Coal 11 25630 24432 12.6 12.1 29.8 45.5 Coal 12 25470 21308 14.7 19.5 24.7 41.1 Coal 13 27949 26909 2.9 15.1 32.1 49.9 Coal 14 27049 25964 4.8 13.6 34.4 47.2 Coal 15 27546 26444 6.3 11.7 32.1 49.9 Coal 16 27103 25937 6.8 7.4 39.2 46.6 Coal 17 29710 28503 9.8 5.8 29.7 54.7
Mean 27208 25642 8.3 12.2 31.7 47.8 Median 27103 25964 6.8 12.1 32.1 47.2 Minimum 25470 21308 2.9 5.8 24.7 41.1 Maximum 29710 28503 14.7 19.5 39.2 54.7
No. of samples 7 7 7 7 7 7 LOD 100 100 0.1 0.1 1.1 n/a
Table 7.12 Primary data for steam coal: ultimate analysis
Sample ID Bromine Carbon Chlorine Fluorine Hydrogen Nitrogen Oxygen Sulphur
mg/kg % % mg/kg % % % %
Coal 11 376.9 61.16 0.55 39.3 4.01 1.45 6.3 1.88 Coal 12 176.7 54.29 0.29 68.9 3.43 1.15 4.5 2.15 Coal 13 <100.0 67.14 0.13 47.0 4.32 1.35 7.5 1.53 Coal 14 <100.0 65.90 0.02 54.6 4.41 2.07 8.9 0.27 Coal 15 <100.0 66.21 0.04 30.1 4.39 1.50 8.7 1.21 Coal 16 <100.0 65.46 0.02 14.1 4.80 1.47 13.2 0.82 Coal 17 <100.0 68.21 0.01 17.8 4.31 1.98 9.1 0.80
Mean 150.5 64.05 0.15 38.8 4.24 1.57 8.3 1.24 Median 100.0 65.90 0.04 39.3 4.32 1.47 8.7 1.21 Minimum 100.0 54.29 0.01 14.1 3.43 1.15 4.5 0.27 Maximum 376.9 68.21 0.55 68.9 4.80 2.07 13.2 2.15
No. of samples 7 7 7 7 7 7 7 7 LOD 100 0.41 0.01 10 0.06 0.1 n/a 0.02

26 Product comparators for fuels: coal
Table 5.13 Primary data for coking coal: physical properties
Sample ID
Dry solids @ 30°C
PSD 2–20 mm
PSD 20–50 mm
PSD >50 mm
Loose bulk density
% % % % kg/m3
Coal 18 96.8 34.3 <0.1 <0.1 792 Coal 19 93.4 24.3 <0.1 <0.1 588 Coal 20 100.0 15.0 <0.1 <0.1 626
Mean 96.7 24.5 0.1 0.1 669 Median 96.8 24.3 0.1 0.1 626 Minimum 93.4 15.0 0.1 0.1 588 Maximum 100.0 34.3 0.1 0.1 792
No. of samples 3 3 3 3 3 LOD 0.5 n/a n/a n/a n/a

Product comparators for fuels: coal 27
Table 7.14 Primary data for coking coal: metals (mg/kg DW)
(a)
Sample ID Al Sb As Ba Be Bo Cd Ca Cr Cr VI Co Cu Fe Pb Li
Coal 18 1560 <1 4.88 62.6 0.778 12.50 <0.2 990 1.49 <0.6 3.41 12.7 1700 5.76 3.51 Coal 19 1480 <1 9.84 17.7 0.484 7.12 <0.2 583 2.00 <0.6 4.50 18.0 2050 4.90 2.84 Coal 20 2650 <1 2.23 75.9 0.542 <1.00 <0.2 1180 3.13 <0.6 2.38 17.2 810 6.11 5.72
Mean 1897 1 5.65 52.1 0.601 6.87 0.2 918 2.21 0.6 3.43 16.0 1520 5.59 4.02 Median 1560 1 4.88 62.6 0.542 7.12 0.2 990 2.00 0.6 3.41 17.2 1700 5.76 3.51 Minimum 1480 1 2.23 17.7 0.484 1.00 0.2 583 1.49 0.6 2.38 12.7 810 4.90 2.84 Maximum 2650 1 9.84 75.9 0.778 12.50 0.2 1180 3.13 0.6 4.50 18 2050 6.11 5.72
No. of samples 3 3 3 3 3 3 3 3 3 3 3 3 3 3 3 LOD 50 1 0.5 0.5 0.1 1 0.2 60 0.5 0.6 0.1 1 200 1 1
(b)
Sample ID Mg Mn Hg Mo Ni P K Se Ag Na Sr Tl Sn Ti V Zn
Coal 18 335 28.0 <0.2 <1.00 5.49 24.2 644 2.33 <1 85.1 70.6 <1 <1 24.6 8.25 24.4 Coal 19 151 7.8 <0.2 1.31 6.54 48.9 382 2.54 <1 103.0 32.4 <1 <1 16.6 7.36 12.8 Coal 20 305 19.5 <0.2 1.51 4.07 257.0 397 1.31 <1 183.0 69.2 <1 <1 22.3 14.00 13.9
Mean 264 18.4 0.2 1.27 5.37 110.0 474 2.06 1 123.7 57.4 1 1 21.2 9.87 17.0 Median 305 19.5 0.2 1.31 5.49 48.9 397 2.33 1 103.0 69.2 1 1 22.3 8.25 13.9 Minimum 151 7.8 0.2 1.00 4.07 24.2 382 1.31 1 85.1 32.4 1 1 16.6 7.36 12.8 Maximum 335 28.0 0.2 1.51 6.54 257.0 644 2.54 1 183.0 70.6 1 1 24.6 14.00 24.4
No. of samples 3 3 3 3 3 3 3 3 3 3 3 3 3 3 3 3 LOD 20 2 0.2 1 0.6 10 50 1 1 10 1 1 1 3 0.1 2

28 Product comparators for fuels: coal
Table 7.15 Primary data for coking coal: PAHs (g/kg DW)
(a)
Sample ID
Acen
ap
hth
en
e
Acen
ap
hth
yle
ne
An
thra
cen
e
Ben
zo
(a)a
nth
racen
e
Ben
zo
(a)p
yre
ne
Ben
zo
(b)f
luo
ran
then
e
Ben
zo
(gh
i)p
ery
len
e
Ben
zo
(k)f
luo
ran
then
e
Coal 18 1250 144.0 <400 <400 <400 <400 295 <400 Coal 19 119 60.9 <400 <400 585 <400 388 <400 Coal 20 162 136.0 <700 <700 <700 <700 328 <700
Mean 510 113.6 500 500 562 500 337 500 Median 162 136.0 400 400 585 400 328 400 Minimum 119 60.9 400 400 400 400 295 400 Maximum 1250 144.0 700 700 700 700 388 700
No. of samples 3 3 3 3 3 3 3 3 LOD 0.1 1 20 20 20 20 6 20
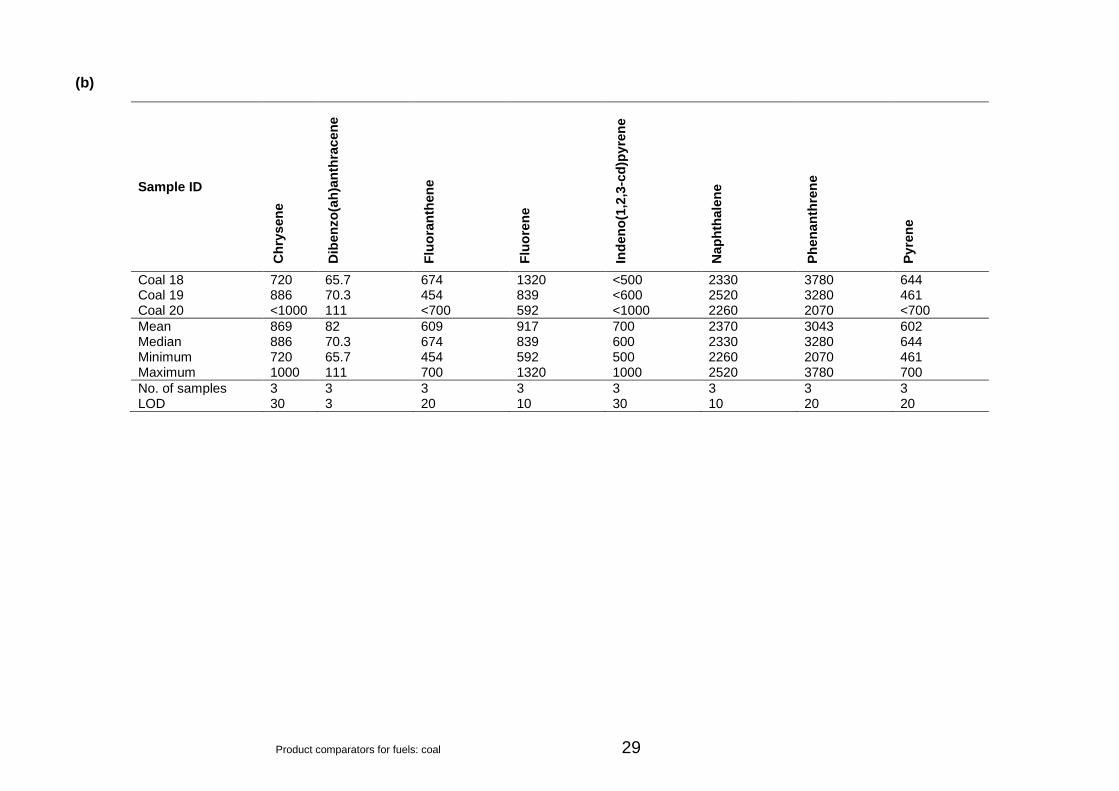
Product comparators for fuels: coal 29
(b)
Sample ID
Ch
rys
en
e
Dib
en
zo
(ah
)an
thra
cen
e
Flu
ora
nth
en
e
Flu
ore
ne
Ind
en
o(1
,2,3
-cd
)py
ren
e
Nap
hth
ale
ne
Ph
en
an
thre
ne
Pyre
ne
Coal 18 720 65.7 674 1320 <500 2330 3780 644 Coal 19 886 70.3 454 839 <600 2520 3280 461 Coal 20 <1000 111 <700 592 <1000 2260 2070 <700
Mean 869 82 609 917 700 2370 3043 602 Median 886 70.3 674 839 600 2330 3280 644 Minimum 720 65.7 454 592 500 2260 2070 461 Maximum 1000 111 700 1320 1000 2520 3780 700
No. of samples 3 3 3 3 3 3 3 3 LOD 30 3 20 10 30 10 20 20

30 Product comparators for fuels: coal
Table 7.16 Primary data for coking coal: BTEX
Sample ID
1,2
-Dim
eth
ylb
en
zen
e
[o-X
yle
ne
]
Ben
zen
e
Dim
eth
ylb
en
zen
e
Eth
ylb
en
zen
e
To
luen
e
[Meth
ylb
en
zen
e]
g/kg (DW) g/kg (DW) g/kg (DW) sum of (1,3- 1,4-isomers) g/kg (DW) g/kg (DW)
Coal 18 <5 <5 <10 <2 <10 Coal 19 <1 <1 <3 <0.7 <4 Coal 20 <5 <5 <10 <2 <10
Mean 4 4 8 2 8 Median 5 5 10 2 10 Minimum 1 1 3 0.7 4 Maximum 5 5 10 2 10
No. of samples 3 3 3 3 3 LOD 1 1 2 0.5 3

Product comparators for fuels: coal 31
Table 7.17 Primary data for coking coal: calorific value and proximate analysis (composition)
Sample ID Calorific value (gross) Calorific value (net) Total moisture Ash Volatile matter Fixed carbon
kJ/kg kJ/kg % % % %
Coal 18 31454 30289 5.1 6.9 32.0 56.0 Coal 19 30277 29250 7.5 8.8 18.6 65.1 Coal 20 29010 27923 9.6 9.0 21.4 60.0
Mean 30247 29154 7.4 8.2 24.0 60.4 Median 30277 29250 7.5 8.8 21.4 60.0 Minimum 29010 27923 5.1 6.9 18.6 56.0 Maximum 31454 30289 9.6 9.0 32.0 65.1
No. of samples 3 3 3 3 3 3 LOD 100 100 0.1 0.1 1.1 Calculated
Table 7.18 Primary data for coking coal: ultimate analysis
Sample ID Bromine Carbon Chlorine Fluorine Hydrogen Nitrogen Oxygen Sulphur
mg/kg % % mg/kg % % % %
Coal 18 <100 75.47 0.22 18.8 4.70 1.44 5.3 0.83 Coal 19 <100 74.22 0.13 35.8 3.90 1.23 3.4 0.84 Coal 20 <100 71.30 0.05 18.8 3.95 1.43 4.1 0.56
Mean 100 73.66 0.13 24.5 4.18 1.37 4.3 0.74 Median 100 74.22 0.13 18.8 3.95 1.43 4.1 0.83 Minimum 100 71.30 0.05 18.8 3.90 1.23 3.4 0.56 Maximum 100 75.47 0.22 35.8 4.70 1.44 5.3 0.84
No. of samples 3 3 3 3 3 3 3 3 LOD 100 0.41 0.01 10 0.06 0.1 n/a 0.02

32 Product comparators for fuels: coal
References BGS, 2010a. Coal – commodity profile. Keyworth, Nottingham: British Geological Survey.
BGS, 2010b. Mineral planning factsheet – coal. Keyworth, Nottingham: British Geological Survey.
BSI, 1979. BS 4845-2:1979. Methods for sampling manufactured domestic solid smokeless fuels in small consignments of mass 50 kg to 5000 kg either in bulk or in bags. Sampling of solid smokeless fuels other than coke. London: British Standards Institution.
BSI, 2006. BS ISO 18283:2006. Hard coal and coke. Manual sampling. London: British Standards Institution.
CARBON TRUST, 2009. Biomass heating, a practical guide for potential users. London: The Carbon Trust.
COAL MERCHANTS FEDERATION, 2013. Approved coal merchants listing [online]. Alfreton, Derbyshire: Coal Merchants Federation. Available from: http://www.coalmerchantsfederation.co.uk/coal-merchants/approved-coal-merchant-listing [accessed 22 July 2014].
DECC, 2010. Digest of United Kingdom Energy Statistics 2010. London: Department of Energy and Climate Change.
DECC, 2012. DUKES: Calorific values. London: Department of Energy and Climate Change. Available from: https://www.gov.uk/government/statistical-data-sets/dukes-2012-calorific-values [accessed 22 July 2014].
DECC, 2013. DECC Energy trends: June 2013. London: Department of Energy and Climate Change. Available from: https://www.gov.uk/government/publications/energy-trends-june-2013 [accessed 22 July 2014].
EURELECTRIC, 2001. Eurelectric proposal for a Best Available Techniques Reference Document for Large Combustion Plants. Brussels: Eurelectric.
EUROCOAL, 2013. Country profiles: United Kingdom [online]. Brussels: European Association of Coal and Lignite. Available from: http://www.euracoal.be/pages/layout1sp.php?idpage=82 [accessed 22 July 2014].
EUROPEAN COMMISSION, 2006. Integrated Pollution Prevention and Control, Reference Document on Best Available Techniques for Large Combustion Plants. Brussels: European Commission.
FINNISH ENVIRONMENT INSTITUTE, 2001. Finnish expert report on Best Available Techniques in large combustion plants. The Finnish Environment 458. Helsinki: EDITA. Available from: https://helda.helsinki.fi/handle/10138/40632 [accessed 22 July 2014].
JOINT RESEARCH CENTRE, 2013. Best Available Techniques (BAT) Reference Document for the Large Combustion Plants. Industrial Emissions Directive. Draft 1, June 2013. Brussels: European Commission.
SOLID FUEL ASSOCIATION, 2013. The guide to solid fuels. Alfreton, Derbyshire: Solid Fuel Association. Available from: http://specflue.com/resources/content/file/regulations-others/solid-fuel-guide.pdf [accessed 22 July 2014].

UBA, 2000. Stand der Technik für Großfeuerungsanlagen in Österreich im Hinblick auf die IPPC-RL. Vienna: Umweltbundesamt [Austrian Environment Agency].
34 Product comparators for fuels: coal
List of abbreviations Ag Silver
Al Aluminium
As Arsenic
B Boron
Ba Barium
Be Beryllium
BTEX Benzene, toluene, ethylbenzene, xylene
C Carbon
Ca Calcium
Cd Cadmium
Chromium VI Chromium Hexavalent
Co Cobalt
Cr Chromium
Cu Copper
CV calorific value
DCM dichloromethane
DW dry weight
Fe Iron
GCMS gas chromatography–mass spectrometry
Hg Mercury
HR high resolution
ICP-OES inductively coupled plasma optical emission spectrometry
K Potassium
LE Leeds laboratory of NLS
Li Lithium
LOD limit of detection
LoI loss on ignition
MCERTS Environment Agency's Monitoring Certification Scheme
Mg Magnesium
Mn Manganese
Mo Molybdenum
N Nitrogen
Na Sodium
NH3 as N Ammoniacal nitrogen
NH4 Ammonium
Ni Nickel
NLS National Laboratory Service [Environment Agency]
NO2 Nitrogen dioxide
P Phosphorus
PAH polycyclic aromatic hydrocarbon
Pb Lead
PSD particle size distribution
PTEs Potentially Toxic Elements
SAL Scientific Analysis Laboratories Limited
Sb Antimony
Se Selenium
Sn Tin
Sr Strontium
TC total carbon
TC total carbon
Ti Titanium
Tl Thallium
TN total nitrogen
TN total nitrogen
TOC total organic carbon
TON total organic nitrogen
USEPA United States Environmental Protection Agency
V Vanadium
Zn Zinc

15 of 15
www.gov.uk/environment-agency