materials & design - core
TRANSCRIPT

Contents lists available at ScienceDirect
Materials & Design
journal homepage: www.elsevier.com/locate/matdes
Macro- and micro-modeling of crack propagation in encapsulation-basedself-healing materials: Application of XFEM and cohesive surface techniques
F.A. Gilaberta,b,*, D. Garoza,b, W. Van Paepegema
a Ghent University, Department of Materials, Textiles and Chemical Engineering, Tech Lane Ghent Science Park - Campus A, Technologiepark-Zwijnaarde 903, Zwijnaarde(Ghent) 9052, Belgiumb SIM vzw, Technologiepark 935, Zwijnaarde 9052, Belgium
A R T I C L E I N F O
Keywords:Self-healing materialsMicro-capsulesCrack propagationDebondingCohesive zoneExtended finite element method
A B S T R A C T
Encapsulation-based materials are produced introducing some small healing fluid-filled capsules in a matrix.These materials can self-heal when internal cracks intercept and break the capsules. If the healing agent isreleased, the crack can be sealed. However, this is not always the case. These capsules need to be designed withthe adequate shape and material to be properly broken. This paper presents two application models based on thecombination of eXtended Finite Element Method (XFEM) elements and Cohesive Surfaces technique (CS) topredict crack propagation. Two types of encapsulated systems are considered: a concrete beam in a three-pointbending test, and a micro-scale model of a representative volume element of a polymer subjected to a uniaxialtensile test. Despite both systems relying on different capsule shapes and different constituent materials, themodels predict a similar non-linear response of the overall material strength governed by the coupled effect ofthe interface strength and the capsule radii-to-thickness ratio. Furthermore, even if an inadequate material andgeometry combination is used, it is found that the mere presence of capsules might achieve, under certainconditions, an interesting overall reinforcement effect. This effect is discussed in terms of clustering and volumefraction of capsules.
G R A P H I C A L A B S T R A C T
1. Introduction
The fundamental feature of any encapsulation-based self-healingmaterial relies on inserting small fluid-filled capsules in a matrix [1–5].
When the matrix is internally damaged, cracks can intercept thesecapsules and transfer the stresses at the their propagating fronts to thecapsules. In that sense, three basic scenarios can be produced: (i) thecapsules are not able to withstand the stress concentration and they
http://dx.doi.org/10.1016/j.matdes.2017.05.050Received 22 February 2017; Received in revised form 16 May 2017; Accepted 17 May 2017
* Corresponding author.E-mail address: [email protected] (F.A. Gilabert).
Materials & Design 130 (2017) 459–478
Available online 18 May 20170264-1275/ © 2017 Elsevier Ltd. All rights reserved.
MARK

break, releasing in this way the healing fluid content inside the crackspace, (ii) the constitution of the capsules is robust enough as towithstand comfortably much higher stresses, while the interface withthe the matrix fails, and (iii) the level of transferred stresses is notsufficient either to break the capsule nor the interface with the matrix.Naturally, (i) represents the desired scenario for this self-healingstrategy. In this case, the healing agent can spread into the crack spacevia capillarity. To complete the healing process, this initially-fluid agentcan cure after some reaction, in such a way that the crack path becomessealed and the final internal structure is partially repaired [6]. If thescenarios (ii) or (iii) occur, it is clear that this self-healing strategycannot be carried out successfully. In particular, (ii) involves that anincoming crack will simply trigger a premature debonding, similarly towhat happens when a solid inclusion is weakly bonded to a matrix [7,8].Also, even if premature capsule debonding takes place before the crackinterception, a hole-liked region could be created and thereforeadditional nearby cracks would be attracted. These cracks would simplypass along the capsule perimeter and continue their path again throughthe matrix [9,10]. This situation would not only result in an intactcapsule preventing the internal repairing, but it might also acceleratethe level of damage in the matrix. Regarding scenario (iii), albeit nohealing effect would be triggered a priori, it might still produce somebeneficial aspects in terms of mechanical reinforcement. Nevertheless,this reinforcement effect would naturally depend on the characteristicsand properties of each constituent, as well as on the mechanicalperformance of the interface.
In terms of designing a predictive tool, the interest in encapsulation-based self-healing strategy is currently leading to an increase oftheoretical and numerical works with the aim of getting a betterunderstanding of its mechanisms and determining the key factors toimprove efficiency and feasibility [11–15]. In spite of this, most modelsdeal with very specific application-oriented materials and also assumespecific geometries, boundary conditions and loading configuration.Moreover, the mere presence of the capsule-matrix interface hasreceived less attention, when not neglected. As an example, withinthe context of cementitious materials, even when the interface has beenaccounted for, these models often assume a certain range of typicalvalues of the interface properties, which are selected as a function ofmechanical similarities given by composition or the degree of brittle-ness [16,17].
The motivation of this work is to propose a combination of flexibleand efficient enough numerical methodologies to assess, predict andinvestigate different mechanical aspects of an encapsulation-basedstructure. Simulating such structure, the researcher can analyze differ-ent combinations of materials and levels of load that might be probablydifficult to implement and/or measure experimentally. Therefore, theprediction of the aforementioned scenarios could be analyzed, as wellas any other situation that might not be expected in advance. Thismethodology is based on several well-established computational ap-proaches in the context of fracture mechanics, the extended finiteelement method (XFEM) and the surface-based cohesive technique (CS),and both are combined to the conventional finite element method todescribe regions where fracture mechanics is not needed. The mechan-ical properties required by these approaches, as well as the way tomeasure them can be experimentally identified with an acceptable levelof complexity.
There are some recent numerical studies combining XFEM andcohesive zone models. Ref. [18] presents a similar approach where amicro-scaled piece of a unidirectional carbon-reinforced laminate issubjected to a uniform tensile stress. Albeit the results obtainedcompare qualitatively well to the experimental observations, no furtherdetails about the mechanical response and reliability of the mesh at thisscale is presented. Ref. [19] analyzes the debonding between fibers andthe surrounding polymer matrix in long fiber reinforced composites. Inthis two-dimensional configuration, the fiber-matrix interface is inte-grated into the XFEM scheme by using the Level-Set method and acohesive interaction law is only considered for the enriched nodes ofthe interface. Ref. [20] addresses a two-dimensional problem tounderstand the fracture behavior of asphalt mixtures taking into
account the interaction between their constituents and the matrix. Thiswork describes the aggregates via XFEM embedded in a non-fracturablevisco-elastic matrix, while the interface is represented using cohesiveelements with finite thickness. Ref. [21] predicts the microcrackingdistributions and permeability in composite laminates. In this case,XFEM is used to describe the intra-laminar fracture process while thedelamination between plies is represented by means of cohesivesurfaces.
This numerical paper is devoted to present and describe in detailtwo well-defined examples in the context of encapsulation-basedmaterials: concrete and polymer. In that sense, the influence of differentaspects of the system design is numerically predicted (e.g., size,geometry, position and number of capsules). From the experimentalpoint of view, to carry out an equivalent analysis would be unafford-able, and in part, what motivated to perform this work. Related to this,several detailed micro-mechanical aspects are presented, like forexample the distribution of stresses between capsules or the range ofbonding strength to capsule strength ratio to produce debonding orbreakage. In terms of validation, the comparison of the proposedmethodology with more simplified experimental setups is ongoingand it lays in the scope of a forthcoming work. It must be noted that,due to the numerical character of this paper, computational aspects likemesh convergence, parameter sensitivity or computational cost arethoroughly addressed, with the aim of providing reliable and feasibleresults for the next stage of validation.
This work is organized as follows. Section 2 presents a summary ofthe numerical approach that will be used in the following sections: thecombination of XFEM and the CS technique implemented in thecommercial software Abaqus. Details about the criteria regardinginitiation and propagation of cracks and interface debonding areprovided. Section 3 shows how this methodology can be applied tomodel in detail a realistic setup typically used to assess the encapsula-tion-based self-healing strategy in concrete structures. A numericalanalysis to foresee the effect of capsules in the overall mechanicalstrength is provided and discussed. Section 4 addresses a similar studybut oriented to a quite different material system and configuration,namely, encapsulation-based self-healing polymer materials. Unlike theprevious section, here a micro-scale model is presented, where theinteraction of a polymeric capsule with the surrounding polymer matrixis fully analyzed under periodic boundary conditions. This configura-tion makes it possible to assess in an efficient way the effect ofimportant design variables like the capsule volume fraction. Theprediction of the homogenized mechanical properties is presentedand discussed in terms of the information available in the literature.Section 5 is devoted to establishing the limitations found so far duringthe execution of this approach using the commercial software to carryout this work. This paper finishes with Section 6 providing a summaryof the main findings and some remarks about the applicability of theresults.
2. Modeling framework
The simulations performed in this work rely on the combination oftwo computational techniques. On the one hand, the XFEM has beenused to model the initiation and propagation of a crack that might beinitiated both in the matrix and in the capsule. On the other hand, thesetwo parts are attached to each other by means of the correspondinginterface. The interaction between both surfaces is implemented via asurface-based cohesive behavior governed by a traction-separation law.Although a more specific description of these techniques can be foundin ref. [22], for the sake of clarity, both techniques are summarized inthe following paragraphs.
2.1. XFEM-based cohesive segments to model solids
This work uses a built-in implementation available in the commer-cial software Abaqus, where the cracks do not have to be prescribed andtherefore, the initial solid structure is intact. Two criteria must bedefined: the initiation of a crack and the propagation of such crack. This
F.A. Gilabert et al. Materials & Design 130 (2017) 459–478
460
procedure relies on the explicit determination of the crack faces, whoselocations are used to establish an interaction law between both lipswhich is dependent on the magnitude of their separation. Meshdiscontinuities representing cracks are carried out with a combinedstrategy using the phantom node technique [23,24] and the Level Setmethod [25,26]. Both procedures prevent the need of including thesingular-dependence of the stresses around the crack-tip and the needto make the crack paths independent of the geometrical features of themesh. A crack can appear in the centroid of any element of the meshwhen the maximum principal stress calculated in its integration pointssatisfies the following criterion
{ }σσ
max 0,*
≥ 1maxps
(1)
where σmaxps is the calculated maximum principal stress and σ* standsfor the maximum strength of the material. The adopted criterionindicates that a negative principal stress does not have any effect onthe fracture response: the element cannot be fractured if it undergoes acompressive stress that exceeds the material strength σ*. Therefore, thissituation implies two things: (i) the physical meaning of σ* is themaximum tensile strength of the material, and (ii) Eq. (1) cannot beused as the only fracture criterion if crushing mode is also a dominantfailure mode in the material. The extension of an already started (orprescribed) crack will occur if the element ahead of such crack fulfillsEq. (1), in which case the crack length will increase with a new segmentcutting it.
After satisfying Eq. (1) in a certain element, a discontinuity orientedorthogonally to the maximum principal direction is introduced in thatelement. This discontinuity is represented by means of a jump in thenodal displacements via the phantom node method [23], which consistsof adding an extra superposed node to every mesh node. When a meshelement is pristine, the phantom node overlaps and follows the move-ment of the real node. However, if an element is decided to be broken,the phantom nodes bounding this element are activated and theirmovements are decoupled from the real nodes. This extra set of nodesallows for unfolding the field of displacements of the original elementinto two parts. The physical location of the crack lips is determinedusing the Level Set method, which makes use of two signed distancefunctions to locate the material points above or below the crack surface,as well as those points laying ahead or behind the crack front. Fulldetails can be found in refs. [25–28]. The amount of separation betweena real node and its corresponding phantom node is ruled by a cohesive-like law. Both nodes become fully independent once the relativedistance between them exceeds the cohesive threshold.
The aforementioned cohesive law, the so-called damage evolutionlaw, controls the degree of softening, or cohesive stiffness, when thecrack opens. Immediately after the insertion of the crack, the cohesive
traction between the crack lips is set equal to the material strength (σ*).Abaqus uses an “extrinsic” approach [29], which means that theevolution law is formulated independently from the initiation criterion,because the crack location is not known a priori. For the sake ofconciseness, only the damage evolution of the normal component to thecrack faces is described next.
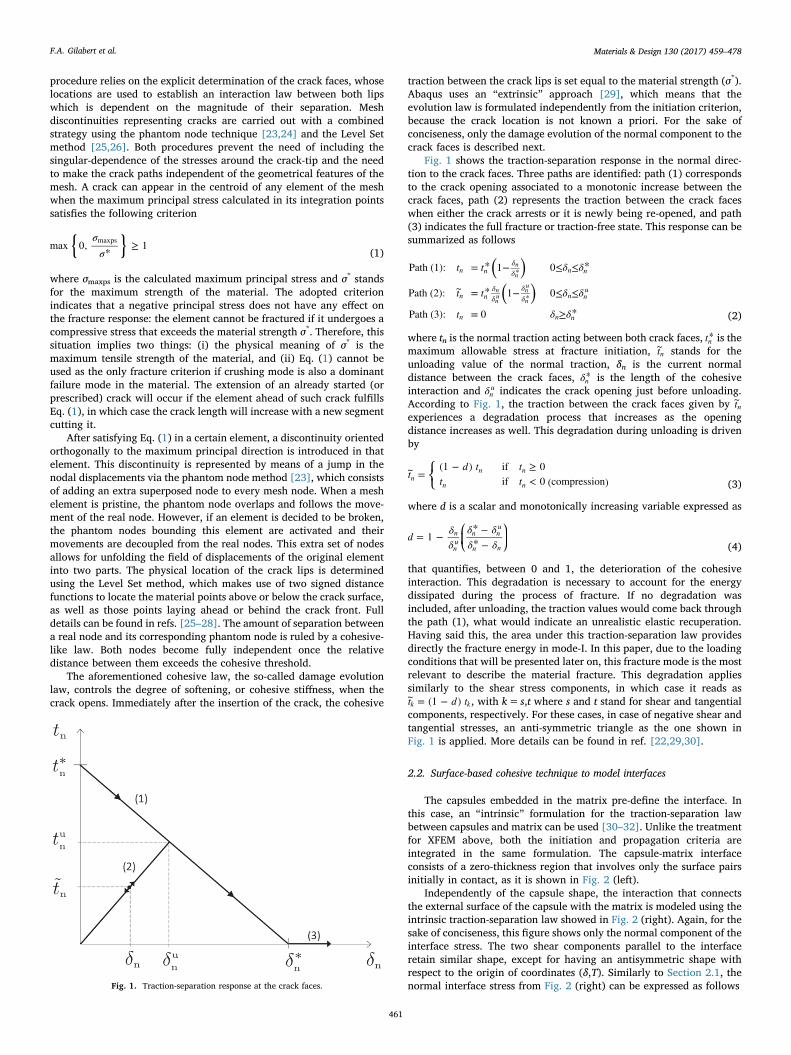
Fig. 1 shows the traction-separation response in the normal direc-tion to the crack faces. Three paths are identified: path (1) correspondsto the crack opening associated to a monotonic increase between thecrack faces, path (2) represents the traction between the crack faceswhen either the crack arrests or it is newly being re-opened, and path(3) indicates the full fracture or traction-free state. This response can besummarized as follows
( )( )
t t δ δ
t t δ δ
t δ δ
Path (1): = * 1− 0≤ ≤ *
Path (2): ~ = * 1− 0≤ ≤
Path (3): = 0 ≥ *
n nδδ n n
n nδδ
δδ n n
u
n n n
*
*
nn
nnu
nu
n
(2)
where tn is the normal traction acting between both crack faces, t*n is themaximum allowable stress at fracture initiation, t~n stands for theunloading value of the normal traction, δn is the current normaldistance between the crack faces, δ*n is the length of the cohesiveinteraction and δn
u indicates the crack opening just before unloading.According to Fig. 1, the traction between the crack faces given by t~nexperiences a degradation process that increases as the openingdistance increases as well. This degradation during unloading is drivenby
⎧⎨⎩td t t
t t~ =
(1 − ) if ≥ 0if < 0 (compression)n
n n
n n (3)
where d is a scalar and monotonically increasing variable expressed as
⎛⎝⎜
⎞⎠⎟d δ
δδ δδ δ
= 1 −* −* −
n
nu
n nu
n n (4)
that quantifies, between 0 and 1, the deterioration of the cohesiveinteraction. This degradation is necessary to account for the energydissipated during the process of fracture. If no degradation wasincluded, after unloading, the traction values would come back throughthe path (1), what would indicate an unrealistic elastic recuperation.Having said this, the area under this traction-separation law providesdirectly the fracture energy in mode-I. In this paper, due to the loadingconditions that will be presented later on, this fracture mode is the mostrelevant to describe the material fracture. This degradation appliessimilarly to the shear stress components, in which case it reads ast d t~ = (1 − )k k, with k= s,t where s and t stand for shear and tangentialcomponents, respectively. For these cases, in case of negative shear andtangential stresses, an anti-symmetric triangle as the one shown inFig. 1 is applied. More details can be found in ref. [22,29,30].
2.2. Surface-based cohesive technique to model interfaces
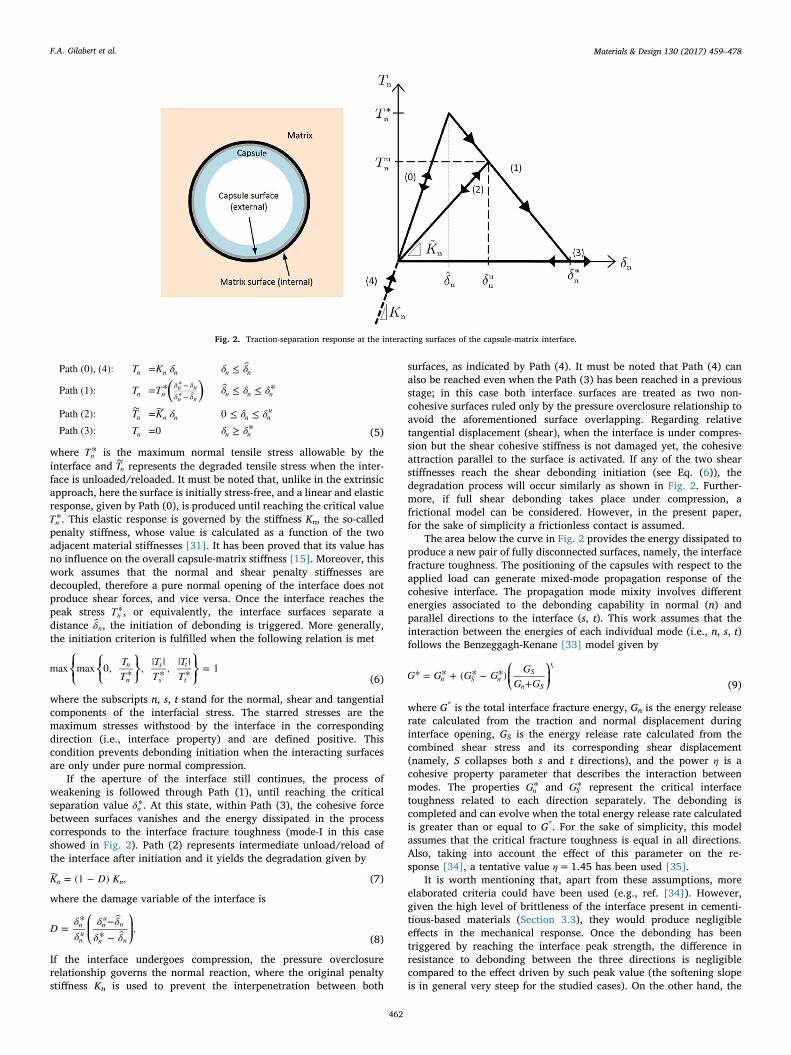
The capsules embedded in the matrix pre-define the interface. Inthis case, an “intrinsic” formulation for the traction-separation lawbetween capsules and matrix can be used [30–32]. Unlike the treatmentfor XFEM above, both the initiation and propagation criteria areintegrated in the same formulation. The capsule-matrix interfaceconsists of a zero-thickness region that involves only the surface pairsinitially in contact, as it is shown in Fig. 2 (left).
Independently of the capsule shape, the interaction that connectsthe external surface of the capsule with the matrix is modeled using theintrinsic traction-separation law showed in Fig. 2 (right). Again, for thesake of conciseness, this figure shows only the normal component of theinterface stress. The two shear components parallel to the interfaceretain similar shape, except for having an antisymmetric shape withrespect to the origin of coordinates (δ,T). Similarly to Section 2.1, thenormal interface stress from Fig. 2 (right) can be expressed as followsFig. 1. Traction-separation response at the crack faces.
F.A. Gilabert et al. Materials & Design 130 (2017) 459–478
461
( )T K δ δ δ
T T δ δ δ
T K δ δ δT δ δ
Path (0), (4): = ≤
Path (1): = * ≤ ≤ *
Path (2): = 0 ≤ ≤Path (3): =0 ≥ *
∼
n n n n n
n nδ δδ δ n n n
n n n n nu
n n n
* −* −n n
n n
(5)
where T*n is the maximum normal tensile stress allowable by theinterface and T∼n represents the degraded tensile stress when the inter-face is unloaded/reloaded. It must be noted that, unlike in the extrinsicapproach, here the surface is initially stress-free, and a linear and elasticresponse, given by Path (0), is produced until reaching the critical valueT*n . This elastic response is governed by the stiffness Kn, the so-calledpenalty stiffness, whose value is calculated as a function of the twoadjacent material stiffnesses [31]. It has been proved that its value hasno influence on the overall capsule-matrix stiffness [15]. Moreover, thiswork assumes that the normal and shear penalty stiffnesses aredecoupled, therefore a pure normal opening of the interface does notproduce shear forces, and vice versa. Once the interface reaches thepeak stress T*n , or equivalently, the interface surfaces separate adistance δn , the initiation of debonding is triggered. More generally,the initiation criterion is fulfilled when the following relation is met
⎪ ⎪
⎪ ⎪⎧⎨⎩⎧⎨⎩
⎫⎬⎭⎫⎬⎭
TT
TT
TT
max max 0, * , | |* , | |
* = 1n
n
s
s
t
t (6)
where the subscripts n, s, t stand for the normal, shear and tangentialcomponents of the interfacial stress. The starred stresses are themaximum stresses withstood by the interface in the correspondingdirection (i.e., interface property) and are defined positive. Thiscondition prevents debonding initiation when the interacting surfacesare only under pure normal compression.
If the aperture of the interface still continues, the process ofweakening is followed through Path (1), until reaching the criticalseparation value δ*n . At this state, within Path (3), the cohesive forcebetween surfaces vanishes and the energy dissipated in the processcorresponds to the interface fracture toughness (mode-I in this caseshowed in Fig. 2). Path (2) represents intermediate unload/reload ofthe interface after initiation and it yields the degradation given by
K D K= (1 − ) , n n (7)
where the damage variable of the interface is
⎛⎝⎜
⎞⎠⎟D
δδ
δ δδ δ
=* −
* −.n
nu
nu
n
n n
(8)
If the interface undergoes compression, the pressure overclosurerelationship governs the normal reaction, where the original penaltystiffness Kn is used to prevent the interpenetration between both
surfaces, as indicated by Path (4). It must be noted that Path (4) canalso be reached even when the Path (3) has been reached in a previousstage; in this case both interface surfaces are treated as two non-cohesive surfaces ruled only by the pressure overclosure relationship toavoid the aforementioned surface overlapping. Regarding relativetangential displacement (shear), when the interface is under compres-sion but the shear cohesive stiffness is not damaged yet, the cohesiveattraction parallel to the surface is activated. If any of the two shearstiffnesses reach the shear debonding initiation (see Eq. (6)), thedegradation process will occur similarly as shown in Fig. 2. Further-more, if full shear debonding takes place under compression, africtional model can be considered. However, in the present paper,for the sake of simplicity a frictionless contact is assumed.
The area below the curve in Fig. 2 provides the energy dissipated toproduce a new pair of fully disconnected surfaces, namely, the interfacefracture toughness. The positioning of the capsules with respect to theapplied load can generate mixed-mode propagation response of thecohesive interface. The propagation mode mixity involves differentenergies associated to the debonding capability in normal (n) andparallel directions to the interface (s, t). This work assumes that theinteraction between the energies of each individual mode (i.e., n, s, t)follows the Benzeggagh-Kenane [33] model given by
⎛⎝⎜
⎞⎠⎟G G G G G
G G* = * + ( * − *)
+n S nS
n S
η
(9)
where G* is the total interface fracture energy, Gn is the energy releaserate calculated from the traction and normal displacement duringinterface opening, GS is the energy release rate calculated from thecombined shear stress and its corresponding shear displacement(namely, S collapses both s and t directions), and the power η is acohesive property parameter that describes the interaction betweenmodes. The properties G*n and G*S represent the critical interfacetoughness related to each direction separately. The debonding iscompleted and can evolve when the total energy release rate calculatedis greater than or equal to G*. For the sake of simplicity, this modelassumes that the critical fracture toughness is equal in all directions.Also, taking into account the effect of this parameter on the re-sponse [34], a tentative value η=1.45 has been used [35].
It is worth mentioning that, apart from these assumptions, moreelaborated criteria could have been used (e.g., ref. [34]). However,given the high level of brittleness of the interface present in cementi-tious-based materials (Section 3.3), they would produce negligibleeffects in the mechanical response. Once the debonding has beentriggered by reaching the interface peak strength, the difference inresistance to debonding between the three directions is negligiblecompared to the effect driven by such peak value (the softening slopeis in general very steep for the studied cases). On the other hand, the
Fig. 2. Traction-separation response at the interacting surfaces of the capsule-matrix interface.
F.A. Gilabert et al. Materials & Design 130 (2017) 459–478
462
chemical affinity of the capsule and the matrix in polymer-basedsystems leads to quite strong interfaces. This situation rarely producesclear debonding, and therefore the breakage of the capsule becomes themain dominant mechanism. Anyway, both situations of capsule break-age and capsule debonding are equally studied in Section 4.1.
3. Model application to self-healing concrete
A common experimental setup used to assess the encapsulation-based self-healing strategy in concrete structures consists of using aclassical three-point bending test [36–39]. Cylindrical capsules made ofglass containing the healing agent are introduced in the mold with thehelp of a low-stiffness cord that sets their fixed position [39]. Afterpositioning the capsules, the concrete is poured into the mold, thecapsules being fully embedded in the concrete matrix. The choice ofusing glass capsules is mainly due to the brittleness matching of bothmaterials at the scale size of the concrete constituents.
3.1. Concrete beams with embedded tubular capsules
This section presents a model that simulates the mechanicalresponse of a realistic-sized notched concrete beam with several glasscapsules embedded in the middle region of the beam, where a crackpropagates till getting the total fracture of the beam. The aim of thissample model is to show how this methodology might be useful forexperimentalists in order to get a better understanding of the interac-tion between cracks and capsules in a more realistic situation. Althoughthe present example might be considered illustrative, the modeldeveloped for this work can easily be modified and used to exploredifferent situations that affect the capsule breakage. These factors couldbe the number, size and positions of the capsules, as well as the possiblemismatch of material properties (for example, quasi-brittle polymericcapsules), among others.
3.2. Numerical setup
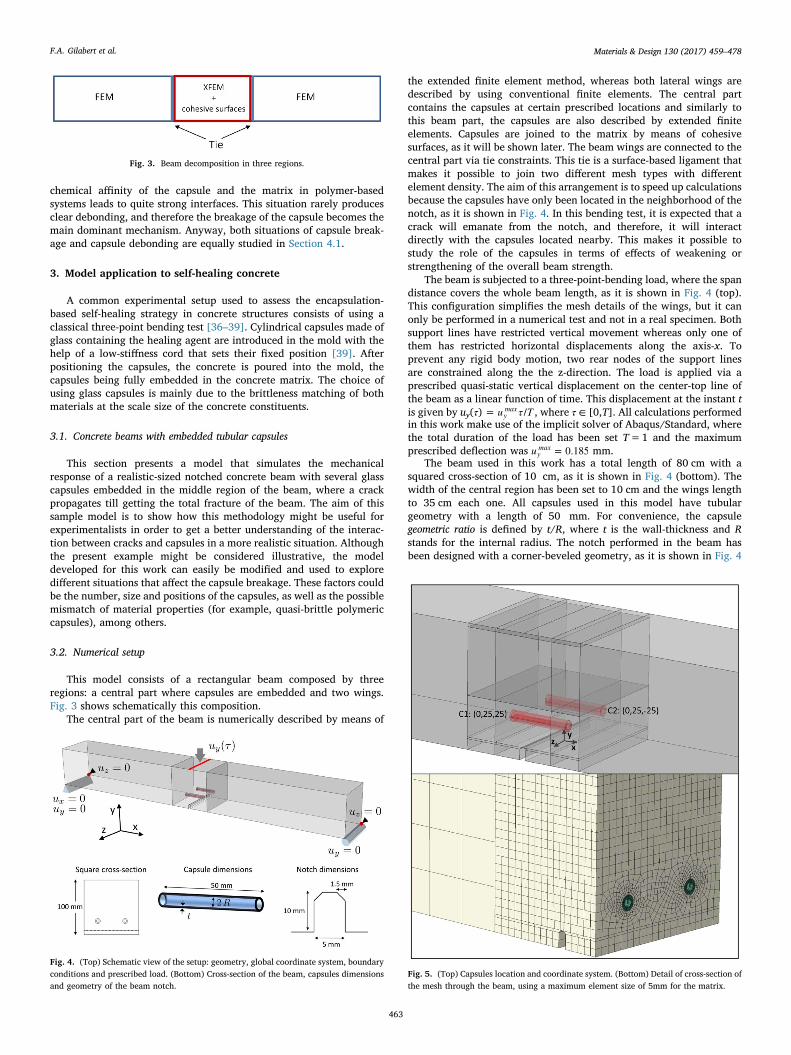
This model consists of a rectangular beam composed by threeregions: a central part where capsules are embedded and two wings.Fig. 3 shows schematically this composition.
The central part of the beam is numerically described by means of
the extended finite element method, whereas both lateral wings aredescribed by using conventional finite elements. The central partcontains the capsules at certain prescribed locations and similarly tothis beam part, the capsules are also described by extended finiteelements. Capsules are joined to the matrix by means of cohesivesurfaces, as it will be shown later. The beam wings are connected to thecentral part via tie constraints. This tie is a surface-based ligament thatmakes it possible to join two different mesh types with differentelement density. The aim of this arrangement is to speed up calculationsbecause the capsules have only been located in the neighborhood of thenotch, as it is shown in Fig. 4. In this bending test, it is expected that acrack will emanate from the notch, and therefore, it will interactdirectly with the capsules located nearby. This makes it possible tostudy the role of the capsules in terms of effects of weakening orstrengthening of the overall beam strength.
The beam is subjected to a three-point-bending load, where the spandistance covers the whole beam length, as it is shown in Fig. 4 (top).This configuration simplifies the mesh details of the wings, but it canonly be performed in a numerical test and not in a real specimen. Bothsupport lines have restricted vertical movement whereas only one ofthem has restricted horizontal displacements along the axis-x. Toprevent any rigid body motion, two rear nodes of the support linesare constrained along the the z-direction. The load is applied via aprescribed quasi-static vertical displacement on the center-top line ofthe beam as a linear function of time. This displacement at the instant tis given by uy(τ) = u τ T/y
max , where τ ∈ [0,T]. All calculations performedin this work make use of the implicit solver of Abaqus/Standard, wherethe total duration of the load has been set T=1 and the maximumprescribed deflection was u = 0.185y
max mm.The beam used in this work has a total length of 80 cm with a
squared cross-section of 10 cm, as it is shown in Fig. 4 (bottom). Thewidth of the central region has been set to 10 cm and the wings lengthto 35 cm each one. All capsules used in this model have tubulargeometry with a length of 50 mm. For convenience, the capsulegeometric ratio is defined by t/R, where t is the wall-thickness and Rstands for the internal radius. The notch performed in the beam hasbeen designed with a corner-beveled geometry, as it is shown in Fig. 4
Fig. 3. Beam decomposition in three regions.
Fig. 4. (Top) Schematic view of the setup: geometry, global coordinate system, boundaryconditions and prescribed load. (Bottom) Cross-section of the beam, capsules dimensionsand geometry of the beam notch.
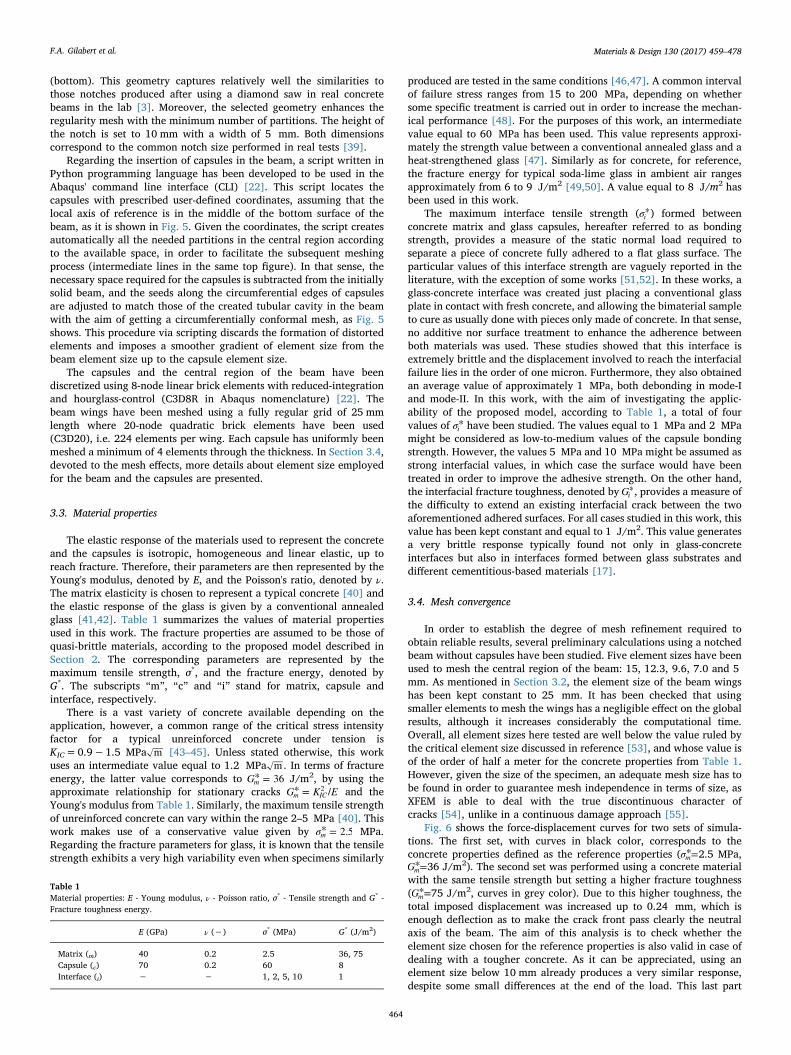
Fig. 5. (Top) Capsules location and coordinate system. (Bottom) Detail of cross-section ofthe mesh through the beam, using a maximum element size of 5mm for the matrix.
F.A. Gilabert et al. Materials & Design 130 (2017) 459–478
463
(bottom). This geometry captures relatively well the similarities tothose notches produced after using a diamond saw in real concretebeams in the lab [3]. Moreover, the selected geometry enhances theregularity mesh with the minimum number of partitions. The height ofthe notch is set to 10 mm with a width of 5 mm. Both dimensionscorrespond to the common notch size performed in real tests [39].
Regarding the insertion of capsules in the beam, a script written inPython programming language has been developed to be used in theAbaqus' command line interface (CLI) [22]. This script locates thecapsules with prescribed user-defined coordinates, assuming that thelocal axis of reference is in the middle of the bottom surface of thebeam, as it is shown in Fig. 5. Given the coordinates, the script createsautomatically all the needed partitions in the central region accordingto the available space, in order to facilitate the subsequent meshingprocess (intermediate lines in the same top figure). In that sense, thenecessary space required for the capsules is subtracted from the initiallysolid beam, and the seeds along the circumferential edges of capsulesare adjusted to match those of the created tubular cavity in the beamwith the aim of getting a circumferentially conformal mesh, as Fig. 5shows. This procedure via scripting discards the formation of distortedelements and imposes a smoother gradient of element size from thebeam element size up to the capsule element size.
The capsules and the central region of the beam have beendiscretized using 8-node linear brick elements with reduced-integrationand hourglass-control (C3D8R in Abaqus nomenclature) [22]. Thebeam wings have been meshed using a fully regular grid of 25 mmlength where 20-node quadratic brick elements have been used(C3D20), i.e. 224 elements per wing. Each capsule has uniformly beenmeshed a minimum of 4 elements through the thickness. In Section 3.4,devoted to the mesh effects, more details about element size employedfor the beam and the capsules are presented.
3.3. Material properties
The elastic response of the materials used to represent the concreteand the capsules is isotropic, homogeneous and linear elastic, up toreach fracture. Therefore, their parameters are then represented by theYoung's modulus, denoted by E, and the Poisson's ratio, denoted by ν.The matrix elasticity is chosen to represent a typical concrete [40] andthe elastic response of the glass is given by a conventional annealedglass [41,42]. Table 1 summarizes the values of material propertiesused in this work. The fracture properties are assumed to be those ofquasi-brittle materials, according to the proposed model described inSection 2. The corresponding parameters are represented by themaximum tensile strength, σ*, and the fracture energy, denoted byG*. The subscripts “m”, “c” and “i” stand for matrix, capsule andinterface, respectively.
There is a vast variety of concrete available depending on theapplication, however, a common range of the critical stress intensityfactor for a typical unreinforced concrete under tension isKIC=0.9−1.5 MPa m [43–45]. Unless stated otherwise, this workuses an intermediate value equal to 1.2 MPa m . In terms of fractureenergy, the latter value corresponds to G* = 36m J/m2, by using theapproximate relationship for stationary cracks G K E* = /m IC
2 and theYoung's modulus from Table 1. Similarly, the maximum tensile strengthof unreinforced concrete can vary within the range 2–5 MPa [40]. Thiswork makes use of a conservative value given by σ* = 2.5m MPa.Regarding the fracture parameters for glass, it is known that the tensilestrength exhibits a very high variability even when specimens similarly
produced are tested in the same conditions [46,47]. A common intervalof failure stress ranges from 15 to 200 MPa, depending on whethersome specific treatment is carried out in order to increase the mechan-ical performance [48]. For the purposes of this work, an intermediatevalue equal to 60 MPa has been used. This value represents approxi-mately the strength value between a conventional annealed glass and aheat-strengthened glass [47]. Similarly as for concrete, for reference,the fracture energy for typical soda-lime glass in ambient air rangesapproximately from 6 to 9 J/m2 [49,50]. A value equal to 8 J/m2 hasbeen used in this work.
The maximum interface tensile strength (σ*i ) formed betweenconcrete matrix and glass capsules, hereafter referred to as bondingstrength, provides a measure of the static normal load required toseparate a piece of concrete fully adhered to a flat glass surface. Theparticular values of this interface strength are vaguely reported in theliterature, with the exception of some works [51,52]. In these works, aglass-concrete interface was created just placing a conventional glassplate in contact with fresh concrete, and allowing the bimaterial sampleto cure as usually done with pieces only made of concrete. In that sense,no additive nor surface treatment to enhance the adherence betweenboth materials was used. These studies showed that this interface isextremely brittle and the displacement involved to reach the interfacialfailure lies in the order of one micron. Furthermore, they also obtainedan average value of approximately 1 MPa, both debonding in mode-Iand mode-II. In this work, with the aim of investigating the applic-ability of the proposed model, according to Table 1, a total of fourvalues of σ*i have been studied. The values equal to 1 MPa and 2 MPamight be considered as low-to-medium values of the capsule bondingstrength. However, the values 5 MPa and 10 MPa might be assumed asstrong interfacial values, in which case the surface would have beentreated in order to improve the adhesive strength. On the other hand,the interfacial fracture toughness, denoted by G*i , provides a measure ofthe difficulty to extend an existing interfacial crack between the twoaforementioned adhered surfaces. For all cases studied in this work, thisvalue has been kept constant and equal to 1 J/m2. This value generatesa very brittle response typically found not only in glass-concreteinterfaces but also in interfaces formed between glass substrates anddifferent cementitious-based materials [17].
3.4. Mesh convergence
In order to establish the degree of mesh refinement required toobtain reliable results, several preliminary calculations using a notchedbeam without capsules have been studied. Five element sizes have beenused to mesh the central region of the beam: 15, 12.3, 9.6, 7.0 and 5mm. As mentioned in Section 3.2, the element size of the beam wingshas been kept constant to 25 mm. It has been checked that usingsmaller elements to mesh the wings has a negligible effect on the globalresults, although it increases considerably the computational time.Overall, all element sizes here tested are well below the value ruled bythe critical element size discussed in reference [53], and whose value isof the order of half a meter for the concrete properties from Table 1.However, given the size of the specimen, an adequate mesh size has tobe found in order to guarantee mesh independence in terms of size, asXFEM is able to deal with the true discontinuous character ofcracks [54], unlike in a continuous damage approach [55].
Fig. 6 shows the force-displacement curves for two sets of simula-tions. The first set, with curves in black color, corresponds to theconcrete properties defined as the reference properties (σ*=m 2.5 MPa,G*=m 36 J/m2). The second set was performed using a concrete materialwith the same tensile strength but setting a higher fracture toughness(G*=m 75 J/m2, curves in grey color). Due to this higher toughness, thetotal imposed displacement was increased up to 0.24 mm, which isenough deflection as to make the crack front pass clearly the neutralaxis of the beam. The aim of this analysis is to check whether theelement size chosen for the reference properties is also valid in case ofdealing with a tougher concrete. As it can be appreciated, using anelement size below 10 mm already produces a very similar response,despite some small differences at the end of the load. This last part
Table 1Material properties: E - Young modulus, ν - Poisson ratio, σ* - Tensile strength and G* -Fracture toughness energy.
E (GPa) ν (−) σ* (MPa) G* (J/m2)
Matrix (m) 40 0.2 2.5 36, 75Capsule (c) 70 0.2 60 8Interface (i) − − 1, 2, 5, 10 1
F.A. Gilabert et al. Materials & Design 130 (2017) 459–478
464
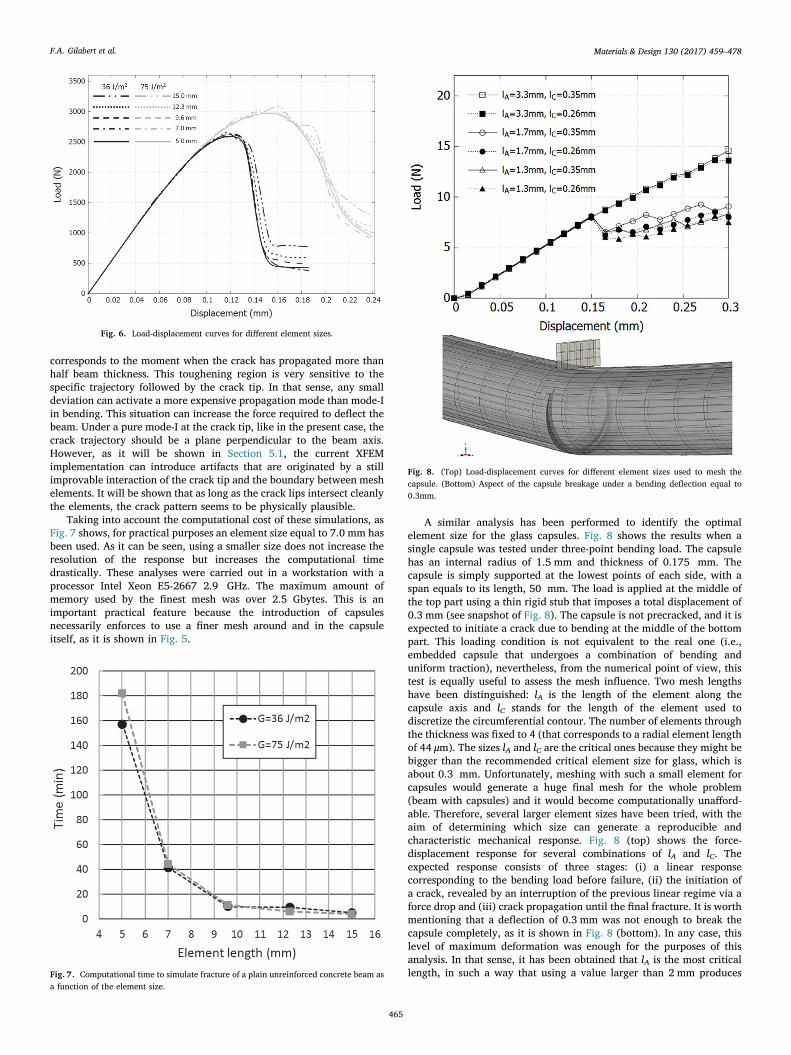
corresponds to the moment when the crack has propagated more thanhalf beam thickness. This toughening region is very sensitive to thespecific trajectory followed by the crack tip. In that sense, any smalldeviation can activate a more expensive propagation mode than mode-Iin bending. This situation can increase the force required to deflect thebeam. Under a pure mode-I at the crack tip, like in the present case, thecrack trajectory should be a plane perpendicular to the beam axis.However, as it will be shown in Section 5.1, the current XFEMimplementation can introduce artifacts that are originated by a stillimprovable interaction of the crack tip and the boundary between meshelements. It will be shown that as long as the crack lips intersect cleanlythe elements, the crack pattern seems to be physically plausible.
Taking into account the computational cost of these simulations, asFig. 7 shows, for practical purposes an element size equal to 7.0 mm hasbeen used. As it can be seen, using a smaller size does not increase theresolution of the response but increases the computational timedrastically. These analyses were carried out in a workstation with aprocessor Intel Xeon E5-2667 2.9 GHz. The maximum amount ofmemory used by the finest mesh was over 2.5 Gbytes. This is animportant practical feature because the introduction of capsulesnecessarily enforces to use a finer mesh around and in the capsuleitself, as it is shown in Fig. 5.
A similar analysis has been performed to identify the optimalelement size for the glass capsules. Fig. 8 shows the results when asingle capsule was tested under three-point bending load. The capsulehas an internal radius of 1.5 mm and thickness of 0.175 mm. Thecapsule is simply supported at the lowest points of each side, with aspan equals to its length, 50 mm. The load is applied at the middle ofthe top part using a thin rigid stub that imposes a total displacement of0.3 mm (see snapshot of Fig. 8). The capsule is not precracked, and it isexpected to initiate a crack due to bending at the middle of the bottompart. This loading condition is not equivalent to the real one (i.e.,embedded capsule that undergoes a combination of bending anduniform traction), nevertheless, from the numerical point of view, thistest is equally useful to assess the mesh influence. Two mesh lengthshave been distinguished: lA is the length of the element along thecapsule axis and lC stands for the length of the element used todiscretize the circumferential contour. The number of elements throughthe thickness was fixed to 4 (that corresponds to a radial element lengthof 44 μm). The sizes lA and lC are the critical ones because they might bebigger than the recommended critical element size for glass, which isabout 0.3 mm. Unfortunately, meshing with such a small element forcapsules would generate a huge final mesh for the whole problem(beam with capsules) and it would become computationally unafford-able. Therefore, several larger element sizes have been tried, with theaim of determining which size can generate a reproducible andcharacteristic mechanical response. Fig. 8 (top) shows the force-displacement response for several combinations of lA and lC. Theexpected response consists of three stages: (i) a linear responsecorresponding to the bending load before failure, (ii) the initiation ofa crack, revealed by an interruption of the previous linear regime via aforce drop and (iii) crack propagation until the final fracture. It is worthmentioning that a deflection of 0.3 mm was not enough to break thecapsule completely, as it is shown in Fig. 8 (bottom). In any case, thislevel of maximum deformation was enough for the purposes of thisanalysis. In that sense, it has been obtained that lA is the most criticallength, in such a way that using a value larger than 2 mm produces
Fig. 6. Load-displacement curves for different element sizes.
Fig. 7. Computational time to simulate fracture of a plain unreinforced concrete beam asa function of the element size.
Fig. 8. (Top) Load-displacement curves for different element sizes used to mesh thecapsule. (Bottom) Aspect of the capsule breakage under a bending deflection equal to0.3mm.
F.A. Gilabert et al. Materials & Design 130 (2017) 459–478
465

visible deviation of the expected response. However, using a circumfer-ential length of 0.35 mm or 0.26 mm produced small differences.Therefore, the pair of values given by lA=1.7 mm (30 axial elements)and lC=0.26 mm (a minimum of 40 circumferential elements) wereused, as they represent an acceptable compromise between accuracyand computational effort. Regarding the interface, taking into accountthe elasticity of the two adjacent materials (concrete and glass) and thelow level of bonding strength, it has been checked that the selectedmeshes behave consistently with what has been reported by otherauthors [31,56].
3.5. Interface effect on bending response
This section presents the mechanical response under bending of thebeam shown in Fig. 4. This beam contains two capsules, and they areinserted with a distance of 25 mm above the notch.
By using the proposed model, two different, but related, mechanicalaspects are studied: on the one hand, the role of the insertion ofcapsules in the reinforcement or weakening effect of the overall beamstrength under bending, and on the other hand, the analysis of whichinterface strength and capsule size are more beneficial to make thecapsules break properly and, in this way, carry out the leaking of thehealing agent into the crack. Regarding the latest aspect, this work isrestricted to analyze the breakage of the capsules, and therefore theyare assumed empty.
It is worth mentioning that in the case studied, the beam has acentral notch to constrain the crack path along its middle plane with theaim of enforcing the intersection with the capsules. This is a commonprocedure used in lab tests [3,57,58]. Therefore, the path will not beaffected by the material properties as it might occur if the absence ofsymmetries was constraining the problem [59].
Four values of the capsule geometric ratio were studied: t/R=0.12,0.23, 0.46, 0.8, being the pairs (t,R) = (0.175, 1.5), (0.4, 1.75), (0.92,2) and (2, 2.5), respectively (in mm). According to Table 1, also fourvalues of the maximum interface tensile strength (σ*i ) were used foreach geometric ratio. Therefore, these combinations of capsule size andinterface strength represented a total of 16 simulations.
Fig. 9 shows the response of the load as a function of the imposeddisplacement for three representative cases of bonding strength andcapsular geometric ratio. In this plot, the case σ* = 2i MPa has beenomitted because it produced a similar global response to the case σ* = 1iMPa. Similarly, for the sake of clarity, the case t/R=0.23 has also beenomitted in this figure. For reference, the result obtained from a concretebeam without capsules (labeled “Solid”, gray line) has also beenincluded in order to facilitate the comparison when the capsules arepresent. As expected, the insertion of only two capsules has no effect onthe global elastic response, because the capsule volume fraction is stillvery small compared to the volume fraction occupied by the concrete
material (≈99.92% for the case t/R=0.8). Fig. 9 shows that theinsertion of two small capsules (t/R=0.12) contributes very poorly tothe mechanical response, even though a strong bonding interface isused. In any case, it is expected that capsules with low cross-sectionalgeometric ratio (either the capsules detach or break), have a poor effecton the overall response under bending, mainly due to the weak effortsrequired to damage them. However, this situation changes when thickercapsules are used, as it will be shown later on. Nevertheless, due topractical reasons, such small capsule size is of great interest forexperimentalists in self-healing and therefore, the effect of the numberof capsules has been treated in more detail in the next Section 3.8. Also,as general feature from all cases, the presence of the capsule seems tomake the shape of the curve sharper, being this a consequence of thehigh degree of brittleness of the capsule as well as the low value of theinterface fracture energy (see Table 1). Fig. 9 clearly shows theimportant effect of the geometric ratio: when the capsules are better
Fig. 9. Load-displacement curves for different capsule-matrix interface strength (σ* = 1, 5, 10i MPa) and geometric ratios of the capsule (t/R=0.12,0.46,0.8).
Fig. 10. Maximum force developed by the beam as a function of the geometric ratio anddifferent interface strength levels. (D = debonding, B = breakage).
F.A. Gilabert et al. Materials & Design 130 (2017) 459–478
466
bonded to the matrix, the maximum force developed under bendingalso increases, although this increase, in a non-linear fashion somehow,becomes more evident when thicker capsules are employed.
3.6. Capsule size effect
Fig. 10 presents the maximum force extracted from the load-displacement curve as a function of the geometric ratio. In this plot,the dotted gray line establishes the baseline in strength calculated fromthe beam without capsules (Solid).
As it can be appreciated, albeit less visible in the previous Fig. 9, theinsertion of two small thin capsules (t/R=0.12) already leads to amoderate increase of the maximum load that the beam can resist underbending. In terms of reinforcement effects, when the bonding strengthequals 1 MPa, Fig. 10 shows that an increase of the geometric ratio hasa moderate rise of the peak force, although the capsules debond(labeled as “D”). This slight rise of load (for the thickest capsule upto∼ 200N) can be due to the amount of surface initially in contact withthe matrix: a capsule with larger external diameter has a larger areabonded to the matrix, and therefore, the force required to get separatedfrom the concrete is also higher (this surface is almost 3 times greaterfor t/R=0.8 compared to the case t/R=0.12). When the interfacestrength increases to 2 MPa, the effect of the geometric ratio leads to asomewhat more visible effect on the peak force compared to theprevious case σ* = 1i MPa. Moreover, this level of bonding is alreadysufficient to break the capsules with a geometric ratio t/R=0.12(labeled as “B”, in Fig. 10). As mentioned before, this capsule size iscommonly used by experimentalists to test encapsulation-based self-healing concrete, because sufficient amount of healing agent can beintroduced and dispersed by the concrete structure. Therefore, in termsof achieving an adequate healing mechanism, this result suggests that,as least, an interface strength of 2 MPa has to be ensured in order tobreak and liberate the fluid content inside the crack gap. Conversely, aweaker capsule-concrete interface would not be sufficient to break thecapsule and, as a consequence, the healing agent would not be released.
Following this reasoning, if for some practical reason, or technicalrequirement, thicker capsules are used (for example, with the aim ofstrengthening the beam simultaneously), the current model makes itpossible to quantify the strength level of the interface to trigger thefracture of the capsule under certain level of deflection. In thisparticular case, Fig. 10 shows that capsules with t/R=0.23 requirean interface strength equal to 5 MPa to break them, while doubling thisvalue of t/R requires also to double the value of σ*i (t/R=0.46 requires10 MPa). However, with the insertion of much thicker capsules (t/R=0.8), even 10 MPa is not sufficient to break the capsules, althougha considerable reinforcement is positively achieved.
3.7. Detailed inspection of breakage mechanism
As mentioned before, capsules with geometric ratio t/R=0.12(t=0.175 mm, R=1.5 mm) has been preferred for experimentaliststo perform laboratory tests to analyze the healing efficiency of theencapsulated-based self-healing concrete. Therefore, this section pro-vides a detailed analysis of the breakage sequence of the beam usingthis capsule size.
This analysis presents the differences of the global response whenthe capsules detach or break. Fig. 11 (a) shows the load-displacementcurve for the cases σ* = 1i MPa and σ* = 2i MPa. As it can be observed,although both cases produced a very similar response, in fact, theinternal failure mechanism was different. As described before, thesethin capsules detached from the matrix when the interface strength was1 MPa, however, they fractured when the interface increased to 2MPa. The latter value seems to be high enough to transfer the stressesfrom the matrix to the capsule. The point B marked in the solid curve inFig. 11 (a) indicates the moment in which a crack initiates in thecapsule. This crack can be appreciated in the zoomed region depicted inFig. 11 (b). Conversely, when the interface is weaker, that is, 1 MPa, atthat point the capsule initiates the debonding process: the interfacecannot withstand the pull-out stress and the capsule slides into the
cavity. The point labeled D marked on the dotted curve in Fig. 11 (a)indicates the moment immediately after full debonding occurred.Likewise, a zoomed view of this state can be seen in Fig. 11 (b). Inthis case, the capsule lost contact in the right side while its left side stillremained attached to the matrix. The points B’ and D’ correspond to twomore advanced stages during the bending process, in which the crackhas exceeded the neutral axis of the beam, and therefore, the overallbending load has dropped significantly. This result suggests that thedistinction between the capsule failure and capsule debonding is almostimpossible to detect from the macroscopic point of view.
3.8. Effect of the number of capsules
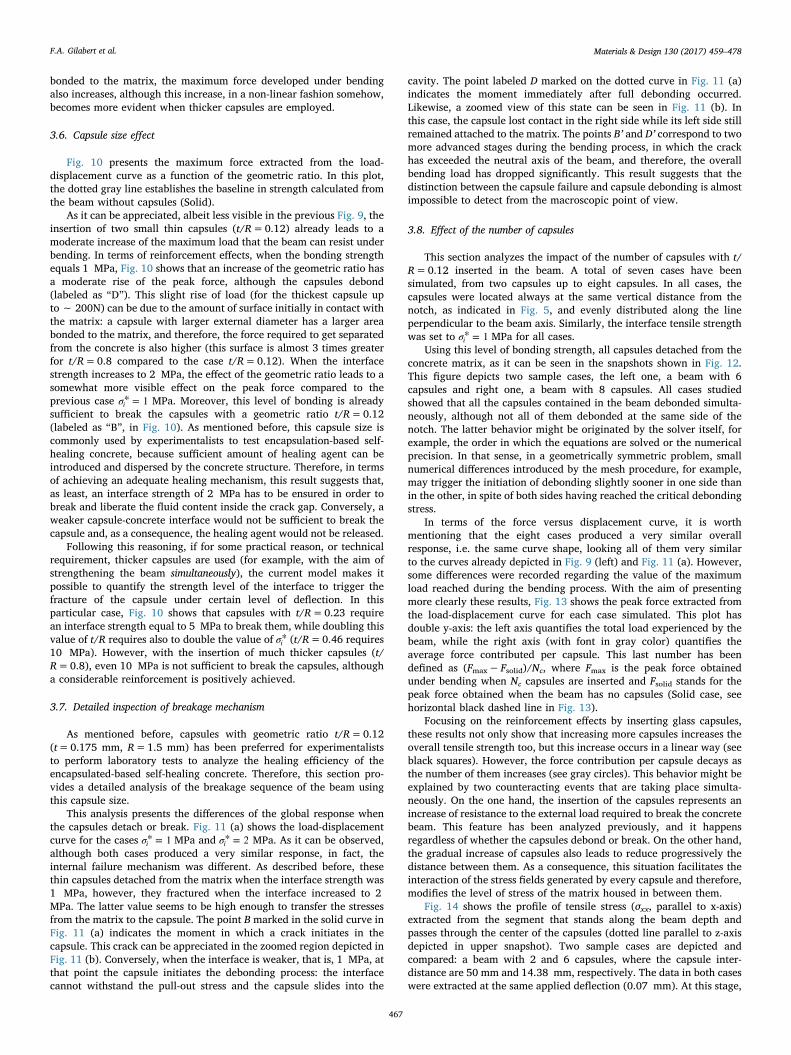
This section analyzes the impact of the number of capsules with t/R=0.12 inserted in the beam. A total of seven cases have beensimulated, from two capsules up to eight capsules. In all cases, thecapsules were located always at the same vertical distance from thenotch, as indicated in Fig. 5, and evenly distributed along the lineperpendicular to the beam axis. Similarly, the interface tensile strengthwas set to σ* = 1i MPa for all cases.
Using this level of bonding strength, all capsules detached from theconcrete matrix, as it can be seen in the snapshots shown in Fig. 12.This figure depicts two sample cases, the left one, a beam with 6capsules and right one, a beam with 8 capsules. All cases studiedshowed that all the capsules contained in the beam debonded simulta-neously, although not all of them debonded at the same side of thenotch. The latter behavior might be originated by the solver itself, forexample, the order in which the equations are solved or the numericalprecision. In that sense, in a geometrically symmetric problem, smallnumerical differences introduced by the mesh procedure, for example,may trigger the initiation of debonding slightly sooner in one side thanin the other, in spite of both sides having reached the critical debondingstress.
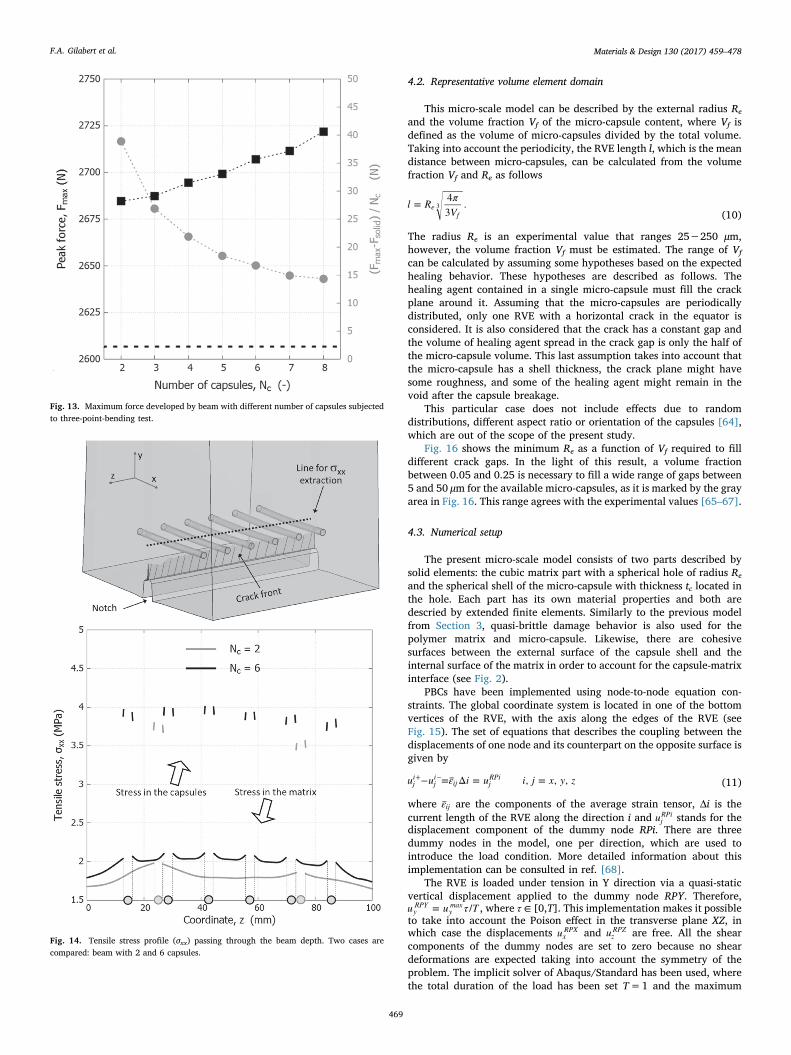
In terms of the force versus displacement curve, it is worthmentioning that the eight cases produced a very similar overallresponse, i.e. the same curve shape, looking all of them very similarto the curves already depicted in Fig. 9 (left) and Fig. 11 (a). However,some differences were recorded regarding the value of the maximumload reached during the bending process. With the aim of presentingmore clearly these results, Fig. 13 shows the peak force extracted fromthe load-displacement curve for each case simulated. This plot hasdouble y-axis: the left axis quantifies the total load experienced by thebeam, while the right axis (with font in gray color) quantifies theaverage force contributed per capsule. This last number has beendefined as (Fmax−Fsolid)/Nc, where Fmax is the peak force obtainedunder bending when Nc capsules are inserted and Fsolid stands for thepeak force obtained when the beam has no capsules (Solid case, seehorizontal black dashed line in Fig. 13).
Focusing on the reinforcement effects by inserting glass capsules,these results not only show that increasing more capsules increases theoverall tensile strength too, but this increase occurs in a linear way (seeblack squares). However, the force contribution per capsule decays asthe number of them increases (see gray circles). This behavior might beexplained by two counteracting events that are taking place simulta-neously. On the one hand, the insertion of the capsules represents anincrease of resistance to the external load required to break the concretebeam. This feature has been analyzed previously, and it happensregardless of whether the capsules debond or break. On the other hand,the gradual increase of capsules also leads to reduce progressively thedistance between them. As a consequence, this situation facilitates theinteraction of the stress fields generated by every capsule and therefore,modifies the level of stress of the matrix housed in between them.
Fig. 14 shows the profile of tensile stress (σxx, parallel to x-axis)extracted from the segment that stands along the beam depth andpasses through the center of the capsules (dotted line parallel to z-axisdepicted in upper snapshot). Two sample cases are depicted andcompared: a beam with 2 and 6 capsules, where the capsule inter-distance are 50 mm and 14.38 mm, respectively. The data in both caseswere extracted at the same applied deflection (0.07 mm). At this stage,
F.A. Gilabert et al. Materials & Design 130 (2017) 459–478
467

the crack front had not reached the capsules yet, as it can be observed inthe top image of Fig. 14. At the same level of applied deflection, thetensile stress in the matrix is higher when the number of capsulesincreases, or equivalently, when the distance between capsules isshortened. In the regions where capsules are more densely clustered,the intermediate matrix is being more susceptible to fail sooner despitethese capsules are working as reinforcement elements. Therefore, thisresult might suggest that capsules should be sufficiently separated fromone another as to prevent their interaction, and therefore, to prevent apremature failure of the matrix in between them. In other words, aminimum capsular interdistance should be respected in order to get anoptimal overall performance. Further analysis to quantify an optimalcapsular clustering lies in the scope of forthcoming research.
4. Model application to self-healing polymers
Although there are several types of self-healing polymers [60], thismodeling application is focused on polymers with embedded micro-capsules which carry the healing agent. This type of self-healingpolymers has been studied experimentally using the Tapered DoubleCantilever Beam (TDCB) specimen via the so-called White protocol [61].The experiments show how the cracks go through the polymer breakingthe micro-capsules and, as consequence, delivering the healing agent inthe crack plane.
4.1. Polymer matrix with spherical micro-capsules
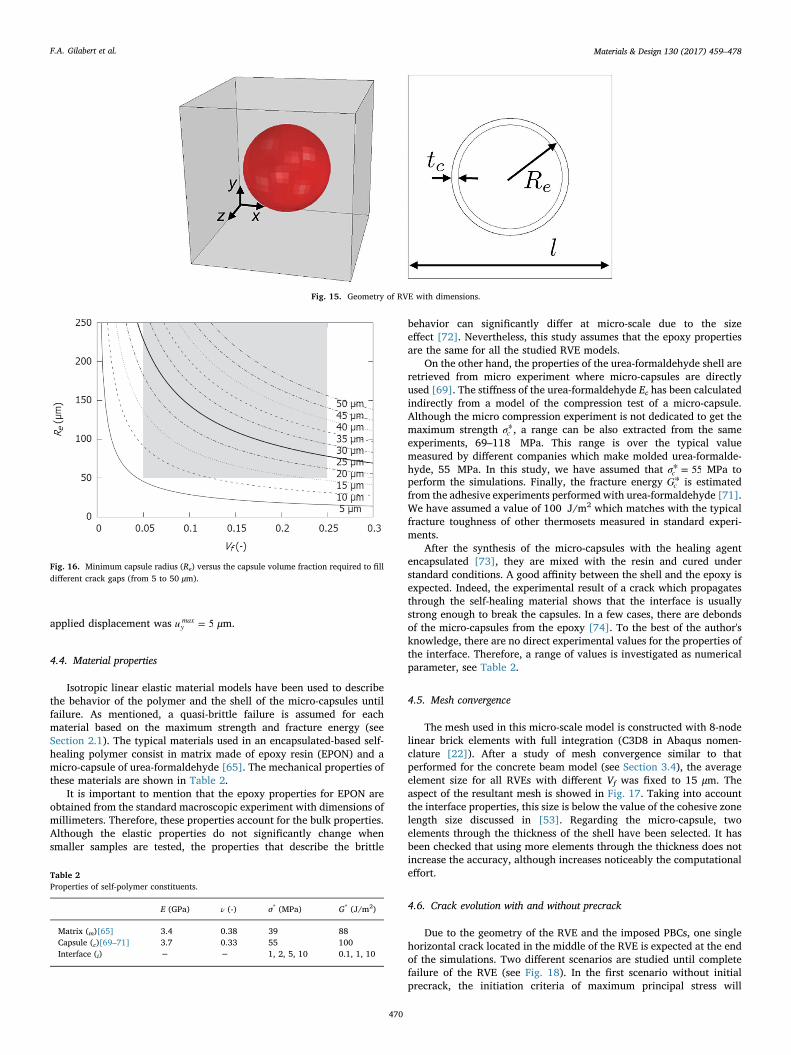
Numerical simulations of the whole TDBC specimen with micro-capsules are limited due to the difference of the dimensions betweenboth the specimen, with dimensions of millimeters, and the micro-capsules, with radius of hundreds microns and a shell thickness ofhundreds of nanometers. In this section, the mechanical behavior of theself-healing material is studied using a multi-scale approach. It isassumed that the micro-capsules are evenly distributed in the polymermatrix. Therefore, the material is described using a representativevolume element (RVE) that contains a single micro-capsule. A cube-shaped RVE is selected for this work, where a micro-capsule with afinite shell thickness is located in the center of the cube, as it can beseen in Fig. 15. The three fundamental dimensions of the system are thelength of the cube l, the external radius of the micro-capsule Re and theshell thickness of the micro-capsule tc. Using three-dimensional periodicboundary conditions (PBCs), the RVE represents an infinite system andcan provide the mechanical response of an encapsulation-based self-healing polymer. The periodic distribution of the micro-capsules is astrong hypothesis which does not take into account the randomness ofthe material. Yu et al. [62] showed that the particle clustering haseffects in the failure mechanisms. A similar trend in particle reinforcedmetal matrix composites was found in ref. [63]. Further analysis of therandomness effects is out of the scope of this paper.
Fig. 11. Effect of the capsule bonding strength. Detail of the initiation failure mechanism of a beam with two capsules with geometric ratio t/R =0.12 for σ* = 1i and 2 MPa (B=breakage, D= debonding). (a) Load-displacement curve. (b) Detail of the capsule breakage and debonding.
Fig. 12. Zoomed view of the crack path and debonding of capsules: (left) beam with 6 capsules and (right) beam with 8 capsules (deformation scale factor ×100).
F.A. Gilabert et al. Materials & Design 130 (2017) 459–478
468
4.2. Representative volume element domain
This micro-scale model can be described by the external radius Re
and the volume fraction Vf of the micro-capsule content, where Vf isdefined as the volume of micro-capsules divided by the total volume.Taking into account the periodicity, the RVE length l, which is the meandistance between micro-capsules, can be calculated from the volumefraction Vf and Re as follows
l R πV
= 43
.ef
3(10)
The radius Re is an experimental value that ranges 25−250 μm,however, the volume fraction Vf must be estimated. The range of Vf
can be calculated by assuming some hypotheses based on the expectedhealing behavior. These hypotheses are described as follows. Thehealing agent contained in a single micro-capsule must fill the crackplane around it. Assuming that the micro-capsules are periodicallydistributed, only one RVE with a horizontal crack in the equator isconsidered. It is also considered that the crack has a constant gap andthe volume of healing agent spread in the crack gap is only the half ofthe micro-capsule volume. This last assumption takes into account thatthe micro-capsule has a shell thickness, the crack plane might havesome roughness, and some of the healing agent might remain in thevoid after the capsule breakage.
This particular case does not include effects due to randomdistributions, different aspect ratio or orientation of the capsules [64],which are out of the scope of the present study.
Fig. 16 shows the minimum Re as a function of Vf required to filldifferent crack gaps. In the light of this result, a volume fractionbetween 0.05 and 0.25 is necessary to fill a wide range of gaps between5 and 50 μm for the available micro-capsules, as it is marked by the grayarea in Fig. 16. This range agrees with the experimental values [65–67].
4.3. Numerical setup
The present micro-scale model consists of two parts described bysolid elements: the cubic matrix part with a spherical hole of radius Re
and the spherical shell of the micro-capsule with thickness tc located inthe hole. Each part has its own material properties and both aredescried by extended finite elements. Similarly to the previous modelfrom Section 3, quasi-brittle damage behavior is also used for thepolymer matrix and micro-capsule. Likewise, there are cohesivesurfaces between the external surface of the capsule shell and theinternal surface of the matrix in order to account for the capsule-matrixinterface (see Fig. 2).
PBCs have been implemented using node-to-node equation con-straints. The global coordinate system is located in one of the bottomvertices of the RVE, with the axis along the edges of the RVE (seeFig. 15). The set of equations that describes the coupling between thedisplacements of one node and its counterpart on the opposite surface isgiven by
u u ε i u i j x y z− = Δ = , = , ,ji
ji
ij jRPi+ − (11)
where εij are the components of the average strain tensor, Δi is thecurrent length of the RVE along the direction i and uj
RPi stands for thedisplacement component of the dummy node RPi. There are threedummy nodes in the model, one per direction, which are used tointroduce the load condition. More detailed information about thisimplementation can be consulted in ref. [68].
The RVE is loaded under tension in Y direction via a quasi-staticvertical displacement applied to the dummy node RPY. Therefore,u u τ T= /y
RPYymax , where τ ∈ [0,T]. This implementation makes it possible
to take into account the Poison effect in the transverse plane XZ, inwhich case the displacements ux
RPX and uzRPZ are free. All the shear
components of the dummy nodes are set to zero because no sheardeformations are expected taking into account the symmetry of theproblem. The implicit solver of Abaqus/Standard has been used, wherethe total duration of the load has been set T=1 and the maximum
Fig. 13. Maximum force developed by beam with different number of capsules subjectedto three-point-bending test.
Fig. 14. Tensile stress profile (σxx) passing through the beam depth. Two cases arecompared: beam with 2 and 6 capsules.
F.A. Gilabert et al. Materials & Design 130 (2017) 459–478
469
applied displacement was u = 5ymax μm.
4.4. Material properties
Isotropic linear elastic material models have been used to describethe behavior of the polymer and the shell of the micro-capsules untilfailure. As mentioned, a quasi-brittle failure is assumed for eachmaterial based on the maximum strength and fracture energy (seeSection 2.1). The typical materials used in an encapsulated-based self-healing polymer consist in matrix made of epoxy resin (EPON) and amicro-capsule of urea-formaldehyde [65]. The mechanical properties ofthese materials are shown in Table 2.
It is important to mention that the epoxy properties for EPON areobtained from the standard macroscopic experiment with dimensions ofmillimeters. Therefore, these properties account for the bulk properties.Although the elastic properties do not significantly change whensmaller samples are tested, the properties that describe the brittle
behavior can significantly differ at micro-scale due to the sizeeffect [72]. Nevertheless, this study assumes that the epoxy propertiesare the same for all the studied RVE models.
On the other hand, the properties of the urea-formaldehyde shell areretrieved from micro experiment where micro-capsules are directlyused [69]. The stiffness of the urea-formaldehyde Ec has been calculatedindirectly from a model of the compression test of a micro-capsule.Although the micro compression experiment is not dedicated to get themaximum strength σ*c , a range can be also extracted from the sameexperiments, 69–118 MPa. This range is over the typical valuemeasured by different companies which make molded urea-formalde-hyde, 55 MPa. In this study, we have assumed that σ* = 55c MPa toperform the simulations. Finally, the fracture energy G*c is estimatedfrom the adhesive experiments performed with urea-formaldehyde [71].We have assumed a value of 100 J/m2 which matches with the typicalfracture toughness of other thermosets measured in standard experi-ments.
After the synthesis of the micro-capsules with the healing agentencapsulated [73], they are mixed with the resin and cured understandard conditions. A good affinity between the shell and the epoxy isexpected. Indeed, the experimental result of a crack which propagatesthrough the self-healing material shows that the interface is usuallystrong enough to break the capsules. In a few cases, there are debondsof the micro-capsules from the epoxy [74]. To the best of the author'sknowledge, there are no direct experimental values for the properties ofthe interface. Therefore, a range of values is investigated as numericalparameter, see Table 2.
4.5. Mesh convergence
The mesh used in this micro-scale model is constructed with 8-nodelinear brick elements with full integration (C3D8 in Abaqus nomen-clature [22]). After a study of mesh convergence similar to thatperformed for the concrete beam model (see Section 3.4), the averageelement size for all RVEs with different Vf was fixed to 15 μm. Theaspect of the resultant mesh is showed in Fig. 17. Taking into accountthe interface properties, this size is below the value of the cohesive zonelength size discussed in [53]. Regarding the micro-capsule, twoelements through the thickness of the shell have been selected. It hasbeen checked that using more elements through the thickness does notincrease the accuracy, although increases noticeably the computationaleffort.
4.6. Crack evolution with and without precrack
Due to the geometry of the RVE and the imposed PBCs, one singlehorizontal crack located in the middle of the RVE is expected at the endof the simulations. Two different scenarios are studied until completefailure of the RVE (see Fig. 18). In the first scenario without initialprecrack, the initiation criteria of maximum principal stress will
Fig. 15. Geometry of RVE with dimensions.
Fig. 16. Minimum capsule radius (Re) versus the capsule volume fraction required to filldifferent crack gaps (from 5 to 50 μm).
Table 2Properties of self-polymer constituents.
E (GPa) ν (-) σ* (MPa) G* (J/m2)
Matrix (m)[65] 3.4 0.38 39 88Capsule (c)[69–71] 3.7 0.33 55 100Interface (i) − − 1, 2, 5, 10 0.1, 1, 10
F.A. Gilabert et al. Materials & Design 130 (2017) 459–478
470
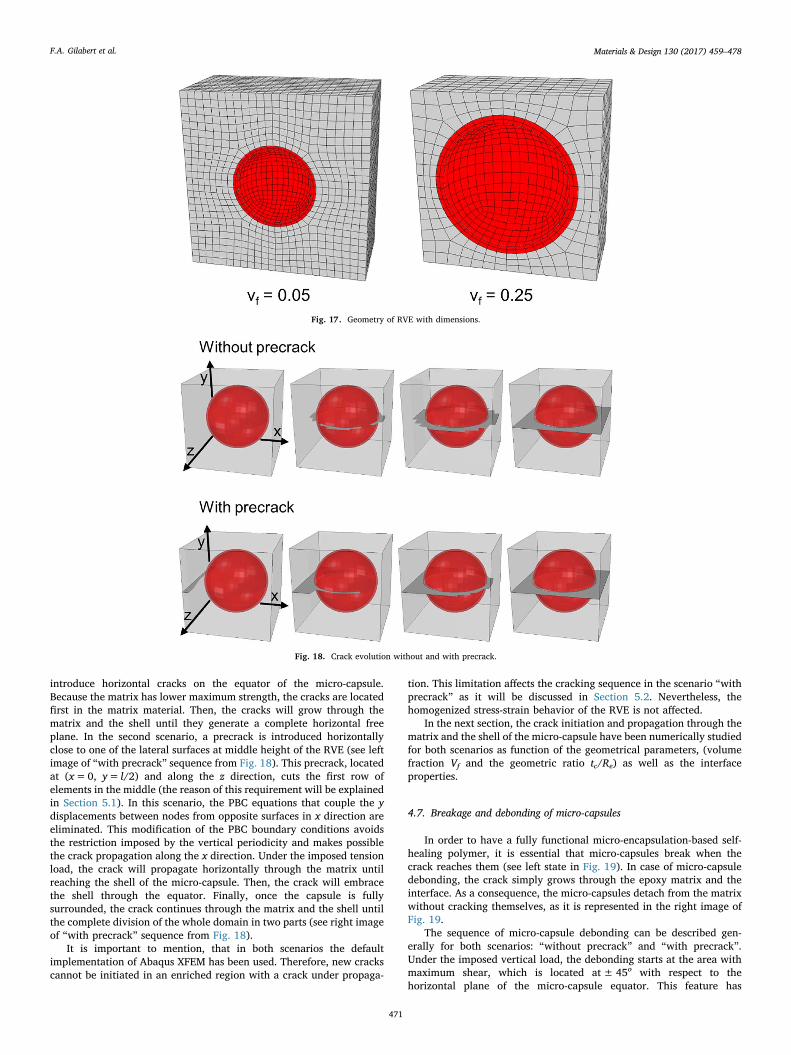
introduce horizontal cracks on the equator of the micro-capsule.Because the matrix has lower maximum strength, the cracks are locatedfirst in the matrix material. Then, the cracks will grow through thematrix and the shell until they generate a complete horizontal freeplane. In the second scenario, a precrack is introduced horizontallyclose to one of the lateral surfaces at middle height of the RVE (see leftimage of “with precrack” sequence from Fig. 18). This precrack, locatedat (x=0, y= l/2) and along the z direction, cuts the first row ofelements in the middle (the reason of this requirement will be explainedin Section 5.1). In this scenario, the PBC equations that couple the ydisplacements between nodes from opposite surfaces in x direction areeliminated. This modification of the PBC boundary conditions avoidsthe restriction imposed by the vertical periodicity and makes possiblethe crack propagation along the x direction. Under the imposed tensionload, the crack will propagate horizontally through the matrix untilreaching the shell of the micro-capsule. Then, the crack will embracethe shell through the equator. Finally, once the capsule is fullysurrounded, the crack continues through the matrix and the shell untilthe complete division of the whole domain in two parts (see right imageof “with precrack” sequence from Fig. 18).
It is important to mention, that in both scenarios the defaultimplementation of Abaqus XFEM has been used. Therefore, new crackscannot be initiated in an enriched region with a crack under propaga-
tion. This limitation affects the cracking sequence in the scenario “withprecrack” as it will be discussed in Section 5.2. Nevertheless, thehomogenized stress-strain behavior of the RVE is not affected.
In the next section, the crack initiation and propagation through thematrix and the shell of the micro-capsule have been numerically studiedfor both scenarios as function of the geometrical parameters, (volumefraction Vf and the geometric ratio tc/Re) as well as the interfaceproperties.
4.7. Breakage and debonding of micro-capsules
In order to have a fully functional micro-encapsulation-based self-healing polymer, it is essential that micro-capsules break when thecrack reaches them (see left state in Fig. 19). In case of micro-capsuledebonding, the crack simply grows through the epoxy matrix and theinterface. As a consequence, the micro-capsules detach from the matrixwithout cracking themselves, as it is represented in the right image ofFig. 19.
The sequence of micro-capsule debonding can be described gen-erally for both scenarios: “without precrack” and “with precrack”.Under the imposed vertical load, the debonding starts at the area withmaximum shear, which is located at± 45o with respect to thehorizontal plane of the micro-capsule equator. This feature has
Fig. 17. Geometry of RVE with dimensions.
Fig. 18. Crack evolution without and with precrack.
F.A. Gilabert et al. Materials & Design 130 (2017) 459–478
471
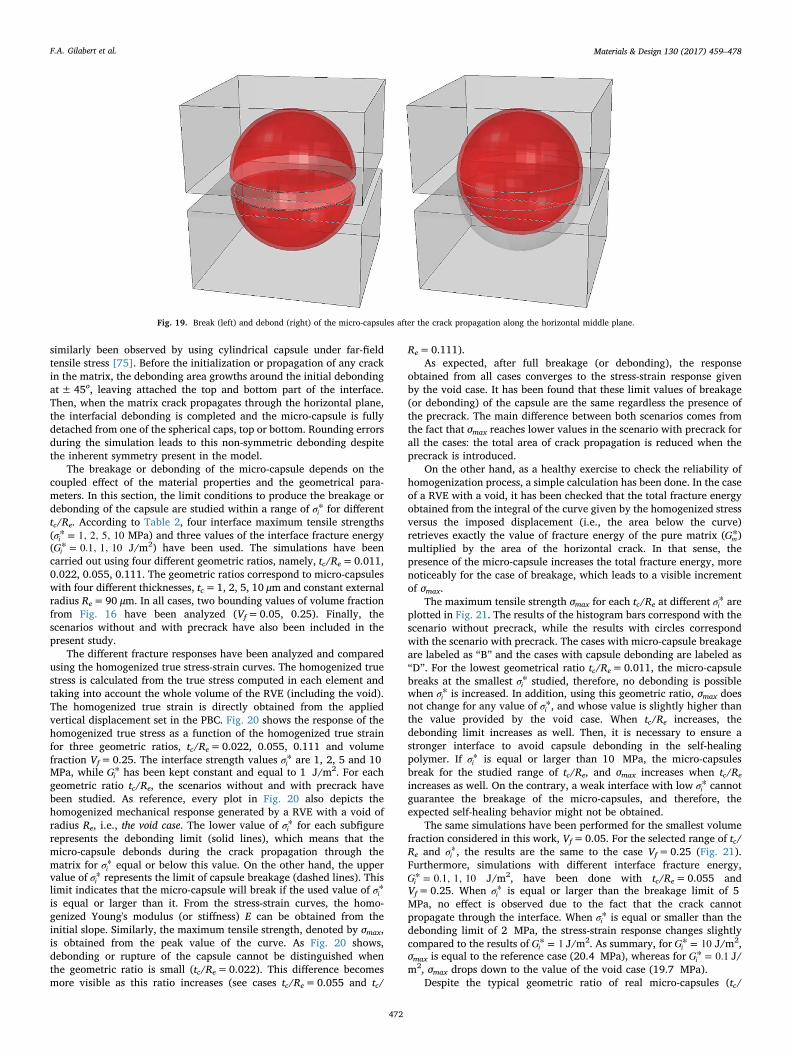
similarly been observed by using cylindrical capsule under far-fieldtensile stress [75]. Before the initialization or propagation of any crackin the matrix, the debonding area growths around the initial debondingat± 45o, leaving attached the top and bottom part of the interface.Then, when the matrix crack propagates through the horizontal plane,the interfacial debonding is completed and the micro-capsule is fullydetached from one of the spherical caps, top or bottom. Rounding errorsduring the simulation leads to this non-symmetric debonding despitethe inherent symmetry present in the model.
The breakage or debonding of the micro-capsule depends on thecoupled effect of the material properties and the geometrical para-meters. In this section, the limit conditions to produce the breakage ordebonding of the capsule are studied within a range of σ*i for differenttc/Re. According to Table 2, four interface maximum tensile strengths(σ* = 1, 2, 5, 10i MPa) and three values of the interface fracture energy(G* = 0.1, 1, 10i J/m2) have been used. The simulations have beencarried out using four different geometric ratios, namely, tc/Re=0.011,0.022, 0.055, 0.111. The geometric ratios correspond to micro-capsuleswith four different thicknesses, tc=1, 2, 5, 10 μm and constant externalradius Re=90 μm. In all cases, two bounding values of volume fractionfrom Fig. 16 have been analyzed (Vf=0.05, 0.25). Finally, thescenarios without and with precrack have also been included in thepresent study.
The different fracture responses have been analyzed and comparedusing the homogenized true stress-strain curves. The homogenized truestress is calculated from the true stress computed in each element andtaking into account the whole volume of the RVE (including the void).The homogenized true strain is directly obtained from the appliedvertical displacement set in the PBC. Fig. 20 shows the response of thehomogenized true stress as a function of the homogenized true strainfor three geometric ratios, tc/Re=0.022, 0.055, 0.111 and volumefraction Vf=0.25. The interface strength values σ*i are 1, 2, 5 and 10MPa, while G*i has been kept constant and equal to 1 J/m2. For eachgeometric ratio tc/Re, the scenarios without and with precrack havebeen studied. As reference, every plot in Fig. 20 also depicts thehomogenized mechanical response generated by a RVE with a void ofradius Re, i.e., the void case. The lower value of σ*i for each subfigurerepresents the debonding limit (solid lines), which means that themicro-capsule debonds during the crack propagation through thematrix for σ*i equal or below this value. On the other hand, the uppervalue of σ*i represents the limit of capsule breakage (dashed lines). Thislimit indicates that the micro-capsule will break if the used value of σ*iis equal or larger than it. From the stress-strain curves, the homo-genized Young's modulus (or stiffness) E can be obtained from theinitial slope. Similarly, the maximum tensile strength, denoted by σmax,is obtained from the peak value of the curve. As Fig. 20 shows,debonding or rupture of the capsule cannot be distinguished whenthe geometric ratio is small (tc/Re=0.022). This difference becomesmore visible as this ratio increases (see cases tc/Re=0.055 and tc/
Re=0.111).As expected, after full breakage (or debonding), the response
obtained from all cases converges to the stress-strain response givenby the void case. It has been found that these limit values of breakage(or debonding) of the capsule are the same regardless the presence ofthe precrack. The main difference between both scenarios comes fromthe fact that σmax reaches lower values in the scenario with precrack forall the cases: the total area of crack propagation is reduced when theprecrack is introduced.
On the other hand, as a healthy exercise to check the reliability ofhomogenization process, a simple calculation has been done. In the caseof a RVE with a void, it has been checked that the total fracture energyobtained from the integral of the curve given by the homogenized stressversus the imposed displacement (i.e., the area below the curve)retrieves exactly the value of fracture energy of the pure matrix (G*m)multiplied by the area of the horizontal crack. In that sense, thepresence of the micro-capsule increases the total fracture energy, morenoticeably for the case of breakage, which leads to a visible incrementof σmax.
The maximum tensile strength σmax for each tc/Re at different σ*i areplotted in Fig. 21. The results of the histogram bars correspond with thescenario without precrack, while the results with circles correspondwith the scenario with precrack. The cases with micro-capsule breakageare labeled as “B” and the cases with capsule debonding are labeled as“D”. For the lowest geometrical ratio tc/Re=0.011, the micro-capsulebreaks at the smallest σ*i studied, therefore, no debonding is possiblewhen σ*i is increased. In addition, using this geometric ratio, σmax doesnot change for any value of σ*i , and whose value is slightly higher thanthe value provided by the void case. When tc/Re increases, thedebonding limit increases as well. Then, it is necessary to ensure astronger interface to avoid capsule debonding in the self-healingpolymer. If σ*i is equal or larger than 10 MPa, the micro-capsulesbreak for the studied range of tc/Re, and σmax increases when tc/Re
increases as well. On the contrary, a weak interface with low σ*i cannotguarantee the breakage of the micro-capsules, and therefore, theexpected self-healing behavior might not be obtained.
The same simulations have been performed for the smallest volumefraction considered in this work, Vf=0.05. For the selected range of tc/Re and σ*i , the results are the same to the case Vf=0.25 (Fig. 21).Furthermore, simulations with different interface fracture energy,G* = 0.1, 1, 10i J/m2, have been done with tc/Re=0.055 andVf=0.25. When σ*i is equal or larger than the breakage limit of 5MPa, no effect is observed due to the fact that the crack cannotpropagate through the interface. When σ*i is equal or smaller than thedebonding limit of 2 MPa, the stress-strain response changes slightlycompared to the results of G* = 1i J/m2. As summary, for G* = 10i J/m2,σmax is equal to the reference case (20.4 MPa), whereas for G* = 0.1i J/m2, σmax drops down to the value of the void case (19.7 MPa).
Despite the typical geometric ratio of real micro-capsules (tc/
Fig. 19. Break (left) and debond (right) of the micro-capsules after the crack propagation along the horizontal middle plane.
F.A. Gilabert et al. Materials & Design 130 (2017) 459–478
472

Re=0.004, see ref. [65]) is still below the lowest value used in thiswork (tc/Re=0.011), no big differences should be expected from thehomogenized mechanical point of view. The stress-strain behavior ofthe geometric ratio tc/Re=0.011 behaves almost like the void case (thisis the reason why this case is not shown in Fig. 21). Therefore, it isexpected that lower ratios than 0.011 will exhibit the same stress-strainbehavior as the void (tc/Re=0), and then, with a maximum strengthmuch closer to the void case. As a consequence, if tc/Re<0.011, it isexpected that the capsule will always break regardless the value of σ*iwithin the interval studied in this paper.
In that sense, from the FEM point of view, the numerical analysis ofmuch thinner shells would require the usage of shells elements. In thiscase, the same combined strategy of XFEM and cohesive surfaces is lessobvious and it would demand considerable additional research.
It is worth mentioning that a strong interface between micro-capsules and the matrix is usually expected. Experimental resultsshowed that the majority of micro-capsules broke along the crack path,and only a very little fraction of them debonded from the matrix [74].Therefore, in the following section, the mechanical properties of ahomogenized encapsulation-based self-healing polymer are studied asfunction of the geometric parameters assuming a strong interface(σ* = 10i MPa).
4.8. Mechanical properties prediction
It is known that the mechanical behavior of the polymer changewith the amount of micro-capsules [65,67]. As a general behavior, thestiffness of the material and the maximum strength decrease when theVf of micro-capsules increases. In this section, simulations withoutinitial precrack are used to calculate the effective response of theYoung's modulus and the maximum tensile strength. The effectiveYoung's modulus E and maximum tensile strength σmax are obtainedfrom the homogenized strain-stress curves. Both effective values havebeen calculated under the hypothesis of PBC described before, thereforesome difference with the real ones are obviously expected. Never-theless, the effective values obtained in these simulations are useful tofollow up the trend of these properties as function of Vf and tc/Re.
Fig. 22 shows the effective stiffness and maximum strength asfunction of the volume fraction Vf for several cases with differentgeometrical radius tc/Re. The stiffness E decreases with the Vf asexpected, because the inclusion of micro-capsules can be consideredlike the inclusion of voids in the matrix. When the geometrical radiustc/Re decreases, the decrease of E is more pronounced until reaching thelimit at tc/Re=0, which is the case of the void.
Although the stiffness E obtained from the experiment also de-creases with Vf, its value is higher than the values from the simulations(see experimental data by Brown in Fig. 22). One reason to explain thisdifference might be that the core inside the micro-capsule (self-healingagent with some water or air) can contribute to the homogenizedstiffness. Another plausible reason might be that the properties of theepoxy matrix change when it is cured with the embedded micro-capsules. These features lay out of the scope of the present paper.
The homogenized maximum strength σmax also decreases when Vf
increases, as it is clearly shown in Fig. 22. Indeed, σmax decreasesabruptly when Vf equals 5%, and then decreasing softly after suchvalue. It must be noted that, although with different values, thistendency is also clearly observed in the experimental works from otherauthors [65,67].
It is important to recall that this model uses PBC. The periodicityproduces correctly the interaction of stresses between capsules, how-ever it also introduces the limitation of having a perfect distribution ofmicro-capsules. In a random distribution of micro-capsules, a combina-tion of normal and shear stress are expected around the micro-capsules,what would lead to different σmax and different location of the crackinitiation. Moreover, a periodic distribution assumes a prefixed crackdensity because all the capsules will break at the same time. This is astrong hypothesis and it might deviate the numerical value from theexperimental ones (where possibly only one crack is running throughthe whole material). Although using PBC involves some limitations, thehomogenized material properties predicted by using the micro-modelshow a good agreement with the experimental trend. This model can bevery useful to improve and to understand new encapsulation-based self-healing polymers.
Fig. 20. Stress-strain curves for different geometric ratios (tc/Re=0.022, 0.055, 0.111) and interface strength (σ*i ). Capsule volume fraction Vf=0.25.
Fig. 21. Maximum stress until failure of the RVE as a function of the geometric ratio anddifferent interface strength levels (bars: without precrack, circles: with precrack).
F.A. Gilabert et al. Materials & Design 130 (2017) 459–478
473
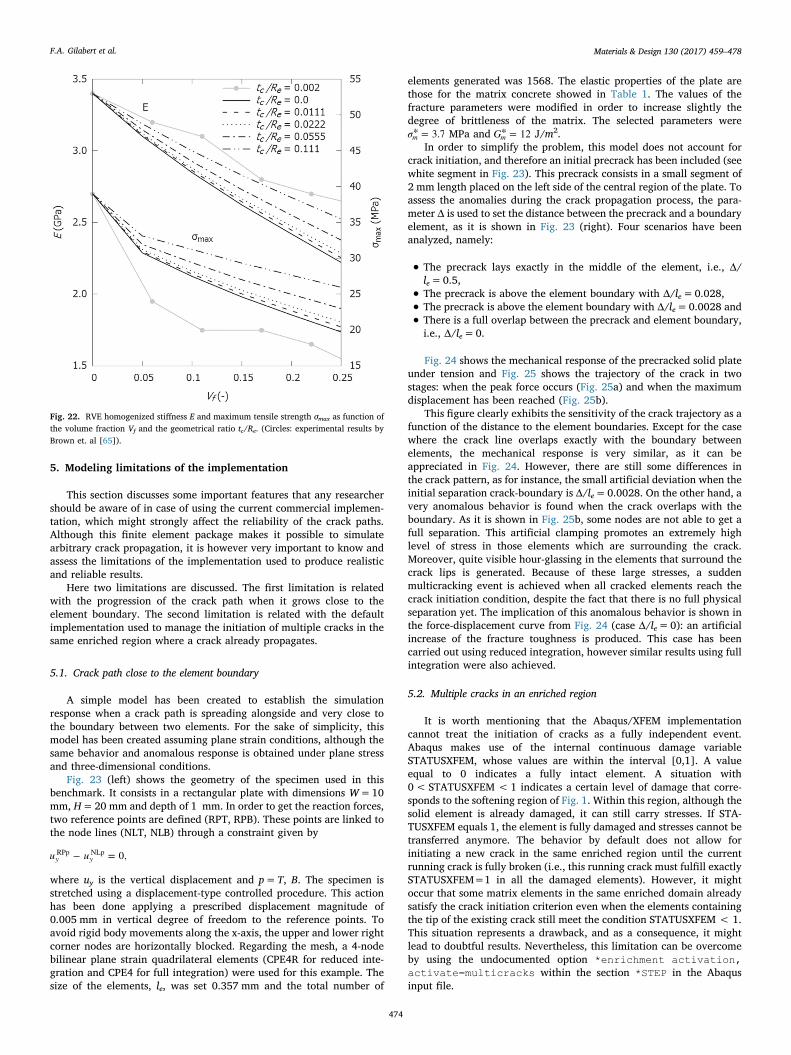
5. Modeling limitations of the implementation
This section discusses some important features that any researchershould be aware of in case of using the current commercial implemen-tation, which might strongly affect the reliability of the crack paths.Although this finite element package makes it possible to simulatearbitrary crack propagation, it is however very important to know andassess the limitations of the implementation used to produce realisticand reliable results.
Here two limitations are discussed. The first limitation is relatedwith the progression of the crack path when it grows close to theelement boundary. The second limitation is related with the defaultimplementation used to manage the initiation of multiple cracks in thesame enriched region where a crack already propagates.
5.1. Crack path close to the element boundary
A simple model has been created to establish the simulationresponse when a crack path is spreading alongside and very close tothe boundary between two elements. For the sake of simplicity, thismodel has been created assuming plane strain conditions, although thesame behavior and anomalous response is obtained under plane stressand three-dimensional conditions.
Fig. 23 (left) shows the geometry of the specimen used in thisbenchmark. It consists in a rectangular plate with dimensions W=10mm, H=20 mm and depth of 1 mm. In order to get the reaction forces,two reference points are defined (RPT, RPB). These points are linked tothe node lines (NLT, NLB) through a constraint given by
u u− = 0,y yRPp NLp
where uy is the vertical displacement and p=T, B. The specimen isstretched using a displacement-type controlled procedure. This actionhas been done applying a prescribed displacement magnitude of0.005 mm in vertical degree of freedom to the reference points. Toavoid rigid body movements along the x-axis, the upper and lower rightcorner nodes are horizontally blocked. Regarding the mesh, a 4-nodebilinear plane strain quadrilateral elements (CPE4R for reduced inte-gration and CPE4 for full integration) were used for this example. Thesize of the elements, le, was set 0.357 mm and the total number of
elements generated was 1568. The elastic properties of the plate arethose for the matrix concrete showed in Table 1. The values of thefracture parameters were modified in order to increase slightly thedegree of brittleness of the matrix. The selected parameters wereσ* = 3.7m MPa and G* = 12m J/m2.
In order to simplify the problem, this model does not account forcrack initiation, and therefore an initial precrack has been included (seewhite segment in Fig. 23). This precrack consists in a small segment of2 mm length placed on the left side of the central region of the plate. Toassess the anomalies during the crack propagation process, the para-meter Δ is used to set the distance between the precrack and a boundaryelement, as it is shown in Fig. 23 (right). Four scenarios have beenanalyzed, namely:
• The precrack lays exactly in the middle of the element, i.e., Δ/le=0.5,
• The precrack is above the element boundary with Δ/le=0.028,
• The precrack is above the element boundary with Δ/le=0.0028 and
• There is a full overlap between the precrack and element boundary,i.e., Δ/le=0.
Fig. 24 shows the mechanical response of the precracked solid plateunder tension and Fig. 25 shows the trajectory of the crack in twostages: when the peak force occurs (Fig. 25a) and when the maximumdisplacement has been reached (Fig. 25b).
This figure clearly exhibits the sensitivity of the crack trajectory as afunction of the distance to the element boundaries. Except for the casewhere the crack line overlaps exactly with the boundary betweenelements, the mechanical response is very similar, as it can beappreciated in Fig. 24. However, there are still some differences inthe crack pattern, as for instance, the small artificial deviation when theinitial separation crack-boundary is Δ/le=0.0028. On the other hand, avery anomalous behavior is found when the crack overlaps with theboundary. As it is shown in Fig. 25b, some nodes are not able to get afull separation. This artificial clamping promotes an extremely highlevel of stress in those elements which are surrounding the crack.Moreover, quite visible hour-glassing in the elements that surround thecrack lips is generated. Because of these large stresses, a suddenmulticracking event is achieved when all cracked elements reach thecrack initiation condition, despite the fact that there is no full physicalseparation yet. The implication of this anomalous behavior is shown inthe force-displacement curve from Fig. 24 (case Δ/le=0): an artificialincrease of the fracture toughness is produced. This case has beencarried out using reduced integration, however similar results using fullintegration were also achieved.
5.2. Multiple cracks in an enriched region
It is worth mentioning that the Abaqus/XFEM implementationcannot treat the initiation of cracks as a fully independent event.Abaqus makes use of the internal continuous damage variableSTATUSXFEM, whose values are within the interval [0,1]. A valueequal to 0 indicates a fully intact element. A situation with0< STATUSXFEM <1 indicates a certain level of damage that corre-sponds to the softening region of Fig. 1. Within this region, although thesolid element is already damaged, it can still carry stresses. If STA-TUSXFEM equals 1, the element is fully damaged and stresses cannot betransferred anymore. The behavior by default does not allow forinitiating a new crack in the same enriched region until the currentrunning crack is fully broken (i.e., this running crack must fulfill exactlySTATUSXFEM=1 in all the damaged elements). However, it mightoccur that some matrix elements in the same enriched domain alreadysatisfy the crack initiation criterion even when the elements containingthe tip of the existing crack still meet the condition STATUSXFEM < 1.This situation represents a drawback, and as a consequence, it mightlead to doubtful results. Nevertheless, this limitation can be overcomeby using the undocumented option *enrichment activation,activate=multicracks within the section *STEP in the Abaqusinput file.
Fig. 22. RVE homogenized stiffness E and maximum tensile strength σmax as function ofthe volume fraction Vf and the geometrical ratio tc/Re. (Circles: experimental results byBrown et. al [65]).
F.A. Gilabert et al. Materials & Design 130 (2017) 459–478
474

The activation of multicrack mode has been tested for bothscenarios described in Section 4.6: without and with precrack. In thefirst scenario, without precrack, multiple initial cracks are generatedsimultaneously around the equator, see without precrack images inFig. 26. This initial multicracking is allowed by the default setupwhenever it is produced exactly within the same time increment.Therefore, regardless the activation of the option multicracks, thesame results are obtained as in Section 4.6. Hence, the propagation andcoalescence of these initially-created multiple cracks in a single bighorizontal crack seems to be a realistic result, where the elements inthis horizontal region undergo the highest stress.
In the second scenario, with precrack, no secondary cracks can bedeveloped by using the default setup (multicracks is not activated).Therefore, only the propagation of the prescribed precrack is produced(see “with precrack” images in Fig. 18). However, it has been checkedthat the stresses of the matrix elements around the micro-capsuleequator already fulfill the initiation criterion when the crack begins to
touch the capsule shell. Therefore, the simulation by activating multi-cracks shows a different cracking sequence in the matrix, see “withprecrack” images in Fig. 26. First, the precrack propagates through thematrix until it reaches the shell, as usual. But this time, secondarycracks in the matrix elements initiate diametrically opposed to thecrack front. Hence, both crack fronts propagate around the capsuleequator to coalesce in a single crack. Finally, this single crack ends itspropagation through the entire matrix and capsule that splits up thecubic domain in two halves. Unfortunately, the solver presents diffi-culties to get convergence in the last time-step because an unrealisticnumber of cracks are suddenly initiated. This effect leads to finish thesimulations abruptly. Nevertheless, albeit the fracture sequence isdifferent due to the presence of secondary cracks, it must be highlightedthat the homogenized stress-strain response of the RVE does notessentially change compared to the case when the feature multi-cracks is not activated. Therefore, for sake of simplicity, the defaultsetup implementation has been used in the current study in order toavoid convergence problems at the end of the simulations.
6. Conclusions
This paper presents two 3D models based on the combination of theeXtended Finite Element Method (XFEM) and the Cohesive Surfacestechnique (CS) to study the process of fracture in encapsulated self-healing materials. A complete summary of both numerical approachesis presented, as well as their main features, limitations and similaritiesbetween them. The interpretation of the material properties requiredfor each approach has also been discussed and correlated to theexperimental measurements available from the practical point of view.Using this methodology, the role of the bonding strength between thecapsule and the matrix has been studied in two different materialsystems: concrete and polymers. The main purpose of this paper is toshow how this methodology can be useful for experimentalists in orderto get a better understanding of the interaction between cracks andcapsules.
A realistic-size concrete beam model under three-point bending loadhas been developed. This setup is used to assess the encapsulation-based self-healing strategy in concrete structures at lab level. A macro-scale model has been used to investigate the effect of the insertion oftubular glass capsules in the overall bending response. In order to makethe computation affordable and usable for experimentalists in the
Fig. 23. (Left) Precracked solid plate specimen. (Right) Detail of the gap between the precrack and an element boundary.
Fig. 24. Reaction force versus displacement curve obtained from precracked solid platespecimen.
F.A. Gilabert et al. Materials & Design 130 (2017) 459–478
475
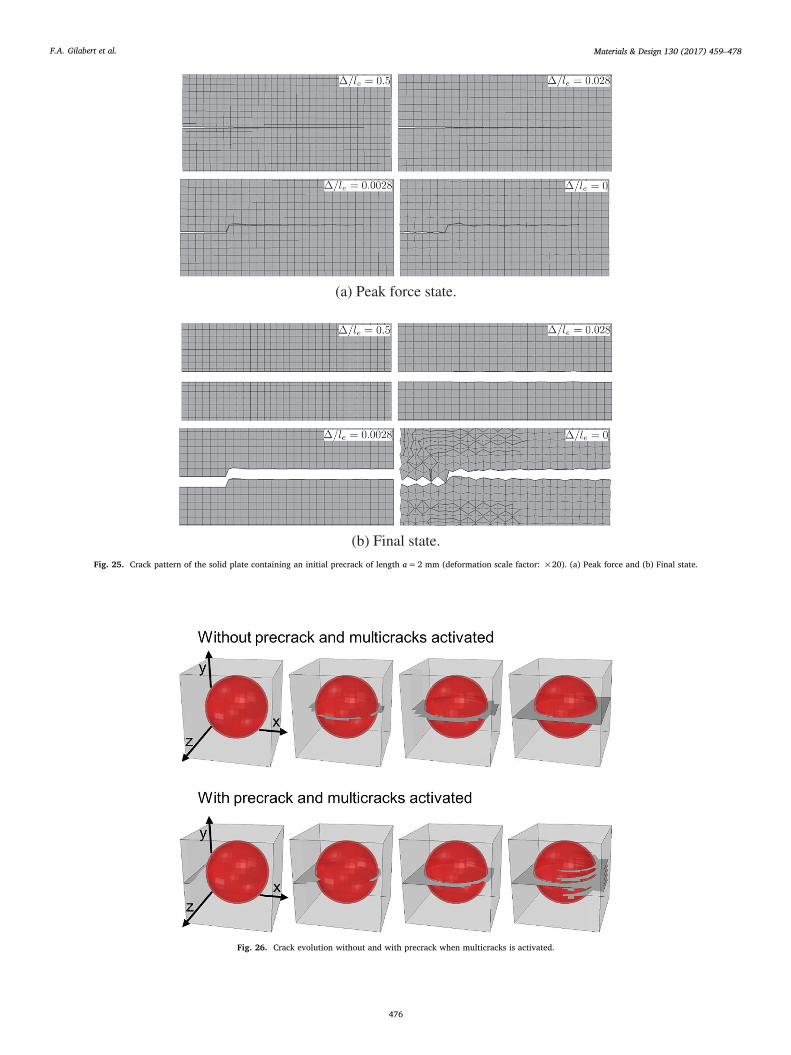
Fig. 25. Crack pattern of the solid plate containing an initial precrack of length a=2 mm (deformation scale factor: ×20). (a) Peak force and (b) Final state.
Fig. 26. Crack evolution without and with precrack when multicracks is activated.
F.A. Gilabert et al. Materials & Design 130 (2017) 459–478
476

future, the beam is decomposed in two regions: (i) a central region thatcontains the embedded glass capsules, where XFEM and cohesivesurfaces are used and (ii) two lateral regions, or wings, described byconventional FEM. Both regions are conveniently tied to fulfill thematerial continuity of the beam. A thorough convergence analysis ofthe mesh has been performed in order to ensure the reliability of theresults. Two mechanical aspects are studied: the role of the insertion ofcapsules in the reinforcement or weakening effect of the overall beamstrength under bending, and the analysis of which interface strengthand capsule size are more beneficial to make the capsules breakproperly (and deliver the healing agent into the crack). Therefore, thismodel is restricted to analyze the breakage of the capsules, where thecapsules are assumed empty. Given a fixed external capsule radius of1.5 mm (commonly used in lab tests), the model predicts that usingcapsules with t/R<0.12, a minimum interface strength of 2 MPa hasto be ensured to break and liberate the healing agent. If this ratioincreases, the required minimum bonding strength also increases, but ina non-linear way. If this increase of interface strength cannot betechnically achieved in the lab (e.g., by capsule surface treatment),the self-healing strategy will not take effect, as the capsule will debondfrom the matrix. However, a non-negligible strengthening of the beamcan be obtained as side-effect due to the reinforcement introduced bythe capsules. On the other hand, the effect of the number of capsulesand the clustering have also been analyzed. A number of capsulesbetween 1 and 8 has been progressively located close to the notch of thebeam. As a result, a light increase of the peak force in bending isobserved (compared to the bending response of a solid beam).Conversely, it has been noted the following trend: in regions wherethe capsules are densely clustered, the concrete material is moresusceptible to fail sooner despite the reinforcement effect provided bythe capsules. Therefore, this result might indicate that the global beamresponse might suffer an important weakening if the capsular inter-distance decreases sufficiently.
Regarding the material system that involves polymers, an encapsu-lation-based self-healing polymer has been studied using a simplemicro-scale model that makes use of a Representative VolumeElement (RVE). Similarly to the previous macro-scale model, thedamage has been introduced with the combination of XFEM elementsin both materials, the polymer matrix and the shell capsule. Bothconstituents are joined by using cohesive surfaces. The results show thatboth types of damages, the material fracture and the capsule debond-ing, can coexist for the studied range of mechanical properties. Thelimit of breakage and debonding of micro-capsules has been studiedwithout and with a preexisting crack. In terms of global mechanicalresponse, it is found that both scenarios provide indistinguishablehomogenized stress-strain curves, despite the fact that both cracksequence and crack pattern are different. The overall material proper-ties of the self-healing polymer have been calculated for a wide range ofvolume fractions and different capsule geometric ratios. Despite thequantitative differences between the experimental available data andthe micro-model predictions (due to simplifications), it has been founda very good agreement from the qualitative point of view. As a matterof fact, the present model catches very well the trend of variation of theelasticity and stress at failure as a function of the volume fraction.
To finish, a note of caution. An important advantage provided bythe present commercial implementation is its capability of predictingarbitrary crack paths in any specimen under load. This capability isundoubtedly a huge help for researchers to understand and to predictthe global response obtained from real experiments. That being said, itis worth mentioning to know and bear in mind the limitations explainedin this work, because they might represent an important bias. Thesebiases can introduce some uncontrolled or hardly detectable artifacts inthe final results that hinder their interpretation for further applications.This situation might become even worse when the model is particularlyelaborated and its physical response is far from being intuitive orpredictable.
Acknowledgments
Financial support from the Strategic Initiative Materials - Flanders(program Engineered Self-Healing materials (SHE) - projects SECEMINand SEPOCOM and program H-INT-S) is gratefully acknowledged.
References
[1] S.R. White, N.R. Sottos, P.H. Geubelle, J.S. Moore, M.R. Kessler, S.R. Sriram,E.N. Brown, S. Viswanathan, Autonomic healing of polymer composites, Nature409 (6822) (2001) 794–797.
[2] S. Van der Zwaag, N. Van Dijk, H. Jonkers, S. Mookhoek, W. Sloof, Self-healingbehaviour in man-made engineering materials: bioinspired but taking into accounttheir intrinsic character, Philosophical Transactions of the Royal Society of LondonA: Mathematical, Physical and Engineering Sciences 367 (1894) (2009) 1689–1704.
[3] K. Van Tittelboom, N. De Belie, D. Van Loo, P. Jacobs, Self-healing efficiency ofcementitious materials containing tubular capsules filled with healing agent, Cem.Concr. Compos. 33 (4) (2011) 497–505.
[4] M. Wu, B. Johannesson, M. Geiker, A review: self-healing in cementitiousmaterials and engineered cementitious composite as a Self-Healing Material,Constr. Build. Mater. 28 (1) (2012) 571–583.
[5] K. Van Tittelboom, N. De Belie, Self-healing in cementitious materials - a review,Materials 6 (6) (2013) 2182–2217.
[6] M. Kessler, N. Sottos, S. White, Self-healing structural composite materials,Compos. A: Appl. Sci. Manuf. 34 (8) (2003) 743–753.
[7] J. Tirosh, A.S. Tetelman, Fracture conditions of a crack approaching a disturbance,Int. J. Fract. 12 (2) (1976) 187–199.
[8] M.G. Knight, L.C. Wrobel, J.L. Henshall, L.A. De Lacerda, A study of theinteraction between a propagating crack and an uncoated/coated elastic inclusionusing the be technique, Int. J. Fract. 114 (1) (2002) 47–61.
[9] R. Kitey, H.V. Tippur, Dynamic crack growth past a stiff inclusion: opticalinvestigation of inclusion eccentricity and inclusion-matrix adhesion strength, Exp.Mech. 48 (1) (2008) 37–53.
[10] K.C. Jajam, H.V. Tippur, Role of inclusion stiffness and interfacial strength ondynamic matrix crack growth: an experimental study, Int. J. Solids Struct. 49 (9)(2012) 1127–1146.
[11] A.C. Balazs, Modeling self-healing materials, Mater. Today 10 (9) (2007) 18–23.[12] S.V. Zemskov, H.M. Jonkers, F.J. Vermolen, Two analytical models for the
probability characteristics of a crack hitting encapsulated particles: application toself-healing materials, Comput. Mater. Sci. 50 (12) (2011) 3323–3333.
[13] H. Huang, G. Ye, The effects of capules on self-healing efficiency in cementitiousmaterials, Second International Conference on Microstructural-Related Durabilityof Cementitious Composites, Rilem Proceedings Pro083, 11-13 April, 2012,Amsterdam, The Netherlands, Rilem, 2012, pp. 1090–1100.
[14] Z. Lv, H. Chen, Analytical models for determining the dosage of capsulesembedded in self-healing materials, Comput. Mater. Sci. 68 (2013) 81–89.
[15] F.A. Gilabert, D. Garoz, W. Van Paepegem, Stress concentrations and bondingstrength in encapsulation-based self-healing materials, Mater. Des. 67 (2015)28–41.
[16] G.B. Pye, J.J. Beaudoin, An energy approach to bond strength determinations incement systems, Cem. Concr. Res. 22 (4) (1992) 551–558.
[17] J. Zhou, M. Huang, F. Sagnang, W. Soboyejo, Interfacial failure of a dental cementcomposite bonded to glass substrates, Dent. Mater. 22 (6) (2006) 585–591.
[18] J. Bieniaś, H. Dȩbski, B. Surowska, T. Sadowski, Analysis of microstructuredamage in carbon/epoxy composites using FEM, Comput. Mater. Sci. 64 (2012)168–172.
[19] L. Bouhala, A. Makradi, S. Belouettar, H. Kiefer-Kamal, P. Fréres, Modelling offailure in long fibres reinforced composites by X-FEM and cohesive zone model,Compos. Part B 55 (2013) 352–361.
[20] H. Wang, J. Wang, J. Chen, Micromechanical analysis of asphalt mixture fracturewith adhesive and cohesive failure, Eng. Fract. Mech. 132 (2014) 104–119.
[21] D.M. Grogan, C.M.Ó. Brádaigh, S.B. Leen, A combined XFEM and cohesive zonemodel for composite laminate microcracking and permeability, Compos. Struct. 120(2015) 246–261.
[22] Abaqus, 2016 User documentation, Tech. Rep. Dassault Systémes Simulia Corp.,Providence, RI, USA. 2016.
[23] J.H. Song, P.M.A. Areias, T. Belytschko, A method for dynamic crack and shearband propagation with phantom nodes, Int. J. Numer. Methods Eng. 67 (6) (2006)868–893.
[24] J.J.C. Remmers, R. de Borst, A. Needleman, The simulation of dynamic crackpropagation using the cohesive segments method, J. Mech. Phys. Solids 56 (1)(2008) 70–92.
[25] S. Osher, J.A. Sethian, Fronts propagating with curvature-dependent speed:algorithms based on Hamilton-Jacobi formulations, J. Comput. Phys. 79 (1) (1988)12–49.
[26] M. Stolarska, D.L. Chopp, N. Moës, T. Belytschko, Modelling crack growth bylevel sets in the extended finite element method, Int. J. Numer. Methods Eng. 51 (8)(2001) 943–960.
[27] N. Moës, A. Gravouil, T. Belytschko, Non-planar 3D crack growth by the extendedfinite element and level sets-Part I: mechanical model, Int. J. Numer. Methods Eng.53 (11) (2002) 2549–2568.
[28] M. Duflot, A study of the representation of cracks with level sets, Int. J. Numer.Methods Eng. 70 (11) (2007) 1261–1302.
[29] G.T. Camacho, M. Ortiz, Computational modelling of impact damage in brittle
F.A. Gilabert et al. Materials & Design 130 (2017) 459–478
477
materials, Int. J. Solids Struct. 33 (20-22) (1996) 2899–2938.[30] P.H. Geubelle, J.S. Baylor, Impact-induced delamination of composites: a 2D
simulation, Compos. Part B 29 (5) (1998) 589–602.[31] A. Turon, C. Dávila, P. Camanho, J. Costa, An engineering solution for mesh size
effects in the simulation of delamination using cohesive zone models, Eng. Fract.Mech. 74 (10) (2007) 1665–1682.
[32] K. Park, G.H. Paulino, Cohesive zone models: a critical review of traction-separation relationships across fracture surfaces, Appl. Mech. Rev. 64 (6) (2013)060802.
[33] M.L. Benzeggagh, M. Kenane, Measurement of mixed-mode delamination fracturetoughness of unidirectional glass/epoxy composites with mixed-mode bendingapparatus, Compos. Sci. Technol. 56 (4) (1996) 439–449.
[34] Q.V. Bui, A Modified Benzeggagh-Kenane fracture criterion for mixed-modedelamination, J. Compos. Mater. (2010) 389–413.
[35] A. Turon, P. Camanho, J. Costa, C. Dávila, A damage model for the simulation ofdelamination in advanced composites under variable-mode loading, Mech. Mater.38 (11) (2006) 1072–1089.
[36] K. Van Tittelboom, K. Adesanya, P. Dubruel, P. Van Puyvelde, N. De Belie,Methyl methacrylate as a healing agent for self-healing cementitious materials,Smart Mater. Struct. 20 (122) (2011) 125016/1–12.
[37] W.Y. Sun L., Q.G. Yu, Experimental research on the self-healing performance ofmicro-cracks in concrete bridge, Adv. Mater. Res. 250-253 (2011) 28–32.
[38] M. Maes, K. Van Tittelboom, N. De Belie, The efficiency of self-healingcementitious materials by means of encapsulated polyurethane in chloride con-taining environments, Constr. Build. Mater. 71 (2014) 528–537.
[39] E. Tsangouri, G. Karaiskos, D.G. Aggelis, A. Deraemaeker, D. Van Hemelrijck,Crack sealing and damage recovery monitoring of a concrete healing system usingembedded piezoelectric transducers, Struct. Health Monit. (2015).
[40] M.L. Gambhir, Concrete Technology. Civil engineering series, Tata McGraw-HillPub., 9780070583740, 2004.
[41] J. Mencik, Strength and Fracture of Glass and Ceramics, Elsevier Science andTechnology, Oxford, United Kingdom, 1992.
[42] J. Shackelford, R. Doremus, Ceramic and Glass Materials: Structure, Properties andProcessing, Springer, 9781441944603, 2010.
[43] Y.S. Jenq, S.P. Shah, A fracture toughness criterion for concrete, Eng. Fract. Mech.21 (5) (1985) 1055–1069.
[44] B.L. Karihaloo, P. Nallathambi, Effective crack model for the determination offracture toughness (KIce) of concrete, Eng. Fract. Mech. 35 (4) (1990) 637–645.
[45] S.A. Hamoush, H. Abdel-Fattah, The fracture toughness of concrete, Eng. Fract.Mech. 53 (3) (1996) 425–432.
[46] M. Overend, G. Parke, D. Buhagiar, Predicting failure in glass - a general crackgrowth model, J. Struct. Eng. 133 (8) (2007) 1146–1155.
[47] F.A. Veer, P.C. Louter, F.P. Bos, The strength of annealed, heat-strengthened andfully tempered float glass, Fatigue Fract. Eng. Mater. Struct. 32 (1) (2009) 18–25.
[48] J. Belis, Kipsterkte Van Monolithische En Gelamineerde Glazen Liggers, Ph.D. thesisGhent University, 2005, http://dx.doi.org/1854/5844.
[49] K.R. Linger, D.G. Holloway, The fracture energy of glass, Philos. Mag. 18 (156)(1968) 1269–1280.
[50] S.M. Wiederhorn, Fracture surface energy of glass, J. Am. Ceram. Soc. 52 (2) (1969)99–105.
[51] K. Van Tittelboom, Self-Healing Concrete Through Incorporation of EncapsulatedBacteria- or Polymer-Based Healing Agents, Ph.D. thesis Ghent University, 2012.
[52] F.A. Gilabert, K. Van Tittelboom, E. Tsangouri, D. Van Hemelrijck, N. De Belie,W. Van Paepegem, Determination of strength and debonding energy of a glass-concrete interface for encapsulation-based self-healing concrete, Cem. Concr.Compos. 79 (2017) 76–93.
[53] A. Hillerborg, M. Modéer, P.E. Petersson, Analysis of crack formation and crackgrowth in concrete by means of fracture mechanics and finite elements, Cem. Concr.Compos. 6 (6) (1976) 773–781.
[54] N. Moës, T. Belytschko, Extended finite element method for cohesive crack growth,Eng. Fract. Mech. 69 (7) (2002) 813–833.
[55] P. Grassl, M. Jirásek, Damage-plastic model for concrete failure, Int. J. Solids
Struct. 43 (22-23) (2006) 7166–7196.[56] K. Song, C.G. Dávila, C.A. Rose, Guidelines and parameter selection for the
simulation of progressive delamination, Conference Proceedings 2008 AbaqusUsers' Conference: May 19-22, Newport, Rhode Island, USA, Dassault Systemes,2008, 2008, pp. 1–15.
[57] E. Tsangouri, D.G. Aggelis, K. Van Tittelboom, N. De Belie, D. Van Hemelrijck,Detecting the activation of a self-healing mechanism in concrete by acousticemission and digital image correlation, Sci. World J. 2013 (2013) Article ID424560(1–20).
[58] J. Feiteira, E. Tsangouri, E. Gruyaert, C. Lors, G. Louis, N. De Belie, Monitoringcrack movement in polymer-based self-healing concrete through digital imagecorrelation, acoustic emission analysis and sem in-situ Loading, Mater. Des. (2016).
[59] S.A. Ponnusami, S. Turteltaub, S. van der Zwaag, Cohesive-zone modelling ofcrack nucleation and propagation in particulate composites, Eng. Fract. Mech. 149(2015) 170–190.
[60] Y.C. Yuan, T. Yin, M.Z. Rong, M.Q. Zhang, Self healing in polymers and polymercomposites. Concepts, realization and outlook: a review, eXPRESS Polymer Letters 2(4) (2008) 238–250.
[61] S.R. White, N.R. Sottos, P.H. Geubelle, J.S. Moore, M.R. Kessler, S.R. Sriram,E.N. Brown, S. Viswanathan, Autonomic healing of polymer composites, Nature409 (6822) (2001) 794–797.
[62] M. Yu, P. Zhu, Y. Ma, Effects of particle clustering on the tensile properties andfailure mechanisms of hollow spheres filled syntactic foams: a numerical investi-gation by microstructure based modeling, Mater. Des. 47 (2013) 80–89.
[63] G.G. Sozhamannan, S.B. Prabu, R. Paskaramoorthy, Failures analysis of particlereinforced metal matrix composites by microstructure based models, Mater. Des. 31(8) (2010) 3785–3790.
[64] S.D. Mookhoek, H.R. Fischer, S. v. d. Zwaag, A numerical study into the effects ofelongated capsules on the healing efficiency of liquid-based systems, Comput.Mater. Sci. 47 (2) (2009) 506–511.
[65] E.N. Brown, S.R. White, N.R. Sottos, Microcapsule induced toughening in a self-healing polymer composite, J. Mater. Sci. 39 (5) (2004) 1703–1710.
[66] X.K.D. Hillewaere, R.F.A. Teixeira, L.T.T. Nguyen, J.A. Ramos, H. Rahier,F.E.D.u. Prez, Autonomous self-h of epoxy thermosets with thiol-isocyanatechemistry, Adv. Funct. Mater. 24 (35) (2014) 5575–5583.
[67] Y.C. Yuan, M.Z. Rong, M.Q. Zhang, J. Chen, G.C. Yang, X.M. Li, Self-healingpolymeric materials using epoxy/mercaptan as the healant, Macromolecules 41(14) (2008) 5197–5202.
[68] D. Garoz, F.A. Gilabert, R.D.B. Sevenois, S.W.F. Spronk, A. Rezaei, W. VanPaepegem, Definition of periodic boundary conditions in explicit dynamic simula-tions of micro- or meso-scale unit cells with conformal and non-conformal meshes,17th European Conference on Composite Materials, European Society forComposite Materials (ESCM), 2016, pp. 1–6.
[69] M.W. Keller, N.R. Sottos, Mechanical properties of microcapsules used in a self-healing polymer, Exp. Mech. 46 (6) (2006) 725–733.
[70] Matweb, Overview of Materials for Epoxy and Urea-Formaldehyde, (2016) http://www.matweb.com.
[71] R.O. Ebewele, B.H. River, G.E. Myers, Polyamine-modified urea-formaldehyde-bonded wood joints. III. Fracture toughness and cyclic stress and hydrolysisresistance, J. Appl. Polym. Sci. 49 (2) (1993) 229–245.
[72] T. Hobbiebrunken, B. Fiedler, M. Hojo, M. Tanaka, Experimental determination ofthe true epoxy resin strength using micro-scaled specimens, Compos. A: Appl. Sci.Manuf. 38 (3) (2007) 814–818.
[73] E.N. Brown, M.R. Kessler, N.R. Sottos, S.R. White, In situ poly(urea-formaldehyde) microencapsulation of dicyclopentadiene, J. Microencapsul. 20 (6)(2003) 719–730.
[74] E.N. Brown, S.R. White, N.R. Sottos, Retardation and repair of fatigue cracks in amicrocapsule toughened epoxy composite-part II: in situ self-healing, Compos. Sci.Technol. 65 (15-16) (2005) 2474–2480.
[75] F.A. Gilabert, D. Garoz, W. Van Paepegem, Numerical study of transitional brittle-to-ductile debonding of a capsule embedded in a matrix, Compos. Interfaces 24 (1)(2017) 69–84.
F.A. Gilabert et al. Materials & Design 130 (2017) 459–478
478