materials challenges in solid oxide fuel cells1 materials challenges in solid oxide fuel cells anil...
TRANSCRIPT

1
Materials Challenges in Solid Oxide Fuel Cells
Anil V. VirkarDepartment of Materials Science & Engineering122 S. Central Campus Drive, University of Utah
Salt Lake City, UT 84112Phone: (801) 581-5396
A Lecture on Solid Oxide Fuel CellsPresented at UCSB Summer School
Santa Barbara, CAAugust 7, 2006

2
Objectives of the Lecture
1) To serve as an introduction to SOFC; scienceand technology.
2) To identify key materials and microstructure- related parameters which determine performance of SOFC.
3) To identify and discuss thermo-mechanical issues concerning anode-supported cells.
4) To provide information on the fabrication ofanode-supported SOFC and testing of button cells.
5) To provide a source of relevant literature.

3
Notes and Disclaimers
• The material given here is not complete, either in content, coverage of topics, and should be considered as reference material. There are numerous research articles, review articles, books, and symposia proceedings on this subject.
• Important source of literature is the series of proceedings volumes of ECS SOFC symposia, including the SOFC-IX being held at this meeting.
• The instructor’s own knowledge of the field is by no means complete (it is a constant process of learning) and also the instructor cannot guarantee that it is without misconceptions.

4
Lecture Format
1) To provide a number of viewgraphs with severalpictorials and illustrations.
2) To provide parametric equations that can assist in designing cells by allowing for parameter measurements- the objective is not to conduct detailed modeling.
3) To provide illustrative calculations.4) To provide a list of selected references for one
interested in further details. 5) The approach will be to give more material in these slides
than can be covered in a two hour lecture.

5
Course Organization: Topics
Topic 1: A Brief Discussion of Solid Oxide Fuel Cell (SOFC) including relevant thermodynamics.Topic 2: SOFC Materials: Electrolyte, Cathode, Anode; Cell Architecture on the Basis of SupportTopic 3: Sources of various voltage losses, and their dependence on cell parameters and test conditions.Topic 4: Cell Design for Enhanced PerformanceTopic 5: Cell Design – Thermo-mechanical ConsiderationsTopic 6: Cell FabricationTopic 7: Cell Testing

6
Topic 1: A Brief Description of Solid Oxide Fuel Cells (SOFC)
O2
Porous Cathode
H2O
H2or
H2 + COelectrons
Porous Anode
H2OorH2O + CO2
nFGE ∆−=
NernstPotential
Load
H+
and/orO-2
Dense
Electrolyte
Three Components:a) Cathodeb) Electrolytec) Anode
Most of the SOFCuse oxygen ion (O-2)conducting solidelectrolyte. Limitedwork has been doneon SOFC based onproton (H+) conductors.

7
A Planar Cell and Test Fixture
8" cell8" cell(400 cm²)4" cell
(100 cm²)
Cartridge heater + insulator
SEM Micrograph
Anode
Cathode
Electrolyte (~10 microns)

8
SOFC 1 kW Stack
Stack dimensions: 5.5” × 5.5” × 4.625”Volumetric power density = ~500 Watt/LiterInternal manifolds; Cross-flow
Technology Objective: Higher specific power, greater efficiency, longer life, and lower cost

9
Functions of the Three Components
• Cathode: Transport of oxygen from the gaseous oxidant (O2 + N2) through the porous cathode to the cathode/electrolyte interface – diffusion/convection. Transport of electrons.
• Cathode: Conversion of O2 into 2O-2 ions and transfer into the electrolyte – electrochemical reaction of reduction.
• Electrolyte: Transport of O-2 ions through the electrolyte towards the electrolyte/anode interface – ionic conduction.
• Anode: Transport of gaseous fuel (H2 or H2 + CO) through the porous anode towards the anode/electrolyte interface –diffusion/convection. Transport of electrons.
• Anode: Reaction of fuel (H2 or H2 + CO) with O-2 ions to form H2O or H2O + CO2 and release of electrons for transport through the external circuit, through the load, to the cathode – electrochemical reaction of oxidation.
10
A Simplified Equivalent Circuit for SOFC
Current Flow
Ref. ‘Fuel Cells and Fuel Batteries’, H. A. Liebhafsky and E. J. Cairns
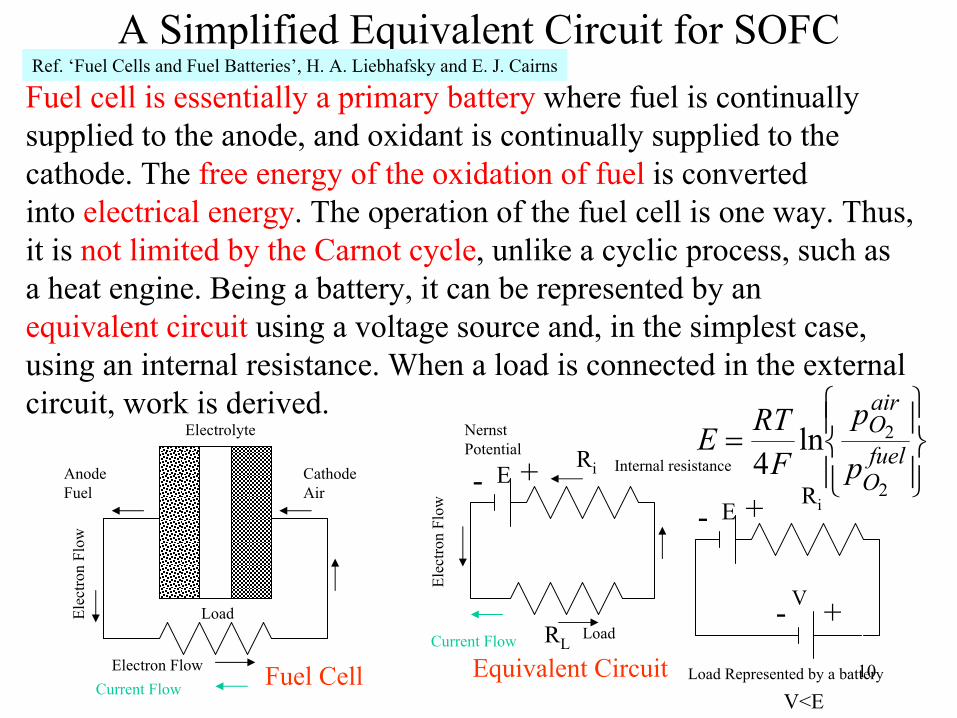
Fuel cell is essentially a primary battery where fuel is continuallysupplied to the anode, and oxidant is continually supplied to thecathode. The free energy of the oxidation of fuel is convertedinto electrical energy. The operation of the fuel cell is one way. Thus, it is not limited by the Carnot cycle, unlike a cyclic process, such asa heat engine. Being a battery, it can be represented by an equivalent circuit using a voltage source and, in the simplest case,using an internal resistance. When a load is connected in the external circuit, work is derived.
CathodeAir
AnodeFuel
Electrolyte
LoadElec
tron
Flow
Fuel Cell
+-Ri
RLLoad
Internal resistance
Nernst Potential
Equivalent Circuit
Elec
tron
Flow
E
= fuelO
airO
p
pF
RTE2
2ln4
Electron FlowCurrent Flow
+-
Ri
Load Represented by a battery
E
V
V<E
+-

11
Voltage vs. Current (or Current Density)
+-Ri
RLLoad
Internal resistance
Nernst Potential
Equivalent Circuit
Elec
tron
Flow
E
= fuelO
airO
p
pF
RTE2
2ln4
Current Flow
Voltage acrossLoad or Cell
Li RREI+
=Current
LIRV =
iIREV −=
Thus, by load we meaneither RL or I Current, I
Vol
tage
, V
Slope = -Ri
E
Power ( )VI
RRRE
RVRI
Li
L
LL =
+=== 2
222
Power

12
Fuel Cell with Hydrogen as the Fuel
The chemical reaction with H2 as the fuel isH2 + 1/2O2 H2O
In a fuel cell, the reaction occurs electrochemically.In what follows, we will assume the electrolyte to be an oxygen ion conductor. Then, the reactions at the two electrodes are:
Cathode: ½O2 + 2e’ O-2
O-2 ions transport through the electrolyte towards the anode.
Anode: H2 + O-2 H2O + 2e’The electrons transport through the external circuit performing useful work. The overall reaction is the sum of the two.
The Overall Reaction: H2 + 1/2O2 H2OoG∆ :Standard free energy change
G∆ : Free energy change(partial pressures differentfrom 1 atm).
Reduction of O atoms into O-2 ions

13
Fuel Cell Efficiency (Standard State, Reversible)Standard Gibbs Free Energy Change for the Reaction
oo FEG 2−=∆
ooo STHG ∆−∆=∆
Standard Gibbs Free Energy Change in terms of the Nernst Voltage
Maximum Work (reversible process) in standard state is given by
All partial pressures are at 1 atm
ooo FEGw 2'max =∆−=
o
o
o
o
o
oorev
HFE
Hw
H
G
∆=
∆=
∆
∆=
2'maxη
∆Ho = Standard enthalpy (H) change (H of one mole of H2O at T and 1 atm. partialPressure – H of one mole of H2 at T and 1 atm. partial pressure – H of ½ mole of O2 at TAnd 1 atm. partial rpessure)∆So = Standard entropy change.
‘Introduction to Thermodynamics of Materials’, D. R. Gaskell
When operated reversibly, the power is nearly zero.
Eo = 0.972 at800oC (1073 K)
F: Faraday constant (96,487 Coulombs/mol.)
Introduction to Thermodynamicsof Materials D. R. Gaskell
Thermodynamic Efficiency when the cell is operated reversibly, and in standard state

14
Fuel Cell Efficiency (Non-Standard State, Reversible)Gibbs Free Energy Change for the reaction when Reactants and products not in Standard States
STHG ∆−∆=∆ Partial pressures different from 1 atm.
Gibbs Free Energy Change in terms of the Nernst VoltageFEG 2−=∆
Maximum Work (reversible process) is given byFEGw 2'max =∆−=
Thermodynamic Efficiency when the cell is operated reversibly
orevHFE
HFE
Hw
HG
∆=
∆=
∆=
∆∆
=22'
maxη
For the assumption of an ideal gas, oHH ∆=∆However, oSS ∆≠∆
222ln H
oHH pRSS −= and similarly for other species.
SoH2 = Partial molar entropy of hydrogen in the standard state

15
Thermodynamic Efficiency=∆−∆=∆ ooo STHG -247,500 + 55.85 T j/mol. From Gaskell
oH∆oG∆
o
oo
H
G
∆
∆=η
G∆
airOp
2
97.003.0
2
2 =
fuelH
fuelOH
p
p
HG
∆
∆=η
Temp.K
1073
973
873
773
673
573
StandardEnthalpy(J/mol.)
-247,500
-247,500
-247,500
-247,500
-247,500
-247,500
StandardFreeEnergy(J/mol.)
-187,573
-193,158
-198,743
-204,328
-209,913
-215,498
Standard TherrmodynamicEfficiency(%)
76%
78%
80%
82.5%
85%
87%
= 0.21
-211,623
-214,967
-218,310
-221,654
-224,997
-228,341
Thermo-dynamicEfficiency(%)
85.5%
86.9%
88.2%
89.6%
90.9%
92.3%
Efficiencyat 0.8 V(%)
78%
78%
78%
78%
78%
78%
HF∆×
=8.02
8.0η
++−∆−∆=∆−∆=∆ air
OfuelH
fuelOH
oo pRpRpRSTHSTHG222
ln21lnln

16
Free Energy and Reversible Work
+∆=∆
airO
fuelH
fuelOHo
pp
pRTGG
22
2lnFree Energy Change
−=−=∆
fuelO
fuelH
fuelOH
eqo
pp
pRTKRTG
22
2lnln
Standard Free Energy and the Equilibrium Constant
−=
−=∆ fuel
O
airO
fuelO
airO
p
pRT
p
pRTG
2
2
2
2 ln21ln
Free Energy Change in terms of Oxygen Partial Pressures
=∆−= fuel
O
airO
FC p
pRTGw
2
2ln21'max
Maximum (Reversible) Work Maximum work is the same as reversible, isothermal expansion of half a mole of oxygen gas.
In the fuel itself , the reactionH2(fuel) +1/2O2(fuel) H2O(fuel)Is in equilibrium. Thus,∆G = 0 = ∆Go + RTlnKeq
--(1)
--(2)
--(3)
Substitute for ∆Go from (2) into (1)
(air)21(fuel)(fuel)
-
222
reactantsproducts
OHOH GGG
GGG
−−=
=∆
iGi
ofenergy freemolar partialor potential Chemical=
∫ ∫−==p
dpRTpdVw

17
Isothermal Reversible Expansion of an Ideal Gas
=∆−= fuel
O
airO
FC p
pRTGw
2
2ln21'max
Piston
Cylinder
Gas Resisting ForceHeat Reservoir

18
Free Energy and Reversible Work (contd.)Maximum (Reversible) Work for a Carnot Cycle
( )
−=
1
2max ln21
PPTTRw coldhotCarnot
Figure: A p-V diagram comparing a fuel cell and a Carnot engine.Reversible work during a Carnot cycle = Area ABCDAReversible work during a fuel cell operation = Area ABB’A’A
A
B
C
D
B’A’ Volume
Pres
sure
Thot
Tcold
=
1
2max ln21
PPRTw hotFuelCell
( )
−= fuel
O
airO
coldhotCarnot p
pTTRw
2
2ln21max
maxmaxCarnotFuelCell ww >
2PPA =
1PPB =
'2PPD =
'1PPC =
1
2'
1
'2
PP
PP
=

19
An Illustration
( )
∆
=
=
∆−=
RTG
p
pp
pp
pRTGK
o
oH
oOHfuel
O
fuelO
oH
oOH
o
eq
2exp
exp
2
2/1
2
22
22
2 =airOp
2
=fuelOp
2
Fuel: H2=97%, H2O=3%: 1 atm. poH2=0.97 atm, po
H2O = 0.03 atmOxidant: Air (21% O2): 1 atm. po
O2 = 0.21 atm, T = 800oC = 1073 K
Standard Free Energy of H2(g) + 1/2O2(g) H2O(g)∆Go = ∆Ho –T∆So = -247,500 +55.85T
0.21 atm
5.23x10⁻²² atm
Nernst voltage:
V1.0966
1023.521.0ln
96487410733144.8ln
4 222
2
=
×××
=
= −fuel
O
airO
p
pF
RTE
Data from book on thermodynamics,e.g. Gaskell

20
Free Energy, Work and Efficiency
+∆+∆−= fuel
OH
airO
fuelHoo
FC p
ppRSTHw
2
22lnmax
Fuel Cell Maximum (Reversible) Work and EMF
F
p
ppRSTH
FGE
fuelOH
airO
fuelHoo
2
ln
22
22
+∆+∆−
=∆
−=
Nernst Voltage
max2 FCFC wFVw <=Work when the cell is operated irreversibly
ChangeEnthalpy DerivedWork 2
=∆−
=H
FVη
Thermodynamic Efficiency Voltage Efficiency
ChangeEnergy Free GibbsDerivedWork
==EV
vη
The objective is to maximize ηv for a given power level, or maximizepower at a given ηv.

21
Maximize Power at Given Efficiency or Efficiency at Given Power
Current Density
Vol
tage
Pow
er D
ensi
ty
Current DensityV
olta
ge
Pow
er D
ensi
ty
Power Density at a Given Efficiency Efficiency at a Given Power Density
Either way, the lower the cell resistance, the better
Low Cell Resistance
High Cell Resistance
Low Cell Resistance
High Cell Resistance
Higher Power Higher Efficiency

22
Thermodynamics in Terms of Cell Parameters and Load
An Equivalent CircuitAll sources of voltage losses inThe cell are lumped into Ri.
Voltage vs. Current Plot
I
E
V
- Ri
Slope
(This is a simplification, made just forthe sake of simplified discussion. TheV-I curve is rarely linear).
( )LiLi RRFG
RREI
+∆
−=+
=2
iL IREIRV −==Voltage,
Current,
ERi
RL Load
ERi
Equivalent circuitfor the cell
The above is idealized. Usually, the V-I trace is nonlinear. I
V

23
Thermodynamics in Terms of Cell Parametersand Load (contd.)E
Ri
RL Load VIP = Li RREI+
=
iRIQ 2' =o
iRIVIQP 2' +=+o
iIREV −=
dtdqEEIQP ==+
o
'
( )E
FRRt Li 2+=
( )2
22'
Li
ii
RRRERIQ
+==
oPower Voltage Current
Internal Rate of Heat Dissipationinto work or heat
Work Done
Time Required to Consume One Mole of Hydrogen
Rate of Free Energy Conversion
Heat Dissipated
The Sum GFEQw ∆−==+ 2''
( ) ( )Li
L
Li
LRR
RGRR
FERFVVItPtw+
∆−=+
====22'
( ) ( )Li
i
Li
iRR
RGRR
FERtQQ+
∆−=+
==2''
o
Equivalent Circuit
Recall
∆G < 0

24
Thermodynamics in Terms of Cell Parametersand Load (contd.)
12 UUwQU −=−=∆
irrSTQSSS ∆+=−=∆ 12
( ) irrSTSSTQ ∆−−= 12
( )12' VVPww −+=
11122212 TSPVUTSPVUGGG +−−−+=−=∆
'wSTG irr −∆−=∆
irrSTGw ∆−∆−='
FEG 2−=∆
irrSTFEw ∆−= 2'
First Law Q = Heat absorbed by the systemw = Work done by the system
Isothermal Process
Isobaric ProcessFor an Isothermal-Isobaric Process
The above gives
( ) ( )Li
i
Li
LRR
RFEFERR
FERFVVItPtw+
−=+
==== 2222'We also have
‘Introduction to the Thermodynamicsof Materials’ D. R. Gaskell
Maximum possible work Loss – degree of irreversibility.

25
Thermodynamics in Terms of Cell Parametersand Load (contd.)
Degree of Irreversibility
Rate of Irreversible Entropy Production
( ) ( )2
2
22
Li
i
LiLi
iirrirr
RRTRE
RRFE
RRR
TFE
tS
dtdS
+=
+×
+
=∆
=
Thermodynamic Efficiency
+
∆−=
+
=∆Li
i
Li
iirr RR
RTG
RRR
TFES 2
+∆
∆=
+
=
+∆
=∆
=Li
L
Li
Lrev
Li
LRR
RHG
RRR
RRR
HFE
HFV ηη 22
Need toLower Ri
Need toLower Ri

26
Rate of Heat Exchange with the Surroundings
( ) ( )
+
−−=∆−−=Li
iirr RR
RFESSTSTSSTQ 21212
( )( )( ) ( )2
212
22Li
i
LiLi RRRE
RRFSST
ERRF
QtQQ
+−
+−
=+
==o
Heat produced per mole of hydrogen consumed
Rate of heat production (exothermic)
Note that ∆S = S2 – S1 < 0.
Need toLower Ri

27
What Does this all Mean For an SOFC?
1) Magnitude of free energy of the reaction (with free energy < 0) must be as high as possible to achieve the highest possible conversion of chemical energy into electrical energy. With H2(or CO) as the fuel, this implies, the lower the temperature, the higher is the thermodynamic efficiency.
2) The internal cell resistance must be as small as possible. Thus, every effort must be made to lower the overall cell resistance. Since the V-I relationship is usually nonlinear, it is necessary to address voltage losses (polarizations) at both electrodes as well. The higher the temperature, the lower the resistance.
Now we will devote next several slides on understanding what arethe main contributions to the cell ‘resistance’, and how to lower the cell resistance, which is in fact the main part of this part of this lecture

28
Solid Oxide Fuel Cells: General
2 W/cm)( iiη=
Power: Rate of Work Derived
Rate of Heat Generation byPolarization
2 W/cm)( iiV=
Objective: Lower η(i) to as low a value as possible.
(Open Circuit Voltage (OCV))
Load
Cell
Voltage
Cur
rent
Polarization or OverpotentialV
i
V(i)
E
Current Density
Vol
tage
Voltage AvailableFor Useful Work
Short CircuitCurrent Density
η(i)
OperatingCurrent Density
nFGE
∆−=
η(i)Typical Operating Point, V = 0.7E
Loss of voltage – Polarizationor Overpotential

29
Topic 2: SOFC Materials: Electrolyte, Cathode, Anode; Cell Architecture on the Basis of Support
• Electrolyte: A dense (no open, connected porosity) Yttria Stabilized Zirconia (YSZ) A solid solution between ZrO2 and Y2O3 (~8 mol.% Y2O3, ~92 mol.% ZrO2).
• Anode: A porous, two-phase composite of Ni + YSZ.
• Cathode: A porous, two-phase composite of LSM + YSZ. (LSM: Sr-doped LaMnO3; typical composition – La0.8Sr0.2MnO(3-δ)).
Anode
Cathode
Electrolyte

30
YSZ Electrolyte: Defect Chemistry
[ ] [ ]••= OZr VY 2'
YxZr(1-x)O(2-x/2)
Over the temperature and oxygen partial pressure ranges of interest, thepredominant point defects are oxygen vacancies. The electroneutralitycondition is given by
For this reason, YSZ is predominantly an oxygen ion conductor.

31
LSM Cathode: Defect Chemistry
LSM: La(1-x)SrxMnO(3-δ) is a perovskite
Mn is predominantly in +3 state. Sr substitution on the A-site (La-site) leads to the creation of oxygen vacancies. This further leads to the absorption of oxygen by oxidizing Mn from +3 to +4 states. Chargecompensation is achieved by the formation of electron holes. Thus, LSM is predominantly a p-type material.
•×•• +→+ hOgOV OO 2)(21
2
4/12Oel p∝σElectronic conductivity

32
Other SOFC Materials
• Electrolyte: Rare earth oxide doped CeO2 (e.g. Gd2O3-CeO2 - GDC); Sr-doped and Mg-doped LaGaO3 (LSGM).
• Cathode: Single Phase - Sr-doped LaCoO3 (LSC), Sr-doped LaFeO3 (LSF), LSCF, etc.; Composite – LSM + Rare earth oxide doped CeO2 – e.g. GDC, LSM + LSGM; LSF + GDC, LSCF + GDC, etc.
• Anode: Ni + Rare earth oxide doped CeO2 – GDC; Cu + CeO2; La-doped SrTiO3, etc.
Many of these materials are currently being explored as they offercertain advantages over the state of the art materials; e.g. LSGMhas higher ionic conductivity than YSZ. However, there alsoare associated challenges. Thus, state of the art materials stated earlier (or small variations from them) continue to be widely used.

33
SOFC Designs Based on Relative Thicknesses
Cathode Current Collector or Support
Anode Functional Layer
Anode Support orAnode Current Collector
Electrolyte
Cathode Functional Layer
ELECTROLYTE-SUPPORTED CATHODE-SUPPORTED
ANODE-SUPPORTED

34
Types and Approximate Magnitudes of Conductivities (Resistivities) of the Various Layers (800oC)
• Anode Support or Current Collector: Electronic ~1,000 S/cm (~0.001 Ωcm).
• Anode Functional Layer: Electronic ~500 S/cm (~0.002 Ωcm).
• Electrolyte: Ionic ~0.033 S/cm (~30 Ωcm).• Cathode Functional Layer: Electronic ~50 S/cm (0.02
Ωcm).• Cathode Current Collector or Support: Electronic ~100
S/cm (~0.01 Ωcm).

35
Calculations of the Approximate Ohmic Area Specific Resistance (ASR) at 800oC for the Three Types of Designs
Electrolyte-Supported: High ASRElectrode-supported: Low ASR
Electrolyte Ionic Resistivity: eρ = 30 ΩcmCathode (Both Layers) Electronic Resistivity: cρ = 0.01 ΩcmAnode (Both Layers) Electronic Resistivity: aρ = 0.005 Ωcm Electrolyte Thickness: el (cm)Cathode (Total) Thickness: cl (cm)
Anode (Total) Thickness: al (cm)
Ohmic Area Specific Resistance (ASR): aacceeiR lll ρρρ ++= Ωcm2
Electrolyte Supported: (30x0.015+0.01x0.01+0.005x0.01) = 0.4502 Ωcm2
Cathode Supported: (30x0.001+0.01x0.2+0.005x0.01) = 0.0321 Ωcm2
Anode Supported: (30x0.001+0.01x0.01+0.005x0.1) = 0.0306 Ωcm2
Cell Resistance = ASR (Ωcm2)/Cell Area (cm2) = Ω (ohms)

36
A Typical, Five Layer Anode-Supported Cell: Various Layers and their Functions
• Anode support: Ni + YSZ, ~0.3 to ~1 mm, ~40% porosity, Coarse microstructure: Electronic conduction, fuel gas transport.
• Anode Functional Layer: Ni + YSZ, ~10 to ~20 microns, ~25% porosity, fine microstructure: Mixed Ionic (YSZ) and Electronic (Ni) conduction, fuel gas transport - electrochemical reaction.
• Electrolyte: YSZ, ~5 to 10 microns, dense (no connected porosity), fine microstructure: Ionic conduction.
• Cathode Functional Layer: LSM + YSZ, ~10 to ~20 microns, ~25% porosity, fine microstructure: Mixed Ionic (YSZ) and Electronic (LSM) conduction, oxidant gas transport – electrochemical reaction.
• Cathode Current Collector: LSM, ~50 to ~150 microns, ~40% porosity, Coarse microstructure: Electronic conduction, oxidant gas transport.
Anode Support
Anode Functional LayerElectrolyteCathode Functional LayerCathode Current Collector

37
An SEM Micrograph of an Anode-Supported Cell (Microstructure)
Electrolyte
Anode Support
Anode Functional Layer
Cathode Functional Layer
Cathode Current Collector
50 µm~0.6 mm
~15 µm~8 µm
~20 µm
High porosity foreasy air transport
High porosity foreasy fuel transport
Fine porous structure foreasy electrocatalysis – oxygen reduction
Fine porous structure foreasy electrocatalysis – fuel oxidation

38
Attributes of Anode-Supported Design
• Easy fabrication with Ni + YSZ as starting materials.• NiO and YSZ neither dissolve in each other nor react with
each other.• The presence of two phases helps maintain the microstructure
fine.• The electrolyte/anode bi-layer or cathode/electrolyte/anode
tri-layer can be fabricated in a single firing step. • The presence of a large amount of Ni improves heat transfer.• Cell is quite robust.

39
Topic 3: Sources of various voltage losses, and their dependence on cell parameters and test conditions.
• Voltage loss associated with ‘resistance’ to gas transport through porous anode – Anode Concentration Polarization or Concentration Overpotential.
• Voltage loss associated with ‘resistance’ to gas transport through porous cathode – Cathode Concentration Polarization or Concentration Overpotential.
• Voltage loss associated with the ‘resistance’ to electrochemicaloxidation of fuel at the anode – Anode Activation Polarization or Activation Overpotential.
• Voltage loss associated with the ‘resistance’ to electrochemicalreduction of oxygen at the anode – Cathode Activation Polarization or Activation Overpotential.
• Voltage loss associated with resistance to ion transport through the electrolyte, electron transport through electrodes – Ohmic Loss.

40
Gas Transport through Electrodes
Flux of oxygen through cathode depends upon: (1) Binary O2-N2 diffusivity.(2) Porosity. (3) Pore size. (4) Tortuosity. (5) Thickness. (6) Partial pressureof oxygen in the oxidant, poO2.
FiNjjj A
OOHH 22
222===
Fluxes of hydrogen and water vapor through anode depend upon: (1) Binary H2-H2O Diffusivity. (2) Porosity. (3) Pore size. (4) Tortuosity. (5) Thickness. (6) Partial pressure of hydrogen in the fuel, poH2.
( )(int)222 H
oHH ppj −∝
( )(int)222 O
oOO ppj −∝
oOp
2
Ano
de su
ppor
t
Ano
de in
terla
yer
Elec
troly
te
Cat
hode
inte
rlaye
r
Cat
hode
cur
rent
co
llect
or
)(')(2ip iOH)()(2
ip iH
)(')(2
ip iH
)(2 iOp
)(')(2
ip iO
oHp
2
)(')(2
ip iOH
oOHp
2
H2 + O-2 H2O + 2e Anode Interlayer 1/2O2 + 2e O-2 Cathode Interlayer
Fluxes in #/cm2.s

41
Fluxes and Current Density
AIi =
=I Current in Amps (A)
=A Active Cell Area (cm2)=i Current Density (A/cm2)
=2Hj Flux of Hydrogen (moles/(sec.cm2))
For every one mole of H2 passed (consumed) per unit time per unit area2 moles of electrons are passed in the external circuit; that is 2Fwhere F = Faraday constant (96,487 Coulombs/mole). Thus,
22 HFji =
Also, for every one mole of H2 consumed per unit time per unit areahalf a mole of O2 is consumed per unit time per unit area and one mole of H2O is formed per unit time per unit area. Thus,
222422 OOHH jFjFjFi ===

42
Gas Transport and Voltage Loss
oOp
2
Ano
de su
ppor
t
Ano
de in
terla
yer
Elec
troly
te
Cat
hode
inte
rlaye
r
Cat
hode
cur
rent
co
llect
or
)(')(2ip iOH)()(2
ip iH
)(')(2
ip iH
)(2 iOp
)(')(2
ip iO
oHp
2
)(')(2
ip iOH
oOHp
2
)(2
coOp
)(2
aoOp )('
2
aOp
)('2
cOp
)()('22
coO
cO pp <
)()('22
aoO
aO pp >
Note
= )('
)(''
2
2ln4 a
O
cO
p
p
FRTE
= )(
)(
2
2ln4 ao
O
coO
p
p
FRTE
Nernst Voltages
Thus, 'EE >
Loss of voltage = 'EE −
Concentration polarization orconcentration overpotentialat the anode + cathode
E’ = Nernst voltage across theelectrolyte when cell is underload (finite non zero current)

43
Electrode Design for Minimizing Concentration Polarization
• For a given current density, minimize partial pressure variations through the electrodes.
• Minimize the thicknesses of the electrodes – consistent with sufficient in-plane electrical conduction (low sheet resistance) and mechanical ruggedness.
• Increase porosity – again consistent with in-plane electrical conduction and mechanical ruggedness.
• Increase pore size.
Materials Processing procedures required to ensure that thedesired microstructures at the desired places are realized

44
Gas Transport through Porous Bodies
• Binary diffusion: (Anode:H2, H2O; Cathode: O2,N2).• Knudsen diffusion (if the pore size is comparable to the
mean free path).• Viscous flow.• Surface diffusion.
From the standpoint of cell design, need parameters that canbe readily measured. Assumptions:1) Viscous flow neglected. 2) Surface diffusion neglected.3) Transport by effective binary diffusion – treat tortuosity
factor as a fitting parameter - not valid if the pore size isvery small (less than about 0.25 microns).
Modes of Transport
Important Microstructural Parameters(a)Volume Fraction Porosity, (b)Pore Size, (c) Tortuosity
For more details, see: ‘Dusty Gas Model’ Mason and Malinauskas

45
Effective DiffusivitiesEffective Diffusivity through the Anode:
OHHa
avaeff D
VD
22
)()( −=
τ
22
)()( NO
c
cvceff D
VD −=
τ
Effective Diffusivity through the Cathode:
= Anode Tortuosityaτ
cτ = Cathode Tortuosity
= Binary DiffusivityOHHD22 −
= Binary Diffusivity22 NOD −
22 NOD −OHHD22 − , : From handbooks or calculations
= Anode Volume Fraction Porosity)(avV
= Cathode Volume Fraction Porosity)(cvV
)(avV )(cvV, : From measurements
aτ cτ, : No direct way to measure
)()( , ceffaeff DD : Can bemeasured in principle.

46
Some Values of Binary Diffusivities
( )Ω
+×=
−
2
2/12/33 /1/11086.1
AB
BAAB p
MMTDσ
BA MM ,
T
Chapman Enskogg Model for Binary Diffusivity
cm2/s
= Molecular weights
= Temperature (K) p = Pressure (in atmospheres)
ABσ = Average Molecular Diameter (in Angstroms)
Ω = Collision Integral
Values at 800oC
OHHD22 − ~6.52 cm2/s
22 NOD − ~1.28 cm2/s
Depending upon the porosity andtortuosity, these numbers can be lower by more than an order of magnitude. Design of electrodemicrostructure (porosity) is important.
‘Mass Transfer in Fluids’E. L. Cussler
Higher binary diffusivity of H2-H2O is another reason for choosing anode-supported.

47
Measurement of Effective Diffusivities:An Electrochemical Method
Pump
Sensor
Porous LSM disk
Glass seal
Pt lead
Zirconia disk
V
A
Platinum paste Power supply
x = 0 x = l
PorousLSMDisc
p = p0
p = pi
0.15 0.20 0.25 0.30 0.35 0.40 0.450.00
0.02
0.04
0.06
0.08
0.10
0.12
0.14
0.16
Effe
ctiv
e di
ffusi
vity
(cm
2 /s)
Open porosity
Experimentally measured effective O2-N2diffusivity at 800oC as a function of porosity
1) Measure current – relate gaseous flux to it.2) Measure Nernst voltage – pO2 in the chamber3) Estimate efefctive diffusivity

48
How is the Voltage vs. Current Density Polarization Curve Influenced by Transport through Porous Electrodes?
asi
Current Density
Vol
tage
Limiting Current Density
csi = Cathode limiting current density (oxygen partial pressure at thecathode/electrolyte approaching zero)
= Anode limiting current density (hydrogen partial pressure at theanode/electrolyte approaching zero)
Voltage vs. current behavior when partial pressure of hydrogen at anode/electrolyte interface, or partialpressure of oxygen at cathode/electrolyte interfaceis nearly zero – limiting current density

49
Schematic of pH2 Variation as a Function of Current Density: Limiting Behavior
)(')(2ip iOH
Ano
de
oHp 2 )('
2 ipH
Elec
troly
te
At the limiting condition, )('22 ipp H
oH >> . This leads to a limiting flux.
That is, oHH
HoHH
pj
ippj
22
'222 ))((
∝
−∝
In the above schematic, the anode functional layer is ignored.or when )('
22 ipp HoH >>
Current Density
Vol
tage
Limiting Current Density
ias

50
Anode Limiting Current Density Behavior
)(22~ aeff
a
oH
as Dl
pRT
Fi
oHp
2 : Partial pressure of hydrogen just outside the anode
al : Anode thickness
Under most operating conditions, this behavior is not observed. However, a cell can be operated using a diluted fuel (low partialpressure of hydrogen in the fuel) to induce this type of behavior.The purpose is to experimentally determine the effectivediffusivity, which is usually not a strong function of the relativeamounts of H2 and H2O.

51
Cell Performance in Fuels with Different Hydrogen Partial Pressures
Vol
tage
Current DensityPo
wer
Den
sity
High pH2
Low pH2
0.0 0.5 1.0 1.5 2.0 2.5 3.0 3.5 4.0 4.50.0
0.2
0.4
0.6
0.8
1.0
Current Density (A/cm2)
Vol
tage
(V)
0.0
0.5
1.0
1.5
2.0
H2 15% H2O+H2
32% H2O+H2
45% H2O+H2
50% H2O+H2
66% H2O+H2
80% H2O+H2
Power D
ensity (W/cm
2)
Schematic
Data on a button cell at 800oC
asiasi
asi
In a stack of cells, portion of thecell at the inlet is exposed to a highpH2, while that near the outlet isexposed to low pH2, as the fuel gasbecomes depleted in H2.
Tests conducted under flooded conditions
Cell performance in a stack near outletCell performance in a stack near inlet

52
Anode Concentration Polarization or OverpotentialVoltage loss associated with fuel gas transport through the porous anodeis known as anode concentration polarization or overpotential. It depends onthe anode porosity, anode tortuosity, anode thickness; effective diffusivity,partial pressure of hydrogen in the fuel (how depleted is the fuel), and temperature.
−= '
)(2
)(2)( ln
4aO
oaO
aconc p
p
FRTη
−= '
22
'22
)( ln2 OH
oH
Ho
OHaconc pp
ppF
RTη
+
−
−=
as
asaconc
ii
ii
FRT
1
1ln
2)(η
)(22~ aeff
a
oH
as Dl
pRT
Fi
)(2
aoOp
oOp
2
Ano
de su
ppor
t
Ano
de in
terla
yer
Elec
troly
te
Cat
hode
inte
rlaye
r
Cat
hode
cur
rent
co
llect
or
)(')(2ip iOH)()(2
ip iH
)(')(2
ip iH
)(2 iOp
)(')(2
ip iO
oHp
2
)(')(2
ip iOH
oOHp
2
)(2
coOp
)('2
aOp
)('2
cOp

53
Experimental Evidence on the Effect of Anode Concentration Polarization on Cell Performance
Only Anode Support Porosity variedOnly Anode Support Thickness varied
0.0 0.5 1.0 1.5 2.0 2.5 3.0 3.50.0
0.2
0.4
0.6
0.8
1.0
1.2
Current Density (A/cm2)
Vol
tage
(V)
0.0
0.2
0.4
0.6
0.8
1.0
1.2
1.4
800 oCElectrolyte thickness: 8 µmAnode support porosity: 48 vol%Cathode interlayer: 20 µm
Anode support thickness: 0.50 mm 1.00 mm 1.45 mm 2.45 mm
Power D
ensity (W/cm
2)
2.45 mm
0.5 mm
)(22~ aeff
a
oH
as Dl
pRT
Fi
+
−
−=
as
asaconc
ii
ii
FRT
1
1ln
2)(η
0.0 0.5 1.0 1.5 2.0 2.5 3.0 3.5 4.00.0
0.2
0.4
0.6
0.8
1.0
1.2
Anode support porosity 76% 57% 48% 32%
800 oCAnode support thickness: 1.0 mmElectrolyte thickness: 8 µmCathode interlayer: 20 µm
Current Density (A/cm2)
Vol
tage
(V)
0.0
0.2
0.4
0.6
0.8
1.0
1.2
1.4
1.6
Power D
ensity (W/cm
2)
32%
57%,76%
48%
F. Zhao and A. Virkar, J. Power Sources, 141 79-95 (2005)

54
Anode Concentration Polarization - Calculations
0.0 0.5 1.0 1.5 2.0 2.5 3.0 3.50
50
100
150
200
Ano
de C
once
ntra
tion
Pola
rizat
ion
(mV
)
Current Density (A/cm2)
0.0
0.1
0.2
0.3
0.4
0.5
0.6
0.7
0.8
0.9
1.0
800 oCElectrolyte thickness: 8 µmAnode support porosity: 48 vol%Cathode interlayer: 20 µm
Anode support thickness: 0.50 mm 1.00 mm 1.45 mm 2.45 mm
PH
2 at anode/electrolyte interface (atm)
Only Anode Support Porosity VariedOnly Anode Support Thickness Varied
0.0 0.5 1.0 1.5 2.0 2.5 3.0 3.5 4.00
50
100
150
200
250
300
Ano
de C
once
ntra
tion
Pola
rizat
ion
(mV
)
Anode support porosity 76% 57% 48% 32%
800 oCAnode support thickness: 1.0 mmElectrolyte thickness: 8 µmCathode interlayer: 20 µm
Current Density (A/cm2)
0.0
0.1
0.2
0.3
0.4
0.5
0.6
0.7
0.8
0.9
1.0
PH
2 at anode/electrolyte interface (atm)
These calculations assume poH2 = 0.97. Downstream in a stack, the poH2 << 0.97,due to depleted fuel. Thus, anode concentration polarization downstream is even greater.
55
Cathode Concentration Polarization or Overpotential
oOp
2
Ano
de su
ppor
t
Ano
de in
terla
yer
Elec
troly
te
Cat
hode
inte
rlaye
r
Cat
hode
cur
rent
co
llect
or
)(')(2ip iOH)()(2
ip iH
)(')(2
ip iH
)(2 iOp
)(')(2
ip iO
oHp
2
)(')(2
ip iOH
oOHp
2
)(2
coOp
)(2
aoOp
)('2
aOp
)('2
cOp
−= )(
2
)('2
)( ln4 co
O
cO
cconcp
p
FRTη
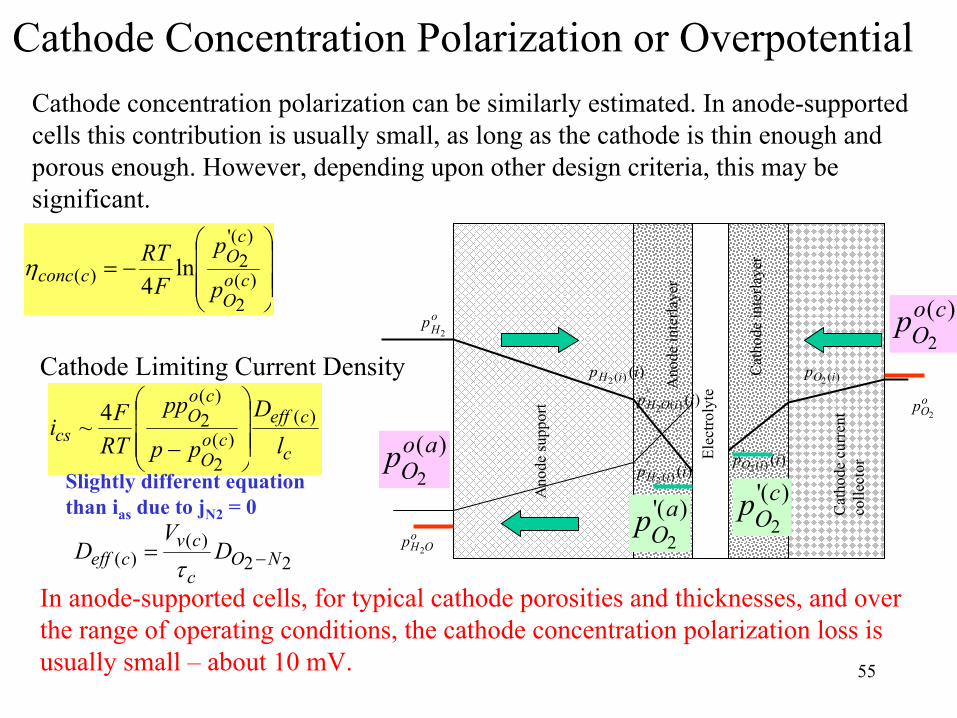
Cathode concentration polarization can be similarly estimated. In anode-supportedcells this contribution is usually small, as long as the cathode is thin enough and porous enough. However, depending upon other design criteria, this may besignificant.
c
ceffco
O
coO
cs lD
pp
pp
RTFi )(
)(2
)(24~
−
Cathode Limiting Current Density
22)(
)( NOc
cvceff D
VD −=
τIn anode-supported cells, for typical cathode porosities and thicknesses, and overthe range of operating conditions, the cathode concentration polarization loss isusually small – about 10 mV.
Slightly different equationthan ias due to jN2 = 0

56
Voltage Loss Associated with Electrochemical Reactions at the Electrodes: Activation Polarization• Cathode Reaction: 1/2O2 + 2e’ O-2
• Anode Reaction: H2 + O-2 H2O + 2e’• Species in the Gas Phase: O2(cathode), H2(anode), H2O(anode)• Species in YSZ: O-2
• Mobile Species in Electrode Materials: e’(LSM-cathode, Ni-anode)
The above gives only the overall electrode reactions. These compriseof many series and parallel steps. These include: (a) Adsorption,(b) Dissociation, (c) Surface Diffusion, (d) Electron Transfer. If anyone of the series steps is much slower than the other, one can describethe mechanism in terms of a rate-limiting step (RDS). Experimentally, thisis very difficult to determine – and the literature is full of many differentRDS. This underscores the difficulty in isolating such steps unequivocally.We will not much dwell on this topic. Our focus will be on identifying thosematerial/microstructural parameters which influence electrode reactions, andcan be experimentally measured and directly related to cell performance.

57
ηact – voltageloss
Activation Polarization or Overpotential: This is associated with the actualCharge transfer reaction, which in solid state electrochemistry generally occurs at a Three Phase Boundary (Electrolyte-Electrocatalyst-Gas Phase) (TPB).
1/2O2(g)
2e’
O-2
Oxidant (e.g. air)ElectrocatalystParticle(e.g. LSM)
Electrolyte(e.g. YSZ) O-2
H2(g)H2O(g)
2e’ Fuel(e.g. H2)
Electrolyte(e.g. YSZ)
ElectrocatalystParticle(e.g. Ni)
Cathode Anode2
2 '2)(21 −→+ OegO '2)()( 22
2 egOHgHO +→+−
actη : Voltage loss associated with the charge transfer reaction. This isusually a thermally activated process. A phenomenological equation,known as the Butler-Volmer equation, originally developed for aqueouselectrochemistry, is often used to describe it.
ηact – voltageloss
Three PhaseBoundary (TPB)
Three PhaseBoundary (TPB)
Activation Polarization
58
The Cathode Reaction
YSZ
LSM1/2O2
2e’
O-2
Air
YSZ
LSM
2e’
O-2
Air
Adsorbed‘O’ Atom
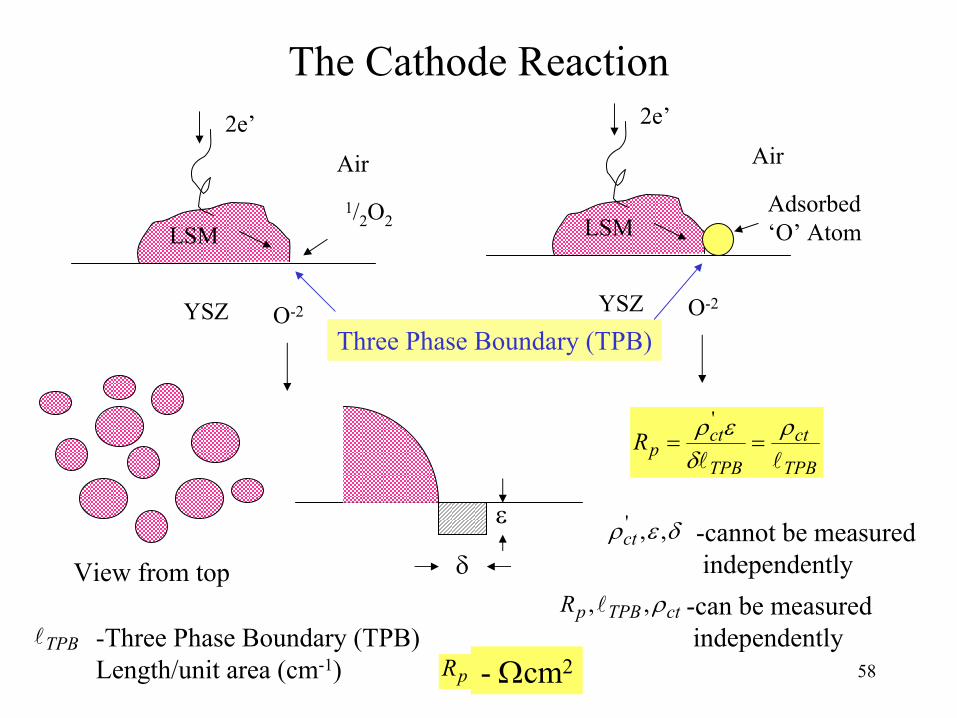
Three Phase Boundary (TPB)
ε
δView from top
TPB
ct
TPB
ctpR
ll
ρδ
ερ==
'
δερ ,,'ct -cannot be measured
independently
ctTPBpR ρ,,l -can be measuredindependentlyTPBl -Three Phase Boundary (TPB)
Length/unit area (cm-1) pR - Ωcm2

59
Monolithic (Screen-Printed) vs. Composite Cathode
From current collector
In a non-composite cathode, there are insufficient TPB’s. Thus, the resistanceto charge transfer (electrochemicalreaction) is large. Traditionally, LSMhas been used until recently. The importanceof using a composite cathode is nowbeing recognized by the SOFC community.
O-2 O-2 O-2 O-2
YSZ Electrolyte
1/2O22e’
PorosityIn the CompositeCathode
1/2O22e’
From current collector
O-2 O-2 O-2 O-2
YSZ Electrolyte
O-2 YSZ
LSM
These LSM particles are not effectiveas electrocatalyst – they only carry electronic current.
Electrocatalysisoccurs onlyat the TPBs.Very lowTPB
LSM Cathode LSM + YSZ Cathode
Isolated
Much larger TPB in composite cathodes

60
Composite Cathode Features
• The cathode functional layer is a mixture of an ionic (YSZ) and an electronic (LSM) conductor. This increases the total TPB and extends the reaction zone.
• YSZ must be contiguous – to carry ionic current.• LSM must be contiguous – to carry electronic current.• Porosity must be contiguous – for gaseous transport.• There must be large TPB length – that is LSM should not
completely cover YSZ particles.
1/2O22e’
From current collector
O-2 O-2 O-2
YSZ Electrolyte
O-21) J. S. Newman and C. Tobias, J. Electrochem. Soc., 109 1183 (1962).2) T. Kenjo, S. Osawa, and K. Fujikawa, J. Electrochem. Soc., 138
349 (1991).3). C. W. Tanner, K-Z. Fung, and A. V. Virkar, J. Electrochem. Soc.,
144 21 (1997).

61
Role of Cathode TPB on Performance
Maximum Power density at 800oC was ~0.33 W/cm2.
Maximum Power density was ~1.1 W/cm2 at 800oC.
Cell 1 Cell 2
Black – PoresWhite – YSZRed or Blue – LSM
Color-Coded Electron Micrographs (taken on an Electron Microprobe)

62
Good CathodeEPMA Micrograph
Three Phase Boundaries (TPB)
Not a TPB5 µm
MaximumPower density Of this cell was~1.1 W/cm2 at800oC.
Pore
YSZ
YSZ
LSM
TPB
TPB

63
Poor CathodeEPMA Micrograph
Three Phase Boundaries (TPB)
No TPB5 µm
Maximumpowerdensity at800oC was~0.33 W/cm2.
LSM
YSZ
Pore
No TPB

64
Quantitative Features of the Composite CathodeParameters
• Ionic conductivity (σi) or resistivity (ρi = 1/σi) of the ionic conductor in the functional layer YSZ.(S/cm or Ω-1cm-1)
• Particle size of the YSZ (d) in the functional layer (cm).• Porosity of the functional layer (Vv).• Charge transfer resistivity (ρct). This is a function of
temperature and oxygen partial pressure (local) (Ωcm).• Three phase boundary length (lTPB) (cm-1).• Thickness of the functional layer (h). Essentially no
dependence for h>>d.
Assumptions: (a) Electronic conductivity of LSM is much greater than ionicConductivity of YSZ. (b) Gas diffusion is fast (so porosity is not too low).

65
A Simple ModelLSM particles
Log(h)
Rp R
ct
( ) ( ) )1(11 viTPB
ct
vi
ct
v
ctip V
dVdR
VdRR
−=
−=
−≈
σρ
σρ
l
Illustrative calculation:Rct = 1 Ωcm2 ρi = 50 Ωcm d = 1 µm Vv = 0.3
Then, Rp = 0.0845 Ωcm2 – a twelve-fold decrease in polarization resistance through microstructural design!
ρi = Ionic resistivity of the electrode
C. W. Tanner et al.J. Electrochem Soc., 144 21-30 (1997).
Screen-printed LSM
hcr ~10d
All parameters can be measured.
Fundamental parameter which governs electrochemical reaction is ρct
h
2e’
O-2 O-2 O-2
YSZ Electrolyte
O-2 h

66
How to Measure Charge Transfer Resistivity, ρct?
• Not very easily.• Need to make electrodes
with well-defined and varying three phase boundary length, lTPB.
• This requires methods from microlithography.
• Measure area specific charge transfer resistance using methods such as impedance spectroscopy.
YSZSubstrate
LSMFilm
TPB
Slope = 1/ρct
Working Electrode
Reference Electrode
100 µm
Photo Microlithography

67
Activation Polarization at High Current Densities• Polarization ‘resistance’ we described so far, including the effect of
electrode microstructure, is applicable only at very low currentdensities – linear (not ohmic) relation between current and voltage (overpotential).
• At high current densities, relationship between current and voltage (overpotential) is not linear. The most commonly used phenomenological equation is known as the Butler-Volmer equation.
• In either low or high current density regime, the relationship is thermally activated – hence the term activation polarization.
• Experimentally, it is very difficult, if not impossible to determine the relationship between current and voltage. Hence, fitting to cell test data is the only practical approach – if the objective is to design a cell.
• The simplest approach is to use a limiting case of the Butler-Volmer equation, known as the Tafel equation, applicable at high current densities. The use of Tafel equation also allows one to lump activation polarizations at both the cathode and the anode into a single expression.

68
Butler Volmer Equation and the Low Current Density Regime
( )
−
−
−=
RTzF
RTzFii actact
oηαηα 1expexp
z: Number of electrons participating in the reaction.F: Faraday constant (96,487 Coulombs/mole).R: Gas constant (8.3144 J/mol.).T: temperature (K).α: Transfer coefficient (0 < α < 1.0).io: Exchange current density (Amp/cm2) (thermally activated).
We see that the Butler-Volmer equation gives the current density, i, as afunction of the activation polarization, ηact, and not ηact as an explicitfunction of i. For very small values of the current density, the above simplifies to
iRizFiRT
po
act ≈≈η
whereo
p zFiRTR = is the charge transfer resistance (Ωcm2), a measure of the
resistance to the electrochemical reaction.
1)‘Electrochemical EngineeringPrinciples’ G. Prentice2) ‘Electrochemistry, P. H. Rieger
Linearized: Note; linear does not mean ohmic.
Ωcm2

69
Butler-Volmer Equation and the High Current Density Regime
( )
−
−
−=
RTzF
RTzFii actact
oηαηα 1expexp
The Butler-Volmer equation
At high ηact, that is
1>>RT
zF actη
1>>−RT
zF actη
ibaizF
RTizF
RToact lnlnln +=−≈
ααη
Or, for
ibaizF
RTizF
RToact lnln
)1(ln
)1(+=
−+
−−≈
ααη
Tafel Equation
Tafel Equation
The Tafel equation is usually applicable for i >> io. In an SOFC, both ofthe electrode activation polarizations can be usually described by theTafel equation at high overpotentials.

70
Exchange Current Density
GA
GA
Fast Electrode ProcessHigh Exchange Current Density
Slow Electrode ProcessLow Exchange Current Density
GA: Activation Energy

71
Understanding Exchange Current DensityVirtually no holes
Negligible exchange of water between compartments
Larger holes
Greater water exchange between compartments
Very fine holes
Some water exchange between compartmentsEquivalent to low exchange current density
Equivalent to higher exchange current density
Equivalent to negligible exchange current density

72
Activation Polarization: Summary Points
• Activation Polarization exists at both electrodes – cathode and anode.
• The general phenomenological equation used is the Butler-Volmer equation.
• In the general case, no simple relation can be given for the sum of activation polarization at the two electrodes as a function of current density.
• In the low current density regime, the relationship between overpotential, ηact, and current density, i, is linear. Thus, the activation polarization at the two electrodes can summed and expressed as a function of current density.
• In the high current density regime, the Tafel equation is assumed to be applicable. The ηact depends linearly on lni. Thus, in this case also, the activation polarization at the two electrodes can be summed and expressed as a function of the logarithm of current density.

73
What to do for Designing a Good Cathode with a Functional Layer?
• YSZ Particle should be fine (~0.5 µm or finer). Commercially available YSZ with 8 mol.% Y2O3 is satisfactory.
• LSM particle size should be fine (~0.5 µm or finer).• Mix YSZ and LSM in approximately 50:50 ratio.• Apply on the YSZ electrolyte surface. Approximate
thickness 10 to 20 microns. The porosity should be ~25%.• Apply a layer of LSM over this layer. Thickness of this
current collector layer should be ~50 to ~100 microns. Porosity should be about 45% or somewhat higher.
• Heat to ~1100 to 1200oC for 1 hour.

74
A Simple Analytical Model for SOFC Performance
Minimum number of parameters required is 5 to describe performance. Unfortunately,voltage – current density plots are of very simple shapes, which can be fit with threearbitrary parameters. Thus, it is generally not possible to obtain a unique set of parameters by fitting to cell performance data.
+
−
+
−+−−−=
as
as
csio
ii
ii
FRT
ii
FRTibaiREiV
1
1ln
21ln
4ln)(
OCV ActivationPolarization(assumes theTafel limit)-both electrodes
CathodeConcentrationPolarization
AnodeConcentrationPolarization
OhmicLoss
+
+−−−=
)(
)(ln
2)(
ln4
ln)( ')(
')(
')(
22
22
2
2
ipp
pipF
RTp
ipF
RTibaiREiViOH
oH
oOHiH
oO
iOio
Anode or CathodeLimiting Behavior
J. Electrochem. Soc., 146 [1] 69-78 (1999))()( iEiV o η−=
V(i)
i

75
Schematics of Various Polarizations
Current Density (A/cm2)
Vol
tage
(V)
Ohmic Polarization
Cathode Activation Polarization
Anode Activation Polarization
Cathode Concentration Polarization
Anode Concentration PolarizationVoltage AcrossLoad
Eo
Load
Ohmic Cathode Con Anode con. Cathode Act Anode Act
Eo Equivalent Circuit

76
Curve Fitting: Anode Support Thickness Varied
)1(22
effOHHD − = 0.68 cm2/s
)2(22
effOHHD − = 0.08 cm2/s
)1(22
effNOD − = 0.14 cm2/s
)2(22
effNOD − = 0.04 cm2/s
0.0 0.5 1.0 1.5 2.0 2.5 3.0 3.50.0
0.1
0.2
0.3
0.4
0.5
0.6
0.7
0.8
0.9
1.0
1.1
1.2
Ri 0.101a 0.098b 0.11Deff(1)
O2-N2
0.14
Deff(2)O2-N2
0.04
Deff(1)H2-H2O
0.68
Deff(2)H2-H2O
0.08
Experimental Curve-fitted
Vol
tage
(V)
Current Density (A/cm2)
Anode thickness = 0.5 mm
0.5 mm
0.0 0.5 1.0 1.5 2.0 2.5 3.00.0
0.1
0.2
0.3
0.4
0.5
0.6
0.7
0.8
0.9
1.0
1.1
1.2
Anode thickness = 1.0 mm
Ri 0.104a 0.094b 0.11Deff(1)
O2-N2
0.14
Deff(2)O2-N2
0.04
Deff(1)H2-H2O
0.68
Deff(2)H2-H2O
0.08
Experimental Curve-fitted
Vol
tage
(V)
Current Density (A/cm2)
1.0 mm
0.0 0.5 1.0 1.5 2.0 2.50.0
0.1
0.2
0.3
0.4
0.5
0.6
0.7
0.8
0.9
1.0
1.1
1.2
Anode thickness = 1.5 mm
Experimental Curve-fitted
Ri 0.135
a 0.105b 0.12Deff(1)
O2-N2
0.139
Deff(2)O2-N2
0.04
Deff(1)H2-H2O
0.68
Deff(2)H2-H2O
0.079
Vol
tage
(V)
Current Density (A/cm2)
1.5 mm
0.0 0.2 0.4 0.6 0.8 1.0 1.2 1.4 1.6 1.8 2.0 2.2 2.40.0
0.1
0.2
0.3
0.4
0.5
0.6
0.7
0.8
0.9
1.0
1.1
1.2
Experimental Curve-fitted
Anode thickness = 2.45 mm
Ri 0.148
a 0.12b 0.118Deff(1)
O2-N2
0.14
Deff(2)O2-N2
0.04
Deff(1)H2-H2O
0.68
Deff(2)H2-H2O
0.08
Vol
tage
(V) 2.45 mm
0.5 mm
1.0 mm
1.45 mm
2.45 mm
Only anode support thickness varied. Note all polarization curves fitted with the same four effectivediffusivities – experimental validation of the model
Divergence at low currentdensities since Tafel is not applicable at low i

77
Topic 4: Cell Design for Enhanced Performance
• A five layer anode-supported cell with standard materials (YSZ, LSM, Ni).
• Anode support of Ni + YSZ, approximately 50% of each by volume, porosity in excess of ~45% , coarse structure – pore size several microns; thickness as small as possible – practical 0.3 to 0.5 mm.
• Anode functional layer of Ni + YSZ, approximately ~60 vol.% YSZ,~40 vol.% Ni, porosity ~25%, thickness ~5 to 20 microns; particle sizes on the order of 0.5 to 1 micron. If particle size is much smaller than 0.5 µm, reduce thickness to ~2-3 µm. Microstructure well-developed – good inter-particle contact.
• Electrolyte, approximately ~ 8 to 10 microns thick, dense.• Cathode functional layer of LSM + YSZ, approximately ~60 vol.%
YSZ, ~40 vol.% LSM, porosity ~25%, thickness ~5 to 20 microns; particle sizes on the order of 0.5 to 1 micron. If particle size is much smaller than 0.5 µm, reduce thickness to ~2-3 µm. Microstructure well-developed – good inter-particle contact.
• Cathode current collector, LSM, coarse structure, porosity ~45 or 50%;pore size several microns; thickness ~50 to 200 microns (0.05 to 0.2 mm).

78
Rationale for the Choices of Various Cell Microstructural/Geometric Parameters
• Anode Support: Minimize concentration polarization, even at low pH2(high fuel utilization) – maximize ias. Ensure sufficient strength (not too thin – not too porous), sufficient electrical conductivity.
• Anode Functional Layer: Minimize activation polarization, even at low pH2 – large TPB length, small YSZ particle size, connected YSZ and connected Ni, modest porosity – thick enough to spread out electrochemical zone – thin enough to minimize concentration polarization.
• Electrolyte: Thickness not too critical, as long as below about 10 microns. Thick enough to be pinhole free.
• Cathode Functional Layer: Minimize activation polarization, even at low pO2 – large TPB length, small YSZ particle size, connected YSZ and connected LSM, modest porosity – thick enough to spread out electrochemical zone – thin enough to minimize concentration polarization.
• Cathode Current Collector: Minimize concentration polarization, even at low pO2 (high oxidant utilization) – maximize ics. Ensure sufficient electrical conductivity – minimize sheet resistance.

79
Topic 5: Cell Design – Thermo-mechanical Considerations
• All three components (anode, cathode, electrolyte) and the cell are brittle – can break, not bend.
• Strength is largely determined by the strength of the anode in anode-supported cells (thickest component). Typical strength is ~120 to ~150 MPa, sometimes even lower.
• Strength requirement is important from the standpoint of handling, thermal cycling, stresses due to non-uniform temperature distribution.
• Anode strength depends upon the relative amounts of Ni and YSZ, porosity, etc.
• Fracture toughness is another important fracture mechanical property.

80
100
150
200
250
0 10 20 30 40 50 60 70 80
Zirconia Content in ZrO2/NiO, vol.%
Flex
ural
Str
engt
h, M
Pa
8YSZ/Ni4YTZP/Ni3YTZP/Ni
Four-Point Bend Strength of Zirconia/Ni Anode-Supports as a Function of Zirconia Content
(after reducing at 800oC for 24 hours under 5 liter/min of 10% H2 + 90% N2)

81
0
1
2
3
4
5
6
7
0 10 20 30 40 50 60 70 80Zirconia Content in ZrO2/NiO, vol.%
8YSZ/Ni4YTZP/Ni3YTZP/Ni
Frac
ture
Tou
ghne
ss, K
IC, M
Pa √
m
Fracture Toughness of Zirconia/Ni Anode-Supports as a Function of Zirconia Content
(Measured Using Single Edge Notch Bending (SENB) Technique, after reducing at 800oC for 24 hours under 5 liter/min of 10% H2 + 90% N2)

82
Thermo-mechanical Issues – Stresses in PEN• PEN stands for the cell (Positive electrode – Electrolyte – Negative
electrode).• Thermal expansion coefficients of the three components are in general
different.• Elastic moduli (e.g. Young’s) of the three components are in general
different.• At the sintering or cathode firing temperature, there are negligible
stresses in the PEN structure. • When cooled to room temperature, different components tend to shrink
to different sizes – dictated by their thermal expansion coefficients.• However, they are bonded together. Thus, the unit as a whole needs to
shrink as one body – without causing cracks or delaminations. This leads to the establishment of stresses.
• Stresses are the highest at room temperature – lower at the operating temperature.
• Objective is to design cells such that minimum possible damage occurs.

83
Thermo-Mechanical Considerations
• Differences in coefficients of thermal expansion.• Differences in elastic properties, and component
thicknesses.• Cracking or delamination of layers. • Flatness of the cell.• Criteria for the selection of the best cell design.

84
What Happens when an Electrolyte-Anode Bi-layer is Cooled from the Fabrication Temperature?
Net Resulta) Electrolyte under bi-axial
compressionb) Anode under bi-axial
mild tensionc) The bi-layer exhibits
a convex up bow
Anode Thickness >> Electrolyte ThicknessElectrolyte ThermalShrinkage if it were free
Anode ThermalShrinkage if it were free
At High Temperature
At Room Temperature
But anode and electrolyte are bonded across the interface
Shrinkages and bow are shown exaggerated
InterfaceDelaminationcan occur
Cell assumed flat at hightemperature

85
Electrolyte/Anode Bi-Layer Structure
X
Y
A
L1 L2
B
CD
Anode
Electrolyte
α1 = Coefficient of thermal expansion of the electrolyte = 10.5 E-06/ °Cα2 = Coefficient of thermal expansion of the anode = 13 E-06/°CE1 = Modulus of elasticity of the electrolyte = 210 GPaE2 = Modulus of elasticity of the anode = 170 GPa
A Crack
Objective: To identify conditions under which a crack may develop – then in practice avoidsuch situations

86
Finite Element Analysis of Anode-Supported Cells
Finite Element Analysis of Delamination
Delamination Crack
Delamination Crack
Delamination Cracks
Anode
Cathode
Electrolyte
YSZ film in biaxial compression
Light violet color indicates the presence ofa compressive stress in the electrolyte. If a crack forms,stress in the cracked part of the electrolyte is relieved.This is shown in white.
In this case, delamination crack is assumed to occur along the cathode-electrolyte interface. Thus, stress from the cracked part of thecathode is relieved – shown in light blue.

87
Compressive Stress
Tensile Stress
Electrolyte
Anode YSZ electrolyte film in biaxial compressionNi + YSZ anode inmild biaxial tension
Bi-Layer without a Delamination Crack
High Stress

88
What Happens if Crack Develops along the Interface?
Stress Relief by Cracking
A delamination crack
Note negligiblestresses in the YSZ film and theNi + YSZ anodein the delaminatedregion.

89
Release of Strain Energy by Cracking along Interface
y = 927557x + 1.2986R2 = 0.999
0
5
10
15
20
25
30
35
0.00E+00
5.00E-06
1.00E-05
1.50E-05
2.00E-05
2.50E-05
3.00E-05
3.50E-05
Electrolyte Thickness in m
G in
J m
^2
Electrolyte Thickness (µm)
G (J m^2)
7 7.5
10 10.6
15 15.5
20 20.1
25 24.6
30 28.8
Low Tendency forDelamination High Tendency for
Delamination
G: Strain Energy Released when a Delamination Crack forms
Conclusion: For an anode-supported cell design, the thickerThe YSZ film, the greater is the tendency for crackingMessage: Make the electrolyte as thin as possible from the standpointof mechanical integrity – fortunately, this good for resistance as well

90
An Illustration: An Estimation of the Maximum Electrolyte Thickness in Anode-Supported Cells
≈elE 200 GPa
≈elα 10 x 10-6 /oC
≈anα 13 x 10-6 /oC
≈hT 1200oC = 1473 K
25oC = 298 K≈lT
30 J/m2 (rather approximate – could be off 20%)
( )m 24~2
2int µ
αγ
TEt
elel
∆∆<
Maximum allowable electrolyte thickness
Typical electrolyte thickness ~5 to 10 µm
Typical Values
Bending Neglected

91
Complete Cathode-Electrolyte-Anode (PEN) Structure
Electrolyte
Anode
Cathode
50 mm
1 mm
10 µm
50 - 300µm
Stress Analysis of the complete tri-layer structure can be similarly done usingFinite Element Analysis (FEA) using commercial software (e.g. ANSYS). DataRequired are: (a) Elastic properties of the three layers (or as many layers are there),(b) Thermal expansion properties of the three (or as many) layers, and (c) Thicknessesof the three (or as many) layers.
Results of some calculations

92
X
Y
A
L1 L2
B
CD
Anode Electrolyte
Cathode
α1 = Coefficient of thermal expansion of the electrolyte = 10.5 E-06/ °Cα2 = Coefficient of thermal expansion of the anode = 13 E-06/°Cα3 = Coefficient of thermal expansion of the cathode = 13 E-06/°C E1 = Modulus of elasticity of the electrolyte = 210 GPaE2 = Modulus of elasticity of the anode = 170 GPaE3 = Modulus of elasticity of the cathode = 50 GPa
Cathode-Electrolyte-Anode Tri-layer: Crack Along Electrolyte-Anode Interface: Cathode matched with Anode

93
Tensile Stress
Cathode
ElectrolyteCompressive stress
Anode
Note mildtensile stressesin both the anodeand the cathode
Stress State in the Absence of a Crack:Cathode Matched with Anode

94
Tensile stress
Compressive stressNote relaxed stresses inthe delaminated regions. Also note bending of thecathode-electrolyte bi-layerin the delaminated region.
Stresses when Delamination Crack forms between Anode and Electrolyte: Cathode Matched with Anode

95
Elastic Energy Release Rate Cathode Matched with Anode
Plot of G vs cathode thickness
y = 600x + 0.0031R2 = 0.9996
y = -15120x + 8.0647R2 = 0.9724
012345678
0.00E+00 1.00E-04 2.00E-04 3.00E-04 4.00E-04
Cathode Thickness in m
G in
J m
^2
G for crackbetween anodeand ElectrolyteG for crackbetween cathodeand electrolyteDelamination
Crack
Elastic energy release rate, G, is the energy released per unit area of the interfaceIF a crack forms. For a crack to form, this must exceed a certain materialAnd structure (PEN) parameter – here 2γint. That is, if G > 2γint, crack will form.Thus, the lower the G, the lower the tendency for crack formation.
The above implies that crack will most likely occur along electrolyte/anode interface,And not along cathode/electrolyte interface, assuming the γint is the nearly the samefor both interfaces. But note the rather low values of G.

96
α1 = Coefficient of thermal expansion of the electrolyte = 10.5 E-06/°Cα2 = Coefficient of thermal expansion of the anode = 13 E-06/°Cα3 = Coefficient of thermal expansion of the cathode = 10.5 E-06/°CE1 = Modulus of elasticity of the electrolyte = 210 GPaE2 = Modulus of elasticity of the anode = 170 GPaE3 = Modulus of elasticity of the cathode = 50 GPa
X
Y
A
L1 L2
B
CD
Anode Electrolyte
Cathode
Cathode-Electrolyte-Anode Tri-layer Crack Along Electrolyte-Anode Interface
Cathode matched with Electrolyte

97
Compressive Stress
Anode
CathodeElectrolyte
Tensile Stress
Stress State in the Absence of a CrackCathode Matched with Electrolyte

98
Electrolyte
Anode
Cathode
Compressive Stress
Tensile Stress
Stresses when Delamination Crack forms between Anode and Electrolyte Cathode Matched with Electrolyte

99
Elastic Energy Release RateCathode Matched with Electrolyte
y = 185324x + 14.411R2 = 0.9874
y = 184955x + 24.681R2 = 0.9874
0
10
20
30
40
50
60
70
80
90
0.00E+00 1.00E-04 2.00E-04 3.00E-04 4.00E-04
Cathode Thickness in m
G in
J- m
^2
G for crack between anode andelectrolyte
G for crack betweencathodeand electrolyte
Delamination Crack
Note: The G is high for cracks along both interfaces. Thus, cracking may occur along either interface. Also, the G is higher in this case (cathode matched with electrolyte) than in the previous case (cathode matched with anode).
Message: For anode-supported cells, better to matchCathode with anode – not with the electrolyte

100
Effect of Properties on Cell Flatness
• So far, we have neglected the role of bending stresses –which is actually significant.
• Bending occurs due to differences in stresses in the various layers. Bending can be calculated using equilibrium conditions; Sum of forces = 0, Sum of moments = 0.
• Since thermal expansion coefficients are of the various layers are different, the level of bending (bow) will vary with temperature.
• Whether or not cells are flat is important in both stack assembly procedure used, and stresses that are generated.
• By choosing appropriate values of thermal expansion coefficients, elastic properties, and thicknesses, bow can be minimized.

101
Bending Stresses: How Flat is the Cell?
E1 = Electrolyte Modulus = 210 GPa α1 = Electrolyte Th. Ex. Coeff. = 10.5 x 10⁻⁶/oCE2 = Anode Modulus = 170 GPa α2 = Anode Th. Ex. Coeff. = 13 x 10-6 /oCE3 = Cathode Modulus = 50 GPa α3 = Cathode Th. Ex. Coeff. = 10 to 15 x 10-6 /oC
Thus, for αcathode ~14 x 10-6 /oC, for the chosen values, the cellwill be flat at room temperature.
R2 = 0.9994
-0.3-0.25
-0.2-0.15
-0.1-0.05
00.05
0.1
9.00E-06
1.00E-05
1.10E-05
1.20E-05
1.30E-05
1.40E-05
1.50E-05
1.60E-05
Coeff. of thermal expansion for cathode /oC
Dis
plac
emen
t in
Y di
rect
ion
in
mm
FlatCellanode
cathode

102
Topic 6: Cell FabricationCell fabrication by tape-casting followed by sintering is described in thissection. This is probably the most common method of cell fabrication,although there likely are significant differences among developers insofar asthe details are concerned. What is described is one of the approaches, and byno means the only approach. Also, it is to be emphasized that many details and variations from the process described here that are actually implemented inour process, are not given due to the proprietary nature of the work.

103
Cell Fabrication Steps
1) Raw materials and formulation2) Tape casting the anode support, cutting to desired size3) Applying the anode functional layer4) Applying the electrolyte5) Bisquing to ~1000oC for binder burnout 6) Application of the electrolyte layer7) Sintering (1300 to 1500oC)8) Applying the cathode functional layer9) Applying the cathode current collector layer10) Firing at ~1200oC
Processes have been developed for co-sintering the complete cell in a singlehigh temperature step

104
Topic 7: Cell Testing1) Button size cells (typical cathode area of 1 to 2 cm2) are typically tested for
general cell characterization.2) Cells are tested under flooded conditions (high flow rates for both fuel and
oxidant) – thus during such tests, fuel and oxidant utilizations are very small. In such cases, the measured parameters correspond to a given set of fuel and oxidant utilization (depending upon gas compositions).
3) Cell is secured (using either glass or compression seals) in a test fixture, placed inside a furnace.
4) Cell is heated to ~700oC, and a mixture of H2 + N2 is passed over anode to reduce NiO to Ni – leads to the creation of porosity. Then the fuel is passed over the anode (H2 + H2O mixtures), and air (or O2 + N2 mixtures).
5) An electronic load box and/or a resistor box is used for testing.6) Voltage vs. current data are collected. Usually, voltage (y-axis) is plotted
vs. current density (x-axis). 7) Using a fast response electrochemical measuring instrument, sudden change
in voltage that occurs immediately after interrupting the current is measured. This gives a measure of the ohmic contribution from the cell.

105
A Test Fixture for Testing Button Cells
Air
Single Cell
Current Collector
Seal Al2O3 Tube
Out
A
V
Silver Wire
Silver Wire

106
Current Interruption
Ohmic Contribution = ∆V
Electrode Processes (slow)50 µs
iVRi
∆=Ohmic Area Specific Resistance Ωcm2
An oscilloscope trace
0.0 0.2 0.4 0.6 0.8 1.0 1.2 1.4 1.6 1.8 2.00
20
40
60
80
100
120
140
160
180
200
Mea
sure
d oh
mic
vol
tage
dro
p (m
V)
Current density (A/cm2)
2cm 103.0 Ω≈iRSlope

107
Effect of Various Cell Parameters on Performance
0.0 0.5 1.0 1.5 2.0 2.5 3.0 3.50.0
0.2
0.4
0.6
0.8
1.0
1.2
Current Density (A/cm2)
Vol
tage
(V)
0.0
0.2
0.4
0.6
0.8
1.0
1.2
1.4
800 oCElectrolyte thickness: 8 µmAnode support porosity: 48 vol%Cathode interlayer: 20 µm
Anode support thickness: 0.50 mm 1.00 mm 1.45 mm 2.45 mm
Power D
ensity (W/cm
2)
0.0 0.5 1.0 1.5 2.0 2.5 3.0 3.50.0
0.1
0.2
0.3
0.4
0.5
0.6
0.7
0.8
0.9
1.0
1.1
1.2
Current Density (A/cm2)
Vol
tage
(V)
0.0
0.1
0.2
0.3
0.4
0.5
0.6
0.7
0.8
0.9
1.0
1.1
1.2
1.3
Electrolyte thickness: 4 µm 8 µm 15 µm 20 µm
800 oCAnode Support Thickness: 1.0 mmAnode Support Porosity: 48 vol%Cathode Interlayer: 20 µm
Power D
ensity (W/cm
2)
0.0 0.5 1.0 1.5 2.0 2.5 3.0 3.5 4.00.0
0.2
0.4
0.6
0.8
1.0
1.2
Anode support porosity 76% 57% 48% 32%
800 oCAnode support thickness: 1.0 mmElectrolyte thickness: 8 µmCathode interlayer: 20 µm
Current Density (A/cm2)
Vol
tage
(V)
0.0
0.2
0.4
0.6
0.8
1.0
1.2
1.4
1.6
Power D
ensity (W/cm
2)
Anode Support Porosity Varied
Electrolyte Thickness Varied Anode Support Thickness Varied
The phenomenological equation statedearlier can be used to fit to the data. Some of the parameters can be obtained through separate, out of cell, measurements.

108
Summary Statements
• I have tried to give some material on fundamental concepts for designing high performance, robust cells.The material given here is by no means complete. It is hoped that this might be useful as a starting point for someone interested in the subject. There are numerous articles in the literature one should read for further learning.