math review data analysis, statistics, and probability
TRANSCRIPT

Math ReviewMath Review
Data Analysis, Statistics, and Data Analysis, Statistics, and ProbabilityProbability
Data InterpretationData Interpretation
Your primary task in these questions Your primary task in these questions is to interpret information in graphs, is to interpret information in graphs, tables, or charts, and then compare tables, or charts, and then compare quantities, recognize trends and quantities, recognize trends and changes in the date, or perform changes in the date, or perform calculations based on the information calculations based on the information you have found. you have found.
You should be able to understand You should be able to understand info presented in a table or various info presented in a table or various types of graphs.types of graphs.
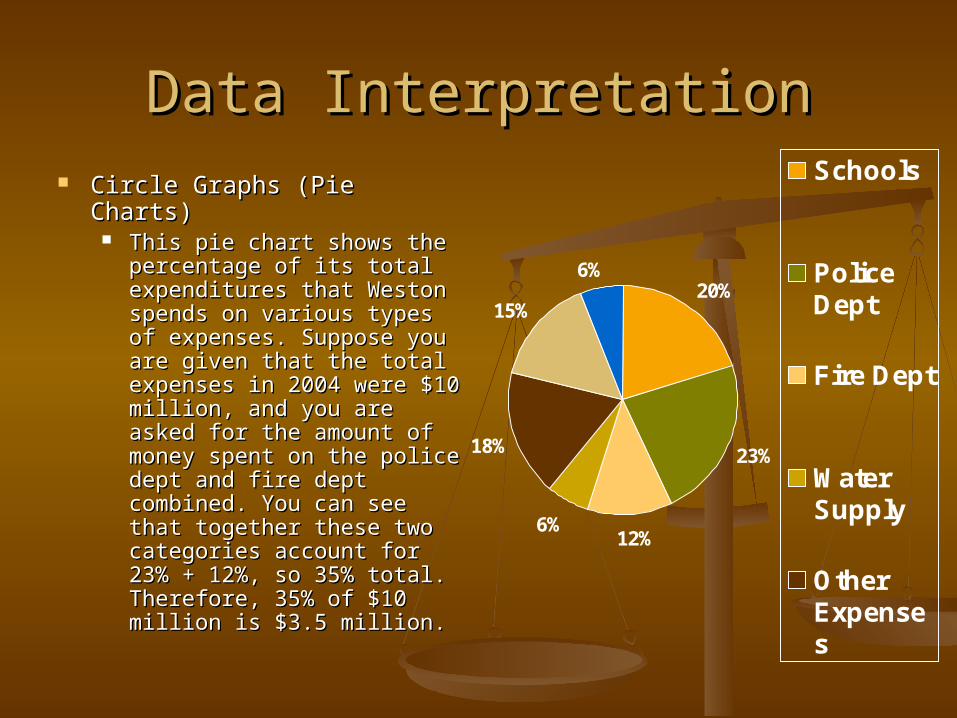
Data InterpretationData Interpretation Circle Graphs (Pie Charts)Circle Graphs (Pie Charts)
This pie chart shows the This pie chart shows the percentage of its total percentage of its total expenditures that Weston expenditures that Weston spends on various types of spends on various types of expenses. Suppose you expenses. Suppose you are given that the total are given that the total expenses in 2004 were expenses in 2004 were $10 million, and you are $10 million, and you are asked for the amount of asked for the amount of money spent on the police money spent on the police dept and fire dept dept and fire dept combined. You can see combined. You can see that together these two that together these two categories account for categories account for 23% + 12%, so 35% total. 23% + 12%, so 35% total. Therefore, 35% of $10 Therefore, 35% of $10 million is $3.5 million. million is $3.5 million.
20%
23%
12%6%
18%
15%
6%
Schools
PoliceDept
Fire Dept
WaterSupply
OtherExpenses
Sanitation Dept

Data InterpretationData Interpretation
Line GraphsLine Graphs This graph shows the high and low temps in Weston for the This graph shows the high and low temps in Weston for the
first 7 days of Feb. first 7 days of Feb. From the graph you can see that the high on Feb 5 was 25 From the graph you can see that the high on Feb 5 was 25
degrees and the low was 10 degrees. You can also see the degrees and the low was 10 degrees. You can also see the difference between high and low temps that day was 15.difference between high and low temps that day was 15.
05
1015202530354045
Date
Tem
p (
Fah
ren
heit
)
High
Low

Data InterpretationData Interpretation
Bar graphsBar graphs This one shows the amount of snow that fell each This one shows the amount of snow that fell each
day in Weston for the first 7 days of Feb. For day in Weston for the first 7 days of Feb. For example, you can see that no snow fell on Feb 2 example, you can see that no snow fell on Feb 2 and that 6 inches of snow fell the next day.and that 6 inches of snow fell the next day.
0123
4567
1-Feb
2-Feb
3-Feb
Feb 4
`
5-Feb
6-Feb
7-Feb
Date
Am
ou
nt
of
Sn
ow
(in
ches
)
Column 1
Data InterpretationData Interpretation
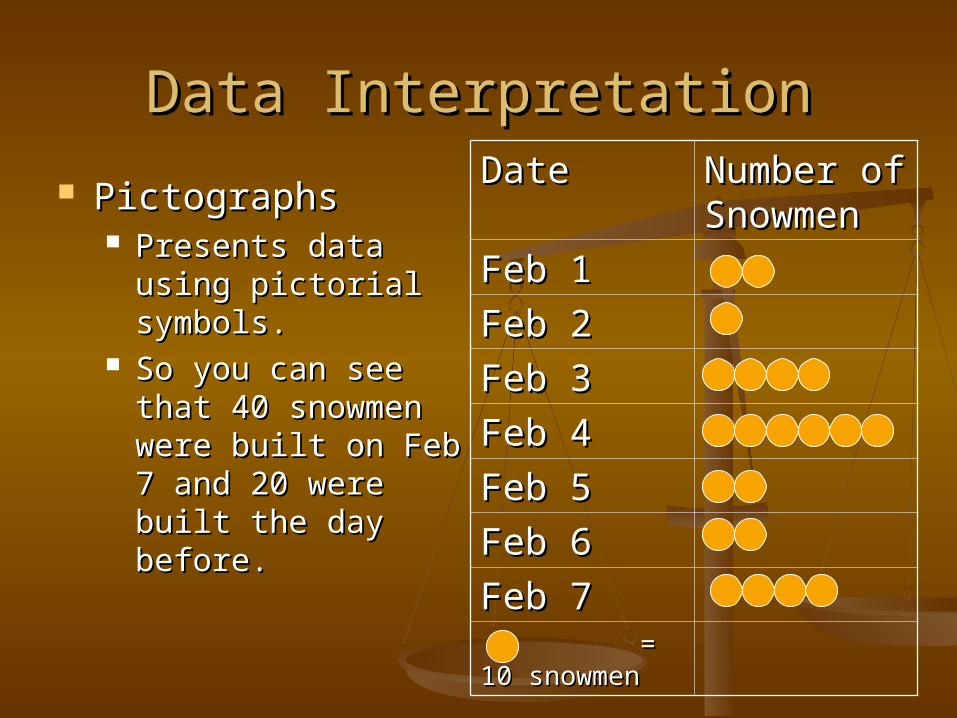
PictographsPictographs Presents data using Presents data using
pictorial symbols. pictorial symbols. So you can see that So you can see that
40 snowmen were 40 snowmen were built on Feb 7 and built on Feb 7 and 20 were built the 20 were built the day before. day before.
DateDate Number of Number of SnowmenSnowmen
Feb 1Feb 1
Feb 2Feb 2
Feb 3Feb 3
Feb 4Feb 4
Feb 5Feb 5
Feb 6Feb 6
Feb 7Feb 7 = 10 = 10 snowmensnowmen

Data InterpretationData Interpretation ScatterplotScatterplot
Compares two Compares two characteristics of the same characteristics of the same group of people or things. group of people or things. You can see a lot of info You can see a lot of info from this plot. There are from this plot. There are 20 people. 4 with 1 year of 20 people. 4 with 1 year of experience, 3 with 2 years, experience, 3 with 2 years, 4 with 3 years, 2 with 4 4 with 3 years, 2 with 4 years, 3 with 5 years, and years, 3 with 5 years, and 4 with 6 years. The 4 with 6 years. The median level of experience median level of experience is 3 years. Salary tends to is 3 years. Salary tends to increase with experience. increase with experience. 3 people make $700 a 3 people make $700 a week and 3 others make week and 3 others make $850 week. The median $850 week. The median salary is $787.50salary is $787.50
550.00
600.00
650.00
700.00
750.00
800.00
850.00
900.00
0 2 4 6 8
Years of Experience
Wee
kly
Sal
ary
(do
llar
s)
Data InterpretationData Interpretation Questions may ask to read the info on the Questions may ask to read the info on the
chart/graph, or to identify specific pieces chart/graph, or to identify specific pieces of information (data), compare data from of information (data), compare data from different parts of the graph, and different parts of the graph, and manipulate the data.manipulate the data.
Make sure toMake sure to Look at the graph to make sure you Look at the graph to make sure you
understand it and what info is being displayedunderstand it and what info is being displayed Read the labelsRead the labels Make sure you know the unitsMake sure you know the units Understand what is happening to the data as Understand what is happening to the data as
you move through the table, graph, or chart.you move through the table, graph, or chart. Read the question carefully.Read the question carefully.
Data Interpretation Data Interpretation
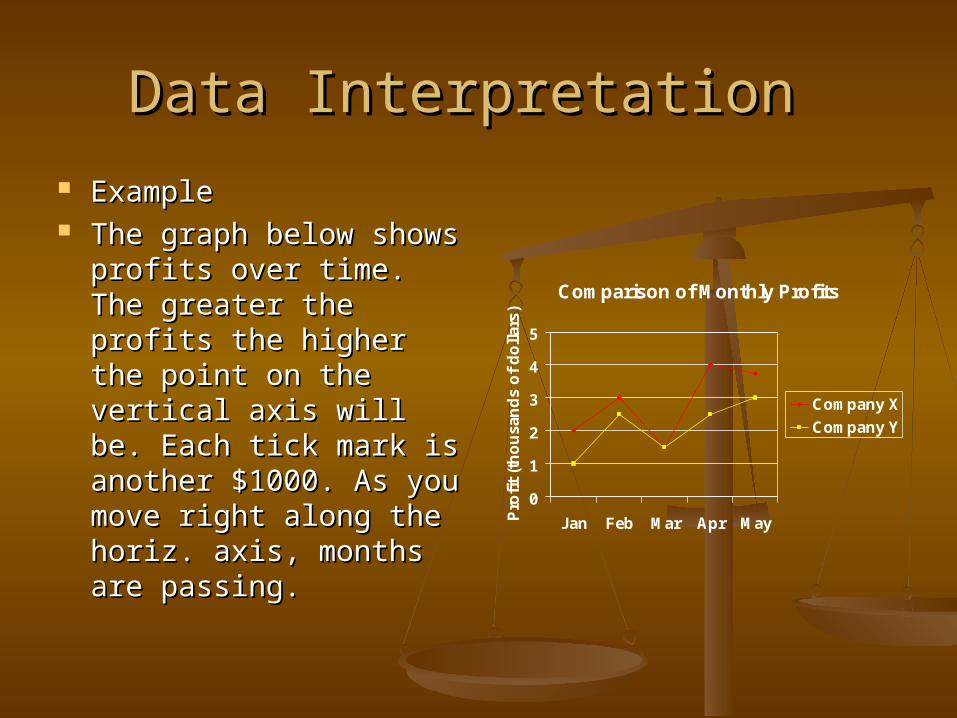
ExampleExample The graph below The graph below
shows profits over shows profits over time. The greater the time. The greater the profits the higher the profits the higher the point on the vertical point on the vertical axis will be. Each tick axis will be. Each tick mark is another mark is another $1000. As you move $1000. As you move right along the horiz. right along the horiz. axis, months are axis, months are passing.passing.
Comparison of Monthly Profits
0
1
2
3
4
5
Jan Feb Mar Apr MayPro
fit
(th
ou
san
ds
of
do
llar
s)
Company X
Company Y
Data InterpretationData Interpretation
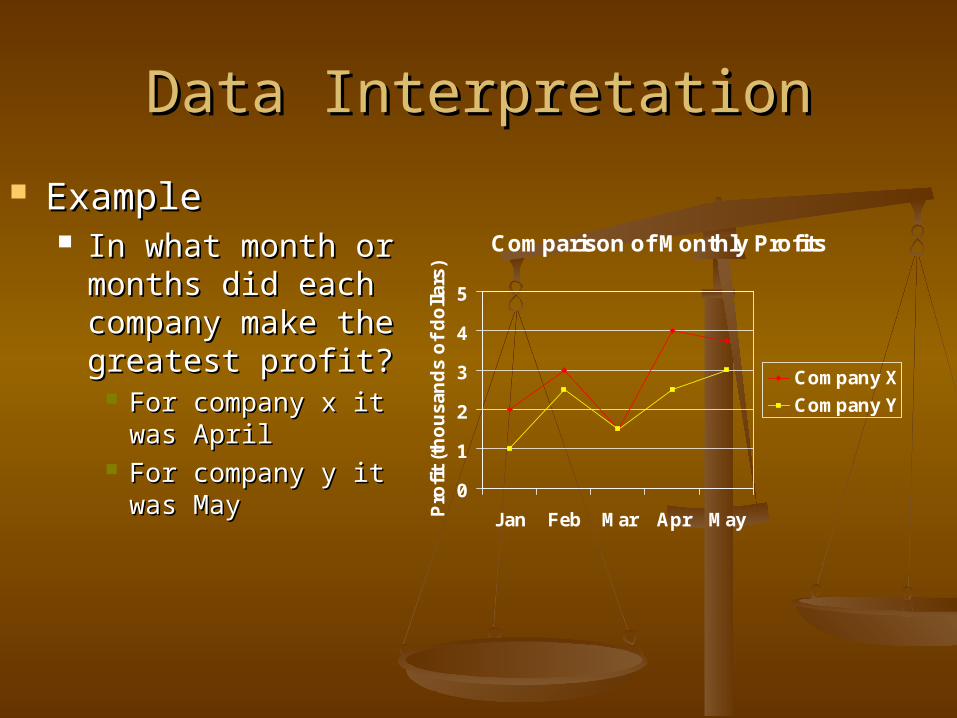
ExampleExample In what month or In what month or
months did each months did each company make the company make the greatest profit?greatest profit?
For company x it For company x it was Aprilwas April
For company y it For company y it was Maywas May
Comparison of Monthly Profits
0
1
2
3
4
5
Jan Feb Mar Apr MayPro
fit
(th
ou
san
ds
of
do
llar
s)
Company X
Company Y
Data InterpretationData Interpretation ExampleExample
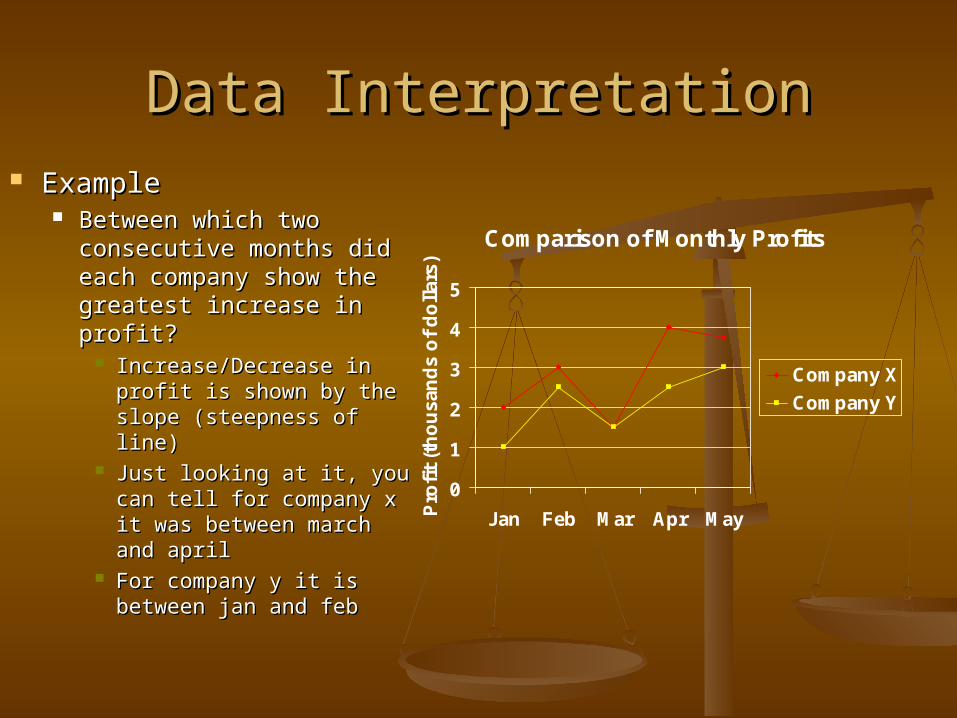
Between which two Between which two consecutive months did consecutive months did each company show the each company show the greatest increase in greatest increase in profit?profit?
Increase/Decrease in Increase/Decrease in profit is shown by the profit is shown by the slope (steepness of line)slope (steepness of line)
Just looking at it, you can Just looking at it, you can tell for company x it was tell for company x it was between march and aprilbetween march and april
For company y it is For company y it is between jan and febbetween jan and feb
Comparison of Monthly Profits
0
1
2
3
4
5
Jan Feb Mar Apr MayPro
fit
(th
ou
san
ds
of
do
llar
s)
Company X
Company Y

Data InterpretationData Interpretation ExampleExample
In what month did In what month did the profits of the 2 the profits of the 2 companies show companies show the greatest the greatest difference?difference?
The point where The point where they are farthest they are farthest apart – so it would apart – so it would be in Aprilbe in April
Comparison of Monthly Profits
0
1
2
3
4
5
Jan Feb Mar Apr MayPro
fit
(th
ou
san
ds
of
do
llar
s)
Company X
Company Y
Data InterpretationData Interpretation ExampleExample
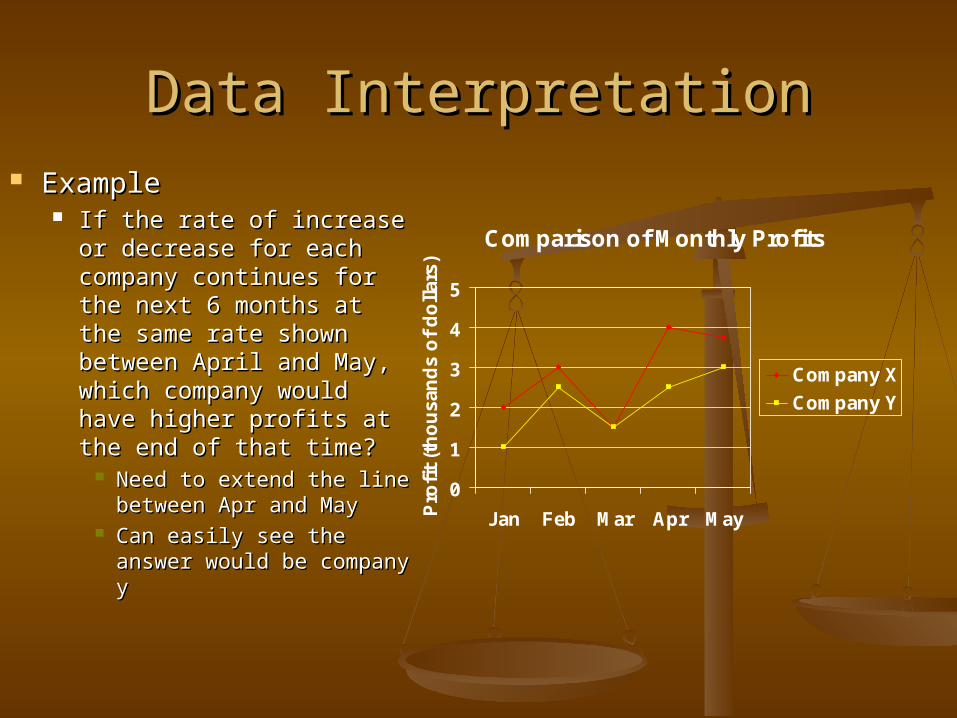
If the rate of increase or If the rate of increase or decrease for each decrease for each company continues for company continues for the next 6 months at the the next 6 months at the same rate shown same rate shown between April and May, between April and May, which company would which company would have higher profits at have higher profits at the end of that time?the end of that time?
Need to extend the line Need to extend the line between Apr and Maybetween Apr and May
Can easily see the Can easily see the answer would be answer would be company ycompany y
Comparison of Monthly Profits
0
1
2
3
4
5
Jan Feb Mar Apr MayPro
fit
(th
ou
san
ds
of
do
llar
s)
Company X
Company Y
StatisticsStatistics
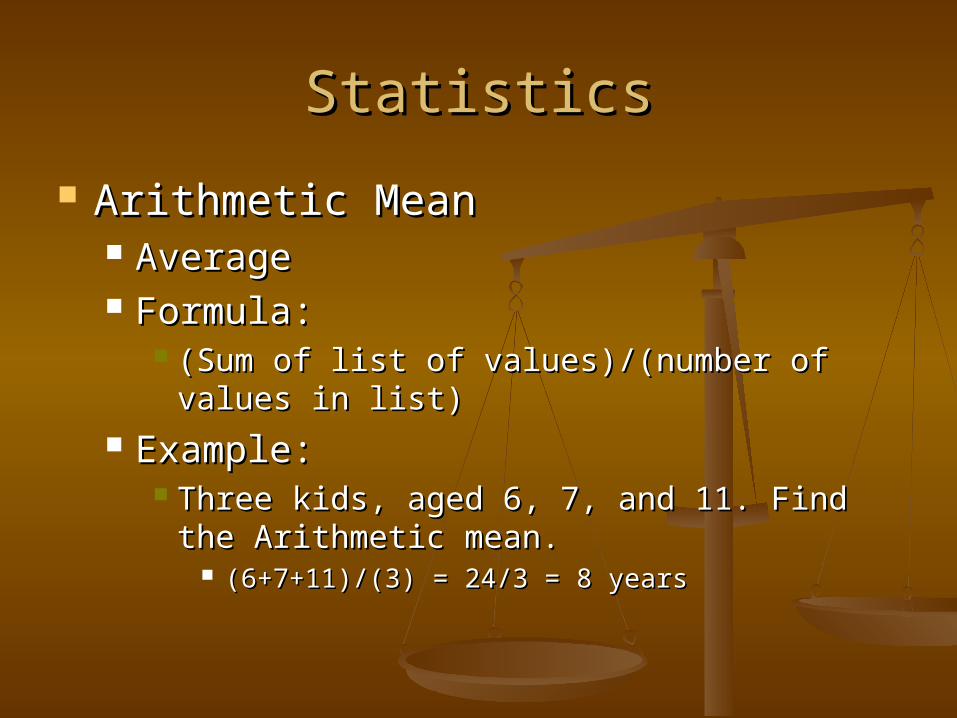
Arithmetic MeanArithmetic Mean AverageAverage Formula:Formula:
(Sum of list of values)/(number of values in (Sum of list of values)/(number of values in list)list)
Example:Example: Three kids, aged 6, 7, and 11. Find the Three kids, aged 6, 7, and 11. Find the
Arithmetic mean.Arithmetic mean. (6+7+11)/(3) = 24/3 = 8 years(6+7+11)/(3) = 24/3 = 8 years
StatisticsStatistics
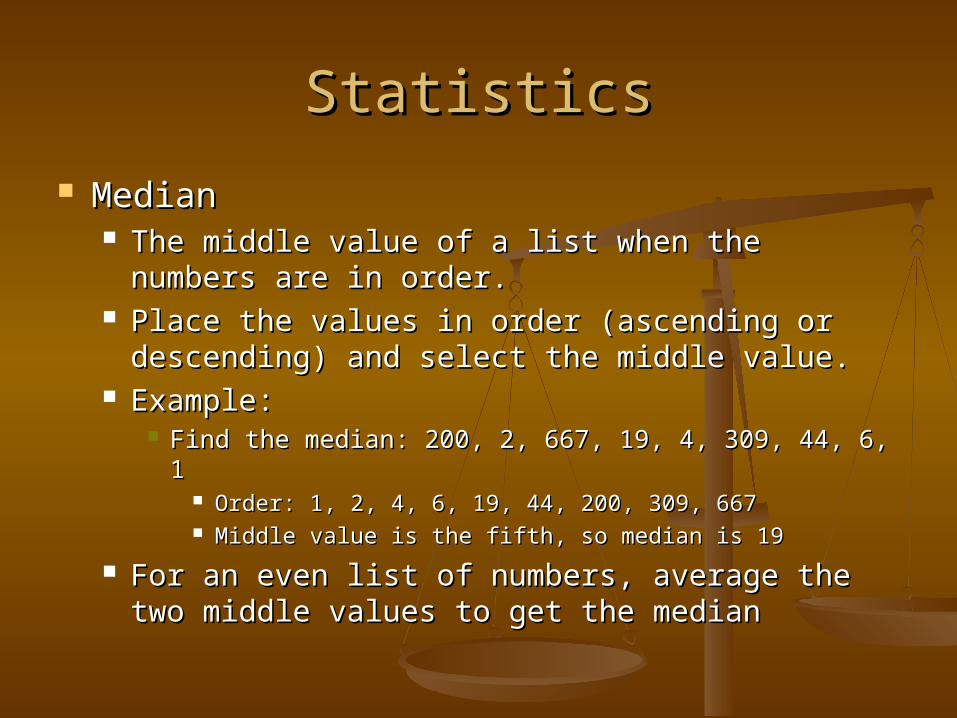
MedianMedian The middle value of a list when the numbers The middle value of a list when the numbers
are in order.are in order. Place the values in order (ascending or Place the values in order (ascending or
descending) and select the middle value.descending) and select the middle value. Example:Example:
Find the median: 200, 2, 667, 19, 4, 309, 44, 6, 1Find the median: 200, 2, 667, 19, 4, 309, 44, 6, 1 Order: 1, 2, 4, 6, 19, 44, 200, 309, 667Order: 1, 2, 4, 6, 19, 44, 200, 309, 667 Middle value is the fifth, so median is 19 Middle value is the fifth, so median is 19
For an even list of numbers, average the two For an even list of numbers, average the two middle values to get the medianmiddle values to get the median
StatisticsStatistics
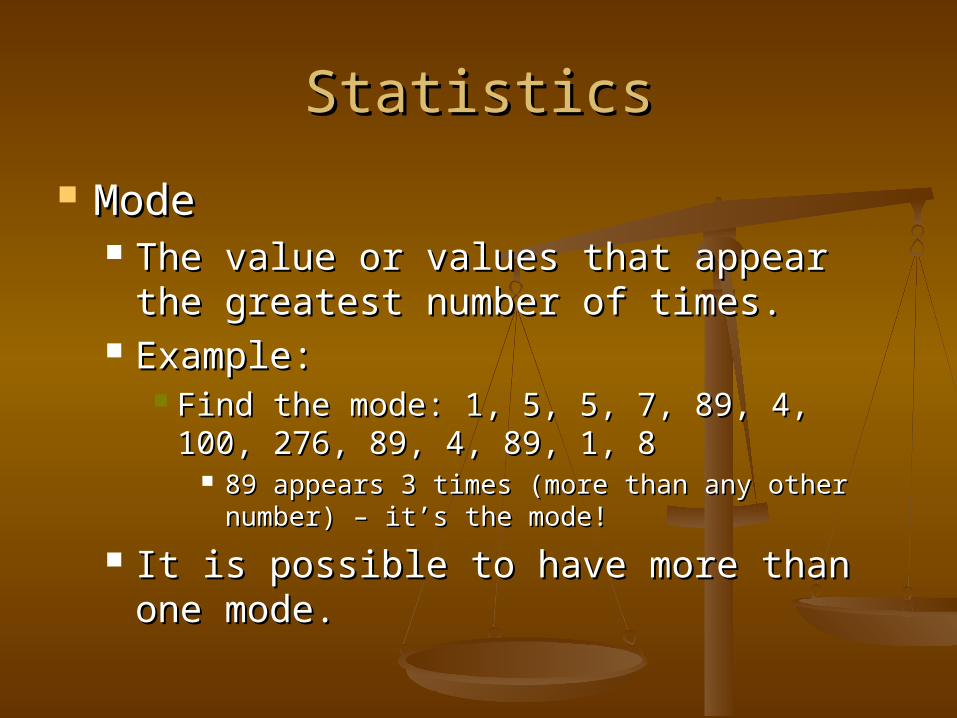
ModeMode The value or values that appear the The value or values that appear the
greatest number of times.greatest number of times. Example: Example:
Find the mode: 1, 5, 5, 7, 89, 4, 100, 276, Find the mode: 1, 5, 5, 7, 89, 4, 100, 276, 89, 4, 89, 1, 889, 4, 89, 1, 8
89 appears 3 times (more than any other number) 89 appears 3 times (more than any other number) – it’s the mode!– it’s the mode!
It is possible to have more than one It is possible to have more than one mode.mode.
StatisticsStatistics
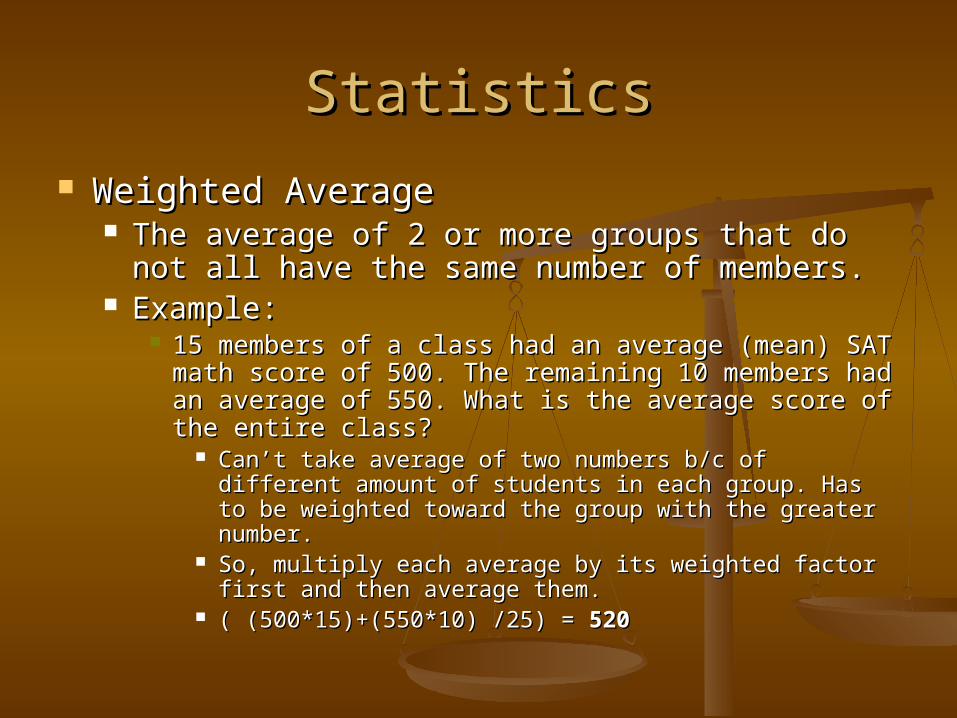
Weighted AverageWeighted Average The average of 2 or more groups that do not all The average of 2 or more groups that do not all
have the same number of members. have the same number of members. Example:Example:
15 members of a class had an average (mean) SAT 15 members of a class had an average (mean) SAT math score of 500. The remaining 10 members had math score of 500. The remaining 10 members had an average of 550. What is the average score of the an average of 550. What is the average score of the entire class?entire class?
Can’t take average of two numbers b/c of different Can’t take average of two numbers b/c of different amount of students in each group. Has to be weighted amount of students in each group. Has to be weighted toward the group with the greater number.toward the group with the greater number.
So, multiply each average by its weighted factor first So, multiply each average by its weighted factor first and then average them. and then average them.
( (500*15)+(550*10) /25) = ( (500*15)+(550*10) /25) = 520520

StatisticsStatistics
Average of Algebraic ExpressionsAverage of Algebraic Expressions Average same way as other values.Average same way as other values. Example:Example:
What is the average (mean) of 3x+1 and x-What is the average (mean) of 3x+1 and x-3?3?
Find the sum of the expressions and divide Find the sum of the expressions and divide by the number of expressions:by the number of expressions:
( (3x+1)+(x-3) )/2 = (4x-2)/2 = 2x-1( (3x+1)+(x-3) )/2 = (4x-2)/2 = 2x-1
StatisticsStatistics
Using Averages to Find Missing NumbersUsing Averages to Find Missing Numbers You can use simple algebra in basic average You can use simple algebra in basic average
formulas to find missing values when the formulas to find missing values when the average is given:average is given:
Basic Average formula:Basic Average formula: (sum of a list of values)/(number of values in the (sum of a list of values)/(number of values in the
list)=averagelist)=average If you have the average and the number of If you have the average and the number of
values, you can figure out the sum of the values:values, you can figure out the sum of the values: Average*number of values=sum of valuesAverage*number of values=sum of values

StatisticsStatistics
ExampleExample The average (mean) of a list of 10 The average (mean) of a list of 10
numbers is 15. if one of the numbers is numbers is 15. if one of the numbers is removed, the average of the remaining removed, the average of the remaining numbers is 14. what is the number that numbers is 14. what is the number that was removed?was removed?
You can figure out the sum of all the values: You can figure out the sum of all the values: 15*10=15015*10=150
Sum of values for one removed: 14*9=126Sum of values for one removed: 14*9=126 The difference between the 2 sums will give The difference between the 2 sums will give
you the missing number. 150-126=24.you the missing number. 150-126=24.

ProbabilityProbability
Some questions will involve elementary Some questions will involve elementary probability.probability.
Example:Example: Find the probability of choosing an even number Find the probability of choosing an even number
at random from the set: {6, 13, 5, 7, 2, 9}at random from the set: {6, 13, 5, 7, 2, 9} There are 6 numbers total and only 2 even numbers, so There are 6 numbers total and only 2 even numbers, so
the probability would be 2/6 = 1/3the probability would be 2/6 = 1/3 Remember, the probability of an event is a Remember, the probability of an event is a
number between 0 and 1, inclusive. If an number between 0 and 1, inclusive. If an event is certain, it has probability of 1. If an event is certain, it has probability of 1. If an event is impossible (cannot occur) the event is impossible (cannot occur) the probability is 0. probability is 0.
ProbabilityProbability Independent/Dependent EventsIndependent/Dependent Events
Two events are independent if the outcome of Two events are independent if the outcome of either event has no effect on the other. (Toss a either event has no effect on the other. (Toss a penny and it has ½ landing on heads and then penny and it has ½ landing on heads and then toss a nickel and it has ½ prob of landing on toss a nickel and it has ½ prob of landing on heads).heads).
To find the probability of 2 or more ind. events occurring To find the probability of 2 or more ind. events occurring together, you multiply the different probabilities together, you multiply the different probabilities together. (1/2 * ½)= ¼together. (1/2 * ½)= ¼
If the outcome of one event affects the probability If the outcome of one event affects the probability of another event, they are dependent events. You of another event, they are dependent events. You must use logical reasoning to help figure out must use logical reasoning to help figure out probabilities involving dependent events.probabilities involving dependent events.
So the penny landing on heads is ½ but of it then landing So the penny landing on heads is ½ but of it then landing on tails is 0 (can’t land on tails at the same time)on tails is 0 (can’t land on tails at the same time)

ProbabilityProbability ExampleExample
On Monday, Anderson High School’s basketball team will On Monday, Anderson High School’s basketball team will play the team from Baker High School. On Wednesday, play the team from Baker High School. On Wednesday, Baker’s team will play the team from Cole High School. Baker’s team will play the team from Cole High School. On Friday, Cole will play Anderson. In each game, either On Friday, Cole will play Anderson. In each game, either team has a 50 percent chance of winning. A) What is the team has a 50 percent chance of winning. A) What is the probability that Anderson will win both its games? B) probability that Anderson will win both its games? B) What is the probability that Baker will lose both its What is the probability that Baker will lose both its games? C) What is the probability that Anderson will win games? C) What is the probability that Anderson will win both its games and Baker will lose both its games?both its games and Baker will lose both its games?
A) Anderson has ½ prob of winning 1A) Anderson has ½ prob of winning 1stst game and also 2 game and also 2ndnd game. Ind events. So just multiply: ½ * ½ = ¼game. Ind events. So just multiply: ½ * ½ = ¼
B) Baker has ½ prob of losing 1B) Baker has ½ prob of losing 1stst game and also 2 game and also 2ndnd game. game. Ind events. So just multiply: ½ * ½ = ¼ Ind events. So just multiply: ½ * ½ = ¼
C) For Anderson to win both games and Baker to lose both, C) For Anderson to win both games and Baker to lose both, three games must be played out: And beats Baker, Cole three games must be played out: And beats Baker, Cole beats Baker, And beats Cole. Each game has ½ prob, and beats Baker, And beats Cole. Each game has ½ prob, and ind. So just multiply all together: ½ * ½ * ½ = 1/8ind. So just multiply all together: ½ * ½ * ½ = 1/8
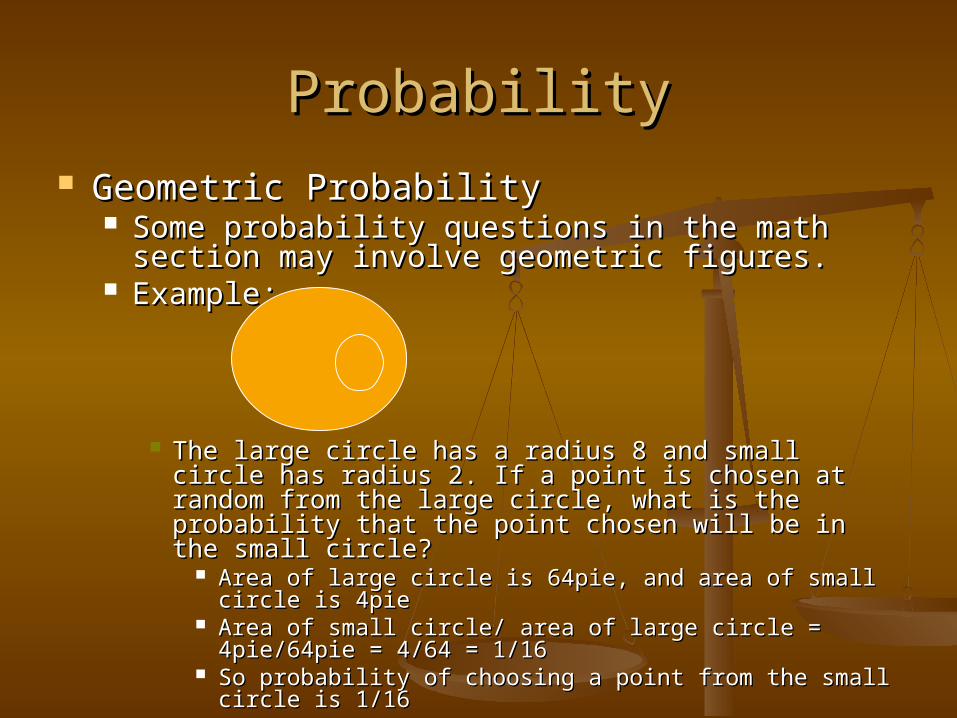
ProbabilityProbability Geometric ProbabilityGeometric Probability
Some probability questions in the math section Some probability questions in the math section may involve geometric figures. may involve geometric figures.
Example:Example:
The large circle has a radius 8 and small circle has The large circle has a radius 8 and small circle has radius 2. If a point is chosen at random from the large radius 2. If a point is chosen at random from the large circle, what is the probability that the point chosen circle, what is the probability that the point chosen will be in the small circle?will be in the small circle?
Area of large circle is 64pie, and area of small circle is Area of large circle is 64pie, and area of small circle is 4pie4pie
Area of small circle/ area of large circle = 4pie/64pie = Area of small circle/ area of large circle = 4pie/64pie = 4/64 = 1/164/64 = 1/16
So probability of choosing a point from the small circle So probability of choosing a point from the small circle is 1/16is 1/16