mathematical concepts in the insurance...
TRANSCRIPT

Mathematical Concepts in the Insurance Industry
Felix Rosenbaum, Risk Management,
SCIPP Seminar April 2011

Felix Rosenbaum | Risk Management | Seminar April 2011 2
Table of Contents / Agenda
n Introduction to Swiss Re
n Insurance Math
n Nat Cat Modelling
n Natural Catastrophes on the rise?
Felix Rosenbaum | Risk Management | Seminar April 2011
Introduction to Swiss Re
3

Felix Rosenbaum | Risk Management | Seminar April 2011
n Re-Insurance Company
n Founded 19th December 1863
n 2010 Premiums earned: 19'652 Million USD
n 2010 net income: 863 Million USD
n Combined Ratio: P&C 93.9% and L&H 88.7%
n Number of employees: 10'362
4
Swiss Re

Felix Rosenbaum | Risk Management | Seminar April 2011
Insurance Math n An introduction
5

Felix Rosenbaum | Risk Management | Seminar April 2011
How much would you charge to insure your friends car?
n Simple questions: How often per year does he have an accident? (=f)
n How much money does it usually cost to repair his car? (=X)
The average loss per year: S = f*X
n You also want to make some money, so add a profit percentage (=p).
Price = f*l*(1+p)
6
Example: Insure your friend's car
Felix Rosenbaum | Risk Management | Seminar April 2011
n That was easy!
n But, how much money do need to keep aside (=reserves) to pay your friend, in case he has an accident?
n If you insure one car only, you will have to have reserves up to the maximum possible loss, in other words, the value of the car.
7
Example: Insure your friend's car

Felix Rosenbaum | Risk Management | Seminar April 2011
n But now we want to insure many cars.
n The yearly loss now is (X is the loss, N the number of losses):
n It is obvious, that S will not be the same for every year, but has a distribution. The challenge is to find distributions for X~F(x) and N~P.
8
More cars...

Felix Rosenbaum | Risk Management | Seminar April 2011
n A often used distribution for the loss is Pareto
9
Loss distribution

Felix Rosenbaum | Risk Management | Seminar April 2011
n The alpha depends on the type of risk.
10
Pareto
loss
alpha = 2
alpha = 1
F(x)

Felix Rosenbaum | Risk Management | Seminar April 2011
n Very commonly used is the Poisson distribution
n Poisson works fine if events are rare and independent.
11
Frequency

Felix Rosenbaum | Risk Management | Seminar April 2011
n We now have a distribution for the loss size and loss number to represent S.
n The aggregated cdf is usually calculated with Monte Carlo methods: - draw the number of losses per year - draw the loss amounts and add them up.
n Ordered by loss amount of the year one can calculate the aggregated CDF.
n The average of these outcomes returns the expected loss.
12
The Result

Felix Rosenbaum | Risk Management | Seminar April 2011 13
Aggregated CDF
Probability
Agg Loss

Felix Rosenbaum | Risk Management | Seminar April 2011
But there is more to think of....
n Long term/short term claims
n Capital costs
n Liquidity
n Profit margin
n Brokerage
n Recovery
n Internal costs
n Taxes
14
More things to consider

Felix Rosenbaum | Risk Management | Seminar April 2011
n How much money do we have to reserve now?
n To hold the MPL for all contracts would be way too expensive!
n Therefore we hold reserves cover two 99% shortfall years:
The shortfall is defined as: shf(S) = <S¦ S>Q(99%)>
n We calculate distribution of the losses versus the capital we hold for the whole Swiss Re group.
n There is a possibility that we go bankrupt! Otherwise we would be way too expensive.
15
And the reserves?

Felix Rosenbaum | Risk Management | Seminar April 2011
n Correlations! For example Pandemic will not only trigger many life insurances, but the stock market will go down, too!
n Avoid surprises! Swiss Re is constantly looking at possible emerging risks as climate change, nano-particles, cell phone radiation etc.
16
Research areas

Felix Rosenbaum | Risk Management | Seminar April 2011
Nat Cat Modelling n Hurricanes
17

Felix Rosenbaum | Risk Management | Seminar April 2011 18
Natural Catastrophes
n Swiss Re develops own models for natural catastrophes.
n This covers models for flood, hail, winter storms, earthquakes, bushfires, and tropical cyclones.
Felix Rosenbaum | Risk Management | Seminar April 2011
Four basic sets of data are needed to be fed into a loss model:
n Hazard: Where, how often and with what intensity do events occur?
n Vulnerability: What is the extent of damage at a given event intensity?
n Value distribution: Where are the various types of insured objects located and how high is their value?
n Insurance conditions: What proportion of the loss is insured?
19
Principles of Nat Cat Modelling

Felix Rosenbaum | Risk Management | Seminar April 2011 20
Natural Catastrophes - Hurricanes
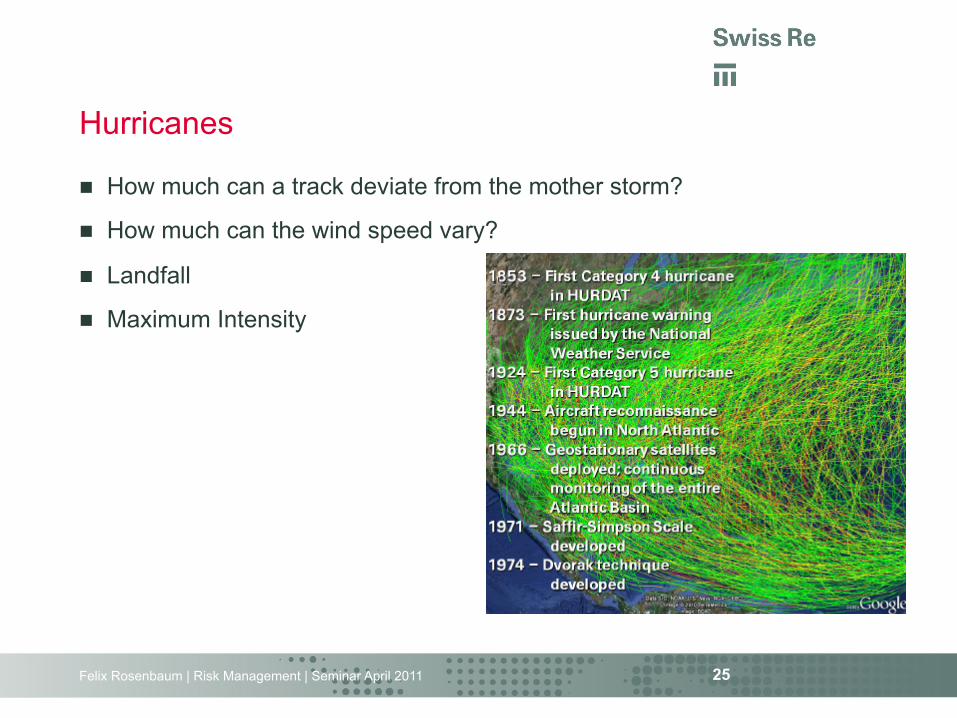
n There is a lot of historical data about hurricanes:
n Data is recorded since 1891 of more than 1'000 hurricanes.

Felix Rosenbaum | Risk Management | Seminar April 2011 21
Natural Catastrophes - Hurricanes
n These historical storms can be used as a basis for hurricane modelling.
n Basic Formula to calculate the loss of hurricane wind speed * vulnerability * insured value * insurance conditions = loss
n These points consist of many sections, for example... - wind speed at a distance x from the storm - construction type - age of building - elevation (storm surge)

Felix Rosenbaum | Risk Management | Seminar April 2011
n The historical storms are not granular enough....
n ... therefore storms have to be invented.
22
Hurricanes

Felix Rosenbaum | Risk Management | Seminar April 2011
n How can you create 'daughter storms'? à Random Walk
23
Hurricanes

Felix Rosenbaum | Risk Management | Seminar April 2011
n Find border conditions to limit the random walk so that the resulting tracks are realistic.
24
Hurricanes
Felix Rosenbaum | Risk Management | Seminar April 2011
n How much can a track deviate from the mother storm?
n How much can the wind speed vary?
n Landfall
n Maximum Intensity
25
Hurricanes

Felix Rosenbaum | Risk Management | Seminar April 2011 26
Hurricanes - LFC

Felix Rosenbaum | Risk Management | Seminar April 2011 27
Hurricanes - LFC

Felix Rosenbaum | Risk Management | Seminar April 2011
Natural Catastrophes on the rise?
28

Felix Rosenbaum | Risk Management | Seminar April 2011 29
Insured catastrophe losses 1970–2010
0
20
40
60
80
100
120
1970 1975 1980 1985 1990 1995 2000 2005Earthquake/tsunami Weather-‐related Nat Cats Man-‐made disasters
USD bn, at 2009 prices
Source: Swiss Re, sigma No 1/2010; 1/2011, Figure 3
2005: Hurricanes
Katrina, Rita, Wilma
2008: Hurricanes Ike,
Gustav
2001: Attack on WTC
1999: Winter storm
Lothar
1992: Hurricane Andrew 1994:
Northridge EQ
2004: Hurricanes Ivan, Charley, Frances
Ocean Drive, FL, 2000
Ocean Drive, FL, 1926
n increased insurance penetration
n more values n more values in high - risk areas n higher vulnerability n climate change (storm,flood)
2009: EQs Chile, New Zealand

Felix Rosenbaum | Risk Management | Seminar April 2011 30
Number of events per year
An event has a loss and victim threshold.

Felix Rosenbaum | Risk Management | Seminar April 2011
31
Number of victims per year

Felix Rosenbaum | Risk Management | Seminar April 2011 32
Natural Catastrophes - Hurricanes

Thank you

Felix Rosenbaum | Risk Management | Seminar April 2011
Legal notice
©2011 Swiss Re. All rights reserved. You are not permitted to create any modifications or derivatives of this presentation or to use it for commercial or other public purposes without the prior written permission of Swiss Re.
Although all the information used was taken from reliable sources, Swiss Re does not accept any responsibility for the accuracy or comprehensiveness of the details given. All liability for the accuracy and completeness thereof or for any damage resulting from the use of the information contained in this presentation is expressly excluded. Under no circumstances shall Swiss Re or its Group companies be liable for any financial and/or consequential loss relating to this presentation.
34