matts valela - finance director etherton mpisaunga ...€¦ · ... finance director . etherton...
TRANSCRIPT
Imara Zimbabwe Investor Conference
Matts Valela - Finance Director Etherton Mpisaunga - Operations Director Meikles Hotel 28 May 2014

1. Delta Corporation Structure 2. Delta & Franchised Brands, Coke Portfolio 3. Market Share 4. Per Capita Consumption Lagers – Africa 5. Lagers Mix and Volume trends 6. Per Capita Consumption Sparkling Beverages– Africa 7. Sparkling Beverages Volumes & Mix 8. Per Capita Consumption Sorghum 9. Sorghum Volumes & Mix 10. Financials 11. Associates 12. The Future
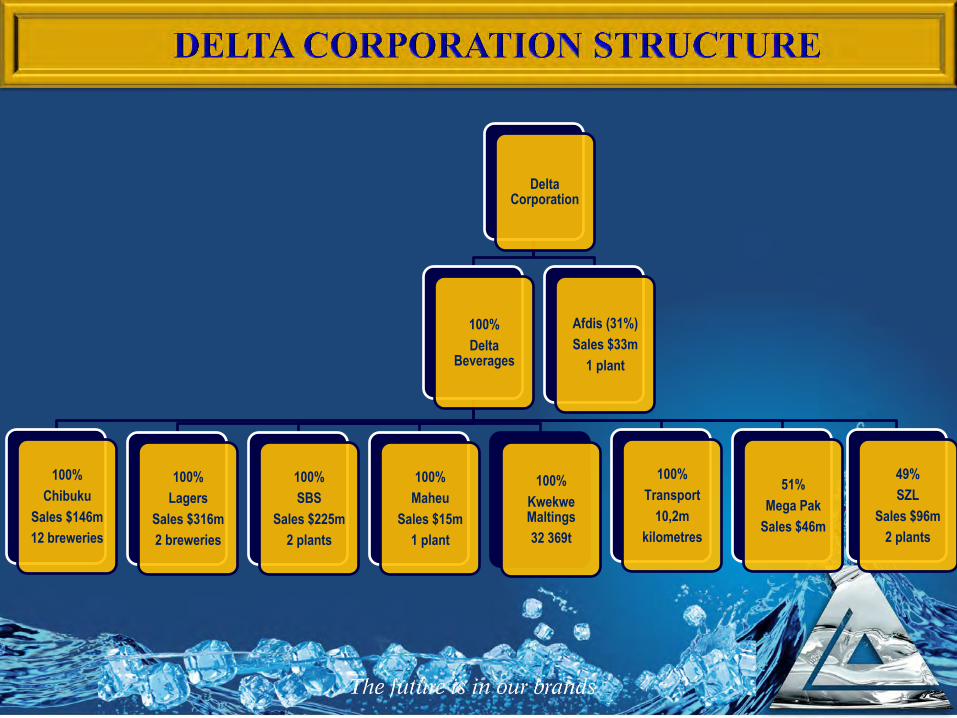
Delta Corporation
100%
Delta Beverages
100%
Chibuku
Sales $146m
12 breweries
100%
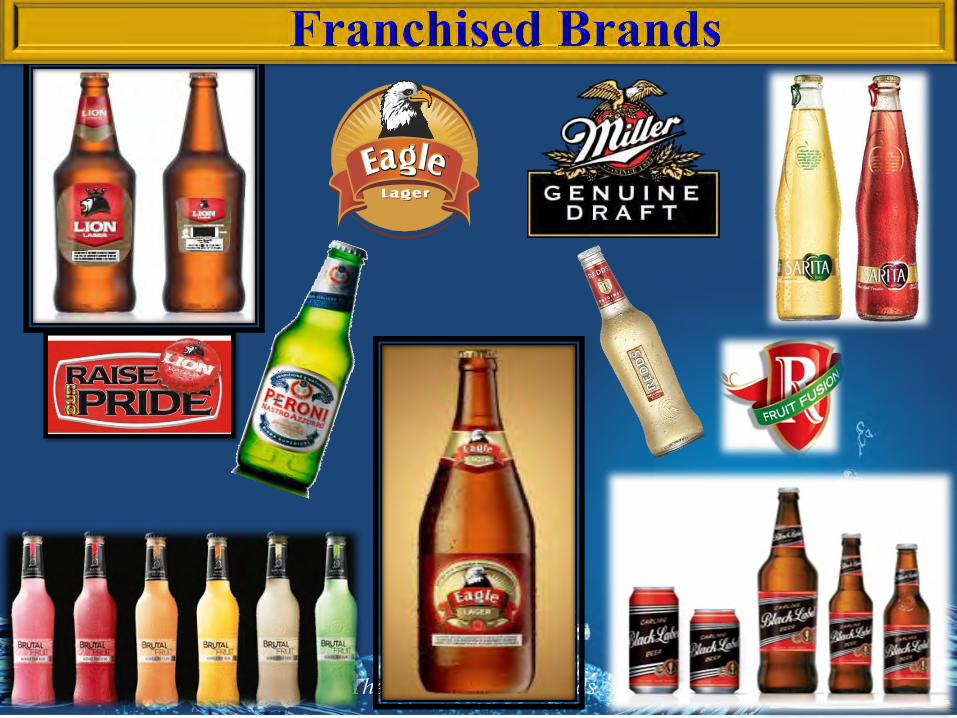
Lagers
Sales $316m
2 breweries
100%
SBS
Sales $225m
2 plants
100%
Maheu
Sales $15m
1 plant
100%
Kwekwe Maltings
32 369t
100%
Transport
10,2m
kilometres
51%
Mega Pak
Sales $46m
49%
SZL
Sales $96m
2 plants
Afdis (31%)
Sales $33m
1 plant

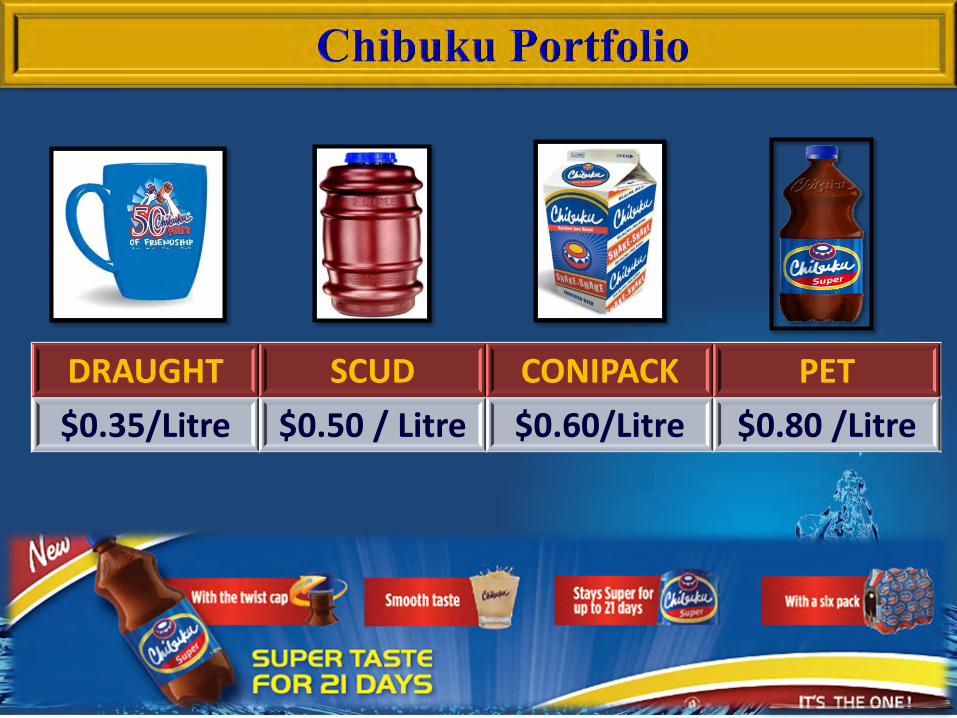
DRAUGHT SCUD CONIPACK PET
$0.35/Litre $0.50 / Litre $0.60/Litre $0.80 /Litre
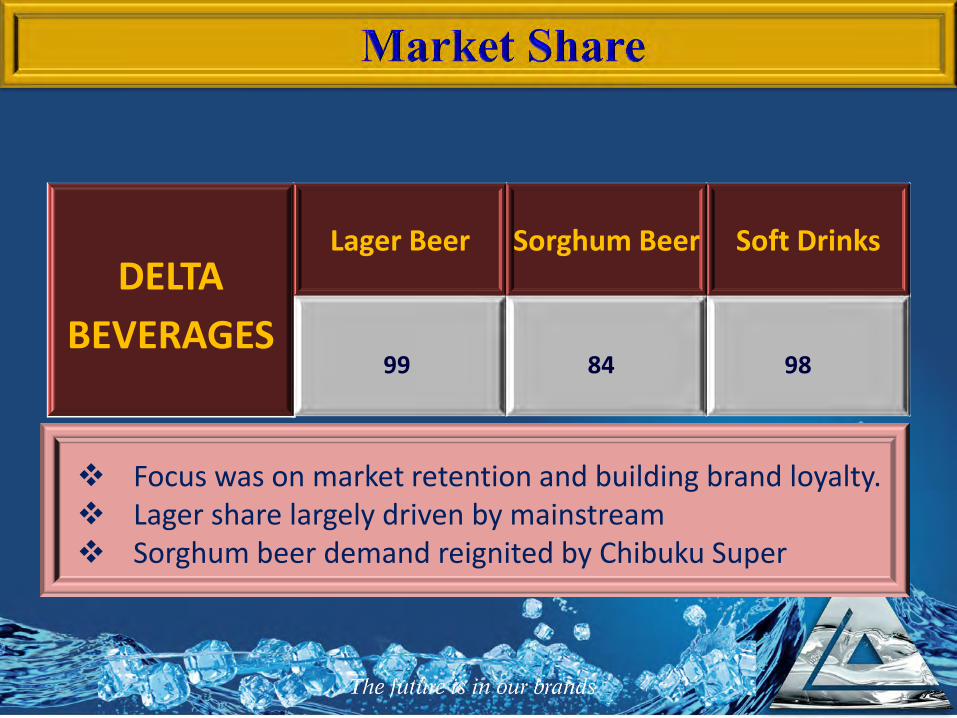
MARKET SHARE
Focus was on market retention and building brand loyalty. Lager share largely driven by mainstream Sorghum beer demand reignited by Chibuku Super
DELTA
BEVERAGES
Lager Beer Sorghum Beer Soft Drinks
99
84
98

To focus on Value Creation through strengthening our Commercial Leadership in the long term by:
i. Deploying brands across price segments ii. Regular big hit innovations iii. Continuous improvement of brand health iv. In-trade captaincy to grow market size and
profit pools v. Investment in commercial capability of sales
force.
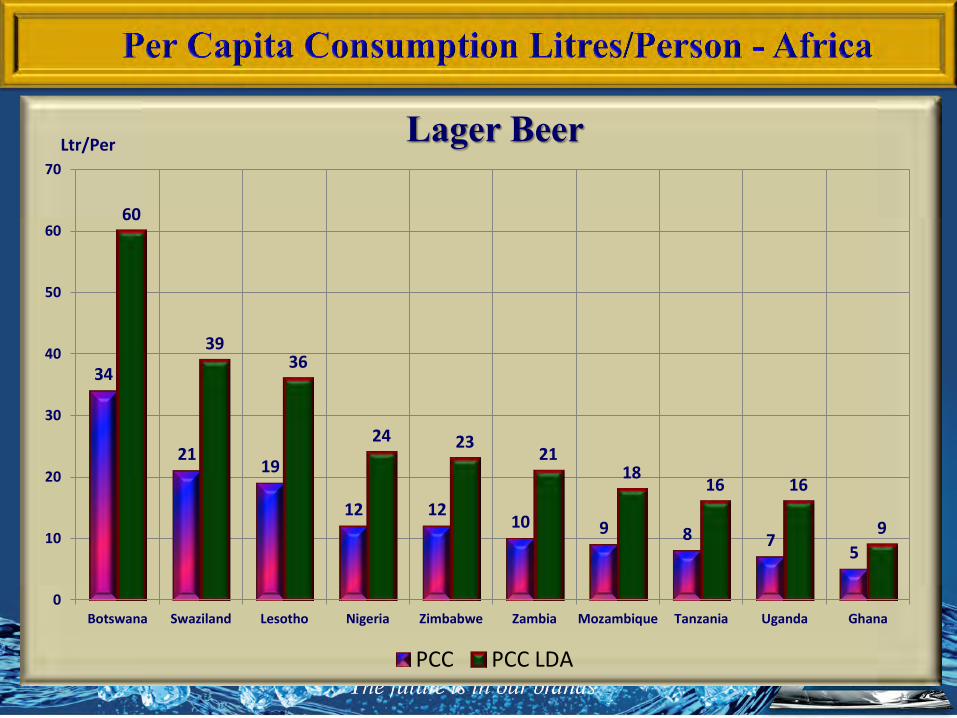
34
21 19
12 12 10 9 8 7
5
60
39 36
24 23 21
18 16 16
9
0
10
20
30
40
50
60
70
Botswana Swaziland Lesotho Nigeria Zimbabwe Zambia Mozambique Tanzania Uganda Ghana
Lager Beer
PCC PCC LDA
Ltr/Per

0
500
1 000
1 500
2 000
2 500
F10 F11 F12 F13 F14
1 148
1 608
1 981 2 060
1 697
HLs ‘000
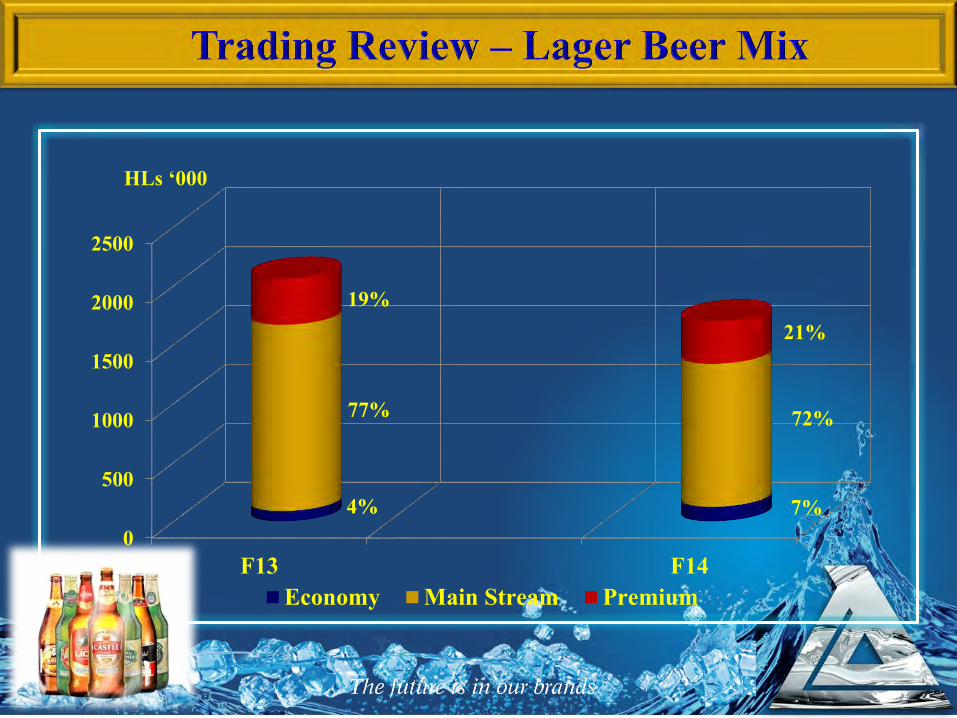
0
500
1000
1500
2000
2500
F13 F14
4% 7%
77% 72%
19% 21%
Economy Main Stream Premium
HLs ‘000

0
10
20
30
40
50
60
70 62 60
42
34
19 16 15 14
9 6
Soft Drinks Ltr/Per
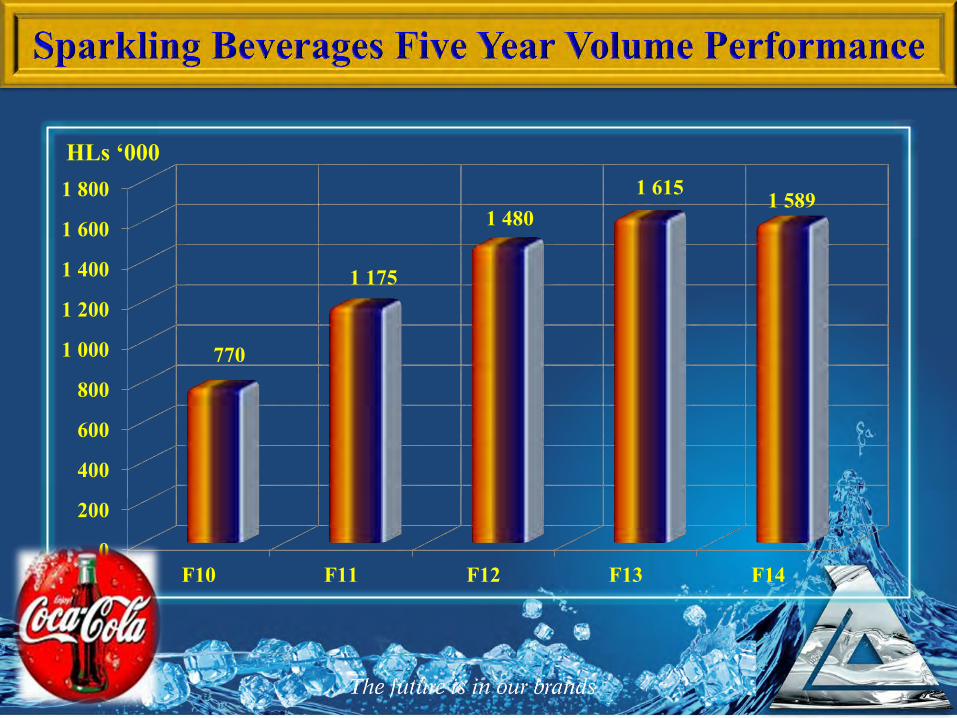
0
200
400
600
800
1 000
1 200
1 400
1 600
1 800
F10 F11 F12 F13 F14
770
1 175
1 480 1 615 1 589
HLs ‘000
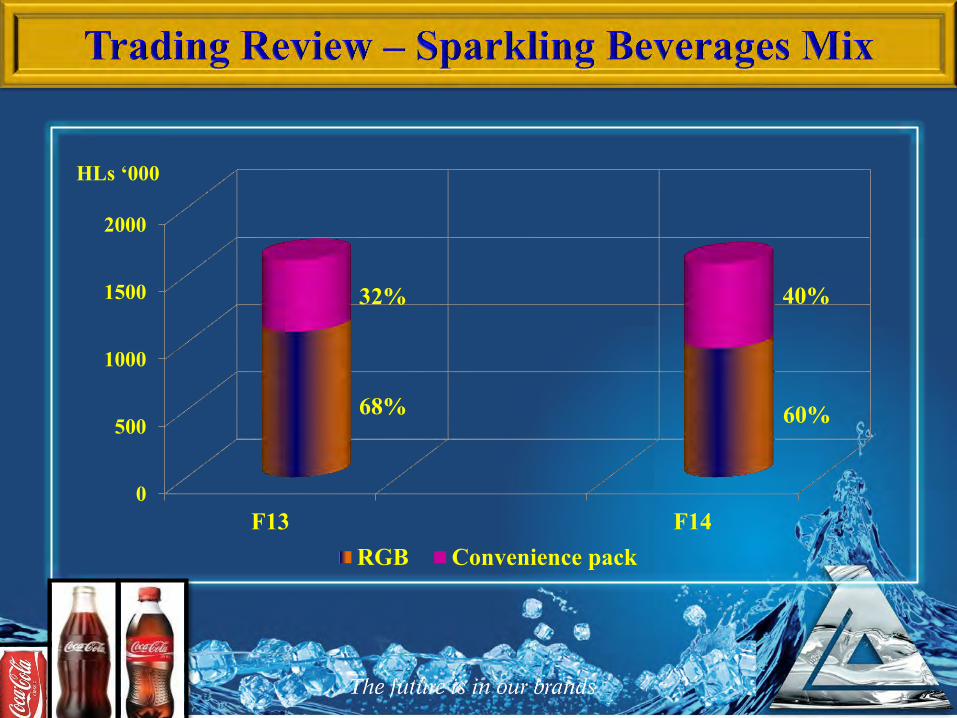
0
500
1000
1500
2000
F13 F14
68% 60%
32% 40%
RGB Convenience pack
HLs ‘000
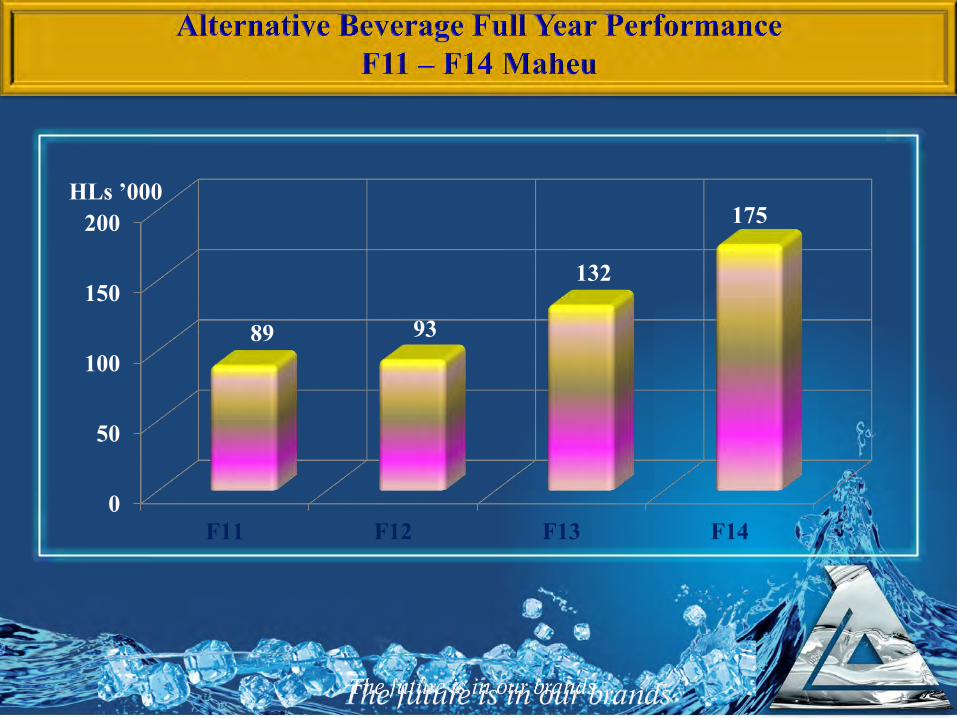
0
50
100
150
200
F11 F12 F13 F14
89 93
132
175 HLs ’000

0
10
20
30
40
50
60
70
Botswana Zimbabwe Zambia Mozambique
38
30
25
0
66
57 55
0
PCC PCC LDA
Ltr/Per

HLs ‘000
1 200
1 700
2 200
2 700
3 200
3 700
F10 F11 F12 F13 F14
3 114 2 908
3 354
3 080
3 442
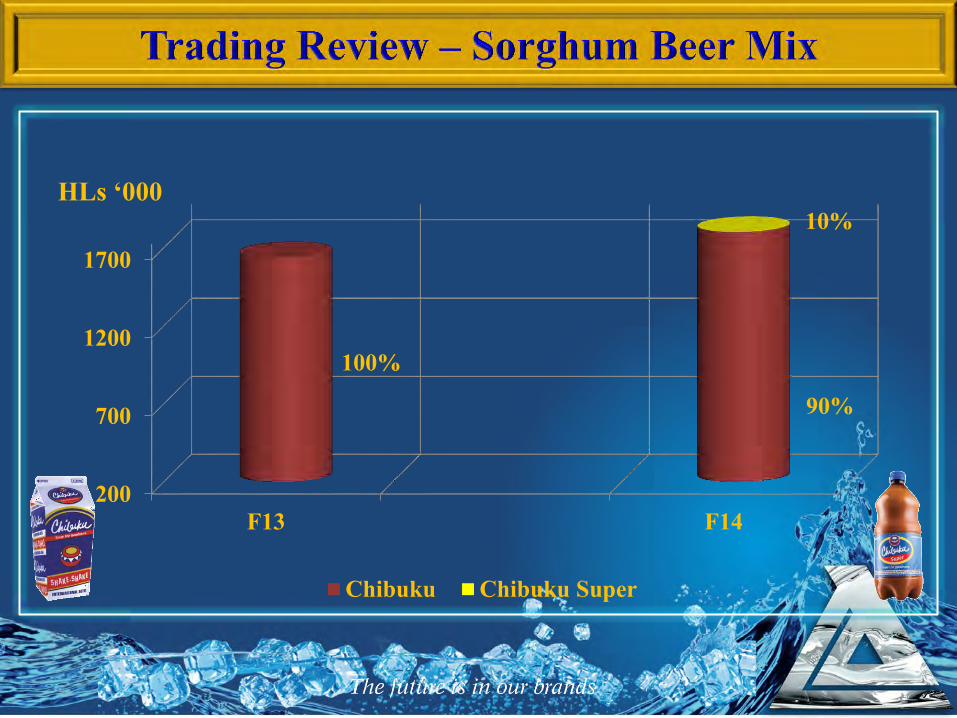
200
700
1200
1700
F13 F14
100%
90%
10%
Chibuku Chibuku Super
HLs ‘000
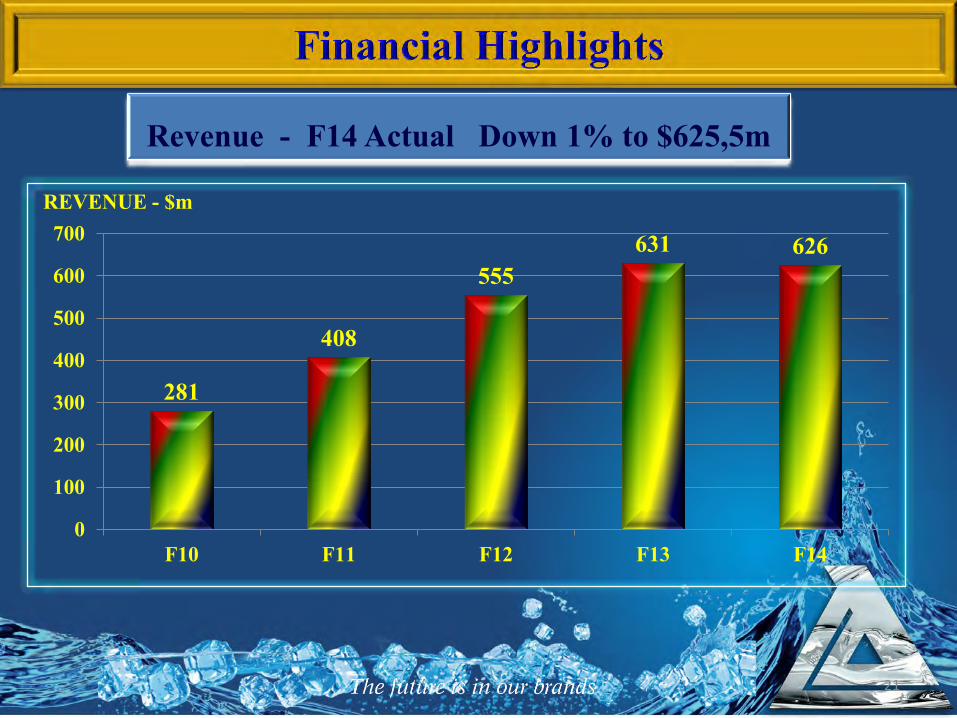
281
408
555 631 626
0
100
200
300
400
500
600
700
F10 F11 F12 F13 F14
REVENUE - $m
Revenue - F14 Actual Down 1% to $625,5m
21
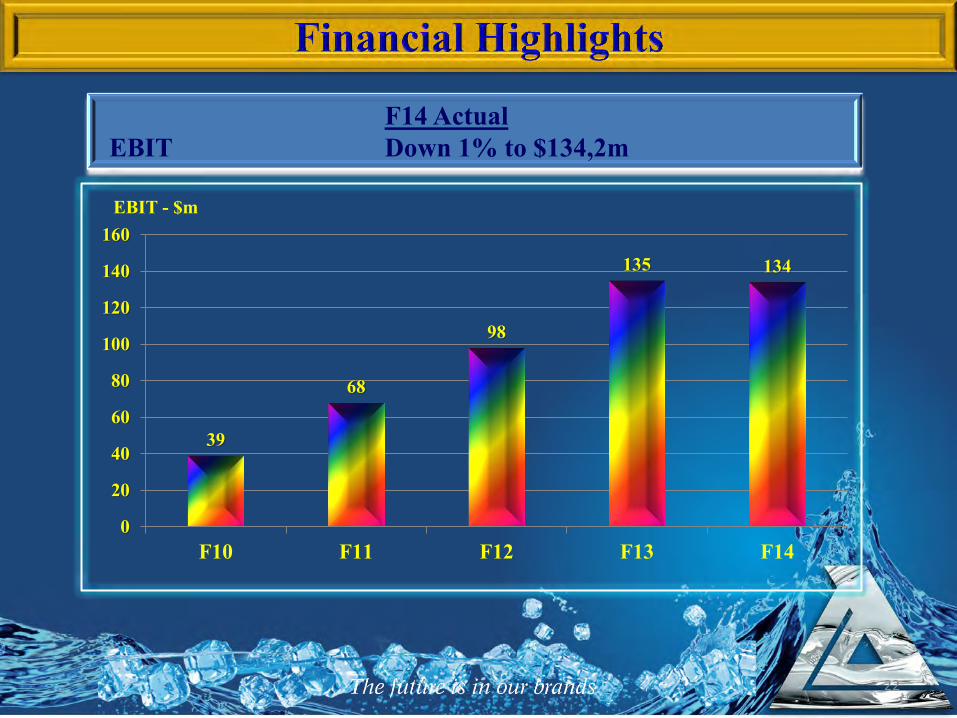
39
68
98
135 134
0
20
40
60
80
100
120
140
160
F10 F11 F12 F13 F14
EBIT - $m
22
F14 Actual EBIT Down 1% to $134,2m
0
5
10
15
20
25
F10 F11 F12 F13 F14
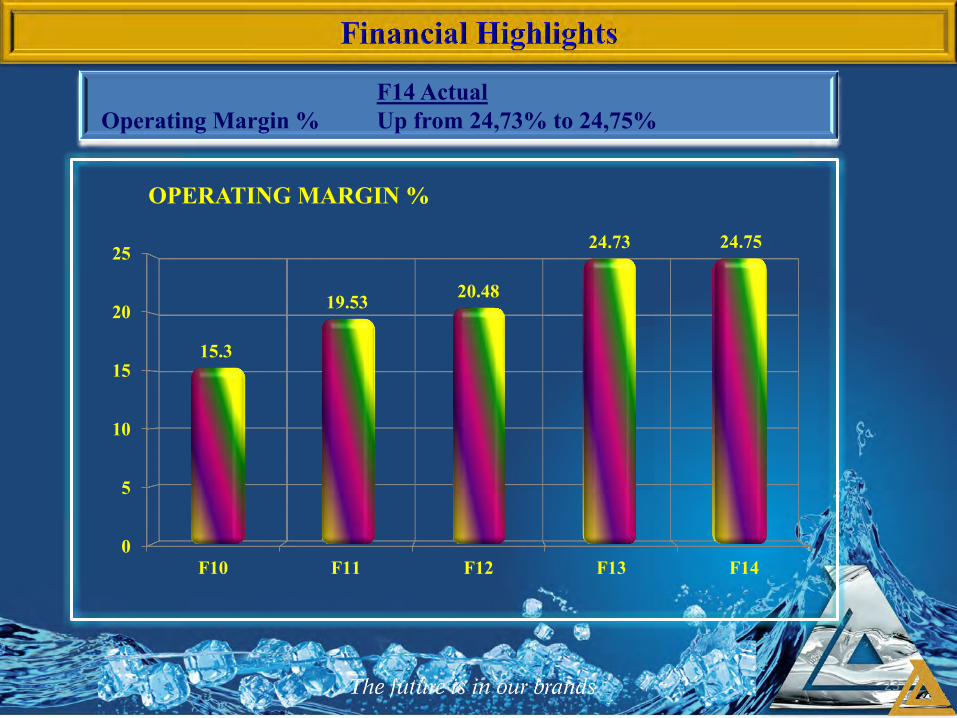
15.3
19.53 20.48
24.73 24.75
OPERATING MARGIN %
23
F14 Actual Operating Margin % Up from 24,73% to 24,75%

0
20
40
60
80
100
120
140
160
180
F10 F11 F12 F13 F14
49
82
119
162 165
EBITDA - $m
F14 Actual EBITDA Up 2% to $165,3m
24

Challenges • Politics • Utilities :- Water, road network,
electricity • Labour law reform • Liquidity/disposable income

Opportunities • Deflation/Price Correction – Consumer Disposable
Income • Lobby for Excise reduction • Country Debt/Funding management • Mining FDI / Employment levels • Agriculture • Infrastructure Spend • Expand & Innovate the Beverage portfolio • Margin expansion and cash
