maximizing performances of variable tilt flat-plate solar collectors for belgrade (serbia)
TRANSCRIPT
Maximizing performances of variable tilt flat-plate solar collectors forBelgrade (Serbia)Jasmina Skerlić, Jasna Radulović, Danijela Nikolić, and Milorad Bojić Citation: J. Renewable Sustainable Energy 5, 041820 (2013); doi: 10.1063/1.4819254 View online: http://dx.doi.org/10.1063/1.4819254 View Table of Contents: http://jrse.aip.org/resource/1/JRSEBH/v5/i4 Published by the AIP Publishing LLC. Additional information on J. Renewable Sustainable EnergyJournal Homepage: http://jrse.aip.org/ Journal Information: http://jrse.aip.org/about/about_the_journal Top downloads: http://jrse.aip.org/features/most_downloaded Information for Authors: http://jrse.aip.org/authors
Downloaded 26 Aug 2013 to 35.8.11.2. This article is copyrighted as indicated in the abstract. Reuse of AIP content is subject to the terms at: http://jrse.aip.org/about/rights_and_permissions
Maximizing performances of variable tilt flat-plate solarcollectors for Belgrade (Serbia)
Jasmina Skerlic, Jasna Radulovic,a) Danijela Nikolic, and Milorad BojicFaculty of Engineering, University of Kragujevac, Sestre Janjic 6, 34000 Kragujevac,Serbia
(Received 28 January 2013; accepted 12 August 2013; published online 21 August 2013)
In Serbia, for heating of domestic hot water (DHW) it is customary to use
electricity. As around 70% of electricity is produced by using low quality coal with
high greenhouse emission, it is beneficial to environment to use solar energy by
flat-plate solar collectors for heating of DHW in a solar DHW system (SDHWS).
The SDHWS with variable tilt flat-plate solar collectors placed in north-south
direction at roofs of houses are investigated for their optimal operation in
Belgrade, Serbia. The investigated variable-tilt collectors annually take 2 tilts, 4
tilts, and 12 tilts. The used weather data are from the meteorological station. These
investigations use three computer codes: EnergyPlus, GenOpt, and Hooke-Jeeves
search algorithm. For different solar collectors, the investigations revile their
optimum tilts that maximize the solar fraction by the SDHWS. Then, the solar
fraction and avoided fossil energy by the SDHWS are maximized. In addition, the
deficit in the solar fraction is estimated when the solar collectors are not at their
optimum tilt. VC 2013 AIP Publishing LLC. [http://dx.doi.org/10.1063/1.4819254]
I. INTRODUCTION
During the first years of the twenty-first century, extensive efforts have been undertaken to
alleviate global warming of the earth caused by emission of CO2 in atmosphere. These emis-
sions are generated by intensive burning of fossil fuels to satisfy the growing energy needs of
humanity. The emissions may be mitigated when, instead by fossil fuels, the part of energy
needs is satisfied by using non-polluting energy sources such as solar energy. Also, another im-
portant advantage of the usage of solar energy is that it does not pollute the environment with
nitrogen oxides and sulfur dioxide.
In Serbian households, the high amount of domestic hot water (DHW) is used for shower,
tap, cloths-washing, and dish-washing. It is customary to use electricity for heating of DHW.
As around 70% of electricity is produced by using low quality coal with high greenhouse emis-
sion, it is important and the most rewarding to use solar energy for DHW heating instead of
electricity. Accordingly, in Serbia and worldwide, the most rewarding application of solar
energy is that it replaces electricity for heating of DHW in households.1 In addition it is impor-
tant to have a high efficiency of conversion of solar energy to heat. Then, the highest amount
of avoided electricity and avoided fossil energy may be expected.
During its operation, the solar collector in some solar DHW system (SDHWS) has to take
the optimal position to generate the highest amount of heat. The solar collector takes the north-
south direction. Usually, the solar collector with only one optimal tilt during the year is used in
practice, which is called stationary solar collector. Here, the variable tilt flat-plate solar collec-
tors are investigated to enhance performance of stationary solar collectors. The investigated so-
lar collectors are SC#2 (solar collector annually taking 2 tilts), SC#4 (solar collector annually
taking 4 tilts), and SC#12 (solar collector annually taking 12 tilts). These tilts should be
a)Author to whom correspondence should be addressed. Electronic mail: [email protected]. Tel.: þ381-69-844-96-25.
1941-7012/2013/5(4)/041820/15/$30.00 VC 2013 AIP Publishing LLC5, 041820-1
JOURNAL OF RENEWABLE AND SUSTAINABLE ENERGY 5, 041820 (2013)
Downloaded 26 Aug 2013 to 35.8.11.2. This article is copyrighted as indicated in the abstract. Reuse of AIP content is subject to the terms at: http://jrse.aip.org/about/rights_and_permissions
determined to be optimal and yield the highest amount of heat that will avoid electricity
consumption.
Most of researchers investigated the optimum tilt for the solar collectors without taking into
account that it is part of the entire SDHW. Consequently, the optimum tilt is determined for
maximum amounts of different types of incident solar radiation on the solar collector: extrater-
restrial,2 global (the measured data),3–6 global and diffuse (measured data),7 and direct.8
Furthermore, the optimal tilt is determined regarding the sunshine duration.9 Some researchers
optimized the solar collector tilt through the response of the SDHWS (the maximum solar frac-
tion).10,11 This literature shows that most of researchers investigated the optimum tilt for the sta-
tionary solar collector and the solar collector annually taking 12 tilts. However, they rarely stud-
ied variable-tilt flat-plate solar collectors performing in Serbia that annually take 2 and 4
optimal tilts. In this investigation, the tilts are also optimized through the response of the
SDHWS as it is performed in Ref. 10. However, to stress that in Serbia the obtained heat in
such an installation avoids use of electricity, the optimal tilt is obtained when the SDHWS
achieves the maximum of the solar fraction. However, it is clear that in this case the solar frac-
tion has the same value as solar fraction.
This paper reports an investigation of the energy performance for variable tilt flat-plate so-
lar collectors in Belgrade, Serbia. The investigated solar collectors are SC#2, SC#4, and
SC#12. These solar collectors are placed at roofs of houses in north-south direction. The used
weather data were from the meteorological station. These investigations use computer codes in
EnergyPlus and GenOpt software with the application of Hooke-Jeeves search algorithm. For
the different variable tilt SCs, the investigations yield their optimum tilts that maximize the so-
lar fraction, avoided electricity, and avoided fossil energy by the SDHWS. In addition the
research will study the deficit in the solar fraction when the tilt in practice is not optimal. After
that the values of the avoided electricity are compared for all cases in order to show the real
need for SC#2, SC#4, and SC#12 in practice.
II. MODELLING AND SIMULATION
In these investigations, simulations and optimizations are performed. The simulations use
EnergyPlus software. The optimizations use an optimization routine that is specially programmed
around GenOpt computer code with implementation of the Hooke-Jeeves search algorithm.
A. Simulation software—EnergyPlus
In this study, the building energy simulation software EnergyPlus (Version 7.0) is used to
predict solar energy and electricity use in solar installation for heating of DHW in several cities
in Serbia. Then, the solar fraction is determined for its different design, installation, and opera-
tion parameters. EnergyPlus is made available by the Lawrence Berkley Laboratory in USA.12
Its development began in 1996 on the basis of two widely used programs: DOE-2 and BLAST.
The software serves to simulate building energy behavior and use of renewable energy in build-
ings.13 The renewable energy simulation capabilities include solar thermal and photovoltaic
simulation. Other simulation features of EnergyPlus include: variable time steps, user-
configurable modular systems, and user defined input and output data structures. The software
has been tested using the IEA HVAC BESTEST E100-E200 series of tests.14
Modeling of the SDHWS in EnergyPlus requires models of different components embedded
in EnergyPlus such as that of flat-plate solar collector, storage tank, tempering valve, and in-
stantaneous water heater. Water in the storage tank is heated by solar energy and water in the
instantaneous water heater by electricity.
B. GenOpt software
GenOpt is an optimization program for the minimization of a cost function that is eval-
uated by an external simulation program.15 It has been developed for optimization problems
where the cost function is computationally expensive and its derivatives are not available or
041820-2 Skerlic et al. J. Renewable Sustainable Energy 5, 041820 (2013)
Downloaded 26 Aug 2013 to 35.8.11.2. This article is copyrighted as indicated in the abstract. Reuse of AIP content is subject to the terms at: http://jrse.aip.org/about/rights_and_permissions
may not even exist. GenOpt can be coupled to any simulation program that reads its input from
text files and writes its output to text files. The independent variables can be continuous varia-
bles (possibly with lower and upper bounds), discrete variables, or both continuous and discrete
variables. Constraints on dependent variables can be implemented using penalty or barrier func-
tions. GenOpt has a library with local and global multi-dimensional and one-dimensional opti-
mization algorithms and algorithms for doing parametric runs.16 An algorithm interface allows
adding new minimization algorithms without knowing the details of the program structure.
GenOpt is written in Java so that it is platform independent. The platform independence and
the general interface make GenOpt applicable to a wide range of optimization problems.
GenOpt has not been designed for linear programming problems, quadratic programming prob-
lems, and problems where the gradient of the cost function is available. For such problems, as
well as for other problems, special tailored software exists that is more efficient.
C. Optimization algorithm
For optimization, the Hooke-Jeeves algorithm is used together with EnergyPlus simulation.
These two programs are connected together by using GenOpt software.15 In this research, the
adaptive precision Hooke-Jeeves algorithm is used. Hooke-Jeeves algorithm is a derivative free
optimization and direct search algorithm.17–19 In direct search methods, only the objective func-
tions and the constraint values are used to guide the search strategy.18,19 The used Hooke-Jeeves
algorithm is the adaptive precision algorithm. This algorithm progressively increases the preci-
sion of the approximating cost functions as the sequence of iterates approaches a stationary
point. In addition, the algorithm only accepts iterates that reduces the cost sufficiently. It reduces
the computation time up to a factor of four compared to the standard Hooke–Jeeves algorithm.
It should be recognized that the parametric runs may give the results because the optimiza-
tion with one independent variable is performed; however, the Hooke-Jeeves algorithm gives
more accurate result for the tilt that yields the maximum of f. Also, it is understood that the dif-
ference in f obtained by the both methods can be neglected.
III. MATHEMATICAL MODEL
This part of the paper provides the mathematical model used in EnergyPlus to simulate the
energy behavior of SDHWS and its different parts: the flat-plate solar collector, thermal tanks
(storage & heaters), tempering valve, and SDHWS-control devices.
A. EnergyPlus model for SDHWS
The SDHWS heats DHW by using solar and electricity. The DHW is used for sink, bath,
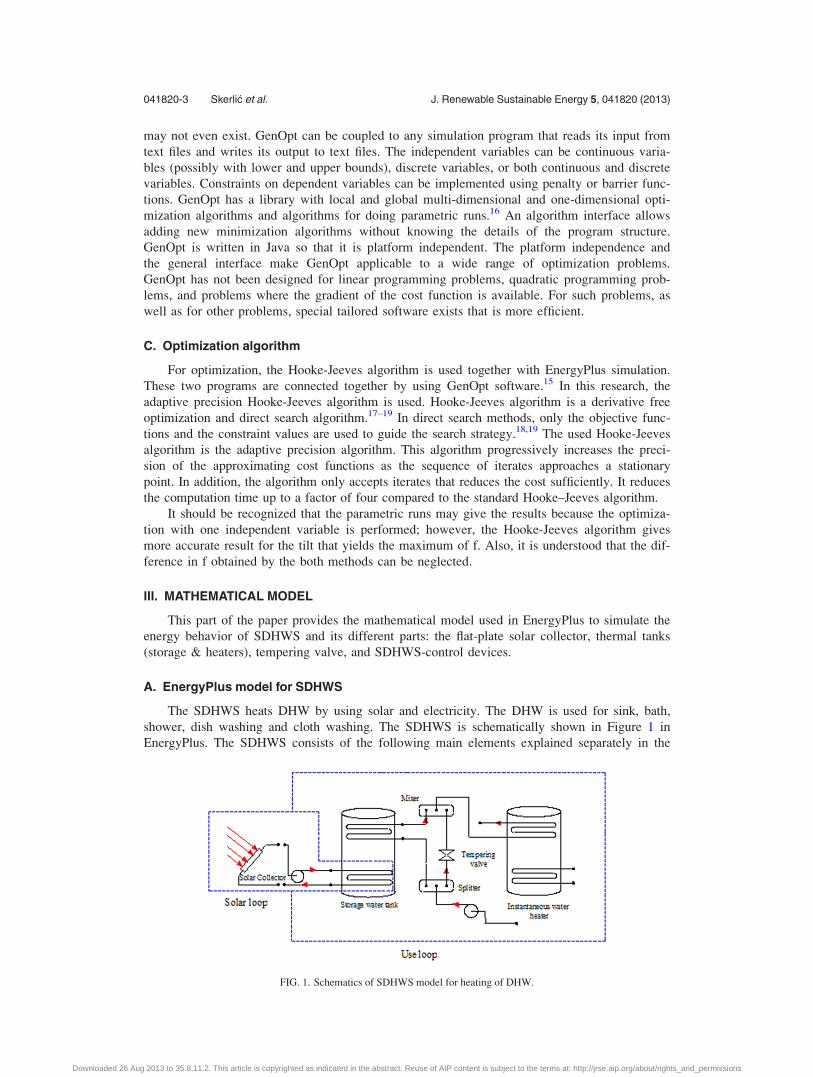
shower, dish washing and cloth washing. The SDHWS is schematically shown in Figure 1 in
EnergyPlus. The SDHWS consists of the following main elements explained separately in the
FIG. 1. Schematics of SDHWS model for heating of DHW.
041820-3 Skerlic et al. J. Renewable Sustainable Energy 5, 041820 (2013)
Downloaded 26 Aug 2013 to 35.8.11.2. This article is copyrighted as indicated in the abstract. Reuse of AIP content is subject to the terms at: http://jrse.aip.org/about/rights_and_permissions
text below: the solar collector, storage water tank, instantaneous water heater, tempering valve,
and temperature controls. These elements are located in two inner loops of the SDHWS: the so-
lar loop and the use loop. The solar loop is to capture solar energy. The use loop is to consume
DHW. The solar loop consists of the solar collector, water pump, and spiral pipe heat exchanger
(inside the hot water storage tank). The use loop consists of the splitter, storage water tank, in-
stantaneous water heater, tempering valve, and mixer. Inside the solar loop, the solar collector
captures solar energy. The solar energy heats water that flows through the solar collector.
Furthermore, this hot water heats DHW in the storage water tank. Directly from water supply
network in the use loop, the water reaches the splitter. From the splitter, the domestic water may
go to the storage water tank or to the tempering valve. In the storage water tank, the domestic
water is heated from the solar loop via the spiral pipe heat exchanger. From the storage water
tank, the hot water goes to the instantaneous water heater where can be additionally heated.
Then the hot water from the instantaneous water heater and the cold water from the tempering
valve go to the mixer and after that as DHW to the consumers. The water temperature in the
storage tank may be higher or lower than the needed (hot-water set-up) DHW temperature. If
this water temperature is higher than the needed DHW temperature, then this water temperature
is lowered in the mixer by using the cold domestic water through the tempering valve. If this
water temperature is lower than the needed DHW temperature, this water is heated by electricity
in the instantaneous water heater to the needed DHW temperature.
B. Solar collector
1. Surface geometry
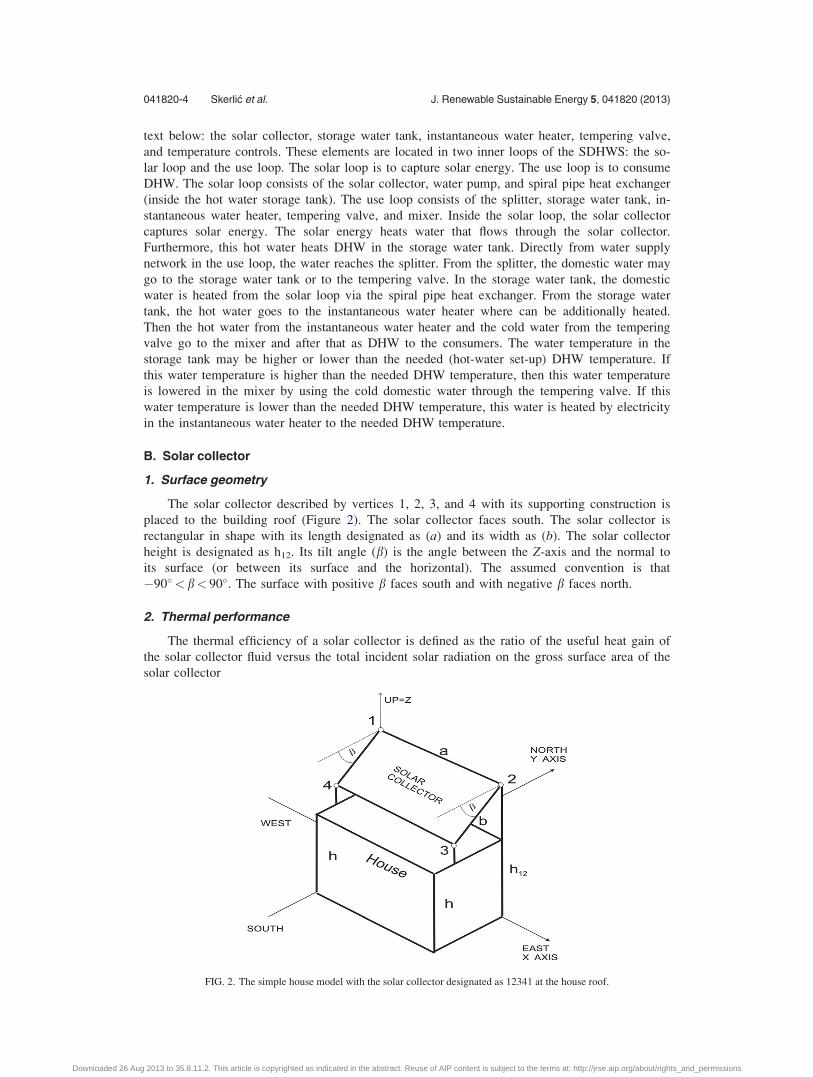
The solar collector described by vertices 1, 2, 3, and 4 with its supporting construction is
placed to the building roof (Figure 2). The solar collector faces south. The solar collector is
rectangular in shape with its length designated as (a) and its width as (b). The solar collector
height is designated as h12. Its tilt angle (b) is the angle between the Z-axis and the normal to
its surface (or between its surface and the horizontal). The assumed convention is that
�90�<b< 90�. The surface with positive b faces south and with negative b faces north.
2. Thermal performance
The thermal efficiency of a solar collector is defined as the ratio of the useful heat gain of
the solar collector fluid versus the total incident solar radiation on the gross surface area of the
solar collector
FIG. 2. The simple house model with the solar collector designated as 12341 at the house roof.
041820-4 Skerlic et al. J. Renewable Sustainable Energy 5, 041820 (2013)
Downloaded 26 Aug 2013 to 35.8.11.2. This article is copyrighted as indicated in the abstract. Reuse of AIP content is subject to the terms at: http://jrse.aip.org/about/rights_and_permissions
g ¼ ðq=AÞ=Isolar ¼ c0 þ c1ðTin � TairÞ=Isolar þ c2 ðTin � TairÞ2=Isolar: (1)
Here, q stands for the useful heat gain, A stands for the gross area of the solar collector, and
Isolar stands for the total incident solar radiation. Note that g is only defined for Isolar> 0. For g,
the quadratic correlation is used where c0, c1, and c2 are coefficients obtained by investigation
for each used solar collector. Here, Tin stands for the temperature of the water entering the solar
collector and Tair stands for the temperature of outside air.
3. Incident angle modifiers
The transmittance of the solar collector glazing varies with the incidence angle of radiation.
Usually the transmittance is highest when the incident radiation is normal to the glazing
surface. The test conditions determine the efficiency coefficients for the normal incidence. For
off-normal angles, the transmittance of the glazing is modified by the incident angle modifier
coefficient. Its relationship is fit to a second-order, quadratic correlation
Ksa ¼ 1þ b0½ð1=cos hÞ � 1� þ b1½ð1=cos hÞ � 1�2: (2)
The incident angle modifier coefficients b0 and b1 are usually negative. They are obtained by
measurement for each used solar collector. The obtained coefficients are only valid for incident
angles of 60� or less. Then, the EnergyPlus model cuts off solar collector gains for the incident
angles greater than 60�.
4. Investigated solar collector
The used solar collector AE-32 is manufactured by Alternate energy technologies. Its gross
area is 8.892 m2. Test fluid is water with the test flow rate 0.0002328 m3/s. Test correlation type
is inlet. The coefficients of the efficiency equation are c0¼ 0.691, c1¼�3.396 W/m2 K,
c2¼�0.00193 W/m2 K2. The coefficients of the incident angle modifier are b0¼�0.1939 and
b1¼�0.0055.
C. Storage water tank
The storage water tank stores thermal energy in water. EnergyPlus provides a model that
simulates a storage water tank (as a well-mixed water tank). It has volume of 0.75 m3,
UA¼ 5 W/K, its ambient temperature¼ 22 �C, and heat exchangers effectiveness¼ 1. The
water supply temperature to the tank is the water mains temperature (Tmains) that is a function
of outdoor climate conditions and varies with time of year. A correlation is used to predict
this temperature based on two weather inputs: Tout,avg¼ (dry-bulb) average annual outdoor air
temperature, and DTout,maxdiff¼maximum difference in monthly average outdoor air
temperatures22
Tmains ¼ ð1:8 Tout;avg þ 38Þ þ ratioðð1:8DTout;maxdiff þ 32Þ=2Þ sin ½0:986ðday� 15� lagÞ � 90�;(3)
where day¼ Julian day of the year (1–365), ratio¼ 0.4þ 0.01 (1.8 Tout,avg � 12), and lag¼ 35
� (1.8 Tout,avg � 12). Values for Tout,avg and DTout,maxdiff are easily calculated from annual
weather data using a spreadsheet. For the Belgrade, Tout,avg¼ 9.69 �C and DTout,maxdiff¼ 28.1 �C.
D. Tempering valve
The tempering valve is useful when the water in the storage water tank becomes warmer
than is necessary for safe use of the DHW. Then, the tempering valve diverts the cold water
flow through its branch to adjust the temperature of DHW at the outlet of the mixer (see
Figure 1).
041820-5 Skerlic et al. J. Renewable Sustainable Energy 5, 041820 (2013)
Downloaded 26 Aug 2013 to 35.8.11.2. This article is copyrighted as indicated in the abstract. Reuse of AIP content is subject to the terms at: http://jrse.aip.org/about/rights_and_permissions
E. SDHWS controls
By using several temperature controls inside the installation, the control equipment man-
ages the SDHWS. These controlled temperatures are inside the solar and use loop. The solar
loop has the following controlled temperatures: the loop temperature (60 �C), the high tempera-
ture turn off (60 �C), the high temperature turn on (0 �C), the temperature difference on limit
(differential thermostat) (10 �C), and the temperature difference off limit (differential thermo-
stat) (2 �C). The use loop has the following controlled temperatures: the hot water set-point
temperature (50 �C) and the maximum temperature limit for storage tank (82.2 �C).
IV. SIMULATION AND OPTIMIZATION
To run simulations and optimizations, it is necessary to know the hot water consumption
and climate.
A. Hot water consumption
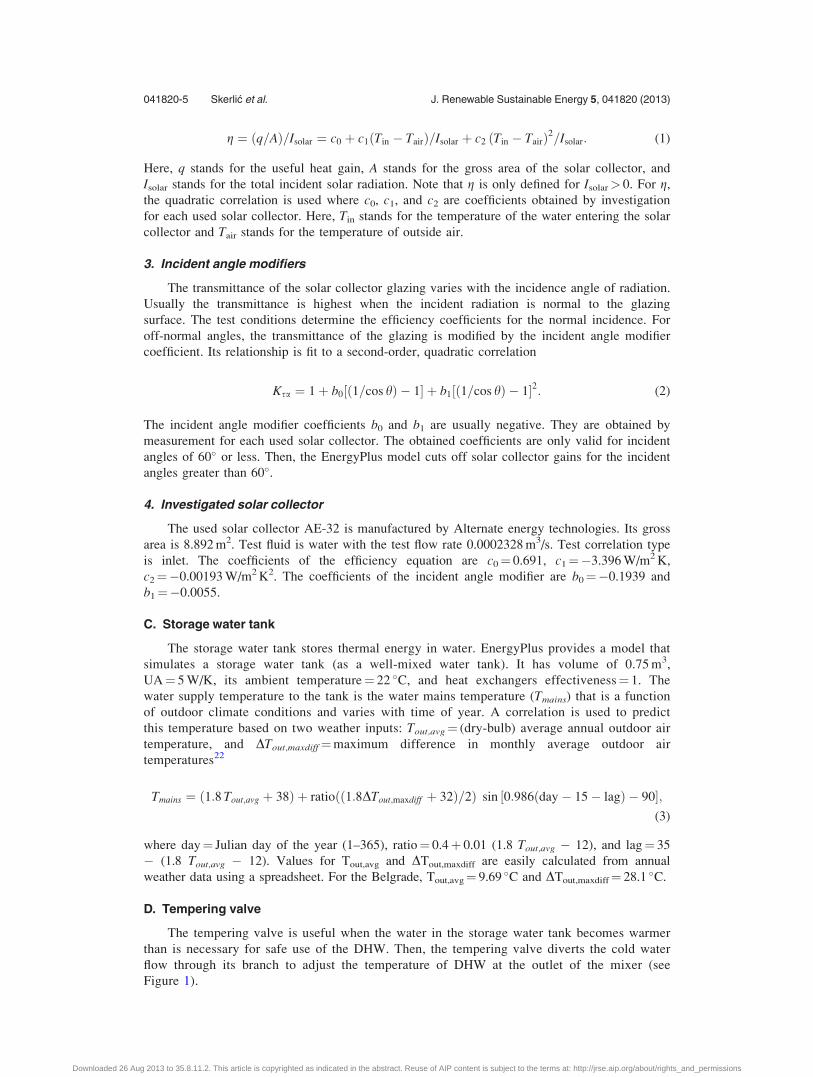
This installation generates four types of DHW: that of tap, shower, dish-washer, and cloth-
washer. Figure 3 provides DHW characteristics: temperatures, maximum flow rates and daily
schedules that may be valid for family of four in Serbia. Regarding its applications, the DHW
would be heated to two temperatures: 43.3 (tap and shower) and 50 �C (dish and clothes
washer). For DHW with lower temperature and for DHW with higher temperature used in dish
washer, the daily schedule is the same for each day throughout entire year. The cloth washer
operates only on Sunday. For DHW with higher temperature used in the cloth washer, the daily
schedule is the same for each Sunday throughout the entire year.
B. Climate
The investigated SDHWS is located in the city of Belgrade in Balkan Peninsula in the state
of Serbia. Its height is 99 m, latitude N 44.82, and longitude E 20.27. The meteorological data
FIG. 3. Schedule of DHW use for (a) tap and shower (0.0000945 m3/s maximum with 43.3 �C) (b) dish and clothes washer
(0.000063 m3/s maximum with 50 �C). Dish-washer operates daily, while cloth washer on Sundays.
041820-6 Skerlic et al. J. Renewable Sustainable Energy 5, 041820 (2013)
Downloaded 26 Aug 2013 to 35.8.11.2. This article is copyrighted as indicated in the abstract. Reuse of AIP content is subject to the terms at: http://jrse.aip.org/about/rights_and_permissions
are measured by the meteorological station designated by World Meteorological organization as
132720.20 The metrological data for Belgrade used in this paper are the ASHRAE International
Weather data for Energy Calculations (IWEC). They are used in the form of EnergyPlus
weather files with hourly data.
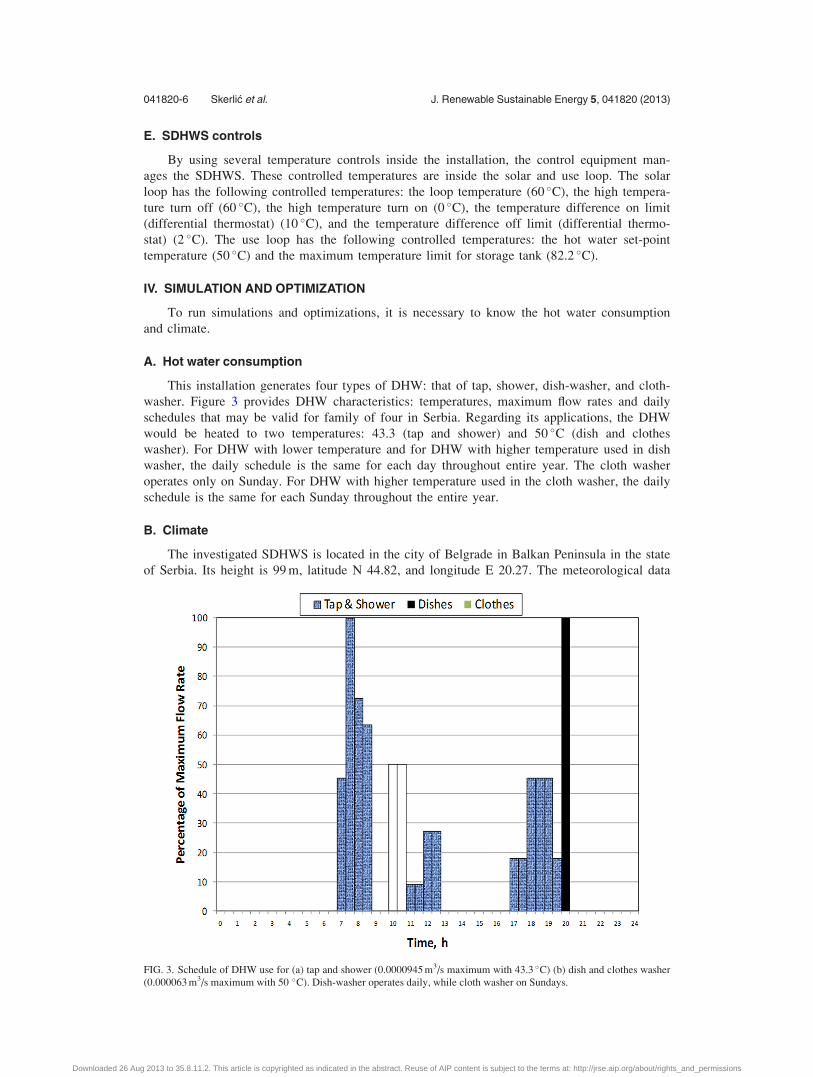
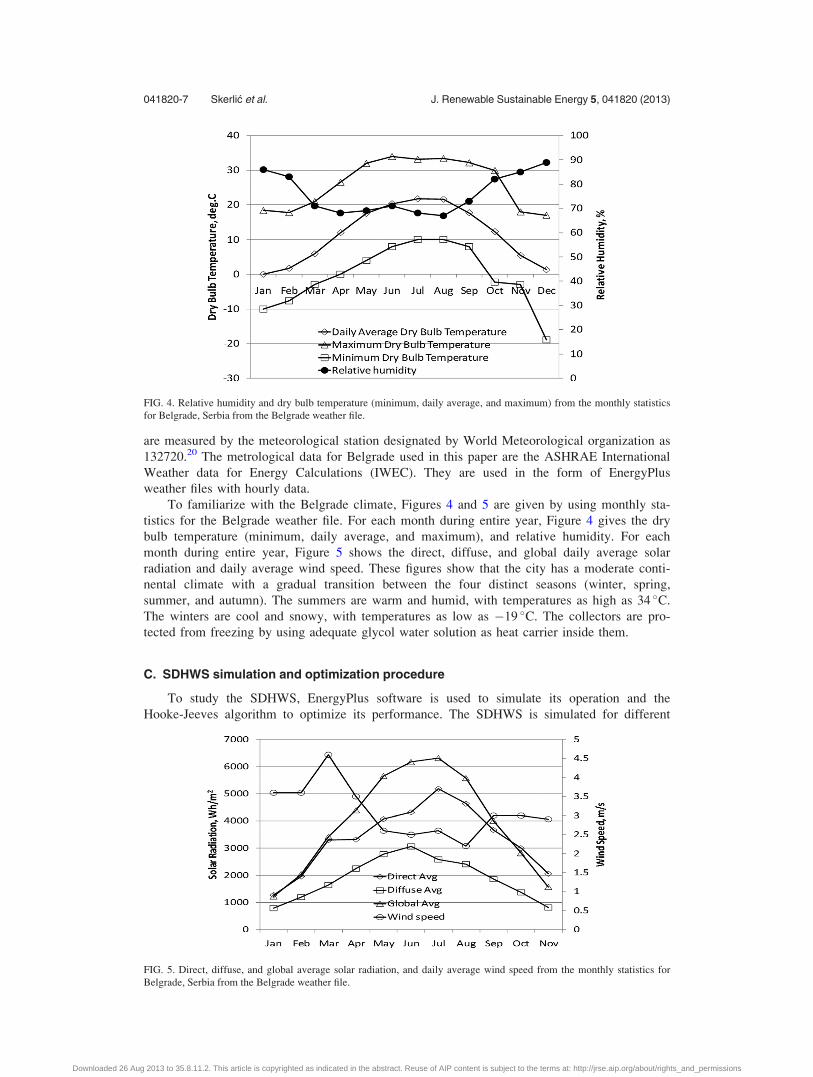
To familiarize with the Belgrade climate, Figures 4 and 5 are given by using monthly sta-
tistics for the Belgrade weather file. For each month during entire year, Figure 4 gives the dry
bulb temperature (minimum, daily average, and maximum), and relative humidity. For each
month during entire year, Figure 5 shows the direct, diffuse, and global daily average solar
radiation and daily average wind speed. These figures show that the city has a moderate conti-
nental climate with a gradual transition between the four distinct seasons (winter, spring,
summer, and autumn). The summers are warm and humid, with temperatures as high as 34 �C.
The winters are cool and snowy, with temperatures as low as �19 �C. The collectors are pro-
tected from freezing by using adequate glycol water solution as heat carrier inside them.
C. SDHWS simulation and optimization procedure
To study the SDHWS, EnergyPlus software is used to simulate its operation and the
Hooke-Jeeves algorithm to optimize its performance. The SDHWS is simulated for different
FIG. 4. Relative humidity and dry bulb temperature (minimum, daily average, and maximum) from the monthly statistics
for Belgrade, Serbia from the Belgrade weather file.
FIG. 5. Direct, diffuse, and global average solar radiation, and daily average wind speed from the monthly statistics for
Belgrade, Serbia from the Belgrade weather file.
041820-7 Skerlic et al. J. Renewable Sustainable Energy 5, 041820 (2013)
Downloaded 26 Aug 2013 to 35.8.11.2. This article is copyrighted as indicated in the abstract. Reuse of AIP content is subject to the terms at: http://jrse.aip.org/about/rights_and_permissions
continual runs that may last 1, 3, and 6 months. During each continual run, the SDHWS will
have the solar collector with one value for its tilt bi. Here, “i” designates the run duration. If
the run lasts one month i¼m, three months i¼ q, and six-months i¼ h.
EnergyPlus calculates the electricity consumption by the SDHWS during its run. The
obtained results are Ei,e and Ei,tot. The variable Ei,e is the electricity consumed by the SDHWS
if the solar collector exists.
As variable Ei,e¼Ei,hrþEi,wp, the electricity is consumed by the electric heater to heat the
DHW (Ei,hr) and by the circulation pump to run water inside the solar loop (Ei,wp). The variable
Ei,tot is the electricity consumed by the electric heater to heat DHW if the solar collector does
not exist. Energy Ei,s¼Ei,tot�Ei,hr represents the generated heat from the solar energy that
heats DHW instead of the electricity from the electrical network. Consequently, Ei,s represents
the amount of electricity that is not consumed from the electricity network as it would be con-
sumed if the SDHWS did not capture solar energy. This is the avoided electricity designated as
Ei,ae¼Ei,s. This means that other needs for electricity may be covered by using electricity with-
out constructing new generating capacities for electricity based on the fact that electricity is
replaced by the solar-origin heat.
The amount of the avoided (use of) fossil energy by the electricity network is also propor-
tional to the avoided electricity as Ei,af¼CfEi,ae, where Cf stands for the fossil fuel energy
factor.
The performance of the SDHWS is evaluated by calculating the solar fraction (fi). This is
the objective function used by the Hooke-Jeeves algorithm that should be maximized,
fi ¼ 100ðEi;tot � Ei;aeÞ=Ei;tot ¼ f ðbiÞ: (4)
If fi is larger, the SDHWS better protects the environment. The variable fi also represents the
solar fraction and avoided fossil energy fraction. Variable fi is a function of tilt bi. It should be
maximized in the constrained region of bi. As a result of the optimization, we obtain the maxi-
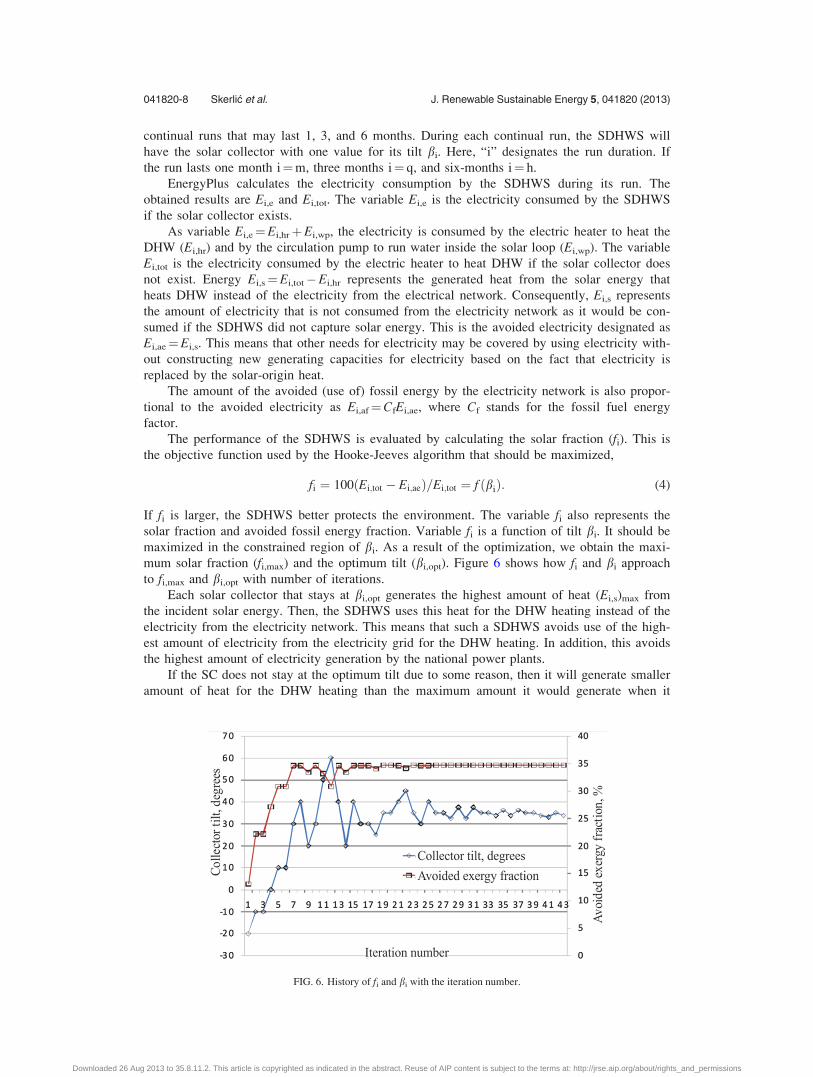
mum solar fraction (fi,max) and the optimum tilt (bi,opt). Figure 6 shows how fi and bi approach
to fi,max and bi,opt with number of iterations.
Each solar collector that stays at bi,opt generates the highest amount of heat (Ei,s)max from
the incident solar energy. Then, the SDHWS uses this heat for the DHW heating instead of the
electricity from the electricity network. This means that such a SDHWS avoids use of the high-
est amount of electricity from the electricity grid for the DHW heating. In addition, this avoids
the highest amount of electricity generation by the national power plants.
If the SC does not stay at the optimum tilt due to some reason, then it will generate smaller
amount of heat for the DHW heating than the maximum amount it would generate when it
FIG. 6. History of fi and bi with the iteration number.
041820-8 Skerlic et al. J. Renewable Sustainable Energy 5, 041820 (2013)
Downloaded 26 Aug 2013 to 35.8.11.2. This article is copyrighted as indicated in the abstract. Reuse of AIP content is subject to the terms at: http://jrse.aip.org/about/rights_and_permissions
stays at the optimum tilt. As the heating of DHW uses the electricity, the solar collector will
use more electricity for the DHW heating than that when the SC has its optimum tilt. This
means that the solar collector will lose the electricity. For this case, the deficit in solar fractions
defined as
Di ¼ 100ðfi � fi;maxÞ=fi;max: (5)
V. RESULTS AND DISCUSSION
The paper reports the investigations of SDHWS with SC#2, SDHWS with SC#4, and
SDHWS with SC#12. Note that in the text, Latin numerals represent the months such as I
(January), II (February), III (March), IV (April), V (May), VI (June), VII (July), VIII (August),
IX (September), X (October), XI (November), and XII (December).
A. SDHWS with SC#2
The SC#2 is the solar collector would operate by using two tilts bq,opt per year - one tilt
per six months. The SC#2 would operate at one bh,opt from 15th October to the 14th April, and
at other bh,opt from the 15th April to the 14th October.
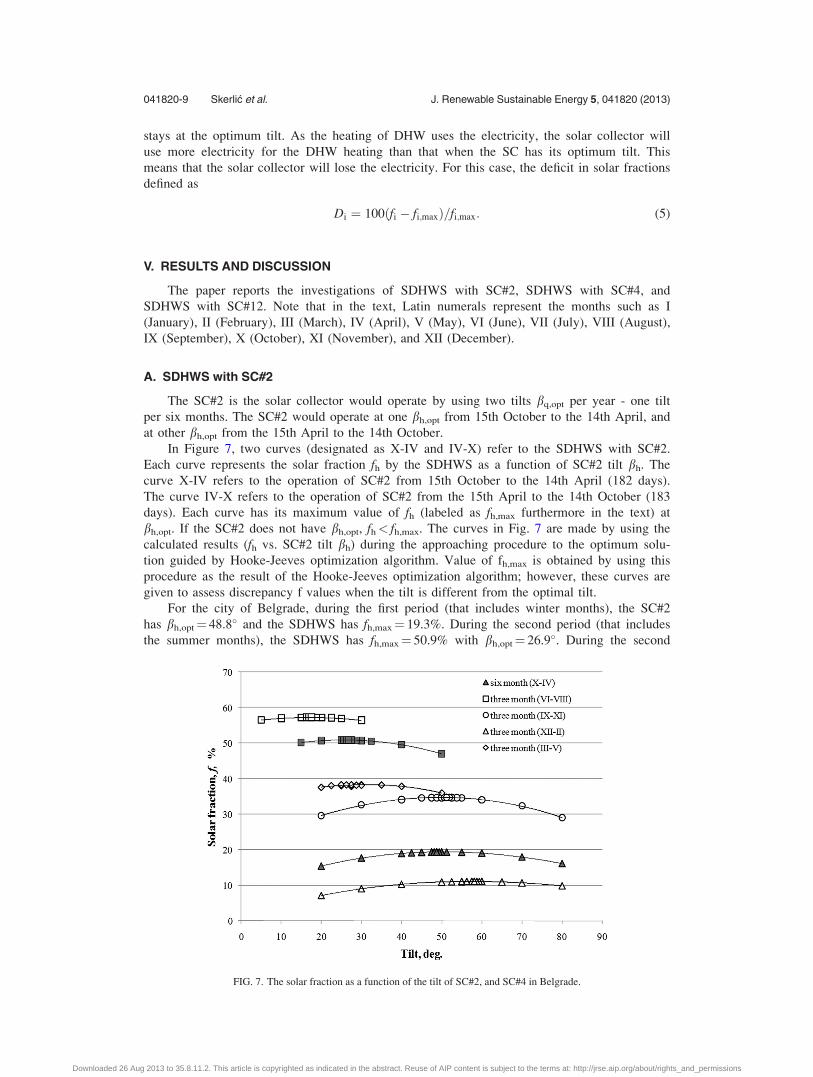
In Figure 7, two curves (designated as X-IV and IV-X) refer to the SDHWS with SC#2.
Each curve represents the solar fraction fh by the SDHWS as a function of SC#2 tilt bh. The
curve X-IV refers to the operation of SC#2 from 15th October to the 14th April (182 days).
The curve IV-X refers to the operation of SC#2 from the 15th April to the 14th October (183
days). Each curve has its maximum value of fh (labeled as fh,max furthermore in the text) at
bh,opt. If the SC#2 does not have bh,opt, fh< fh,max. The curves in Fig. 7 are made by using the
calculated results (fh vs. SC#2 tilt bh) during the approaching procedure to the optimum solu-
tion guided by Hooke-Jeeves optimization algorithm. Value of fh,max is obtained by using this
procedure as the result of the Hooke-Jeeves optimization algorithm; however, these curves are
given to assess discrepancy f values when the tilt is different from the optimal tilt.
For the city of Belgrade, during the first period (that includes winter months), the SC#2
has bh,opt¼ 48.8� and the SDHWS has fh,max¼ 19.3%. During the second period (that includes
the summer months), the SDHWS has fh,max¼ 50.9% with bh,opt¼ 26.9�. During the second
FIG. 7. The solar fraction as a function of the tilt of SC#2, and SC#4 in Belgrade.
041820-9 Skerlic et al. J. Renewable Sustainable Energy 5, 041820 (2013)
Downloaded 26 Aug 2013 to 35.8.11.2. This article is copyrighted as indicated in the abstract. Reuse of AIP content is subject to the terms at: http://jrse.aip.org/about/rights_and_permissions
period, bh,opt is 21.9� lower than that during the first period, and fh,max is around 2.6 times
higher than that during the first period.
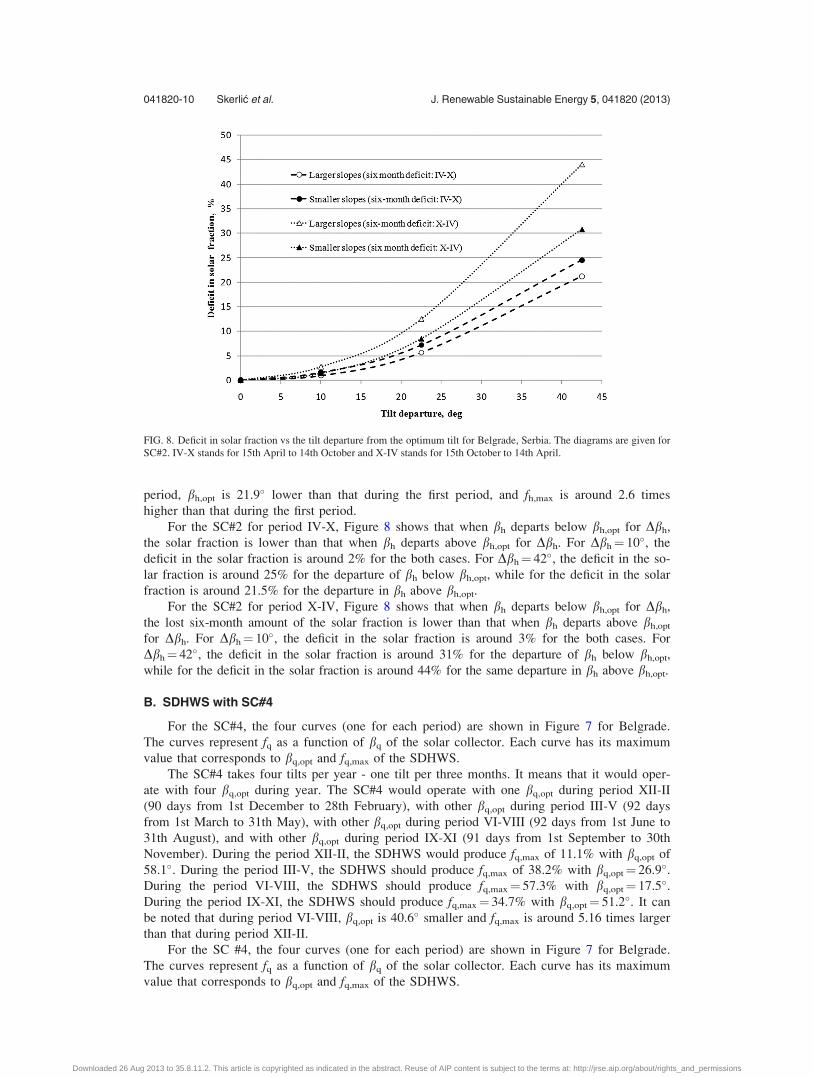
For the SC#2 for period IV-X, Figure 8 shows that when bh departs below bh,opt for Dbh,
the solar fraction is lower than that when bh departs above bh,opt for Dbh. For Dbh¼ 10�, the
deficit in the solar fraction is around 2% for the both cases. For Dbh¼ 42�, the deficit in the so-
lar fraction is around 25% for the departure of bh below bh,opt, while for the deficit in the solar
fraction is around 21.5% for the departure in bh above bh,opt.
For the SC#2 for period X-IV, Figure 8 shows that when bh departs below bh,opt for Dbh,
the lost six-month amount of the solar fraction is lower than that when bh departs above bh,opt
for Dbh. For Dbh¼ 10�, the deficit in the solar fraction is around 3% for the both cases. For
Dbh¼ 42�, the deficit in the solar fraction is around 31% for the departure of bh below bh,opt,
while for the deficit in the solar fraction is around 44% for the same departure in bh above bh,opt.
B. SDHWS with SC#4
For the SC#4, the four curves (one for each period) are shown in Figure 7 for Belgrade.
The curves represent fq as a function of bq of the solar collector. Each curve has its maximum
value that corresponds to bq,opt and fq,max of the SDHWS.
The SC#4 takes four tilts per year - one tilt per three months. It means that it would oper-
ate with four bq,opt during year. The SC#4 would operate with one bq,opt during period XII-II
(90 days from 1st December to 28th February), with other bq,opt during period III-V (92 days
from 1st March to 31th May), with other bq,opt during period VI-VIII (92 days from 1st June to
31th August), and with other bq,opt during period IX-XI (91 days from 1st September to 30th
November). During the period XII-II, the SDHWS would produce fq,max of 11.1% with bq,opt of
58.1�. During the period III-V, the SDHWS should produce fq,max of 38.2% with bq,opt¼ 26.9�.During the period VI-VIII, the SDHWS should produce fq,max¼ 57.3% with bq,opt¼ 17.5�.During the period IX-XI, the SDHWS should produce fq,max¼ 34.7% with bq,opt¼ 51.2�. It can
be noted that during period VI-VIII, bq,opt is 40.6� smaller and fq,max is around 5.16 times larger
than that during period XII-II.
For the SC #4, the four curves (one for each period) are shown in Figure 7 for Belgrade.
The curves represent fq as a function of bq of the solar collector. Each curve has its maximum
value that corresponds to bq,opt and fq,max of the SDHWS.
FIG. 8. Deficit in solar fraction vs the tilt departure from the optimum tilt for Belgrade, Serbia. The diagrams are given for
SC#2. IV-X stands for 15th April to 14th October and X-IV stands for 15th October to 14th April.
041820-10 Skerlic et al. J. Renewable Sustainable Energy 5, 041820 (2013)
Downloaded 26 Aug 2013 to 35.8.11.2. This article is copyrighted as indicated in the abstract. Reuse of AIP content is subject to the terms at: http://jrse.aip.org/about/rights_and_permissions
The deficit in the solar fraction for all periods is given in Table I for the bq departure of
42� from bq,opt for the SC#4 in Belgrade, Serbia. For the period IX-XI, the deficit in the solar
fraction is higher when bq departs below bq,opt than that when bq departs above bq,opt for 42�.For the period XII-II, the situation is opposite. For the periods III-V and VI-VIII, the deficit in
the solar fraction is almost the same when bq departs either below or above bq,opt for 42�. The
angle of 42� is selected arbitrarily in order to obtain high enough values of discrepancies in f to
differentiate them for the use of solar collector in different seasons.
C. SDHWS with SC#12
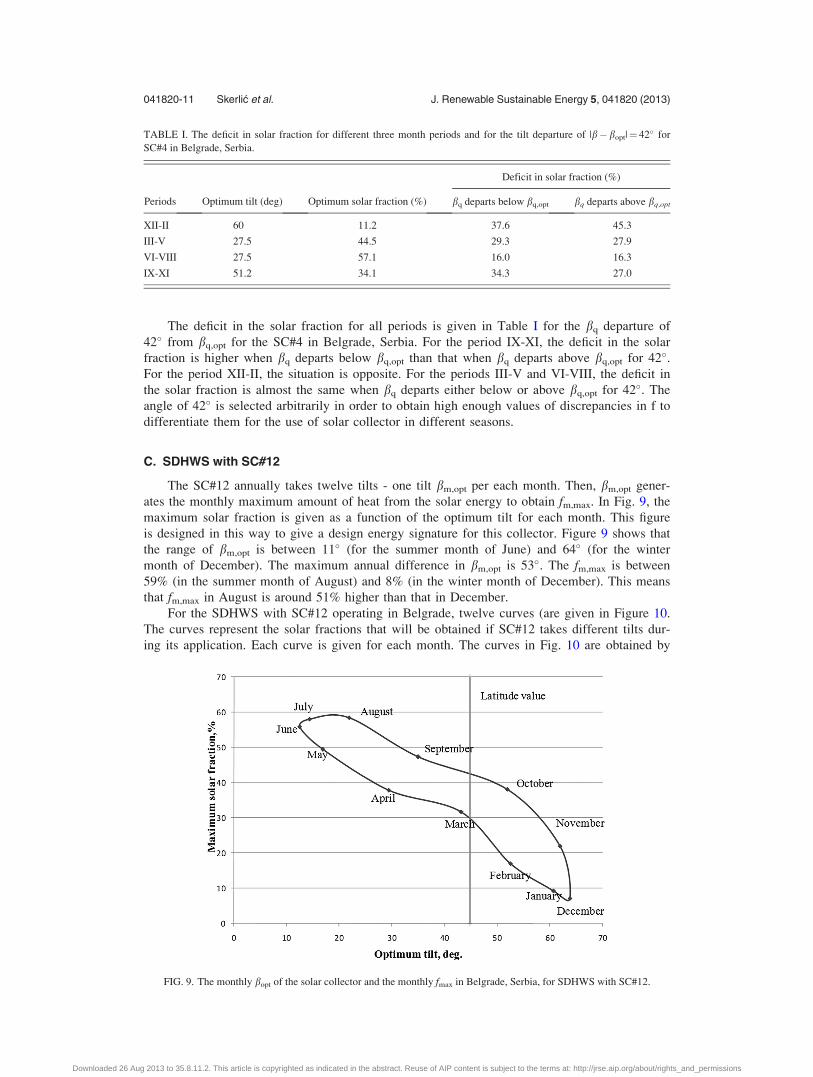
The SC#12 annually takes twelve tilts - one tilt bm,opt per each month. Then, bm,opt gener-
ates the monthly maximum amount of heat from the solar energy to obtain fm,max. In Fig. 9, the
maximum solar fraction is given as a function of the optimum tilt for each month. This figure
is designed in this way to give a design energy signature for this collector. Figure 9 shows that
the range of bm,opt is between 11� (for the summer month of June) and 64� (for the winter
month of December). The maximum annual difference in bm,opt is 53�. The fm,max is between
59% (in the summer month of August) and 8% (in the winter month of December). This means
that fm,max in August is around 51% higher than that in December.
For the SDHWS with SC#12 operating in Belgrade, twelve curves (are given in Figure 10.
The curves represent the solar fractions that will be obtained if SC#12 takes different tilts dur-
ing its application. Each curve is given for each month. The curves in Fig. 10 are obtained by
TABLE I. The deficit in solar fraction for different three month periods and for the tilt departure of |b�bopt|¼ 42� for
SC#4 in Belgrade, Serbia.
Periods Optimum tilt (deg) Optimum solar fraction (%)
Deficit in solar fraction (%)
bq departs below bq,opt bq departs above bq,opt
XII-II 60 11.2 37.6 45.3
III-V 27.5 44.5 29.3 27.9
VI-VIII 27.5 57.1 16.0 16.3
IX-XI 51.2 34.1 34.3 27.0
FIG. 9. The monthly bopt of the solar collector and the monthly fmax in Belgrade, Serbia, for SDHWS with SC#12.
041820-11 Skerlic et al. J. Renewable Sustainable Energy 5, 041820 (2013)
Downloaded 26 Aug 2013 to 35.8.11.2. This article is copyrighted as indicated in the abstract. Reuse of AIP content is subject to the terms at: http://jrse.aip.org/about/rights_and_permissions
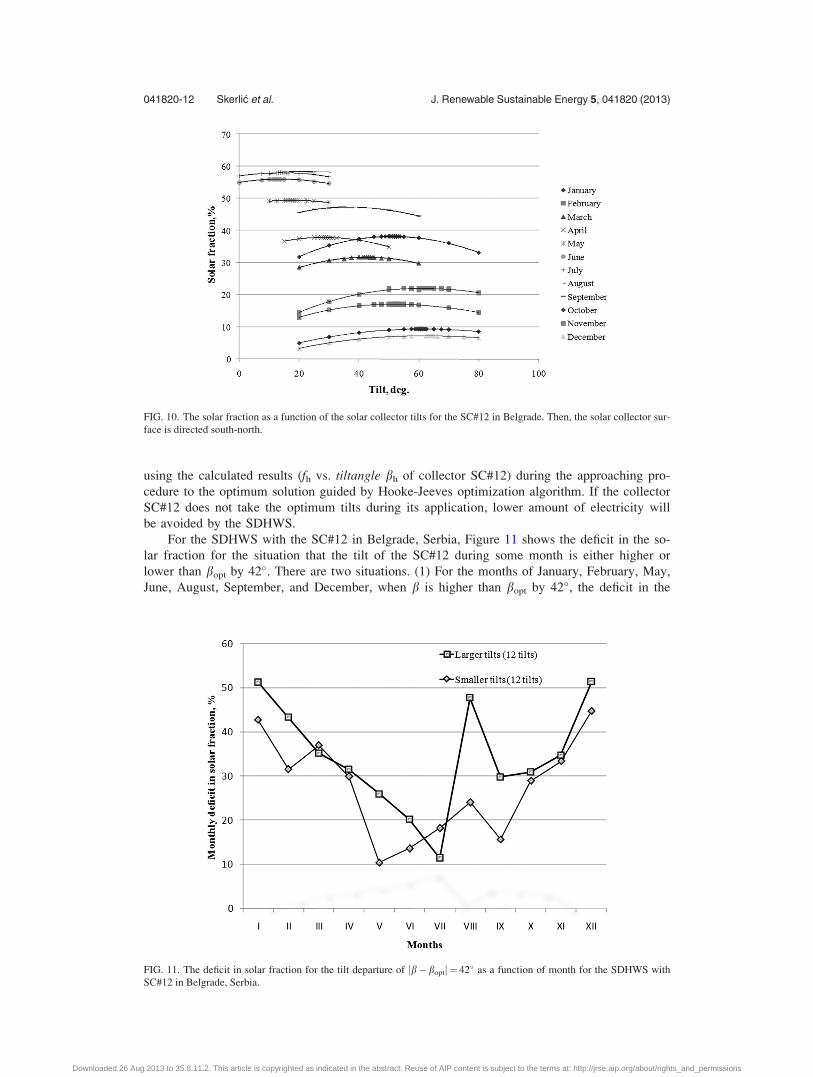
using the calculated results (fh vs. tiltangle bh of collector SC#12) during the approaching pro-
cedure to the optimum solution guided by Hooke-Jeeves optimization algorithm. If the collector
SC#12 does not take the optimum tilts during its application, lower amount of electricity will
be avoided by the SDHWS.
For the SDHWS with the SC#12 in Belgrade, Serbia, Figure 11 shows the deficit in the so-
lar fraction for the situation that the tilt of the SC#12 during some month is either higher or
lower than bopt by 42�. There are two situations. (1) For the months of January, February, May,
June, August, September, and December, when b is higher than bopt by 42�, the deficit in the
FIG. 10. The solar fraction as a function of the solar collector tilts for the SC#12 in Belgrade. Then, the solar collector sur-
face is directed south-north.
FIG. 11. The deficit in solar fraction for the tilt departure of jb�boptj ¼ 42� as a function of month for the SDHWS with
SC#12 in Belgrade, Serbia.
041820-12 Skerlic et al. J. Renewable Sustainable Energy 5, 041820 (2013)
Downloaded 26 Aug 2013 to 35.8.11.2. This article is copyrighted as indicated in the abstract. Reuse of AIP content is subject to the terms at: http://jrse.aip.org/about/rights_and_permissions
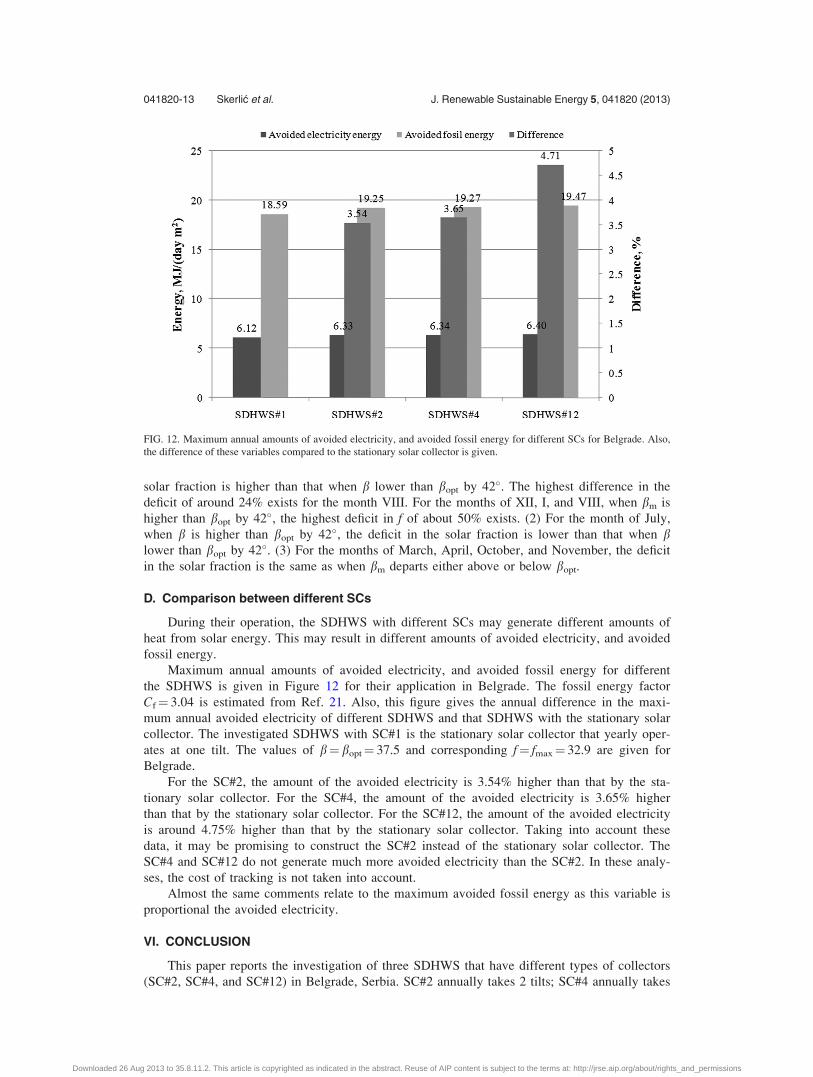
solar fraction is higher than that when b lower than bopt by 42�. The highest difference in the
deficit of around 24% exists for the month VIII. For the months of XII, I, and VIII, when bm is
higher than bopt by 42�, the highest deficit in f of about 50% exists. (2) For the month of July,
when b is higher than bopt by 42�, the deficit in the solar fraction is lower than that when blower than bopt by 42�. (3) For the months of March, April, October, and November, the deficit
in the solar fraction is the same as when bm departs either above or below bopt.
D. Comparison between different SCs
During their operation, the SDHWS with different SCs may generate different amounts of
heat from solar energy. This may result in different amounts of avoided electricity, and avoided
fossil energy.
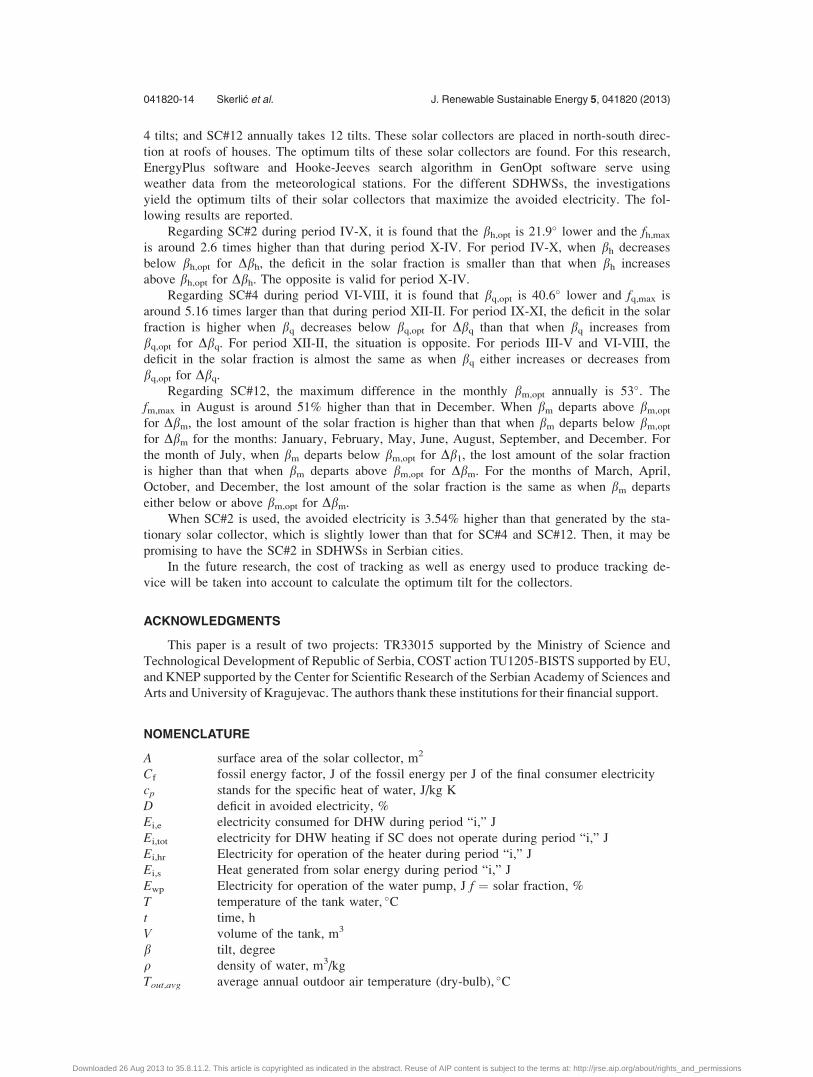
Maximum annual amounts of avoided electricity, and avoided fossil energy for different
the SDHWS is given in Figure 12 for their application in Belgrade. The fossil energy factor
Cf¼ 3.04 is estimated from Ref. 21. Also, this figure gives the annual difference in the maxi-
mum annual avoided electricity of different SDHWS and that SDHWS with the stationary solar
collector. The investigated SDHWS with SC#1 is the stationary solar collector that yearly oper-
ates at one tilt. The values of b¼ bopt¼ 37.5 and corresponding f¼ fmax¼ 32.9 are given for
Belgrade.
For the SC#2, the amount of the avoided electricity is 3.54% higher than that by the sta-
tionary solar collector. For the SC#4, the amount of the avoided electricity is 3.65% higher
than that by the stationary solar collector. For the SC#12, the amount of the avoided electricity
is around 4.75% higher than that by the stationary solar collector. Taking into account these
data, it may be promising to construct the SC#2 instead of the stationary solar collector. The
SC#4 and SC#12 do not generate much more avoided electricity than the SC#2. In these analy-
ses, the cost of tracking is not taken into account.
Almost the same comments relate to the maximum avoided fossil energy as this variable is
proportional the avoided electricity.
VI. CONCLUSION
This paper reports the investigation of three SDHWS that have different types of collectors
(SC#2, SC#4, and SC#12) in Belgrade, Serbia. SC#2 annually takes 2 tilts; SC#4 annually takes
FIG. 12. Maximum annual amounts of avoided electricity, and avoided fossil energy for different SCs for Belgrade. Also,
the difference of these variables compared to the stationary solar collector is given.
041820-13 Skerlic et al. J. Renewable Sustainable Energy 5, 041820 (2013)
Downloaded 26 Aug 2013 to 35.8.11.2. This article is copyrighted as indicated in the abstract. Reuse of AIP content is subject to the terms at: http://jrse.aip.org/about/rights_and_permissions
4 tilts; and SC#12 annually takes 12 tilts. These solar collectors are placed in north-south direc-
tion at roofs of houses. The optimum tilts of these solar collectors are found. For this research,
EnergyPlus software and Hooke-Jeeves search algorithm in GenOpt software serve using
weather data from the meteorological stations. For the different SDHWSs, the investigations
yield the optimum tilts of their solar collectors that maximize the avoided electricity. The fol-
lowing results are reported.
Regarding SC#2 during period IV-X, it is found that the bh,opt is 21.9� lower and the fh,max
is around 2.6 times higher than that during period X-IV. For period IV-X, when bh decreases
below bh,opt for Dbh, the deficit in the solar fraction is smaller than that when bh increases
above bh,opt for Dbh. The opposite is valid for period X-IV.
Regarding SC#4 during period VI-VIII, it is found that bq,opt is 40.6� lower and fq,max is
around 5.16 times larger than that during period XII-II. For period IX-XI, the deficit in the solar
fraction is higher when bq decreases below bq,opt for Dbq than that when bq increases from
bq,opt for Dbq. For period XII-II, the situation is opposite. For periods III-V and VI-VIII, the
deficit in the solar fraction is almost the same as when bq either increases or decreases from
bq,opt for Dbq.
Regarding SC#12, the maximum difference in the monthly bm,opt annually is 53�. The
fm,max in August is around 51% higher than that in December. When bm departs above bm,opt
for Dbm, the lost amount of the solar fraction is higher than that when bm departs below bm,opt
for Dbm for the months: January, February, May, June, August, September, and December. For
the month of July, when bm departs below bm,opt for Db1, the lost amount of the solar fraction
is higher than that when bm departs above bm,opt for Dbm. For the months of March, April,
October, and December, the lost amount of the solar fraction is the same as when bm departs
either below or above bm,opt for Dbm.
When SC#2 is used, the avoided electricity is 3.54% higher than that generated by the sta-
tionary solar collector, which is slightly lower than that for SC#4 and SC#12. Then, it may be
promising to have the SC#2 in SDHWSs in Serbian cities.
In the future research, the cost of tracking as well as energy used to produce tracking de-
vice will be taken into account to calculate the optimum tilt for the collectors.
ACKNOWLEDGMENTS
This paper is a result of two projects: TR33015 supported by the Ministry of Science and
Technological Development of Republic of Serbia, COST action TU1205-BISTS supported by EU,
and KNEP supported by the Center for Scientific Research of the Serbian Academy of Sciences and
Arts and University of Kragujevac. The authors thank these institutions for their financial support.
NOMENCLATURE
A surface area of the solar collector, m2
Cf fossil energy factor, J of the fossil energy per J of the final consumer electricity
cp stands for the specific heat of water, J/kg K
D deficit in avoided electricity, %
Ei,e electricity consumed for DHW during period “i,” J
Ei,tot electricity for DHW heating if SC does not operate during period “i,” J
Ei,hr Electricity for operation of the heater during period “i,” J
Ei,s Heat generated from solar energy during period “i,” J
Ewp Electricity for operation of the water pump, J f ¼ solar fraction, %
T temperature of the tank water, �Ct time, h
V volume of the tank, m3
b tilt, degree
q density of water, m3/kg
Tout,avg average annual outdoor air temperature (dry-bulb), �C
041820-14 Skerlic et al. J. Renewable Sustainable Energy 5, 041820 (2013)
Downloaded 26 Aug 2013 to 35.8.11.2. This article is copyrighted as indicated in the abstract. Reuse of AIP content is subject to the terms at: http://jrse.aip.org/about/rights_and_permissions
DTout,maxdiff maximum difference in monthly average outdoor air temperatures, �CTmains water mains temperature, �C
Indices
a annually
hr operation of heater
i operation duration
m daily average for each month
m monthly
h half-yearly
q quarterly
max maximum
t operation of heater and water pump
wp operation of water pump
Abbreviations
DHW domestic hot water
SC solar collector
SDHWS system for solar domestic hot water heating
1X. Q. Zhai and R. Z. Wang, “Experiences on solar heating and cooling in China,” Renewable Sustainable Energy Rev.12, 1110–1128 (2008).
2H. Gunerhan and A. Hepbasli, “Determination of the optimum tilt angle of solar collectors for building applications,”Build. Environ. 42, 779–783 (2007).
3N. Nijegorodov and P. K. Jain, “Optimum slope of a north-south aligned absorber plate from the north to the south poles,”Renewable Energy 11(i), 107–118 (1997).
4D. Ibrahim, “Optimum tilt angle for solar collectors used in Cyprus,” Renewable Energy 6(7), 813–819 (1995).5L. E. Hartley, J. A. Martinez-Lozano, M. P. Utrillas, F. Tena, and R. Pedros, “The optimisation of the angle of inclinationof a solar collector to maximise the incident solar radiation,” Renewable Energy 17, 291–309 (1999).
6R. Tang and T. Wu, “Optimal tilt-angles for solar collectors used in China,” Appl. Energy 79, 239–248 (2004).7M. A. H. M. Yakup and A. Q. Malik, “Optimum tilt angle and orientation for solar collector in Brunei Darussalam,”Renewable Energy 24, 223–234 (2001).
8K. Skeiker, “Optimum tilt angle and orientation for solar collectors in Syria,” Energy Convers. Manage. 50, 2439–2448(2009).
9T. P. Chang, “The Sun’s apparent position and the optimal tilt angle of a solar collector in the northern hemisphere,” Sol.Energy 83, 1274–1284 (2009).
10A. Shariah, M. A. Al-Akhras, and I. A. Al-Omari, “Optimizing the tilt angle of solar collectors,” Renewable Energy 26,587–598 (2002).
11I. M. Michaelides, S. A. Kalogirou, I. Chrysis, G. Roditis, A. Hadjiyianni, H. D. Kambezidis, M. Petrakis, S. Lykoudis,and A. D. Adamopoulos, “Comparison of performance and cost effectiveness of solar water heaters at different collectortracking modes in Cyprus and Greece,” Energy Convers. Manage. 40(12), 1287–1303 (1999).
12D. B. Crawley, L. K. Lawrie, F. C. Winkelmann, W. F. Buhl, Y. J. Huang, C. O. Pedersen, R. K. Strand, R. J. Liesen, D.E. Fisher, M. J. Witte, and J. Glazer, “EnergyPlus: Creating a new-generation building energy simulation program,”Energy Build. 33(4), 319–331 (2001).
13ENERGYPLUS, “Input output reference - The encyclopedic reference to EnergyPlus input and output,” University ofIllinois & Ernest Orlando Lawrence Berkeley National Laboratory, 2009.
14R. H. Henninger, M. J. Witte, and D. B. Crawley, “Analytical and comparative testing of EnergyPlus using IEA HVACBESTEST E100-E200 test suite,” Energy Build. 36(8), 855–863 (2004).
15M. Wetter, “GenOpt, Generic Optimization Program. User Manual,” Lawrence Berkeley National Laboratory, TechnicalReport LBNL-54199, 2004, p. 109.
16M. Wetter, “Simulation-based building energy optimization,” Ph.D. dissertation (University of California, Berkeley, 2004).17C. Audet and J. E. Dennis, Jr., “Analysis of generalized pattern searches,” SIAM J. Opt. 13(3), 889–903 (2003).18M. Wetter and E. Polak, “Building design optimization using a convergent pattern search algorithm with adaptive preci-
sion simulations,” Energy Build. 37, 603–612 (2005).19R. Hooke and T. A. Jeeves, “Direct search solution of numerical and statistical problems,” J. Assoc. Comput. Mach. 8,
212–229 (1961).20Energy Efficiency & Renewable Energy, Weather Data, All Regions: Europe WMO Region 6: Serbia, US Department of
Energy, http://http://apps1.eere.energy.gov/buildings/energyplus/cfm/weather_data3.cfm/region=6_europe_wmo_re-gion_6/country=SRB/cname=Serbia#instructions, retrieved 4/15/2013.
21Report for year 2009 (in Serbian), Electric power industry of Serbia (EPS), Belgrade, 2010, http://www.eps.rs, retrieved6/17/2011.
22R. Hendron, R. Anderson, C. Christensen, M. Eastment, and P. Reeves, “Development of an energy savings benchmarkfor all residential end-uses,” in Proceedings of SimBuild 2004, IBPSA-USA National Conference, Boulder, CO, August4–6 2004.
041820-15 Skerlic et al. J. Renewable Sustainable Energy 5, 041820 (2013)
Downloaded 26 Aug 2013 to 35.8.11.2. This article is copyrighted as indicated in the abstract. Reuse of AIP content is subject to the terms at: http://jrse.aip.org/about/rights_and_permissions