may 2, 2016 consolidated financial results for the …...2016/05/17 · translation may 2, 2016...
TRANSCRIPT

Translation
May 2, 2016
Consolidated Financial Results for the Fiscal Year Ended March 31, 2016
<under Japanese GAAP>
Company name: TAIYO HOLDINGS CO., LTD. Listing: First Section of the Tokyo Stock Exchange Stock code: 4626 URL: http://www.taiyo-hd.co.jp Representative: Eiji Sato, President and CEO Inquiries: Hitoshi Inagaki, Manager, Office of President TEL: +81-3-5999-1511 Scheduled date of ordinary general meeting of shareholders: June 21, 2016 Scheduled date to commence dividend payments: June 22, 2016 Scheduled date to file annual securities report: June 24, 2016 Preparation of supplementary results briefing material on financial results: Yes Holding of financial results presentation meeting: Yes (for institutional investors, analysts and
individual investors)
(Millions of yen with fractional amounts discarded, unless otherwise noted)
1. Consolidated financial results for the fiscal year ended March 31, 2016 (from April 1,
2015 to March 31, 2016) (1) Operating results (Percentages indicate year-on-year changes.)
Net sales Operating income Ordinary income Profit attributable to owners of parent
Fiscal year ended Millions of yen % Millions of yen % Millions of yen % Millions of yen %
March 31, 2016 49,843 3.3 10,964 18.5 11,129 16.8 7,796 16.9
March 31, 2015 48,260 9.1 9,254 22.3 9,529 21.7 6,667 35.2
Note: Comprehensive income For the fiscal year ended March 31, 2016: 5,891 million yen [(42.2)%] For the fiscal year ended March 31, 2015: 10,199 million yen [26.1%]
Basic earnings per share
Diluted earningsper share
Return on equity Ordinary income/ total assets
Operating income/net sales
Fiscal year ended Yen Yen % % %
March 31, 2016 337.99 - 19.0 17.6 22.0
March 31, 2015 264.05 - 16.7 15.9 19.2
Reference: Share of (profit) loss of entities accounted for using equity method For the fiscal year ended March 31, 2016: – million yen For the fiscal year ended March 31, 2015: – million yen

(2) Financial position
Total assets Net assets Equity ratio Net assets per share
As of Millions of yen Millions of yen % Yen
March 31, 2016 65,464 45,250 65.9 1,865.94
March 31, 2015 61,241 41,312 63.8 1,703.14
Reference: Equity (Net assets excluding non-controlling interests) As of March 31, 2016: 43,115 million yen As of March 31, 2015: 39,073 million yen
(3) Cash flows
Net cash provided by (used in) operating
activities
Net cash provided by (used in) investing
activities
Net cash provided by (used in) financing
activities
Cash and cash equivalents at the
end of period
Fiscal year ended Millions of yen Millions of yen Millions of yen Millions of yen
March 31, 2016 10,546 (6,750) (2,740) 18,385
March 31, 2015 9,232 (2,913) (9,919) 18,183
2. Cash dividends Annual cash dividends
Total cash dividends
(Total)
Dividend payout ratio
(Consolidated)
Ratio of dividends to
net assets (Consolidated)
First quarter-
end
Second quarter-
end
Third quarter-
end
Fiscal year-end Total
Yen Yen Yen Yen Yen Millions of yen % %Fiscal year ended
March 31, 2015 – 45.00 – 45.00 90.00 2,186 34.1 5.5
Fiscal year ended March 31, 2016 – 55.00 – 55.00 110.00 2,547 32.5 6.2
Fiscal year ending March 31, 2017 (Forecasts)
– 55.00 – 55.00 110.00 46.2
Note: The cash dividends presented above are cash dividends related to common shares. Please refer to “Cash dividends for class shares,” presented below, for information on cash dividends for class shares (unlisted) that have a different relationship of rights compared with the common shares issued by the Company.
3. Consolidated earnings forecasts for the fiscal year ending March 31, 2017 (from April 1, 2016 to March 31, 2017)
(Percentages indicate year-on-year changes.)
Net sales Operating income Ordinary income Profit attributable to owners of parent
Basic earnings per
share
Millions of yen %
Millions of yen %
Millions of yen %
Millions of yen % Yen
Six months ending September 30, 2016 23,000 (9.5) 4,100 (29.4) 3,950 (32.9) 2,800 (31.5) 121.18
Fiscal year ending March 31, 2017 45,700 (8.3) 8,000 (27.0) 7,800 (29.9) 5,500 (29.5) 238.03
Note: For consolidated earnings forecasts for the fiscal year ending March 31, 2017, see the reference values in “Consolidated forecasts for the next fiscal year” on page 4 of the Attached Materials.

* Notes (1) Changes in significant subsidiaries during the period (changes in specified subsidiaries resulting in
the change in scope of consolidation): None (2) Changes in accounting policies, changes in accounting estimates, and restatement of prior period
financial statements after error corrections a. Changes in accounting policies due to revisions to accounting standards and other regulations: Yes b. Changes in accounting policies due to other reasons: None c. Changes in accounting estimates: None d. Restatement of prior period financial statements after error corrections: None Note: For details see “5. Consolidated Financial Statements, (5) Notes to consolidated financial statements (Changes in
accounting policies)” on page 23 of the Attached Materials.
(3) Number of issued shares (common shares)
a. Total number of issued shares at the end of the period (including treasury shares)
As of March 31, 2016 27,485,600 shares As of March 31, 2015 27,464,000 shares
b. Number of treasury shares at the end of the period
As of March 31, 2016 4,379,037 shares As of March 31, 2015 4,521,990 shares
c. Average number of outstanding shares during the period
Fiscal year ended March 31, 2016 23,066,770 shares Fiscal year ended March 31, 2015 25,249,372 shares
Notes: 1. First Series Class A shares have the equivalent rights with common shares in terms of rights to claim dividends and those to claim residual property distribution, and therefore, are included in the total number of issued shares at the end of the period and the average number of outstanding shares during the period.
2. The number of treasury shares includes the Company’s shares held by The Master Trust Bank of Japan, Ltd. (trust account for the Employee Stock Ownership Plan (ESOP) grant stock).
* Indication regarding execution of audit procedures
The completion of audit procedures in accordance with the Financial Instruments and Exchange Act is not required for preparing this financial results report. At the time of disclosure of this financial results report, the audit procedures for financial statements are in progress.
* Proper use of earnings forecasts, and other special matters
The forward-looking statements, including earnings forecasts, contained in these materials are based on information currently available to the Company and on certain assumptions deemed to be reasonable. The Company makes no promise regarding achievement of any content in the forward-looking statements. Actual business and other results may differ substantially due to various factors. Please refer to the section of “1. Analysis of operating results and financial position” on page 2 of the attached materials for the suppositions that form the assumptions for earnings forecasts and cautions concerning the use of business results forecasts.

Cash dividends for class shares The following is a breakdown of cash dividends per share related to class shares that have a different relationship of rights compared with common shares.
First Series Class A shares
Annual cash dividends
First quarter-end Second quarter-end Third quarter-end Fiscal year-end Total
Yen Yen Yen Yen YenFiscal year ended
March 31, 2015 – – – – –
Fiscal year ended March 31, 2016 – 55.00 – 55.00 110.00
Fiscal year ending March 31, 2017 (Forecasts)
– 55.00 – 55.00 110.00

- 1 -
Attached Materials Index 1. Analysis of operating results and financial position ............................................................................ 2
(1) Analysis of operating results ............................................................................................................ 2 (2) Analysis of financial position .......................................................................................................... 5 (3) Basic policy on profit distribution and dividends for the current fiscal year and next fiscal year ... 6 (4) Risk factors ...................................................................................................................................... 6
2. Overview of the corporate group ......................................................................................................... 8 3. Business policies ............................................................................................................................... 10
(1) Basic management policies ............................................................................................................ 10 (2) Mid- to long-term management strategies and current and future challenges ............................... 10 (3) Other significant matters concerning management ........................................................................ 11
4. Basic policy concerning the selection of accounting standards ......................................................... 11 5. Consolidated Financial Statements .................................................................................................... 12
(1) Consolidated balance sheet ............................................................................................................ 12 (2) Consolidated statement of income and consolidated statement of comprehensive income ........... 14
(Consolidated statement of income) .................................................................................................. 14 (Consolidated statement of comprehensive income) ......................................................................... 15
(3) Consolidated statement of changes in equity ................................................................................. 16 (4) Consolidated statement of cash flows ............................................................................................ 18 (5) Notes to consolidated financial statements .................................................................................... 20
(Notes on premise of going concern) ................................................................................................ 20 (Significant matters forming the basis of preparing the consolidated financial statements) ............. 20 (Changes in accounting policies) ....................................................................................................... 23 (Notes to consolidated statement of cash flows) ............................................................................... 24 (Segment information, etc.) ............................................................................................................... 25 (Per share information) ...................................................................................................................... 29 (Significant subsequent events) ......................................................................................................... 29

- 2 -
1. Analysis of operating results and financial position
- The following abbreviations of product group categories are used in this section. Abbreviation Meaning
PWB Printed Wiring Board
SR Solder Resist
PKG Semiconductor Package
FPD Flat Panel Display
PDP Plasma Display Panel
- This financial report includes information on the fiscal year ended March 31, 2016 (12
months from April 1, 2015 to March 31, 2016). The following abbreviations for the quarters are used in this section.
Abbreviation Meaning
First quarter First quarter consolidated accounting period (3 months from April 1 to June 30)
Second quarter Second quarter consolidated accounting period (3 months from July 1 to September 30)
Third quarter Third quarter consolidated accounting period (3 months from October 1 to December 31)
Fourth quarter Fourth quarter consolidated accounting period (3 months from January 1 to March 31)
(1) Analysis of operating results In the global economy during the fiscal year ended March 31, 2016, the U.S. economy recovered
modestly driven by low unemployment rate and a boost in consumer spending, and the European economy also continued on a recovery track. On the other hand, the trend of slowdown in the Chinese economy did not stop, and with the weakening domestic and external demands, manufacturing activities of companies also slowed down. Recovery of the Japanese economy came to a standstill, with weak consumer spending, etc.
In the electronics components industry, in which the Group operates, while demand for servers and vehicle installation parts remained firm, it was flat as a whole partly due to lackluster demand for materials for smartphones.
Under these conditions, net sales for the current fiscal year amounted to 49,843 million yen (up 3.3% year on year) mainly due to a weaker yen in the foreign exchange market.
In the PWB materials market, the sales volume for rigid board materials decreased year on year, but firm sales of high function products and yen depreciation in foreign exchange had an impact on results, which led to a year-on-year increase in net sales. As a result, net sales of PWB materials were 46,319 million yen (up 4.1% year on year).
In the FPD materials market, net sales decreased year on year, reflecting the end of manufacturing of PDP materials. As a result, net sales of FPD materials were 292 million yen (down 85.2% year on year).
As a result, operating income amounted to 10,964 million yen (up 18.5% year on year) with ordinary income at 11,129 million yen (up 16.8% year on year) and profit attributable to owners of parent at 7,796 million yen (up 16.9% year on year).

- 3 -
Sales results by product group category The following are sales results by product group category for the fiscal year ended March 31, 2016.
(Millions of yen)
Name of product group category
Previous fiscal year results
Current fiscal year results
Compared to the previous fiscal year
Change Rate of change (%)
PWB materials
Rigid board materials
33,539 35,242 1,702 5.1
PKG board and flexible board materials
9,844 10,007 163 1.7
Build-up board materials
1,091 1,069 (21) (2.0)
FPD materials
PDP materials
1,976 292 (1,684) (85.2)
Other related products
– 1,808 3,231 1,423 78.7
Total 48,260 49,843 1,583 3.3
Results by segment are as follows.
1) Japan The consolidated companies comprising the Japan segment are Taiyo Ink Mfg. Co., Ltd.
and Chugai Kasei Co., Ltd., manufacturing and marketing subsidiaries. Overall demand remained flat for the high function products of PWB materials. However,
the inclusion of Chugai Kasei Co., Ltd. in the scope of consolidation as of this first quarter ended June 30, 2016 had an impact, with the sales amount increasing year on year. On the other hand, the impact of upfront costs related to setting up the Kitakyushu Plant, Taiyo Ink Mfg. Co., Ltd.’s new factory, led profit to drop year on year.
As a result, net sales amounted to 17,002 million yen (up 7.7% year on year) with segment profit at 2,254 million yen (down 8.6% year on year).
2) China (including Hong Kong) The consolidated companies comprising the China segment are Taiyo Ink (Suzhou) Co.,
Ltd. and Onstatic Ink (Shenzhen) Co., Ltd., manufacturing and marketing subsidiaries, and Taiyo Ink International (HK) Limited and Taiyo Ink Trading (Shenzhen) Co., Ltd., marketing subsidiaries operating mainly in the southern China region. Onstatic Ink (Shenzhen) Co., Ltd. is a subsidiary of Onstatic Technology Co., Ltd.
In the PWB materials market, in addition to firm sales of materials for lighting and vehicle installation parts, yen depreciation in foreign exchange contributed to a year-on-year increase in net sales and profit.
As a result, net sales amounted to 21,820 million yen (up 6.9% year on year) with segment profit at 4,775 million yen (up 36.1% year on year).
3) Taiwan The consolidated companies comprising the Taiwan segment are manufacturing and
marketing subsidiaries Taiwan Taiyo Ink Co., Ltd., and Onstatic Technology Co., Ltd. (and other three subsidiaries).
In the PWB materials market, demand notably for materials for smartphones was lackluster. The sales amount, however, rose year on year, partly owing to the impact of yen depreciation in foreign exchange, in addition to the shift to higher-priced PWB materials from lower-priced PWB materials.
As a result, net sales amounted to 9,854 million yen (up 2.5% year on year) with segment profit at 2,227 million yen (up 26.3% year on year).

- 4 -
4) Korea The consolidated companies comprising the Korea segment are Taiyo Ink Co., (Korea)
Ltd., a manufacturing and marketing subsidiary and Taiyo Ink Products Co., Ltd., a marketing subsidiary.
While demand for high-price PKG board materials remained firm in the PWB materials market, in the FPD materials market, net sales decreased year on year, reflecting the end of manufacturing of PDP materials. On the other hand, profit increased year on year partly due to a weaker yen in the foreign exchange market.
As a result, net sales amounted to 7,739 million yen (down 15.9% year on year) with segment profit at 1,414 million yen (up 16.6% year on year).
5) Other The consolidated companies comprising the operations in areas other than the above are
Taiyo America, Inc. and Taiyo Ink International (Singapore) Pte Ltd. Taiyo America performed at the same level as the corresponding period of the previous
year. Taiyo Ink International (Singapore) performed steadily due to the expansion of the market
of material for vehicle installation parts and yen depreciation in foreign exchange contributed to a year-on-year increase in net sales and profit.
As a result, net sales amounted to 4,451 million yen (up 7.5% year on year) with segment profit at 597 million yen (up 7.7% year on year).
(Consolidated forecasts for the next fiscal year)
The operating environment in the next fiscal year ending March 31, 2017 is expected that demand for servers and vehicle installation parts will be firm in the electronics components industry in which the Group operates, while demand for small-sized information terminals, such as smartphones and tablet devices, and general home electric appliances will be low.
Moreover, since our ratio of overseas sales to net sales is high, our business performance is forecast to be affected by a further appreciation of yen in the next period.
Net sales (Millions of yen)
Operating income(Millions of yen)
Ordinary income(Millions of yen)
Profit attributable to owners of
parent (Millions of yen)
Basic earnings per share
(yen)
For the fiscal year ending March 31, 2017 (Forecast)
45,700 8,000 7,800 5,500 238.03
For the fiscal year ended March 31, 2016 (Actual results)
49,843 10,964 11,129 7,796 337.99
Rate of change (%) (8.3) (27.0) (29.9) (29.5) (29.6)
Forecast for fiscal year ending March 2017 is calculated with the average foreign exchange rate during the period of 105 yen/U.S. dollar. For reference, the following is earnings forecast for fiscal year ending March 2017 calculated with the average foreign exchange rate during the period of 120 yen/U.S. dollar, an equivalent level as for fiscal year ended March 2016:
(Percentages indicate year-on-year changes.)
Net sales Operating income Ordinary income Profit attributable to owners of parent
Basic earnings per share
Millions of yen %
Millions of yen %
Millions of yen %
Millions of yen % Yen
Six months ending September 30, 2016
26,200 3.1 5,100 (12.2) 5,000 (15.1) 3,550 (13.2) 153.64
Fiscal year ending March 31, 2017 51,200 2.7 10,100 (7.9) 9,900 (11.0) 7,000 (10.2) 302.94

- 5 -
(2) Analysis of financial position a. Positions of assets, liabilities and net assets
The following shows the positions of assets, liabilities and net assets as of March 31, 2016.
As of
March 31, 2015 As of
March 31, 2016Change
Main factors (comparison with the end of
the previous fiscal year) (Millions of yen) (Millions of yen) (Millions of yen)
Current assets 37,942 39,340 1,397Cash and deposits increased approx. 1,600 million yen, and merchandise and finished goods decreased approx. 300 million yen.
Non-current assets 23,298 26,124 2,825
Construction in progress decreased approx. 1,200 million yen, buildings and structures increased approx. 2,500 million yen, machinery and equipment increased approx. 700 million yen, and tools, furniture and fixtures increased approx. 400 million yen.
Total assets 61,241 65,464 4,223
Total liabilities 19,929 20,214 284Asset retirement obligations increased approx. 200 million yen.
Total net assets 41,312 45,250 3,938
Profit increased approx. 7,700 million yen, cash dividends paid of approx. 2,300 million yen, foreign currency translation adjustment decreased approx. 2,100 million yen.
Total liabilities and net assets
61,241 65,464 4,223
b. Cash flow position
The following is the position of cash flows for the fiscal year ended March 31, 2016.
Fiscal year ended March 31, 2016 (Millions of yen)
Main factors
Net cash provided by (used in) operating activities
10,546 Profit before income taxes provided approx. 11,100 million yen, depreciation provided approx. 1,800 million yen and income taxes paid used approx. 3,200 million yen
Net cash provided by (used in) investing activities
(6,750)
Purchase of property, plant and equipment used approx. 4,200 million yen, payments into time deposits used approx. 4,300 million yen, proceeds from withdrawal of time deposits provided approx. 2,700 million yen.
Net cash provided by (used in) financing activities
(2,740) Cash dividends paid used approx. 2,300 million yen.
Net increase (decrease) in cash and cash equivalents
38
Cash and cash equivalents at end of period
18,385

- 6 -
c. Trend of indicators The following is the transition of cash flow indicators.
Fiscal year ended
March 31, 2012
Fiscal year ended
March 31, 2013
Fiscal year ended
March 31, 2014
Fiscal year ended
March 31, 2015
Fiscal year ended
March 31, 2016
Equity ratio (%) 81.1 82.2 69.6 63.8 65.9
Equity ratio on mark-to-market basis (%)
138.7 156.0 133.1 158.3 134.5
Interest-bearing debt to cash flow ratio (year)
– – 0.9 0.9 0.8
Interest coverage ratio (times)
992.5 3,850.3 331.3 304.8 168.4
Equity ratio: (Net assets- Non-controlling interests)/Total assets Equity ratio on mark-to-market basis: Total market capitalization/Total assets Interest-bearing debt to cash flow ratio: Interest-bearing debt/Cash flow Interest coverage ratio: Operating cash flow/Interest paid (1) The above indicators are calculated based on consolidated financial figures. (2) Total market capitalization is calculated based on total number of issued shares at the fiscal year
end (excluding treasury shares) × stock market price at the fiscal year end (3) Net cash provided by (used in) operating activities stated in the consolidated statement of cash
flows is used for “Cash flows.” “Interest paid” are the amounts stated under interest expenses paid in the consolidated statement of cash flows.
(3) Basic policy on profit distribution and dividends for the current fiscal year and next fiscal
year The Company regards profit distribution to shareholders in cash as an important policy and will
effectuate a continuous, stable profit distribution at high levels. We use the dividend on equity ratio as our target index, keeping this figure at least 5% of consolidated financial results for the mid-to long-term.
In accordance with this policy, the Company paid an interim dividend of 55 yen per share. As already announced, we also plan to pay a year-end dividend of 55 yen and this will be placed
on the agenda of the next Ordinary General Meeting of Shareholders. This will result in an annual dividend of 110 yen per share for the current fiscal year.
Concerning dividends of the next fiscal year, we plan to pay an interim dividend of 55 yen and a year-end dividend of 55 yen, and this will result in an annual dividend of 110 yen per share and a rate of return to shareholders of 46.2%.
(4) Risk factors
The following are the main risks that may influence the business development of the Group.
a. Technological innovation risks Our Group is reliant on the manufacture and sale of PWB materials, and SR in particular, as a
major source of our income. If radical technological developments, such as electronic parts that do not use PWBs or PWBs that do not use SR, were to be widely adopted, this would result in a significant decrease in demand for our products.
From the viewpoint of product characteristics, operability, and economic viability, there is little possibility that such technological innovations will be widely adopted in the near future. However, the Company considers it as important issue in the field of research and development to find possible new methods for PWBs.
b. Risks associated with patents
In order for our Group to maintain a superior competitive position, efforts are being made to protect the products and technology we develop through patents and intellectual property. However, in the event a patent application, etc. does not result in the granting of rights or a third party requests invalidation, insufficient protection of our rights as a Group may result.

- 7 -
Moreover, infringing the intellectual property rights owned by a third party could impact the performance of our Group as a result of the payment of royalties or large amounts of damages.
c. Risk of major production facilities being affected by a disaster
Our Group has manufacturing bases in Japan, Taiwan, Korea, China and the United States. In the event that any of our manufacturing bases is damaged by a natural disaster and manufacturing functions are obstructed, manufacturing and supply functions would be switched to another manufacturing base as an emergency measure. However, this would require some preparation and adjustment and our business would be affected in the interim.
d. Risk related to procurement of raw materials
The Group procures many of its raw materials from external raw material manufacturers. Problems at these raw material manufacturers or a lack of supplies that hinder the Group’s production activities may affect the performance of the Group.
e. Country-specific risks related to business deployment overseas
Our Group conducts manufacturing activities in Japan, Taiwan, Korea, China, and the United States. Sales of our Group’s products particularly in China, Taiwan, Korea, ASEAN countries, and other Asian markets are expanding. Accordingly, terrorist activities, destabilization of the political situation, economic fluctuations, the outbreak of earthquakes and contagion, unforeseen changes to legal, regulatory or tax systems, and other country-specific risks could impact on the business strategies and performance of our Group.
f. Risk of exchange rate fluctuations
Our ratio of overseas sales to net sales is high and there are many instances when we calculate product prices in foreign currencies. Accordingly, our business performance is affected by fluctuations in exchange rates, with a highly appreciated yen normally leading to reduced income and profits.
g. Risk of price fluctuations in key products
PWB manufacturing is shifting to other Asian countries, especially China, and we are engaged in continuing price wars with rival companies including local companies as well as other Japanese firms regarding SR. There is also pressure to lower SR prices which has resulted from price competition in the PWB market. Because of this, there is a possibility that the price of our main product, SR, may drop thus affecting the performance of our Group.
h. Risks related to fluctuations in product demand
Demand for our Group’s main products is influenced by electronic components market trends, which may affect the performance of our Group.
i. Credit risks related to receivables
The Group has many customers and, although we do not concentrate an excessive amount of receivables on specific customers, the deterioration of the financial position of customers and the resulting bad debt may affect the performance of our Group.
j. Risks related to the soaring cost of raw materials
Due to the state of the oil market, the prices of certain raw materials have risen, which may affect the performance of our Group.

- 8 -
2. Overview of the corporate group The corporate group (hereinafter the Group) consists of TAIYO HOLDINGS CO., LTD. (filing company), seventeen subsidiaries and one associated company. Its principal business is the manufacturing and sales of PWB materials. [The Company and consolidated subsidiaries]
Relation to the filing company
Company name Main business
Filing company TAIYO HOLDINGS CO., LTD.
Development of management strategy for the Taiyo Holdings Group, management guidance for subsidiaries, and research and development of chemical products for use in electronic components
Consolidated subsidiary TAIYO INK MFG. CO., LTD.
Manufacturing, purchasing and sales of PWB materials and other chemical products for use in electronic components
Consolidated subsidiary CHUGAI KASEI CO., LTD. (Note 1)
Manufacturing and sales of dyes, pigments, chemicals and inks
Consolidated subsidiary TAIYO INK (SUZHOU) CO., LTD.
Manufacturing, purchasing and sales of PWB materials and other chemical products for use in electronic components
Consolidated subsidiary TAIWAN TAIYO INK CO., LTD.
Consolidated subsidiary Onstatic Technology Co., Ltd.
Consolidated subsidiary TAIYO INK CO., (KOREA) LTD.
Consolidated subsidiary TAIYO AMERICA, INC.
Consolidated subsidiary TAIYO INK INTERNATIONAL (HK) LIMITED
Purchasing and sales from associated companies, etc. of PWB materials and other chemical products for use in electronic components
Consolidated subsidiary TAIYO INK TRADING (SHENZHEN) CO., LTD.
Consolidated subsidiary TAIYO INK INTERNATIONAL (SINGAPORE) PTE LTD
Consolidated subsidiary TAIYO INK PRODUCTS CO., LTD. (Note 2)
[Non-consolidated subsidiaries]
Relation to the filing company
Company name Main business
Non-consolidated subsidiary
TAIYO INK (THAILAND) CO., LTD.
Technical services relating to PWB materials
Non-consolidated subsidiary
TAIYO GREEN ENERGY CO., LTD.
Electric power generation business by using natural energy, etc.
[Associated company]
Relation to the filing company
Company name Main business
Associated company Kowa Co., Ltd. Investments with respect to real estate and marketable securities
Notes: 1. Chugai Kasei Co., Ltd. is a consolidated subsidiary which the Company newly acquired shares of in the current fiscal year.
2. Taiyo Ink Products Co., Ltd. is a consolidated subsidiary which was newly established in the current fiscal year.

- 9 -
The organization chart is as follows.
Customers and distributors
TA
IYO
HO
LD
ING
S C
O.,
LT
D.
Consolidated subsidiaries
Technical services
TAIYO INK MFG. CO., LTD.
TAIWAN TAIYO INK CO., LTD.
TAIYO INK CO., (KOREA) LTD.
CHUGAI KASEI CO., LTD.
TAIYO AMERICA, INC.
TAIYO INK INTERNATIONAL (HK) LIMITED
TAIYO INK TRADING (SHENZHEN) CO., LTD.
TAIYO INK INTERNATION (SINGAPORE) PTE LTD
TAIYO INK (THAILAND) CO., LTD
Non-consolidated subsidiaries
Onstatic Technology Co., Ltd.
Manufacturing and sales companies
Sales companies
Bus
ines
s ou
tsou
rcin
g se
rvic
es
Products
Products
TAIYO GREEN ENERGY CO., LTD. Electric power
companies
Electricity sales (Solar power generation)
TAIYO INK (SUZHOU) CO., LTD.
TAIYO INK PRODUCTS CO., LTD.

- 10 -
3. Business policies (1) Basic management policies
The Group has identified its objectives as a corporate group in the Management Philosophy and Basic Management Policy below. The Group will develop by continuing the spirit of our management philosophy without changes and reviewing our basic management policy to match changes in the environment and strategy on a long-term basis. Management Philosophy We will realize “a pleasant society” by further advancing “every technology” the Group has and creating a wide range of products to help fulfill the dreams for the whole world with our innovative products. Basic Management Policy
1. We will generate revenue and increase corporate value, thereby contributing to the well-being and prosperity of customers, communities, shareholders, and employees.
2. We will discharge our corporate social responsibility with regard to the achievement of our management philosophy, including complying with the law, protecting the environment, ensuring thorough quality management, and contributing to society.
3. We will leverage our global system to always provide superior products and services. 4. We will constantly create opportunities for employees to challenge and develop themselves,
aiming to have a corporate group composed of people who are highly motivated to be successful and to achieve goals set by themselves.
5. We will increase our comprehensive corporate strengths by maximizing cooperation between the Group companies and strengthen the teamwork of all employees with emphasis on “speed and communication.”
6. We aim to have a group of global companies able to contribute to the realization of a pleasant society by constantly working for technological innovation and creating new products and businesses.
(2) Mid- to long-term management strategies and current and future challenges
The Group has a global top share in its mainstay SR market, and more than 80% of its sales are generated at overseas. For such reasons, the Group’s sales and profit are greatly affected by such external factors as the trends of overall SR market, especially that of final products that use semiconductors, and fluctuation of foreign currency rates. Under such circumstances, the Group’s top priority is to further expand its market share in the SR related products, to constantly launch new products that can be another source of profit following SR and to establish a corporate structure that can quickly turn such products into new businesses. By implementing various measures in line with the said policy, we believe that our Group will be able to grow perpetually.
1) Strengthening R&D structure We believe that development of the R&D system is essential to create new products on an
ongoing basis. We will implement role-sharing arrangement between basic research and product development by following a certain time axis. We will strengthen our basic research capability by forming an R&D team that specializes in mid-to-long-term research that is not directly linked to product commercialization. At the same time, we will set up a development team that will be engaged in the development of new technology to be turned into practical use and increase application of existing technology. By so doing, we aim to strengthen our ability to translate our basic research results into new product development. In addition, we will invest aggressively in new equipment for R&D and focus on hiring and fostering highly skilled researchers and technical personnel both in Japan and overseas.
2) Rapid commercialization of new products The Group considers that new product development is equivalent to new business
development since the Group is able to earn profit by marketing such products. For such reason, with a view to removing commercialization barrier, the Group will set up a task force consisting of selected personnel from marketing, manufacturing and development divisions

- 11 -
and give certain responsibility and authority to commercialize new products when they have come close to commercialization.
3) Encouraging initiative in talent For the Group to expand its share in the SR market while developing new businesses
constantly and put them on track to achieve perpetual growth, we believe it is indispensable to nurture many self-sufficient employees who can set their own goals and enjoy attaining them. We will actively exchange our personnel between group companies to give them opportunities to experience difficulties and successes in a variety of jobs in various countries. We will also promote competent personnel to managers flexibly both in Japan and overseas so that they can gain actual management experience, thereby nurturing self-sufficient personnel and ultimately managers who can lead the next generation.
4) Development of measures to reduce foreign currency risk Because sales prices of many of the Group’s products are denominated in foreign currency,
foreign currency rates fluctuation can easily affect the Group’s earnings. The Group recognizes that taking appropriate measures to mitigate foreign currency risk is important.
Therefore, the Group pursues “local production for local sales” strategy (our policy of making products close to markets where they are sold) and heightens the local procurement rate of raw materials to match the currency of revenue and expenditure. These measures will also contribute to enhance our ability to respond to our customers because they will lead to rapid development of products that meet customers’ needs, shorter order lead time, lower raw material cost and lower business maintenance risk thanks to diversification of raw materials suppliers.
(3) Other significant matters concerning management No items to report.
4. Basic policy concerning the selection of accounting standards The Group adopts the Japanese GAAP as the accounting standards in order to ensure comparability among other domestic companies in the same industry.

- 12 -
5. Consolidated Financial Statements
(1) Consolidated balance sheet
(Millions of yen)
As of March 31, 2015 As of March 31, 2016
Assets Current assets
Cash and deposits 19,766 21,408 Notes and accounts receivable - trade 13,111 12,836 Securities 0 –
Merchandise and finished goods 2,348 2,013 Work in process 291 410 Raw materials and supplies 1,886 1,593 Consumption taxes receivable 169 248 Deferred tax assets 99 72 Other 609 1,096 Allowance for doubtful accounts (341) (339)
Total current assets 37,942 39,340
Non-current assets Property, plant and equipment
Buildings and structures, net 8,014 10,523 Machinery, equipment and vehicles, net 1,970 2,764 Tools, furniture and fixtures, net 746 1,154 Land 4,342 4,616 Construction in progress 1,791 579 Other – 4
Total property, plant and equipment 16,865 19,644
Intangible assets Goodwill 4,849 4,432 Leasehold right 128 112 Software 306 339 Other 43 34
Total intangible assets 5,327 4,919
Investments and other assets Investment securities 361 656 Shares of subsidiaries and associates 39 39 Deferred tax assets 63 97 Net defined benefit asset 339 356 Other 303 413 Allowance for doubtful accounts (1) (1)
Total investments and other assets 1,106 1,561
Total non-current assets 23,298 26,124
Total assets 61,241 65,464

- 13 -
(Millions of yen)
As of March 31, 2015 As of March 31, 2016
Liabilities Current liabilities
Notes and accounts payable - trade 5,661 5,765 Short-term loans payable 729 932 Current portion of long-term loans payable 340 440 Accounts payable - other 2,032 1,697 Income taxes payable 1,139 776 Accrued expenses 313 310 Deferred tax liabilities 403 412 Provision for bonuses 384 398 Provision for directors’ bonuses 3 5 Other 48 160
Total current liabilities 11,056 10,898
Non-current liabilities Deferred tax liabilities 1,069 1,258 Long-term loans payable 7,685 7,413 Provision for directors’ retirement benefits 10 157 Net defined benefit liability – 116 Asset retirement obligations 55 331 Stock benefit allowance 42 27 Other 8 10
Total non-current liabilities 8,872 9,315
Total liabilities 19,929 20,214
Net assets Shareholders’ equity
Capital stock 6,134 6,188 Capital surplus 7,143 7,304 Retained earnings 36,997 42,490 Treasury shares (14,598) (14,141)
Total shareholders’ equity 35,676 41,841
Accumulated other comprehensive income Valuation difference on available-for-sale securities
110 96
Foreign currency translation adjustment 3,332 1,190 Remeasurements of defined benefit plans (46) (12)
Total accumulated other comprehensive income 3,396 1,274
Non-controlling interests 2,238 2,135
Total net assets 41,312 45,250
Total liabilities and net assets 61,241 65,464

- 14 -
(2) Consolidated statement of income and consolidated statement of comprehensive income
(Consolidated statement of income) (Millions of yen)
Fiscal year ended March 31, 2015
Fiscal year ended March 31, 2016
Net sales 48,260 49,843 Cost of sales 28,865 27,355
Gross profit 19,394 22,487
Selling, general and administrative expenses 10,139 11,522
Operating income 9,254 10,964
Non-operating income Interest income 113 103 Dividend income 13 8 Foreign exchange gains 127 24 Refunded consumption taxes 27 – Subsidy income 4 22 Other 89 106
Total non-operating income 376 265
Non-operating expenses Interest expenses 30 69 Loss on investments in partnership – 12 Commission for purchase of treasury shares 51 0 Other 19 18
Total non-operating expenses 101 100
Ordinary income 9,529 11,129
Extraordinary income Gain on sales of non-current assets 19 6 Gain on transfer of benefit obligation relating to employees’ pension fund
– 34
Gain on sales of investment securities 386 –
Total extraordinary income 406 40
Extraordinary losses Loss on sales of non-current assets 0 0 Impairment loss – 31 Loss on valuation of golf club membership 14 –
Total extraordinary losses 15 32
Profit before income taxes 9,920 11,137
Income taxes - current 2,670 2,855 Income taxes - deferred 277 153
Total income taxes 2,947 3,009
Profit 6,972 8,128
Profit attributable to non-controlling interests 305 331
Profit attributable to owners of parent 6,667 7,796

- 15 -
(Consolidated statement of comprehensive income)
(Millions of yen)
Fiscal year ended March 31, 2015
Fiscal year ended March 31, 2016
Profit 6,972 8,128 Other comprehensive income
Valuation difference on available-for-sale securities (125) (14) Foreign currency translation adjustment 3,323 (2,256) Remeasurements of defined benefit plans, net of tax 29 33
Total other comprehensive income 3,227 (2,236)
Comprehensive income 10,199 5,891
Comprehensive income attributable to Comprehensive income attributable to owners of parent
9,651 5,673
Comprehensive income attributable to non-controlling interests
548 217

- 16 -
(3) Consolidated statement of changes in equity
Fiscal year ended March 31, 2015 (Millions of yen)
Shareholders’ equity
Capital stock Capital surplus Retained earnings
Treasury shares Shareholders’
equity
Net assets 6,134 7,102 32,257 (5,373) 40,120
Cumulative effects of changes in accounting policies
362 362
Restated balance 6,134 7,102 32,619 (5,373) 40,483
Changes of items during period
Dividends of surplus (2,289) (2,289)
Profit (loss) attributable to owners of parent
6,667 6,667
Purchase of treasury shares
(9,519) (9,519)
Disposal of treasury shares
41 294 336
Net changes of items other than shareholders’ equity
Total changes of items during period
– 41 4,377 (9,225) (4,806)
Net assets 6,134 7,143 36,997 (14,598) 35,676
Accumulated other comprehensive income
Non-controlling
interests Net assets
Valuation difference
on available-for-sale
securities
Foreign currency
translation adjustment
Remeasure-ments of defined
benefit plans
Valuation and
translation adjustments
Net assets 235 328 (74) 489 2,045 42,655
Cumulative effects of changes in accounting policies
362
Restated balance 235 328 (74) 489 2,045 43,017
Changes of items during period
Dividends of surplus (2,289)
Profit (loss) attributable to owners of parent
6,667
Purchase of treasury shares
(9,519)
Disposal of treasury shares
336
Net changes of items other than shareholders’ equity
(125) 3,003 28 2,907 193 3,100
Total changes of items during period
(125) 3,003 28 2,907 193 (1,705)
Net assets 110 3,332 (46) 3,396 2,238 41,312

- 17 -
Fiscal year ended March 31, 2016
(Millions of yen)
Shareholders’ equity
Capital stock Capital surplus Retained earnings
Treasury shares Shareholders’
equity
Net assets 6,134 7,143 36,997 (14,598) 35,676
Changes of items during period
Dividends of surplus (2,303) (2,303)
Profit (loss) attributable to owners of parent
7,796 7,796
Issuance of new shares 53 53 106
Purchase of treasury shares
(0) (0)
Disposal of treasury shares
107 457 565
Net changes of items other than shareholders’ equity
Total changes of items during period
53 160 5,493 456 6,164
Net assets 6,188 7,304 42,490 (14,141) 41,841
Accumulated other comprehensive income
Non-controlling
interests Net assets
Valuation difference
on available-for-sale
securities
Foreign currency
translation adjustment
Remeasure-ments of defined
benefit plans
Valuation and
translation adjustments
Net assets 110 3,332 (46) 3,396 2,238 41,312
Changes of items during period
Dividends of surplus (2,303)
Profit (loss) attributable to owners of parent
7,796
Issuance of new shares 106
Purchase of treasury shares
(0)
Disposal of treasury shares
565
Net changes of items other than shareholders’ equity
(14) (2,141) 33 (2,122) (103) (2,225)
Total changes of items during period
(14) (2,141) 33 (2,122) (103) 3,938
Net assets 96 1,190 (12) 1,274 2,135 45,250

- 18 -
(4) Consolidated statement of cash flows
(Millions of yen)
Fiscal year ended March 31, 2015
Fiscal year ended March 31, 2016
Cash flows from operating activities Profit before income taxes 9,920 11,137 Depreciation 1,411 1,891 Loss (gain) on investments in partnership – 12 Impairment loss – 31 Loss (gain) on transfer of benefit obligation relating to employees’ pension fund
– (34)
Amortization of goodwill 253 280 Increase (decrease) in allowance for doubtful accounts
34 13
Increase (decrease) in allowance for stocks benefit 42 (15) Increase (decrease) in provision for bonuses 23 (11) Increase (decrease) in provision for directors’ retirement benefits
– 5
Increase (decrease) in provision for directors’ bonuses
(58) 1
Decrease (increase) in net defined benefit asset – 31 Increase (decrease) in net defined benefit liability (44) 11 Interest and dividend income (126) (112) Interest expenses 30 69 Tangible gain on sale of fixed assets (19) (6) Loss on sale of tangible fixed assets 0 0 Loss (gain) on sales of investment securities (386) – Loss on valuation of golf club memberships 14 – Decrease (increase) in notes and accounts receivable - trade
365 (592)
Decrease (increase) in inventories 274 464 Decrease (increase) in other current assets (217) 75 Increase (decrease) in notes and accounts payable - trade
(579) 349
Increase (decrease) in other current liabilities 30 141 Other, net 205 49
Subtotal 11,175 13,797
Interest and dividend income received 120 105 Interest expenses paid (30) (62) Income taxes paid (2,032) (3,293)
Net cash provided by (used in) operating activities 9,232 10,546
Cash flows from investing activities Payments into time deposits (2,188) (4,372) Proceeds from withdrawal of time deposits 1,579 2,708 Purchase of property, plant and equipment (2,710) (4,217) Proceeds from sales of property, plant and equipment 66 10 Purchase of software (127) (160) Purchase of investment securities – (114) Proceeds from sales of investment securities 571 – Payments for the acquisition of non-consolidated subsidiaries
(20) –
Purchase of shares of subsidiaries (33) – Payments of long-term loans receivable (30) (602) Collection of long-term loans receivable 16 21 Other, net (36) (23)
Net cash provided by (used in) investing activities (2,913) (6,750)

- 19 -
(Millions of yen)
Fiscal year ended March 31, 2015
Fiscal year ended March 31, 2016
Cash flows from financing activities Net increase (decrease) in short-term loans payable 136 261 Proceeds from long-term loans payable 6,632 500 Repayments of long-term loans payable (4,925) (984) Purchase of treasury shares (9,201) (0) Proceeds from sales of treasury shares 17 1 Cash dividends paid (2,289) (2,303) Dividends paid to non-controlling interests (290) (321) Proceeds from issuance of common shares – 106
Net cash provided by (used in) financing activities (9,919) (2,740)
Effect of exchange rate change on cash and cash equivalents
1,445 (1,017)
Net increase (decrease) in cash and cash equivalents (2,154) 38
Cash and cash equivalents at beginning of period 20,338 18,183 Increase in cash and cash equivalents due to stock exchange
– 163
Cash and cash equivalents at end of period 18,183 18,385

- 20 -
(5) Notes to consolidated financial statements
(Notes on premise of going concern) No items to report.
(Significant matters forming the basis of preparing the consolidated financial statements) 1) Scope of consolidation
Number of consolidated subsidiaries: 15 Number of non-consolidated subsidiaries: 2 Names of consolidated subsidiaries: TAIYO INK MFG. CO., LTD., CHUGAI KASEI CO., LTD., TAIYO INK (SUZHOU) CO., LTD., TAIWAN TAIYO INK CO., LTD., Onstatic Technology Co., Ltd., TAIYO INK CO., (KOREA) LTD., TAIYO AMERICA, INC., TAIYO INK INTERNATIONAL (HK) LIMITED, TAIYO INK TRADING (SHENZHEN) CO., LTD., TAIYO INK INTERNATIONAL (SINGAPORE) PTE LTD., TAIYO INK PRODUCTS CO., LTD. Among the above subsidiaries, Chugai Kasei Co., Ltd. is included within the scope of consolidation because the Company newly acquired its shares in the current fiscal year. Taiyo Ink Products Co., Ltd. is included within the scope of consolidation because it was newly established in the current fiscal year. The number of consolidated subsidiaries under the Company is 15, as Onstatic Technology Co., Ltd. owns four associated companies under its umbrella. Names of non-consolidated subsidiaries: TAIYO INK (THAILAND) CO., LTD. and TAIYO GREEN ENERGY CO., LTD. The non-consolidated subsidiaries were excluded from the scope of consolidation because they are small in size, and its accounts, such as total assets, net sales, profit or loss (for the Company’s equity interest) and retained earnings (for the Company’s equity interest), have no significant effects on the Company’s consolidated financial statements.
2) Fiscal year-end of consolidated subsidiaries
Among the consolidated subsidiaries, the fiscal year-end of Taiyo Ink (Suzhou) Co., Ltd. and Taiyo Ink Trading (Shenzhen) Co., Ltd. is December 31. Taiyo Ink (Suzhou) Co., Ltd. and Taiyo Ink Trading (Shenzhen) Co., Ltd. perform tentative closings and prepare financial statements as of and for the period ended March 31. Among the consolidated subsidiaries, the fiscal year-end of Onstatic Technology Co., Ltd. is December 31, which is different from the consolidated fiscal year-end. However, since the difference between the fiscal year-end of the subsidiary and the consolidated fiscal year-end does not exceed three months, consolidated financial statements are prepared based on the financial statements of the said subsidiary. However, adjustments required for consolidated financial statements were made on the significant matters which occurred during the consolidated fiscal period from January 1, 2016 to March 31, 2016. Fiscal year-ends of other consolidated subsidiaries coincide with that for consolidated financial statements.
3) Application of the equity method Status of non-consolidated subsidiaries outside the scope of equity method application Non-consolidated subsidiaries are excluded from the scope of equity method application, since they
have no significant impact on the Company’s profit or loss (for the Company’s equity interest) and retained earnings (for the Company’s equity interest), and have no materiality as a whole.
4) Bases for accounting policies
I. Valuation bases and methods for significant assets i Securities
Shares of non-consolidated subsidiaries to which the equity method was not applied Stated at cost using the moving-average method.
Other securities (available-for-sale securities) Securities with fair market value

- 21 -
Stated at market value based on fair market value etc. as of the closing date (Net unrealized holding gains or losses, net of the applicable income taxes, are directly included in a component of shareholders’ equity. The cost of securities sold is measured using the moving-average method)
Securities with no fair market value Stated at cost using the moving-average method Regarding contributions to investment partnership (which are deemed as securities pursuant to Article 2, Paragraph 2 of the Financial Instruments and Exchange Act), the net amount equivalent to the Company’s equity interest is included, based on the available financial statements, etc. depending on the reporting day of financial results prescribed in the partnership agreement.
ii Derivatives Stated at fair market value
iii Inventories Mainly stated at moving-average cost (figures on the balance sheet are adjusted by writing down the book value where the profitability declines.)
II Method of depreciation for significant depreciable assets i Property, plant and equipment
Buildings: Depreciated mainly by the straight-line method
Property, plant and equipment other than buildings: Depreciated mainly by the declining-balance method
Useful lives of major property, plant and equipment are as follows. Buildings and structures 7 - 60 years Machinery, equipment and vehicles 4 - 10 years Tools, furniture and fixtures 3 - 8 years
ii Intangible assets Leasehold right:
Amortized by the straight-line method Software (for internal use):
Amortized by the straight-line method over the internally estimated useful life of the software (5 years)
Others: Amortized by the straight-line method
Useful lives of major intangible assets are as follows: Leasehold right 50 years Software (for internal use) 5 years
III Accounting for significant reserves i Allowance for doubtful accounts
To provide reserve for potential losses from bad debts, the Company recognizes and records allowance for doubtful accounts based on historical uncollectible rate for general accounts receivables, and on an estimate of collectability of specific accounts for which collection appears doubtful.
ii Provision for bonuses Provision for bonuses are recorded by the Company and certain consolidated subsidiaries to accrue the bonus to employees for the fiscal year.
iii Provision for directors’ bonuses To prepare for the payment of bonuses to directors and corporate auditors, the projected payment amount attributable to the current fiscal year is provided.
iv Provision for directors’ retirement benefits To prepare for the payment of directors’ and corporate auditors’ retirement benefits, the Company provides the amount of projected payments, determined according to internal rules for the payment of directors’ and corporate auditors’ retirement benefits as of the end of the fiscal year. The Company, at a meeting of the Board of Directors held on April 22, 2010, resolved to abolish the directors’ retirement benefits system and the agenda item regarding lump-sum payments resulting

- 22 -
from said abolishment was approved at the 64th General Meeting of Shareholders held on June 29, 2010. These payments will be effected as retirement benefits paid at the time of retirement according to the period of service up to the abolishment of the system. The increase in provision for directors’ retirement benefits in the fiscal year ended March 31, 2016 was due to Chugai Kasei Co., Ltd. which became a consolidated subsidiary from the current fiscal year.
v Stock benefit allowance To prepare for the grant of the Company’s shares to employees in accordance the regulations for the delivery of stock, the Company records the amount decided based on liability for stock benefit estimated as of March 31, 2016.
IV Accounting treatment related to retirement benefits i Method of attributing the projected benefits to periods of service
In calculation of retirement benefit obligations, the method of attributing the projected benefits to periods until the end of the current fiscal year is based on the benefit formula basis.
ii Method of amortization of actuarial gains or losses and prior service cost Prior service cost will be recognized as expenses mainly by amortizing the amount by the straight-line method over a certain period of time (mainly five years) which is shorter than the employees’ average remaining service period. Actuarial gains or losses are mainly amortized as incurred over the periods, which are shorter than the average remaining service years of employees (mainly five years), by the straight-line method, starting from the following fiscal years. Unrecognized actuarial gain or loss and unrecognized prior service cost are recorded in remeasurements of defined benefit plans in accumulated other comprehensive income under the section of net assets after adjusting tax effect.
V Basis of translation from significant foreign currency-denominated assets and liabilities to yen Foreign currency-denominated monetary claims and liabilities are translated to yen with the spot exchange rate of the consolidated balance sheet date with translation differences charged to profit and loss in the corresponding fiscal year. Assets and liabilities of overseas consolidated subsidiaries are translated to yen with the spot exchange rate of the consolidated balance sheet date. Revenue and expenses thereof are translated to yen with the average exchange rate during the period. Exchange differences are included in foreign currency translation adjustment and non-controlling interests in the section of net assets.
VI Important methods of hedge accounting i. Methods of hedge accounting Deferred hedge accounting is adopted. For investment in equities of overseas consolidated
subsidiaries, the amount of foreign currency difference incurred by hedging instruments is included in foreign currency translation adjustment. Hedging transactions using interest rate swaps are accounted for by the exceptional treatment, as they meet conditions required for the exceptional treatment.
ii. Hedging instruments and hedged items Hedging instrument Hedged item
Loans payable denominated in foreign currencies
Equity investments in overseas consolidated subsidiaries
Interest rate swaps Long-term loans payable (including current portion of long-term loans payable)
iii. Hedging policy The Company has the policy of using, within the scope of hedged items, hedging instruments
for the purpose of avoiding exchange rate fluctuation risks arising from equity investments in overseas consolidated subsidiaries and interest rate fluctuation risks exposed by loans payable.
iv. Methods to evaluate hedging effectiveness As to equity investments in overseas consolidated subsidiaries, hedging effectiveness is
evaluated based on fluctuation amounts of hedged items and hedging instruments by comparing

- 23 -
cumulative results of market fluctuations between hedged items and hedging instruments during the period between the start of hedging and the point of the determination of effectiveness.
The evaluation of hedging effectiveness is omitted in transactions using interest rate swaps which are accounted for by the exceptional treatment.
VII Goodwill amortization method and period
Goodwill is amortized by the straight-line method over 5 years or 20 years.
VIII Scope of cash and cash equivalents on the consolidated statement of cash flows Consists of cash on hand, deposits that can be quickly accessed, and easily convertible short-term investments that are only mildly affected by market price fluctuations, that mature within three months of acquisition, or the redemption date is not more than three months away.
IX Other significant matters for preparation of consolidated financial statements i. Treatment of consumption taxes Treatment of consumption taxes is based on the tax excluded method. ii. Application of consolidated tax system The consolidated tax system is adopted.
(Changes in accounting policies) (Application of Accounting Standard for Business Combinations, etc.) Effective from the fiscal year ended March 31, 2016, the Company has applied the “Accounting Standard for Business Combinations” (ASBJ Statement No. 21, September 13, 2013), the “Accounting Standard for Consolidated Financial Statements” (ASBJ Statement No. 22, September 13, 2013), and the “Accounting Standard for Business Divestitures” (ASBJ Statement No. 7, September 13, 2013), etc. As a result, the method of recording the amount of difference caused by changes in the Company’s ownership interests in subsidiaries in the case of subsidiaries under ongoing control of the Company was changed to one in which it is recorded as capital surplus, and the method of recording acquisition-related costs was changed to one in which they are recognized as expenses for the fiscal year in which they are incurred. Furthermore, for business combinations carried out on or after the beginning of the fiscal year ended March 31, 2016, the accounting method was changed to one in which the reviewed acquisition cost allocation resulting from the finalization of the provisional accounting treatment is reflected in the quarterly consolidated financial statements for the fiscal year to which the date of business combination belongs. In addition, the presentation method for “net income” and other related items was changed, and the presentation of “minority interests” was changed to “non-controlling interests.” To reflect these changes, the Company has reclassified its full-year consolidated financial statements for the previous fiscal year. Application of the Accounting Standard for Business Combinations, etc. is in line with the transitional measures provided for in paragraph 58-2 (4) of the Accounting Standard for Business Combinations, paragraph 44-5 (4) of the Accounting Standard for Consolidated Financial Statements and paragraph 57-4 (4) of the Accounting Standard for Business Divestitures. The Company is applying the said standard, etc. prospectively from the beginning of the fiscal year ended March 31, 2016. As a result, the changes in operating income, ordinary income and Profit before income taxes amount to a decrease of 68 million yen for each of the aforementioned. There is no impact on the capital surplus as of March 31, 2016. In the consolidated statements of cash flows for the fiscal year ended March 31, 2016, cash flows related to the purchase or sales of investments in subsidiaries that do not result in changes in the scope of consolidation are stated in “net cash provided by (used in) financing activities.” Cash flows for expenses associated with the purchase of investments in subsidiaries that do result in changes in the scope of subsidiaries and cash flows for expenses associated with the purchase or sales of investments in subsidiaries that do not result in changes in the scope of consolidation are stated in “net cash provided by (used in) operating activities.”

- 24 -
(Changes in presentation methods) (Consolidated balance sheet) Since “long-term loans receivable” under “investments and other assets” set down separately until the previous fiscal year lacks monetary significance, it is included in “other” under “investments and other assets” for the current fiscal year. To reflect this change in presentation methods, the Company has reclassified its consolidated financial statements for the previous fiscal year. As a result, 2 million yen presented as “long-term loans receivable” under “investments and other assets” in the consolidated balance sheet for the previous fiscal year is reclassified as “other” under investments and other assets.
(Notes to consolidated statement of cash flows) Since “increase (decrease) in accrued consumption taxes” under “cash flows from operating activities” set down separately until the previous fiscal year lacks monetary significance, it is included in “other” for the current fiscal year. To reflect this change in presentation methods, the Company has reclassified its consolidated financial statements for the previous fiscal year. As a result, (21) million yen presented as “increase (decrease) in accrued consumption taxes” under “cash flows from operating activities” in the consolidated statement of cash flows for the previous fiscal year is reclassified as “other.” While the gross amounts were presented for “increase in short-term loans payable” and “decrease in short-term loans payable” under “cash flows from financing activities” until the previous fiscal year, since they are short-term and quickly revolving items, their net amounts are presented as “net increase (decrease) in short-term loans payable” for the current fiscal year. To reflect this change in presentation methods, the Company has reclassified its consolidated financial statements for the previous fiscal year. As a result, 1,808 million yen presented as “increase in short-term loans payable” and (1,671) million yen as “decrease in short-term loans payable” under “cash flows from financing activities” in the consolidated statement of cash flows for the previous fiscal year is reclassified as 136 million yen of “net increase (decrease) in short-term loans payable.”

- 25 -
(Segment information, etc.)
[Segment information]
I Fiscal year ended March 31, 2015 (From April 1, 2014 to March 31, 2015) 1. Overview of reportable segments
The reportable segments of the Group are components of the Group whose separate financial information is available. These segments are periodically evaluated by the Board of Directors in deciding how to allocate management resources and in assessing the performance. The business of the Group consists mainly of one activity, the manufacturing and marketing of solder resist for PWBs, among others. Each Group company formulates comprehensive strategies and deploys business activities, operating under a holding company system whereby the Company is the holding company. The Company is composed of four reportable segments divided by geographic area, namely “Japan,” “China,” “Taiwan,” and “Korea,” based on our manufacturing and marketing system. On February 20, 2015, the Group liquidated one of the subsidiaries of Onstatic Technology Co., Ltd. (and other five subsidiaries) during the fiscal year ended March 31, 2015. The liquidated subsidiary was included in Taiwan segment.
2. Information on the calculation of net sales, profit or loss, assets and liabilities, and other items by
reportable segment Accounting method applied to data in the reportable segment is mostly the same as the method stated in the “Significant matters forming the basis of preparing the consolidated financial statements.” Profit by reportable segment represents operating income. Inter-segment revenue and transactions are based on the market prices.
3. Information regarding net sales, profit or loss, assets and liabilities, and other items by reportable
segment
(Millions of yen)
Reportable segments Other
(Note 2) Total
Japan China
(Note 1) (Note 4)
Taiwan (Note 4)
Korea Total
Net sales
External sales 9,410 18,837 7,141 8,835 44,225 4,034 48,260
Inter-segment sales or transactions
6,375 1,583 2,472 363 10,795 106 10,901
Total sales 15,786 20,421 9,614 9,199 55,021 4,140 59,161
Segment profit 2,466 3,507 1,763 1,212 8,950 555 9,505
Segment assets 12,617 15,079 14,682 8,612 50,992 2,419 53,411
Other items
Depreciation (Note 3) 398 237 207 154 997 14 1,012
Increase in property, plant and equipment and intangible assets
2,033 414 98 108 2,655 16 2,672
Notes: 1. The “China” segment covers local subsidiaries in China and Hong Kong. 2. The “Other” segment is not included in reportable segments and covers the business activities of local subsidiaries in
the U.S. and other Asian countries. 3. Depreciation does not include goodwill amortization. 4. The net sales and operating income of Onstatic Technology Co., Ltd. (and other four subsidiaries) have been
presented in the Taiwan and China segments. As one of the subsidiaries of Onstatic Technology Co., Ltd. does not operate any business, it does not constitute a
reportable segment.

- 26 -
4. Differences between total amounts in reportable segments and the amount recorded on consolidated financial statements, and details of thereof (reconciliation)
(Millions of yen)
Profit/Loss Fiscal year ended March 31,
2015
Reportable segments total 8,950
“Other” segment profit 555
Inter-segment eliminations 85
Amortization of goodwill (253)
Profit/loss not allocated to business segments (Note) (65)
Other adjusted amounts (17)
Operating income in the consolidated statement of income 9,254
Note: Profit/loss primarily related to the holding company (company filing the consolidated financial statements).
(Millions of yen)
Assets Fiscal year ended March 31,
2015 Reportable segments total 50,992
“Other” segment assets 2,419
Inter-segment eliminations (9,307)
Assets not allocated to business segments (Note) 17,141
Reclassification by tax effect accounting (4)
Total assets in the consolidated balance sheet 61,241
Note: Assets primarily related to the holding company (company filing the consolidated financial statements).
(Millions of yen)
Other items
Reportable segment total
Other Adjustments (Note) Amount on the
consolidated financial statements
FY ended March 31, 2015
FY ended March 31, 2015
FY ended March 31, 2015
FY ended March 31, 2015
Depreciation 997 14 399 1,411
Increase in property, plant and equipment and intangible assets
2,655 16 649 3,321
Note: Primarily related to the holding company (company filing the consolidated financial statements).

- 27 -
II Fiscal year ended March 31, 2016 (From April 1, 2015 to March 31, 2016) 1. Overview of reportable segments
The reportable segments of the Group are components of the Group whose separate financial information is available. These segments are periodically evaluated by the Board of Directors in deciding how to allocate management resources and in assessing the performance. The business of the Group consists mainly of one activity, the manufacturing and marketing of solder resist for PWBs, among others. Each Group company formulates comprehensive strategies and deploys business activities, operating under a holding company system whereby the Company is the holding company. The Company is composed of four reportable segments divided by geographic area, namely “Japan,” “China,” “Taiwan,” and “Korea,” based on our manufacturing and marketing system.
2. Information on the calculation of net sales, profit or loss, assets and liabilities, and other items by
reportable segment Accounting method applied to data in the reportable segment is mostly the same as the method stated in the “Significant matters forming the basis of preparing the consolidated financial statements.” Profit by reportable segment represents operating income. Inter-segment revenue and transactions are based on the market prices.
3. Information regarding net sales, profit or loss, assets and liabilities, and other items by reportable
segment
(Millions of yen)
Reportable segments Other
(Note 3) Total
Japan China
(Note 1) (Note 2)
Taiwan (Note 2)
Korea Total
Net sales
External sales 10,565 20,687 6,864 7,385 45,502 4,340 49,843
Inter-segment sales or transactions
6,437 1,132 2,990 353 10,914 110 11,024
Total sales 17,002 21,820 9,854 7,739 56,417 4,451 60,868
Segment profit 2,254 4,775 2,227 1,414 10,671 597 11,269
Segment assets 16,214 14,847 9,362 7,724 48,148 2,393 50,541
Other items
Depreciation (Note 4) 832 288 189 134 1,444 16 1,461
Increase in property, plant and equipment and intangible assets
2,586 348 94 74 3,105 8 3,114
Notes: 1. The “China” segment covers local subsidiaries in China and Hong Kong. 2. The net sales and operating income of Onstatic Technology Co., Ltd. (and other four subsidiaries) have been
presented in the China and Taiwan segments. The Group liquidated one company of Onstatic Technology Co., Ltd. (and other four subsidiaries) as of February 20,
2015. As one of the subsidiaries of Onstatic Technology Co., Ltd. does not operate any business, it does not constitute a
reportable segment. 3. The “Other” segment is not included in reportable segments and covers the local subsidiaries in the U.S. and other
Asian countries. 4. Depreciation does not include goodwill amortization.

- 28 -
4. Differences between total amounts in reportable segments and the amount recorded on consolidated financial statements, and details of thereof (reconciliation)
(Millions of yen)
Profit/Loss Fiscal year ended March 31,
2016
Reportable segments total 10,671
“Other” segment profit 597
Inter-segment eliminations 222
Amortization of goodwill (280)
Profit/loss not allocated to business segments (Note) (246)
Other adjusted amounts 0
Operating income in the consolidated statement of income 10,964
Note: Profit/loss primarily related to the holding company (company filing the consolidated financial statements).
(Millions of yen)
Assets Fiscal year ended March 31,
2016 Reportable segments total 48,148
“Other” segment assets 2,393
Inter-segment eliminations (4,656)
Assets not allocated to business segments (Note) 19,655
Reclassification by tax effect accounting (75)
Total assets in the consolidated balance sheet 65,464
Note: Assets primarily related to the holding company (company filing the consolidated financial statements).
(Millions of yen)
Other items
Reportable segment total
Other Adjustments (Note) Amount on the
consolidated financial statements
FY ended March 31, 2016
FY ended March 31, 2016
FY ended March 31, 2016
FY ended March 31, 2016
Depreciation 1,444 16 429 1,891
Increase in property, plant and equipment and intangible assets
3,105 8 941 4,055
Note: Primarily related to the holding company (company filing the consolidated financial statements).
- 29 -
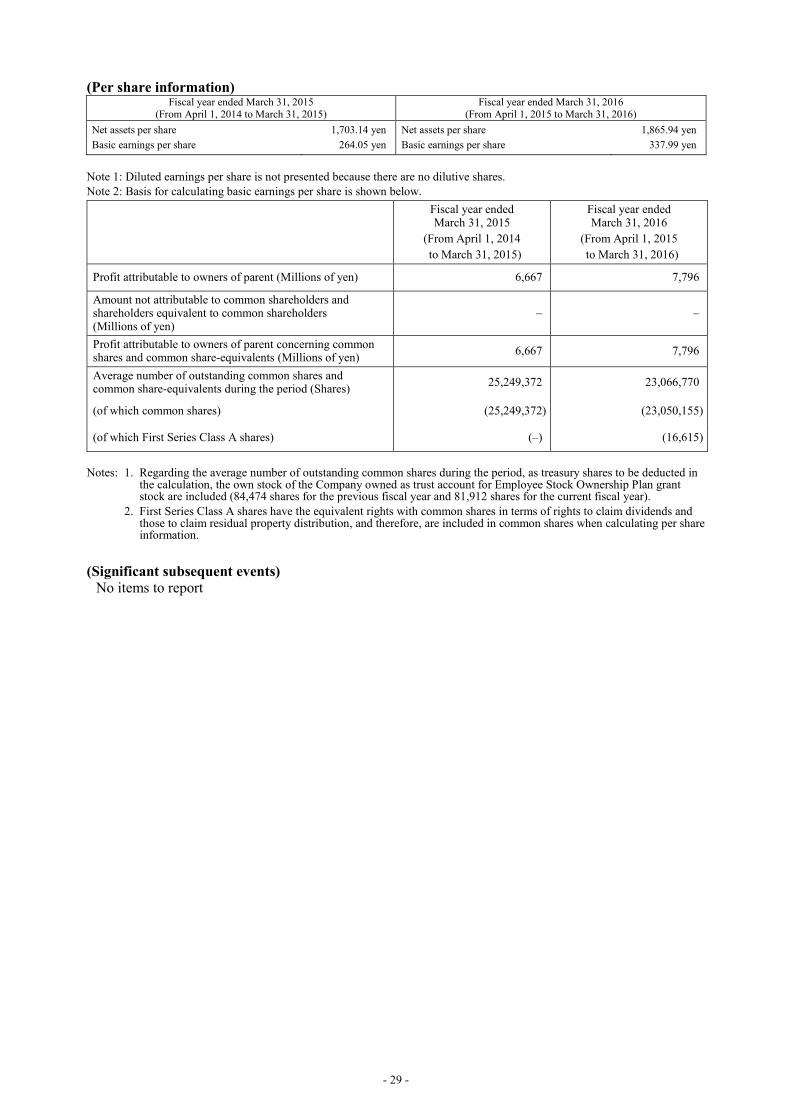
(Per share information) Fiscal year ended March 31, 2015
(From April 1, 2014 to March 31, 2015) Fiscal year ended March 31, 2016
(From April 1, 2015 to March 31, 2016)
Net assets per share 1,703.14 yen Net assets per share 1,865.94 yen
Basic earnings per share 264.05 yen Basic earnings per share 337.99 yen
Note 1: Diluted earnings per share is not presented because there are no dilutive shares. Note 2: Basis for calculating basic earnings per share is shown below.
Fiscal year ended March 31, 2015
(From April 1, 2014 to March 31, 2015)
Fiscal year ended March 31, 2016
(From April 1, 2015 to March 31, 2016)
Profit attributable to owners of parent (Millions of yen) 6,667 7,796
Amount not attributable to common shareholders and shareholders equivalent to common shareholders (Millions of yen)
– –
Profit attributable to owners of parent concerning common shares and common share-equivalents (Millions of yen)
6,667 7,796
Average number of outstanding common shares and common share-equivalents during the period (Shares)
25,249,372 23,066,770
(of which common shares) (25,249,372) (23,050,155)
(of which First Series Class A shares) (–) (16,615)
Notes: 1. Regarding the average number of outstanding common shares during the period, as treasury shares to be deducted in
the calculation, the own stock of the Company owned as trust account for Employee Stock Ownership Plan grant stock are included (84,474 shares for the previous fiscal year and 81,912 shares for the current fiscal year).
2. First Series Class A shares have the equivalent rights with common shares in terms of rights to claim dividends and those to claim residual property distribution, and therefore, are included in common shares when calculating per share information.
(Significant subsequent events)
No items to report