may 2007 monthly financial report - st. vrain valley … south pratt parkway longmont, colorado...
TRANSCRIPT

395 South Pratt Parkway Longmont , Colorado 80501-6499
May 2007
Monthly Financial Report
“Our mission is to educate each student in a safe learning environment so that they may develop to their highest potential
and become contributing citizens.”


GENERAL FUND The General Fund is a governmental fund that is the general operating fund of the district. The General Fund reports such expendi tures as salar ies, benef i ts , purchased services, supplies and materials, capital outlay, other expenses, and transfers for the area of instruction, student services, instructional support, professional and technical support, capital reserve/self -insurance transfer, and contingency reserves.

2006 2007Assets
Cash and investments 14,301,440$ 14,813,291$ Accounts receivable 1,109 1,401Taxes receivable 15,203,607 16,761,741 ADue from other funds - - Inventories 391,945 319,743
Total assets 29,898,101$ 31,896,176$
LiabilitiesAccounts payable 7,080$ -$ State loan payable - - Due to other funds - -
Accrued salaries and benefits 13,497,800 14,690,881 BDeferred revenues 16,851,094 18,255,694 A, C
Total liabilities 30,355,974 32,946,575
Fund balancesReserved for inventories 391,945 319,743Reserved for statutory requirements 3,457,621 3,671,313Unreserved (4,307,439) (5,041,455)
Total fund balance (457,873) (1,050,399)
Total liabilities and fund balance 29,898,101$ 31,896,176$
Footnote:
A On January 1, when property taxes were levied, the District recorded property taxesreceivable and a corresponding deferred revenue. As taxes are collected, the Districtwill reduce the receivable and deferred revenue and record the tax revenue.
B The District is accruing salaries and benefits of employees whose contracts run fromSeptember 1 through August 31. The accrual rate is 1/10 of the contract amount permonth. As of June 30, the District will have accrued the full amount of salariesand benefits payable.
C In addition to property taxes recorded January 1, the deferred revenue represents theamount to be recognized from the District's forward investment agreements enteredinto in June 2003. A portion of the deferred revenue is recognized each month inaccordance with the agreements.
St. Vrain Valley School District RE-1JGeneral Fund (10)
Balance Sheet (Unaudited)As of May 31,
2

St. Vrain Valley School District RE-1JGeneral Fund (10)Year-to-Date Actual to Actual (Unaudited)Statement of Revenues, Expenditures, and Changes in Fund BalanceFor the period July 1 to May 31
FY06 FY07July - May July - May Dollar Percent
Actual Actual Variance Variance1 Revenues2 Local3 Property taxes, 1110,1111,1140,1141,1190,and PY 34,438,296$ 35,340,235$ 901,939$ 2.62%4 Specific ownership taxes, 1120 5,018,616 5,004,911 (13,705) -0.27%5 Investment income, 1510 452,037 701,430 249,393 55.17%6 Charges for service : Spec'l educ tuition,1323,1324,1340297,987 613,185 315,198 105.78%7 Miscellaneous , 1910,1951,1990,1999,2000s 293,278 352,343 59,065 20.14%8 Total local revenues 40,500,214 42,012,104 1,511,890 3.73%9 State
10 Equalization, net, 3110, 3210, 5621, 5664, 5819 66,889,067 72,058,054 5,168,987 7.73%11 Special Education : Excep'l child educ act, 3130 2,534,835 2,783,839 249,004 9.82%12 Vocational Education , 3120 278,165 43,652 (234,513) -84.31%13 Transportation , 3160 823,982 941,456 117,474 14.26%14 Gifted and Talented , 3150 148,870 197,995 49,125 33.00%15 English Language Proficiency Act, 3140 109,729 191,358 81,629 74.39%16 Senior Tax Exemption - 636,847 636,847 N/A17 Total state revenues 70,784,648 76,853,201 6,068,553 8.57%18 Federal19 Adult Education , 4000 - 115,709 115,709 N/A20 BOCES 19,493 - (19,493) -100.00%21 Emergency Impact Aid for Displaced Students 39,105 18,843 (20,262) -51.81%22 Total federal revenues 58,598 134,552 75,954 129.62%
23 Total revenues 111,343,460 118,999,857 7,656,397 6.88%2425 Expenditures26 Salaries , all 0100's 79,723,614 86,877,255 (7,153,641) -8.97%27 Benefits , all 0200's 16,568,745 18,787,805 (2,219,060) -13.39%28 Purchased services , all 0300's, 0400's ,0500's 5,675,286 6,702,877 (1,027,591) -18.11%29 Supplies and materials , all 0600's 7,532,407 7,068,508 463,899 6.16%30 Other (dues and fees/field trips), 0800, 0900 45,264 115,518 (70,254) -155.21%31 Allocation to charter schools 5,735,709 7,198,792 (1,463,083) -25.51%32 Capital outlay, 0700 339,645 550,682 (211,037) -62.13%
33 Total expenditures 115,620,670 127,301,437 (11,680,767) -10.10%3435 Excess (deficiency) of revenues 36 over (under) expenditures (4,277,210) (8,301,580) (4,024,370) 94.09%3738 Other Financing Uses39 Transfers to Vance Brand (Fund 26) (43,083) (43,083) - 0.00%40 Transfers to Community Educ (Fund 27) (79,455) (150,000) (70,545) -88.79%41 Transfers to special activities (Fund 23) - (226,614) (226,614) N/A
42 Total transfers (122,538) (419,697) (297,159) -242.50%4344 Net change in fund balance (4,399,748) (8,721,277) (4,321,529) 98.22%
45 Fund balance, beginning 3,941,875 7,670,878 3,729,003 94.60%
46 Fund balance, ending (457,873)$ (1,050,399)$ (592,526)$ 129.41%
3

St. Vrain Valley School District RE-1JGeneral Fund (10)Prior Year Budget to Actual (Unaudited)Statement of Revenues, Expenditures, and Changes in Fund BalanceFor the period July 1, 2005 to May 31, 2006
FY06 FY06 % of2nd Amended July - May Balance Actual to
Budget Actual Remaining Budget1 Revenues2 Local3 Property taxes, 1110,1111,1140,1141,1190,and PY 47,912,000$ 34,438,296$ (13,473,704)$ 71.88%4 Specific ownership taxes, 1120 6,231,000 5,018,616 (1,212,384) 80.54%5 Investment income, 1510 600,000 452,037 (147,963) 75.34%6 Charges for service: Spec'l educ tuition,1323,1324,134043,000 297,987 254,987 692.99%7 Miscellaneous , 1910,1951,1990,1999,2000s 600,000 293,278 (306,722) 48.88%8 Total local revenues 55,386,000 40,500,214 (14,885,786) 73.12%9 State
10 Equalization, net, 3110 73,351,252 66,889,067 (6,462,185) 91.19%11 Special Education : Excep'l child educ act, 3130 1,986,954 2,534,835 547,881 127.57%12 Vocational Education , 3120 800,000 278,165 (521,835) 34.77%13 Transportation , 3160 867,436 823,982 (43,454) 94.99%14 Gifted and Talented , 3150 148,869 148,870 1 100.00%15 English Language Proficiency Act, 3140 103,000 109,729 6,729 106.53%16 Total state revenues 77,257,511 70,784,648 (6,472,863) 91.62%17 Federal18 Adult Education , 4000 140,000 - (140,000) 0.00%19 BOCES 51,000 19,493 (31,507) 38.22%20 - 39,105 39,105 N/A21 Total federal revenues 191,000 58,598 (132,402) 30.68%
22 Total revenues 132,834,511 111,343,460 (21,491,051) 83.82%2324 Disignated and reserved fund balance 3,941,868 - (3,941,868) 0.00%
25 136,776,379 111,343,460 (25,432,919) 81.41%2627 Expenditures28 Salaries , all 0100's 88,795,283 79,723,614 9,071,669 89.78%29 Benefits , all 0200's 18,224,538 16,568,745 1,655,793 90.91%30 Purchased services , all 0300's, 0400's ,0500's 7,702,870 5,675,286 2,027,584 73.68%31 Supplies and materials , all 0600's 12,061,692 7,532,407 4,529,285 62.45%32 Other (dues and fees/field trips), 0800, 0900 2,474,725 45,264 2,429,461 1.83%33 Allocation to charter schools 6,115,000 5,735,709 379,291 93.80%34 Capital outlay, 0700 904,677 339,645 565,032 37.54%
35 Total expenditures 136,278,785 115,620,670 20,658,115 84.84%3637 Excess (deficiency) of revenues 38 over (under) expenditures 497,594 (4,277,210) (4,774,804) 3940 Other Financing Uses41 Transfers to Vance Brand (Fund 26) (47,000) (43,083) 3,917 91.67%42 Transfers to Community Educ (Fund 27) - (79,455) (79,455) N/A43 Total transfers (47,000) (122,538) (75,538) 260.72%4445 Net change in fund balance 450,594 (4,399,748) (4,850,342)
46 Fund balance, 7/1/05 - 3,941,875 3,941,875
47 Fund balance, ending 450,594$ (457,873)$ (908,467)$
48 Expected year-end fund balance as percentage 49 of annual expenditure budget 0.33%
4

St. Vrain Valley School District RE-1JGeneral Fund (10)Current Year Budget to Actual (Unaudited)Statement of Revenues, Expenditures, and Changes in Fund BalanceFor the period July 1, 2006 to May 31, 2007
FY07 FY07 % ofAmended July - May Balance Actual to
Budget Actual Remaining Budget1 Revenues2 Local3 Property taxes, 1110,1111,1140,1141,1190,and PY 50,047,000$ 35,340,235$ (14,706,765)$ 70.61%4 Specific ownership taxes, 1120 6,276,000 5,004,911 (1,271,089) 79.75%5 Investment income, 1510 600,000 701,430 101,430 116.91%6 Charges for service: Spec'l educ tuition,1323,1324,1340270,000 613,185 343,185 227.11%7 Miscellaneous , 1910,1951,1990,1999,2000s 643,000 352,343 (290,657) 54.80%8 Total local revenues 57,836,000 42,012,104 (15,823,896) 72.64%9 State
10 Equalization, net, 3110 79,954,423 72,058,054 (7,896,369) 90.12%11 Special Education : Excep'l child educ act, 3130 2,782,890 2,783,839 949 100.03%12 Vocational Education , 3120 500,000 43,652 (456,348) 8.73%13 Transportation , 3160 867,436 941,456 74,020 108.53%14 Gifted and Talented , 3150 142,500 197,995 55,495 138.94%15 English Language Proficiency Act, 3140 103,000 191,358 88,358 185.78%16 Senior Tax Exemption - 636,847 636,847 N/A17 Total state revenues 84,350,249 76,853,201 (7,497,048) 91.11%18 Federal19 Adult Education , 4000 140,000 115,709 (24,291) 82.65%20 BOCES 75,000 - (75,000) 0.00%21 Emergency Impact Aid for Displaced Students - 18,843 18,843 N/A22 Total federal revenues 215,000 134,552 (80,448) 62.58%
23 Total revenues 142,401,249 118,999,857 (23,401,392) 83.57%
24 Designated and reserved fund balance 5,591,445 - (5,591,445) 0.00%
25 147,992,694 118,999,857 (28,992,837) 80.41%2627 Expenditures28 Salaries , all 0100's 95,338,659 86,877,255 8,461,404 91.12%29 Benefits , all 0200's 20,053,631 18,787,805 1,265,826 93.69%30 Purchased services , all 0300's, 0400's ,0500's 9,069,437 6,702,877 2,366,560 73.91%31 Supplies and materials , all 0600's 13,709,485 7,068,508 6,640,977 51.56%32 Other (dues and fees/field trips), 0800, 0900 578,294 115,518 462,776 19.98%33 Allocation to charter schools 7,953,016 7,198,792 754,224 90.52%34 Capital outlay, 0700 504,633 550,682 (46,049) 109.13%
35 Total expenditures 147,207,155 127,301,437 19,905,718 86.48%
36 Excess (deficiency) of revenues 37 over (under) expenditures 785,539 (8,301,580) (9,087,119) 3839 Other Financing Uses40 Transfers to Vance Brand (Fund 26) (47,000) (43,083) 3,917 91.67%41 Transfers to Community Educ (Fund 27) - (150,000) (150,000) N/A42 Transfers to special activities (Fund 23) - (226,614) (226,614) N/A
43 Total transfers (47,000) (419,697) (372,697) 892.97%4445 Net change in fund balance 738,539 (8,721,277) (9,459,816)
46 Fund balance, 7/1/06 7,670,878 7,670,878 -
47 Fund balance, ending 8,409,417$ (1,050,399)$ (9,459,816)$
48 Expected year-end fund balance as percentage 49 of annual expenditure budget 5.71%
5

This page intentionally left blank 6

BOND REDEMPTION FUND The Bond Redemption Fund is a debt service fund that is used to account for the accumulation of resources for, and the payment of , general long-term debt principal and interest.
7

St. Vrain Valley School District RE-1JBond Redemption Fund (31)Prior Year Budget to Actual (Unaudited)Statement of Revenues, Expenditures, and Changes in Fund BalanceFor the period July 1, 2005 to May 31, 2006
FY06 FY06 % ofAmended July - May Balance Actual toBudget Actual Remaining Budget
RevenuesProperty taxes, 1110, 1140, 1141 26,423,000$ 19,023,919$ (7,399,081)$ 72.00%Investment income, 1510 128,000 517,808 389,808 404.54%
Total revenues 26,551,000 19,541,727 (7,009,273) 73.60%
ExpendituresDebt principal - Dec 15 10,680,000 10,680,000 - 100.00%Debt interest - Dec 15 & June 15 13,732,000 6,986,455 6,745,545 50.88%Fiscal charges 8,000 5,000 3,000 62.50%
Total expenditures 24,420,000 17,671,455 6,748,545 72.36%
Excess (deficiency) of revenues over (under) expenditures 2,131,000 1,870,272 (260,728)
Other Financing Sources (Uses)Refunding bond proceeds - 43,455,000 43,455,000 N/APremium on bonds issued - 2,520,719 2,520,719 N/APayment to refunded bond escrow agent - (45,556,423) (45,556,423) N/ABond issuance costs - (365,507) (365,507) N/A
Total other financing sources - 53,789 53,789 N/A
Net change in fund balance 2,131,000 1,924,061 (206,939)
Fund balance, 7/1/05 28,636,780 28,636,780 -
Fund balance, ending 30,767,780$ 30,560,841$ (206,939)$
Expected year-end fund balance as percentageof annual expenditure budget 125.99%
8

St. Vrain Valley School District RE-1JBond Redemption Fund (31)Current Year Budget to Actual (Unaudited)Statement of Revenues, Expenditures, and Changes in Fund BalanceFor the period July 1, 2006 to May 31, 2007
FY07 FY07 % ofAmended July - May Balance Actual toBudget Actual Remaining Budget
RevenuesProperty taxes, 1110, 1140, 1141 26,116,000$ 17,879,138$ (8,236,862)$ 68.46%
Senior tax exemption - 321,131 321,131 N/AInvestment income, 1510 580,000 733,072 153,072 126.39%
Total revenues 26,696,000 18,933,341 (7,762,659) 70.92%
ExpendituresDebt principal - Dec 15 11,700,000 11,700,000 - 100.00%Debt interest - Dec 15 & June 15 14,836,858 6,684,509 8,152,349 45.05%Fiscal charges 8,000 3,950 4,050 49.38%
Total expenditures 26,544,858 18,388,459 8,156,399 69.27%
Excess (deficiency) of revenues over (under) expenditures 151,142 544,882 393,740
Other Financing Sources (Uses)Refunding bond proceeds - - - N/APremium on bonds issued - - - N/APayment to refunded bond escrow agent - - - N/ABond issuance costs - - - N/A
Total other financing sources - - - N/A
Net change in fund balance 151,142 544,882 393,740
Fund balance, 7/1/06 32,201,074 32,201,074 -
Fund balance, ending 32,352,216$ 32,745,956$ 393,740$
Expected year-end fund balance as percentage of annual expenditure budget 121.88%
9

This page intentionally left blank
10

BUILDING FUND
The Building Fund is a Capital Project Fund that is used to account for the proceeds of bond sales and expenditures for capital outlay for land, buildings, improvements of grounds, construction of buildings, additions or remodeling of bui ldings or init ial , additional and replacement of equipment.
11

St. Vrain Valley School District RE-1J
Building Fund (41) - Project 1997 Prior Year Budget to Actual (Unaudited)Statement of Revenues, Expenditures, and Changes in Fund BalanceFor the period July 1, 2005 to May 31, 2006
FY06 FY06 % ofAdopted July - May Balance Actual toBudget Actual Remaining Budget
RevenuesInvestment income, 1510 -$ -$ -$ N/AMiscellaneous , Reimb Infrastructure Expense - - - N/A
Total revenues - - - N/A
ExpendituresSalaries (100) - - - N/ABenefits (200) - - - N/APurchased services (300, 400, 500) - 9,720 (9,720) N/ASupplies (600) - 186,400 (186,400) N/ASite development/acquisition (700) - - - N/A
Total expenditures - 196,120 (196,120) N/A
Excess (deficiency) of revenues over (under) expenditures - (196,120) (196,120)
Fund balance, 7/1/05 648,502 648,502 -
Fund balance, ending 648,502$ 452,382$ (196,120)$
Expected year-end fund balance as percentageof annual expenditure budget N/A
12

St. Vrain Valley School District RE-1J
Building Fund (41) - Project 1997 Current Year Budget to Actual (Unaudited)Statement of Revenues, Expenditures, and Changes in Fund BalanceFor the period July 1, 2006 to May 31, 2007
FY07 FY07 % ofAdopted July - May Balance Actual toBudget Actual Remaining Budget
RevenuesInvestment income, 1510 -$ 27,364$ 27,364$ N/AMiscellaneous , Reimb Infrastructure Expense - 46,559 46,559 N/A
Total revenues - 73,923 73,923 N/A
ExpendituresSalaries (100) - - - N/ABenefits (200) - - - N/APurchased services (300, 400, 500) - 900 (900) N/ASupplies (600) - 384 (384) N/ASite development/acquisition (700) - - - N/A
Total expenditures - 1,284 (1,284) N/A
Excess (deficiency) of revenues over (under) expenditures - 72,639 72,639
Fund balance, 7/1/06 417,637 417,637 -
Fund balance, ending 417,637$ 490,276$ 72,639$
Expected year-end fund balance as percentageof annual expenditure budget N/A
13

St. Vrain Valley School District RE-1J
Building Fund (41) - Project 2002Prior Year Budget to Actual (Unaudited)Statement of Revenues, Expenditures, and Changes in Fund BalanceFor the period July 1, 2005 to May 31, 2006
FY06 FY06 % ofAmended July - May Balance Actual toBudget Actual Remaining Budget
RevenuesInvestment income, 1510 114,000$ 919,817$ 805,817$ 806.86%
Total revenues 114,000 919,817 805,817 806.86%
ExpendituresSalaries (100) 500,000 212,929 287,071 42.59%Benefits (200) 100,000 42,062 57,938 42.06%Purchased services 8,000,000 1,598,084 6,401,916 19.98%Supplies 4,000,000 3,490,367 509,633 87.26%Construction projects 84,831,165 18,358,694 66,472,471 21.64%Other 170,000 163,581 6,419 96.22%Interest expense 65,000 55,022 9,978 84.65%
Total expenditures 97,666,165 23,920,739 73,745,426 24.49%
Excess (deficiency) of revenues over (under) expenditures (97,552,165) (23,000,922) 74,551,243
Other Financing Sources (Uses)Bond proceeds 56,800,000 - (56,800,000) 0.00%Premium on bonds issued - - - N/ABond issuance costs - - - N/A
Net change in fund balance (40,752,165) (23,000,922) 17,751,243
Fund balance, 7/1/05 40,285,643 40,285,643 -
Fund balance, ending (466,522)$ 17,284,721$ 17,751,243$
Expected year-end fund (deficit) as percentageof annual expenditure budget -0.48%
14

St. Vrain Valley School District RE-1J
Building Fund (41) - Project 2002Current Year Budget to Actual (Unaudited)Statement of Revenues, Expenditures, and Changes in Fund BalanceFor the period July 1, 2006 to May 31, 2007
FY07 FY07 % ofAmended July - May Balance Actual toBudget Actual Remaining Budget
RevenuesInvestment income, 1510 2,000,000$ 2,023,166$ 23,166$ 101.16%
Total revenues 2,000,000 2,023,166 23,166 101.16%
ExpendituresSalaries (100) 500,000 218,968 281,032 43.79%Benefits (200) 100,000 43,636 56,364 43.64%Purchased services 8,000,000 1,674,705 6,325,295 20.93%Supplies 4,000,000 380,799 3,619,201 9.52%Construction projects 8,000,000 3,359,944 4,640,056 42.00%Other 170,000 182,980 (12,980) 107.64%Interest expense 65,000 47,336 17,664 72.82%
Total expenditures 20,835,000 5,908,368 14,926,632 28.36%
Excess (deficiency) of revenues over (under) expenditures (18,835,000) (3,885,202) 14,949,798
Other Financing Sources (Uses)Bond proceeds 56,800,000 56,800,000 - 100.00%Premium on bonds issued 2,462,000 3,622,791 1,160,791 147.15%Bond issuance costs (125,000) (479,707) (354,707) 383.77%
Total other financing sources (uses) 59,137,000 59,943,084 806,084
Net change in fund balance 40,302,000 56,057,882 15,755,882
Fund balance, 7/1/06 17,668,783 17,668,783 -
Fund balance, ending 57,970,783$ 73,726,665$ 15,755,882$
Expected year-end fund (deficit) as percentageof annual expenditure budget 278.24%
15

CAPITAL RESERVE FUND The Capital Reserve Fund is used to account fo r the acqu is i t ion o f land, construction of new facilities, alterations and improvement to existing structures where the estimated unit cost is in excess of $1,000.
16

St. Vrain Valley School District RE-1JCapital Reserve Fund (21)Year-to-Date Actual to Actual (Unaudited)Statement of Revenues, Expenditures, and Changes in Fund BalanceFor the period July 1 to May 31
FY06 FY07July - May July - May Dollar Percent
Actual Actual Variance Variance
RevenuesEqualization 4,153,461$ 4,239,900$ 86,439$ 2.08%Investment income, 1500 24,375 20,070 (4,305) -17.66%Miscellaneous , 1930 5,878 80,863 74,985 1275.69%
Total revenues 4,183,714 4,340,833 157,119 3.76%
ExpendituresCapital outlay 5,274,978 3,486,481 1,788,497 33.91%
Total expenditures 5,274,978 3,486,481 1,788,497 33.91%
Excess (deficiency) of revenues over (under) expenditures (1,091,264) 854,352 1,945,616 -178.29%
Other Financing Sources (Uses)Proceeds from sale of land - 750,000 750,000 N/AGeneral Fund capital lease obligations - - - N/A
Total other financing sources (uses) - 750,000 750,000 N/A
Net change in fund balance (1,091,264) 1,604,352 2,695,616 -247.02%
Fund balance, beginning 1,824,690 329,185 (1,495,505) -81.96%
Fund balance, ending 733,426$ 1,933,537$ 1,200,111$ 163.63%
17

St. Vrain Valley School District RE-1JCapital Reserve Fund (21)Prior Year Budget to Actual (Unaudited)Statement of Revenues, Expenditures, and Changes in Fund BalanceFor the period July 1, 2005 to May 31, 2006
FY06 FY06 % ofAmended July - May Balance Actual toBudget Actual Remaining Budget
RevenuesEqualization 3,985,343$ 4,153,461$ 168,118$ 104.22%Investment income, 1500 27,000 24,375 (2,625) 90.28%Miscellaneous , 1930 - 5,878 5,878 N/A
Total revenues 4,012,343 4,183,714 171,371 104.27%
ExpendituresCapital outlay 7,063,033 5,274,978 1,788,055 74.68%
Total expenditures 7,063,033 5,274,978 1,788,055 74.68%
Excess (deficiency) of revenues over (under) expenditures (3,050,690) (1,091,264) 1,959,426
Other Financing Sources (Uses)Proceeds from sale of land (Creekside) 2,200,000 - (2,200,000) 0.00%General Fund capital lease obligations (474,000) - 474,000 0.00%
Total other financing sources (uses) 1,726,000 - (1,726,000) 0.00%
Net change in fund balance (1,324,690) (1,091,264) 233,426
Fund balance, 7/1/05 1,824,690 1,824,690 -
Fund balance, ending 500,000$ 733,426$ 233,426$
Expected year-end fund balance as percentageof annual expenditure budget 7.08%
18

St. Vrain Valley School District RE-1JCapital Reserve Fund (21)Current Year Budget to Actual (Unaudited)Statement of Revenues, Expenditures, and Changes in Fund BalanceFor the period July 1, 2006 to May 31, 2007
FY07 FY07 % ofAmended July - May Balance Actual toBudget Actual Remaining Budget
RevenuesEqualization 4,512,000$ 4,239,900$ (272,100)$ 93.97%Investment income, 1500 29,000 20,070 (8,930) 69.21%Miscellaneous , 1930 - 80,863 80,863 N/A
Total revenues 4,541,000 4,340,833 (200,167) 95.59%
ExpendituresCapital outlay 6,595,575 3,486,481 3,109,094 52.86%
Total expenditures 6,595,575 3,486,481 3,109,094 52.86%
Excess (deficiency) of revenues over (under) expenditures (2,054,575) 854,352 2,908,927
Other Financing Sources (Uses)Proceeds from sale of land (CDC parcel) 2,200,000 750,000 (1,450,000) 34.09%General Fund capital lease obligations (474,000) - 474,000 0.00%
Total other financing sources (uses) 1,726,000 750,000 (976,000) 43.45%
Net change in fund balance (328,575) 1,604,352 1,932,927
Fund balance, 7/1/06 329,185 329,185 -
Fund balance, ending 610$ 1,933,537$ 1,932,927$
Expected year-end fund balance as percentageof annual expenditure budget 0.01%
19

This page intentionally left blank
20

COLORADO PRESCHOOL AND KINDERGARTEN PROGRAM FUND
The Colorado Preschool and Kindergarten Program Fund is a state funded program for children who have a variety of risk factors in their families, including low income and substance abuse.
21

St. Vrain Valley School District RE-1JColorado Preschool Program Fund (19)Prior Year Budget to Actual (Unaudited)Statement of Revenues, Expenditures, and Changes in Fund BalanceFor the period July 1, 2005 to May 31, 2006
FY06 FY06 % ofAmended July - May Balance Actual to
Budget Actual Remaining Budget
RevenuesEqualization 317,405$ 291,921$ (25,484)$ 91.97%Investment income - 250 250 N/A
Total revenues 317,405 292,171 (25,234) 92.05%
ExpendituresSalaries , 0100s 50,000 23,169 26,831 46.34%Benefits , 0200s 10,877 4,056 6,821 37.29%Purchased services , 0300s, 0500s 265,399 207,145 58,254 78.05%Supplies and materials , 0600s 13,123 5,849 7,274 44.57%
Total expenditures 339,399 240,219 99,180 70.78%
Excess (deficiency) of revenues over (under) expenditures (21,994) 51,952 73,946
Fund balance, 7/1/05 21,994 21,994 -
Fund balance, ending -$ 73,946$ 73,946$
Expected year-end fund balance as percentageof annual expenditure budget 0.00%
22

St. Vrain Valley School District RE-1JColorado Preschool and Kindergarten Program Fund (19)Current Year Budget to Actual (Unaudited)Statement of Revenues, Expenditures, and Changes in Fund BalanceFor the period July 1, 2006 to May 31, 2007
FY07 FY07 % ofAmended July - May Balance Actual to
Budget Actual Remaining Budget
RevenuesEqualization 523,100$ 479,330$ (43,770)$ 91.63%Investment income - 2,464 2,464 N/A
Total revenues 523,100 481,794 (41,306) 92.10%
ExpendituresSalaries , 0100s 124,400 52,812 71,588 42.45%Benefits , 0200s 30,293 12,516 17,777 41.32%Purchased services , 0300s, 0500s 333,050 259,786 73,264 78.00%Supplies and materials , 0600s 35,357 3,774 31,583 10.67%Other, 0800 - 36,870 (36,870) N/A
Total expenditures 523,100 365,758 157,342 69.92%
Excess (deficiency) of revenues over (under) expenditures - 116,036 116,036
Fund balance, 7/1/06 62,808 62,808 -
Fund balance, ending 62,808$ 178,844$ 116,036$
Expected year-end fund balance as percentageof annual expenditure budget 12.01%
23

This page intentionally left blank
24
COMMUNITY EDUCATION FUND
The Community Education Fund is used to record financial transactions from such activities as driver's education, summer school, community projects, adult general programs, and student alternative make-up programs.
25
COMMUNITY EDUCATION PROGRAM DESCRIPTIONS
Community Schools - Funds are generated through tuition and fees. Expenditure s are for salaries, supplies/materials, and furniture/equipment. This program serves preschool age children and older. Included in this category are the following:
1. Before/After School Care (extended day) serving elementary school age students 2. Preschool serving children 3-5 years of age 3. Enrichment (athletic, educational , and enhancement activity programs) serving
elementary through middle school age students 4. Kinder Enrichment serving kindergarten age children during the school day
Driver Education - Funds are generated through tuition. Expenditures include instructors’ salaries, tuition assistance and safe driving motivational materials. This program serves students of driving age (15 years 3 months - adult) including resident and non-resident students . Adult Outsource - Funds are generated through tuition/registration for over 21 year old students. Expenses are for extra duty for staff, instructional supplies and books. This program serves adults 17 years of age and older. Summer School - Funds are generated through tuition, Student Intervention/At -Risk grants, and Private Industry Partnership (PIP) funding. Expenditures include instructor salaries, clerical support, supplies/materials, tuition assistance and utility/custodial support. This program serves students in both elementary and secondary grades. Included is the Summer Reading Program. Funds are generated through tuition and donations. Expenditures are for salaries and supplies/materials. This program serves elementary school age students in grades K-3 in non-Title I schools. Separate funding for Title I schools are provided through the Title I Grant.
26

St. Vrain Valley School District RE-1JCommunity Education Fund (27)Year-to-Date Actual to Actual (Unaudited)Statement of Revenues, Expenditures, and Changes in Fund BalanceFor the period July 1 to May 31
FY06 FY07July - May July - May Dollar Percent
Actual Actual Variance Variance
RevenuesInvestment income 40,148$ 72,987$ 32,839$ 81.79%Charges for services
A Adult Outsource Program, prgm 0060 & 34106,690 8,076 1,386 20.72%B Drivers Education Program, prgm 0850 208,222 196,994 (11,228) -5.39%C Summer School Program, prgm 0080, 0091, 1250 & 241014,043 34,895 20,852 148.49%
Community School ProgramsD Day Care, prgm 3210 751,267 1,071,924 320,657 42.68%E Enrichment , 3300 pgm not location 699260,088 255,211 (4,877) -1.88%F Kinder Enrichment , prgm 3200 221,174 238,509 17,335 7.84%G Preschool , prgm 0040 974,625 1,176,031 201,406 20.66%
Facility UseH Building Share, prgm 3220 50,939 81,780 30,841 60.54%I Comm'y School Share 145,871 205,309 59,438 40.75%J Other Programs 89,901 78,878 (11,023) -12.26%
Total revenues 2,762,968 3,420,594 657,626 23.80%
ExpendituresInstruction
A Adult Outsource Program, prgm 0060 & 34107,475 9,933 (2,458) -32.88%B Drivers Education Program, prgm 0850 216,339 219,816 (3,477) -1.61%C Summer School Program, prgm 0080, 0091, 1250 & 241052,205 154,241 (102,036) -195.45%
Community School ProgramsD Day Care, prgm 3210 630,705 771,315 (140,610) -22.29%E Enrichment 243,331 249,221 (5,890) -2.42%F Kinder Enrichment , prgm 3200 154,086 193,567 (39,481) -25.62%G Preschool , prgm 0040 975,094 1,019,502 (44,408) -4.55%
Facility UseH Building Share, prgm 3220 56,572 53,467 3,105 5.49%I Comm'y School Share 173,171 178,751 (5,580) -3.22%J Other Programs 95,593 54,185 41,408 43.32%
Total expenditures 2,604,571 2,903,998 (299,427) -11.50%
Excess (deficiency) of revenues over (under) expenditures 158,397 516,596 358,199 226.14%
Other Financing Sources (Uses)Transfer from General Fund 79,455 150,000 70,545 88.79%Transfer to Flagstaff (Fund 14) - (12,066) (12,066) N/A
Total other sources (uses) 79,455 137,934 58,479 73.60%
Net change in fund balance 237,852 654,530 416,678 175.18%
Fund balance, beginning 1,264,423 1,290,091 25,668 2.03%
Fund balance, ending 1,502,275$ 1,944,621$ 442,346$ 29.45%
27

St. Vrain Valley School District RE-1JCommunity Education Fund (27)Prior Year Budget to Actual (Unaudited)Statement of Revenues, Expenditures, and Changes in Fund BalanceFor the period July 1, 2005 to May 31, 2006
FY06 FY06 % ofAmended July - May Balance Actual toBudget Actual Remaining Budget
RevenuesInvestment income 19,000$ 40,148$ 21,148$ 211.31%Charges for services 3,081,000 2,722,820 (358,180) 88.37%
Total revenues 3,100,000 2,762,968 (337,032) 89.13%
ExpendituresInstruction 3,100,000 2,604,571 495,429 84.02%
Total expenditures 3,100,000 2,604,571 495,429 84.02%
Excess (deficiency) of revenues over (under) expenditures - 158,397 158,397
Other Financing UsesTransfer from General Fund - 79,455 79,455 N/A
Net change in fund balance - 237,852 237,852
Fund balance, 7/1/05 1,264,423 1,264,423 -
Fund balance, ending 1,264,423$ 1,502,275$ 237,852$
Expected year-end fund balance as percentageof annual expenditure budget 40.79%
28

St. Vrain Valley School District RE-1JCommunity Education Fund (27)Current Year Budget to Actual (Unaudited)Statement of Revenues, Expenditures, and Changes in Fund BalanceFor the period July 1, 2006 to May 31, 2007
FY07 FY07 % ofAmended July - May Balance Actual toBudget Actual Remaining Budget
RevenuesInvestment income 48,000$ 72,987$ 24,987$ 152.06%Charges for services 3,383,000 3,347,607 (35,393) 98.95%
Total revenues 3,431,000 3,420,594 (10,406) 99.70%
ExpendituresInstruction 3,431,000 2,903,998 527,002 84.64%
Total expenditures 3,431,000 2,903,998 527,002 84.64%
Excess (deficiency) of revenues over (under) expenditures - 516,596 516,596
Other Financing UsesTransfer from General Fund - 150,000 150,000 N/ATransfer to Flagstaff General Fund - (12,066) (12,066) N/A
Total other financing sources (uses) - 137,934 137,934 N/A
Net change in fund balance - 654,530 654,530
Fund balance, 7/1/06 1,290,091 1,290,091 -
Fund balance, ending 1,290,091$ 1,944,621$ 654,530$
Expected year-end fund balance as percentageof annual expenditure budget 37.60%
29

This page intentionally left blank
30

FAIR CONTRIBUTIONS FOR PUBLIC SCHOOL SITES FUND
This fund was first established November 15, 1995 in accordance wi th the In tergovernmenta l Agreement Concerning Fair Contributions for Public School Sites between the City of Longmont and the St. Vrain Valley School District in order to collect monies for acquisition, development or expansion of public school sites based on the impacts created by residential subdivisions. Since that date, additional intergovernmental agreements have been set up with the Towns of Mead, Frederick, Firestone, Erie, Lyons and Dacono. Additional fair contribution fees for public school sites are collected from Boulder County, Larimer County, and from individual developers in Weld County. The fee is assessed according to the type of dwelling: s ingle family, duplex/tr iplex, condo/townhouse, multi-family or mobile home. The fees are collected for use within the senior high school feeder attendance area boundaries, which serve the individual dwelling units.
31

St. Vrain Valley School District RE-1JFair Contributions Fund (29)Prior Year Budget to Actual (Unaudited)Statement of Revenues, Expenditures, and Changes in Fund BalanceFor the period July 1, 2005 to May 31, 2006
FY06 FY06 % ofAmended July - May Balance Actual toBudget Actual Remaining Budget
RevenuesInvestment income, 1510 175,000$ 176,992$ 1,992$ 101.14%Cash in lieu 1,140,000 991,265 (148,735) 86.95%
Total revenues 1,315,000 1,168,257 (146,743) 88.84%
ExpendituresPurchased services , 300's 48,000 65,354 (17,354) 136.15%Capital outlay, 700's 4,670,769 1,358,675 3,312,094 29.09%
Total expenditures 4,718,769 1,424,029 3,294,740 30.18%
Excess (deficiency) of revenues over (under) expenditures (3,403,769) (255,772) 3,147,997
Fund balance, 7/1/05 3,453,769 3,453,769 -
Fund balance, ending 50,000$ 3,197,997$ 3,147,997$
Expected year-end fund balance as percentageof annual expenditure budget 1.06%
32

St. Vrain Valley School District RE-1JFair Contributions Fund (29)Current Year Budget to Actual (Unaudited)Statement of Revenues, Expenditures, and Changes in Fund BalanceFor the period July 1, 2006 to May 31, 2007
FY07 FY07 % ofAmended July - May Balance Actual toBudget Actual Remaining Budget
RevenuesInvestment income, 1510 197,000$ 175,265$ (21,735)$ 88.97%Cash in lieu 1,060,000 540,514 (519,486) 50.99%
Total revenues 1,257,000 715,779 (541,221) 56.94%
ExpendituresPurchased services , 300's 67,000 24,179 42,821 36.09%Capital outlay, 700's 4,529,925 1,200,526 3,329,399 26.50%
Total expenditures 4,596,925 1,224,705 3,372,220 26.64%
Excess (deficiency) of revenues over (under) expenditures (3,339,925) (508,926) 2,830,999
Fund balance, 7/1/06 3,339,925 3,339,925 -
Fund balance, ending -$ 2,830,999$ 2,830,999$
Expected year-end fund balance as percentageof annual expenditure budget 0.00%
33

FOOD SERVICE FUND
The Food Service Department is responsible for providing meal service to the District's students and staff. The National School Lunch Program is available at forty schools. Twenty schools currently participate in the School Breakfast Program. In addition to these programs, most schools offer a la carte choices. The Food Service Fund is an enterprise fund that accounts for operations that are financed and operated in a manner similar to private business enterprises. The budget is prepared using a zero-based and incremental budgeting method. The largest revenue accounts are students' payments and federal reimbursement that flows through the Colorado Department of Education. The largest expenditure accounts are food, salaries and benefits. A transfer to the General Fund has been included to offset indirect costs related to the Food Service Program.
34

St. Vrain Valley School District RE-1JFood Service Fund (51)Year-to-Date Actual to Actual (Unaudited)Statement of Revenues, Expenses, and Changes in Fund Net AssetsFor the period July 1 to May 31
FY06 FY07July - May July - May Dollar Percent
Actual Actual Variance Variance
1 Revenues2 Investment income, 1510 22,079$ 21,615$ (464)$ -2.10%3 Charges for service , 1610+1632 3,036,804 3,329,842 293,038 9.65%4 Miscellaneous , 1690 52,711 31,184 (21,527) -40.84%5 State match 3161 70,613 80,768 10,155 14.38%6 Nat'l School Lunch/Breakfast Pgm, 4553+4555 1,881,834 2,166,994 285,160 15.15%7 Total revenues 5,064,041 5,630,403 566,362 11.18%89 Expenses
10 Salaries , 100 1,950,831 2,186,077 (235,246) -12.06%11 Benefits , 200 457,451 514,524 (57,073) -12.48%12 Purchased services , 400, 500 415,266 426,048 (10,782) -2.60%13 Supplies and materials 2,065,810 2,298,831 (233,021) -11.28%14 Repairs and maintenance not rev or exp, 51.740..8241 control plus 0735156,507 76,820 79,687 50.92%15 Other, 0800 75,000 75,000 - 0.00%16 Total expenses 5,120,865 5,577,300 (456,435) -8.91%1718 Net income (loss), cash basis (56,824) 53,103 109,927 -193.45%1920 Noncash revenues (expenses)21 Depreciation (111,253) (138,325) (27,072) -24.33%22 Loss on disposal of equipment - - - N/A23 Capital contributions - - - N/A24 Commodities received 221,505 209,836 (11,669) -5.27%25 Commodities used, 0633 (181,593) (187,911) (6,318) -3.48%2627 Change in net assets (128,165) (63,297) 64,868 -50.61%2829 Net assets, beginning 2,207,685 2,210,866 3,181 0.14%3031 Net assets, ending 2,079,520$ 2,147,569$ 68,049$ 3.27%
35

St. Vrain Valley School District RE-1JFood Service Fund (51)Prior Year Budget to Actual (Unaudited)Statement of Revenues, Expenses, and Changes in Fund Net AssetsFor the period July 1, 2005 to May 31, 2006
FY06 FY06 % ofAmended July - May Balance Actual toBudget Actual Remaining Budget
1 Revenues2 Investment income, 1510 12,000$ 22,079$ 10,079$ 183.99%3 Charges for service, 1610+1632 2,900,000 3,036,804 136,804 104.72%4 Miscellaneous , 1690 22,000 52,711 30,711 239.60%5 State match 3161 58,000 70,613 12,613 121.75%6 Nat'l School Lunch/Breakfast Pgm, 4553+4555 2,000,000 1,881,834 (118,166) 94.09%7 Total revenues 4,992,000 5,064,041 72,041 101.44%89 Expenses
10 Salaries , 100 2,050,000 1,950,831 99,169 95.16%11 Benefits , 200 418,000 457,451 (39,451) 109.44%12 Purchased services , 400, 500 300,000 415,266 (115,266) 138.42%13 Supplies and materials 2,305,000 2,065,810 239,190 89.62%14 Repairs and maintenance not rev or exp, 51.740..8241 control plus 0735100,000 156,507 (56,507) 156.51%15 Other 206,000 75,000 131,000 36.41%16 Total expenses 5,379,000 5,120,865 258,135 95.20%1718 Net income (loss), cash basis (387,000) (56,824) 330,176 1920 Noncash revenues (expenses)21 Depreciation (115,000) (111,253) 3,747 96.74%22 Loss on disposal of equipment - - - N/A23 Capital contributions - - - N/A24 Commodities received 216,000 221,505 5,505 102.55%25 Commodities used, 0633 (216,000) (181,593) 34,407 84.07%2627 Change in net assets (502,000) (128,165) 373,835 2829 Net assets, 7/1/05 2,207,685 2,207,685 - 3031 Net assets, ending 1,705,685$ 2,079,520$ 373,835$
3233 Expected year-end net assets as percentage34 of annual expense budget 31.71%
36
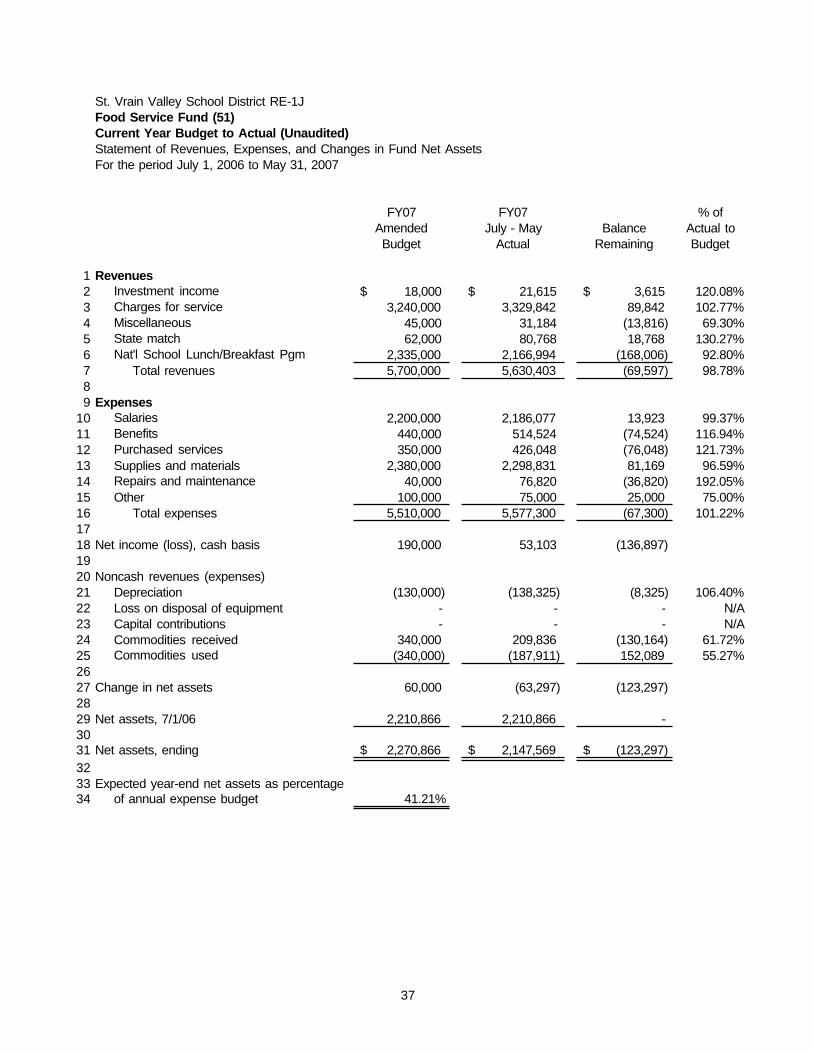
St. Vrain Valley School District RE-1JFood Service Fund (51)Current Year Budget to Actual (Unaudited)Statement of Revenues, Expenses, and Changes in Fund Net AssetsFor the period July 1, 2006 to May 31, 2007
FY07 FY07 % ofAmended July - May Balance Actual toBudget Actual Remaining Budget
1 Revenues2 Investment income, 1510 18,000$ 21,615$ 3,615$ 120.08%3 Charges for service, 1610+1632 3,240,000 3,329,842 89,842 102.77%4 Miscellaneous , 1690 45,000 31,184 (13,816) 69.30%5 State match 3161 62,000 80,768 18,768 130.27%6 Nat'l School Lunch/Breakfast Pgm, 4553+4555 2,335,000 2,166,994 (168,006) 92.80%7 Total revenues 5,700,000 5,630,403 (69,597) 98.78%89 Expenses
10 Salaries , 100 2,200,000 2,186,077 13,923 99.37%11 Benefits , 200 440,000 514,524 (74,524) 116.94%12 Purchased services , 400, 500 350,000 426,048 (76,048) 121.73%13 Supplies and materials 2,380,000 2,298,831 81,169 96.59%14 Repairs and maintenance not rev or exp, 51.740..8241 control plus 073540,000 76,820 (36,820) 192.05%15 Other 100,000 75,000 25,000 75.00%16 Total expenses 5,510,000 5,577,300 (67,300) 101.22%1718 Net income (loss), cash basis 190,000 53,103 (136,897) 1920 Noncash revenues (expenses)21 Depreciation (130,000) (138,325) (8,325) 106.40%22 Loss on disposal of equipment - - - N/A23 Capital contributions - - - N/A24 Commodities received 340,000 209,836 (130,164) 61.72%25 Commodities used, 0633 (340,000) (187,911) 152,089 55.27%2627 Change in net assets 60,000 (63,297) (123,297) 2829 Net assets, 7/1/06 2,210,866 2,210,866 - 3031 Net assets, ending 2,270,866$ 2,147,569$ (123,297)$
3233 Expected year-end net assets as percentage34 of annual expense budget 41.21%
37

This page intentionally left blank
38

GOVERNMENTAL DESIGNATED - PURPOSE GRANTS FUND
The Governmental Designated Purpose Grant Fund is used to account for restricted state and federal grants. A list of grants is defined on the following pages.
39

GOVERNMENT GRANT PROGRAM DESCRIPTIONS For FY 2006-07, the No Child Left Behind (NCLB) Act of 2001 remains the directive for the consolidated grants. Briefly, the Act provides more funds in formula driven rather than competitive grants; more emphasis on school assessments and accountability; standards -based (scientifically measurable) education, more reliance on the CSAP for determining AYP (average yearly progress); increased use of technology in the classroom; requirements for teacher and principal certification; school choice; sanctions for schools that do not meet AYP; and increased flexibility for moving funds within programs. The Consolidated Grant is designed to be integrated district -wide with funds of one program supporting the goals of another. Consolidated Grants Title I: Basic This federally funded program is designed to offer intensive supplemental reading, language arts and math instruction to students who are not performing at grade level proficiency. Students are selected for participation based on district assessment and teacher referral. St. Vrain emphasizes K-3 programming. Reforms for 2002-03 provide more accountability for AYP; require certification for teachers and paraprofessionals, and parental school choice for those students whose schools are designated as “on improvement.” Early reading programs are heavily emphasized. Provisions include funds for Migrant Children, Neglected and Delinquent Children, Dropout Prevention, and Advanced Placement Fee waivers. Title II: Part A: Preparing, Training and Recruiting High Quality Teachers and Principals Combines Eisenhower and Class Size reduction grants to provide reform of teacher and principal certification, establishes an alternative certification process, provide funds for professional development to achieve certification in core teaching areas by FY 2005-06. Paraprofessionals are included in certification process. Title II: Part D: Technology Provides a state formula grant to support the integration of educational technology into classrooms to improve teaching and learning. Title III: English Language Acquisition, Language Enhancement Consolidates the Bilingual Education Act with the Emergency Immigrant Education Program. Grants are now formula based, rather than competitive. Reform will focus existing programs on teaching English to limited English proficient children, and holding states accountable for LEP students attaining English. Provides provisions for parental rights, flexibility of teaching methods, standards based testing and accountability. Title III: 15% Set Aside A formula based program due to the increase in migrant children enrollment.
40

Title IV: Part A: Safe and Drug-Free Schools Drug-free schools money is designated by Congress to support programs that prevent violence in and around schools and the illegal use of alcohol, tobacco and drugs. Grants made to Local Education Agencies may support school drug and violence prevention, early intervention, rehabilitation referral , and education in elementary through secondary schools. Title V: Innovative Programs Retains the old Title VI programs and expands the list of targeted innovative program areas to 27. Provides funds for charter schools. State Grants Alternatives for Youth (Competitive grant: may continue) Provides services for expelled students and expulsion prevent prevention programs. Federal Grants IDEA - PL 94-142 - Part B (Entitlement: will continue indefinitely) Originally, Part B monies were to fund 40% of excess costs that local districts would incur in meeting the individual education plans of all students with disabilities as outlined in the Public Law. At the present time, it accounts for about eight to ten percent. Annually, the number of students identified through a December 1 count determines the amount of money received. IDEA - PL 99-457 – Preschool (Entitlement) Preschool funds were generated to provide local school districts with additional funding to help meet the needs of preschool students (ages 3-5) identified as disabled. The amount of money received is annually determined by the number of students identified in this category through a December 1 count. Carl Perkins - Vocational Education (Federal Program: no expiration noted) The Carl Perkins Grant provides funds to secondary programs that serve special populations in vocational settings. Integrated academics, technology and the "New Basics" are also to be in place in programs receiving funds. McKinney - Education of the Homeless (Federal Program: no expiration noted) Funded under the McKinney Act, this grant provides assistance to homeless children and youth within the District. The purpose of this assistance is to be sure that these children are enrolled in school, regularly attending, and succeeding academically. Some funds provide training for school personnel about the needs and rights of the homeless. These grant funds also support the Education Center at the Inn Between.
41
School to Work Alliance Program (SWAP) (Federal Program: no expiration noted) SWAP is a collaborative program between the Colorado Department of Education, Vocational Rehabilitation and the school district that provides a new pattern of services for students with mild/moderate disabilities that leads to competitive employment. Literacy Center (Federal Program: no expiration noted) The Colorado Department of Adult Education provides flow-through funds from the Federal Adult Education Act for the operation of four regional Literacy Resource Centers for housing materials and facilitating workshops directed at staff development for federally funded adult education programs. These funds are provided for programs addressing the educational needs (below secondary completion) of learners who are not in a traditional school setting.
42
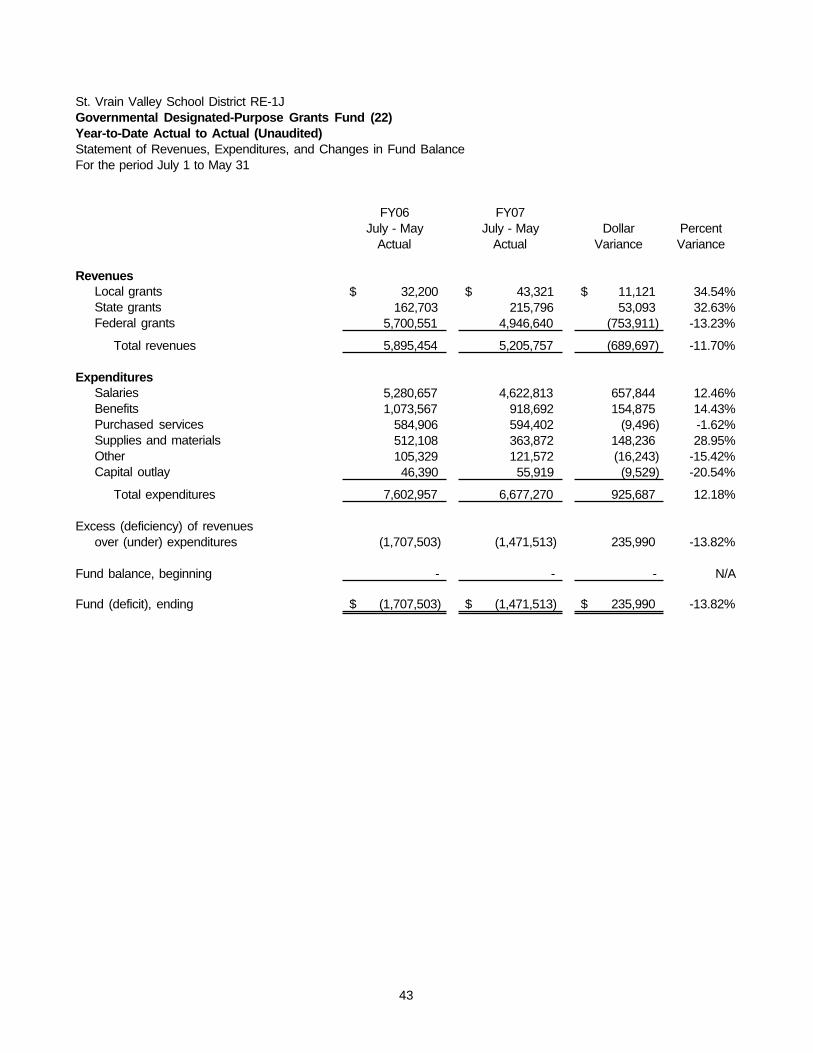
St. Vrain Valley School District RE-1JGovernmental Designated-Purpose Grants Fund (22)Year-to-Date Actual to Actual (Unaudited)Statement of Revenues, Expenditures, and Changes in Fund BalanceFor the period July 1 to May 31
FY06 FY07July - May July - May Dollar Percent
Actual Actual Variance Variance
RevenuesLocal grants, TOTAL 32,200$ 43,321$ 11,121$ 34.54%State grants, TOTAL 162,703 215,796 53,093 32.63%Federal grants, TOTAL 5,700,551 4,946,640 (753,911) -13.23%
Total revenues 5,895,454 5,205,757 (689,697) -11.70%
ExpendituresSalaries , 0100s 5,280,657 4,622,813 657,844 12.46%Benefits , 0200s 1,073,567 918,692 154,875 14.43%Purchased services , 0300, 0400, 0500s 584,906 594,402 (9,496) -1.62%Supplies and materials , 0600s 512,108 363,872 148,236 28.95%Other, 0800 and 0900s 105,329 121,572 (16,243) -15.42%Capital outlay, 0700s 46,390 55,919 (9,529) -20.54%
Total expenditures 7,602,957 6,677,270 925,687 12.18%
Excess (deficiency) of revenues over (under) expenditures (1,707,503) (1,471,513) 235,990 -13.82%
Fund balance, beginning - - - N/A
Fund (deficit), ending (1,707,503)$ (1,471,513)$ 235,990$ -13.82%
43

St. Vrain Valley School District RE-1JGovernmental Designated-Purpose Grants Fund (22)Prior Year Budget to Actual (Unaudited)Statement of Revenues, Expenditures, and Changes in Fund BalanceFor the period July 1, 2005 to May 31, 2006
FY06 FY06 % ofAmended July - May Balance Actual toBudget Actual Remaining Budget
RevenuesLocal grants, TOTAL 20,000$ 32,200$ 12,200$ 161.00%State grants, TOTAL 87,000 162,703 75,703 187.01%Federal grants, TOTAL 9,156,000 5,700,551 (3,455,449) 62.26%
Total revenues 9,263,000 5,895,454 (3,367,546) 63.65%
ExpendituresSalaries , 0100s 6,432,000 5,280,657 1,151,343 82.10%Benefits , 0200s 1,195,000 1,073,567 121,433 89.84%Purchased services , 0300, 0400, 0500s 704,000 584,906 119,094 83.08%Supplies and materials , 0600s 553,000 512,108 40,892 92.61%Other, 0800 and 0900s 214,000 105,329 108,671 49.22%Capital outlay, 0700s 165,000 46,390 118,610 28.12%
Total expenditures 9,263,000 7,602,957 1,660,043 82.08%
Excess (deficiency) of revenues over (under) expenditures - (1,707,503) (1,707,503)
Fund balance, 7/1/05 - - -
Fund balance (deficit), ending -$ (1,707,503)$ (1,707,503)$
Expected year-end fund (deficit) as percentageof annual expenditure budget 0.00%
44

St. Vrain Valley School District RE-1JGovernmental Designated-Purpose Grants Fund (22)Current Year Budget to Actual (Unaudited)Statement of Revenues, Expenditures, and Changes in Fund BalanceFor the period July 1, 2006 to May 31, 2007
FY07 FY07 % ofAmended July - May Balance Actual toBudget Actual Remaining Budget
RevenuesLocal grants, TOTAL 41,000$ 43,321$ 2,321$ 105.66%State grants, TOTAL 49,000 215,796 166,796 440.40%Federal grants, TOTAL 8,045,000 4,946,640 (3,098,360) 61.49%
Total revenues 8,135,000 5,205,757 (2,929,243) 63.99%
ExpendituresSalaries , 0100s 5,645,000 4,622,813 1,022,187 81.89%Benefits , 0200s 1,133,000 918,692 214,308 81.08%Purchased services , 0300, 0400, 0500s 709,000 594,402 114,598 83.84%Supplies and materials , 0600s 298,000 363,872 (65,872) 122.10%Other, 0800 and 0900s 306,000 121,572 184,428 39.73%Capital outlay, 0700s 44,000 55,919 (11,919) 127.09%
Total expenditures 8,135,000 6,677,270 1,457,730 82.08%
Excess (deficiency) of revenues over (under) expenditures - (1,471,513) (1,471,513)
Fund balance, 7/1/06 - - -
Fund balance (deficit), ending -$ (1,471,513)$ (1,471,513)$
Expected year-end fund balance as percentageof annual expenditure budget 0.00%
45

This page intentionally left blank
46

MINIMUM MEDICAL INSURANCE LIABILITY FUND
This is an internal service fund which collects premiums and pays claims for medical and dental plan benefits. Through an insured contract, the District’s maximum liability is limited to the total of its premiums. The premiums paid are determined by the insurance company for renewal on October 1st each year. If the District terminates its contract with the insurance company, the District is responsible for run-off obligations, which have been reserved in the Fund’s fund balance.
47

2006 2007Assets
Cash and investments 2,374,964$ 1,525,506$ Prepaid expenses - 890,293 A
Total assets 2,374,964 2,415,799
LiabilitiesAccounts payable - - Claims payable - -
Total liabilities - -
Net AssetsReserved for contingencies 1,953,000 2,198,582 BUnreserved 421,964 217,217
Total net assets 2,374,964$ 2,415,799$
Footnote:
A Prepaid expense is the difference between the amount of premiums collectedand the amount of claims paid, since the District is liable for claims up to theamount of premiums.
B Reserved for contingency represents the amount for which the District wouldbe responsible if it were to terminate its contract with CIGNA HealthCare.
St. Vrain Valley School District RE-1JMinimum Medical Insurance Liability Fund (65)
Statement of Net Assets (Unaudited)As of May 31,
48

St. Vrain Valley School District RE-1JMinimum Medical Insurance Liability Fund (65)Year-to-Date Actual to Actual (Unaudited)Statement of Revenues, Expenses, and Changes in Fund Net AssetsFor the period July 1 to May 31
FY06 FY07July - May July - May Dollar Percent
Actual Actual Variance Variance
RevenuesInvestment income, 1510 41,907$ 44,763$ 2,856$ 6.82%Charges for service , 1973, 1990 11,054,602 11,155,186 100,584 0.91%
Total revenues 11,096,509 11,199,949 103,440 0.93%
ExpensesSalaries , 0100s 64,439 68,854 (4,415) -6.85%Benefits , 0200s 16,201 15,230 971 5.99%Supplies and materials , 0600s - - - N/AClaims paid, 0335 10,934,054 11,155,186 (221,132) -2.02%
Total expenses 11,014,694 11,239,270 (224,576) -2.04%
Change in net assets 81,815 (39,321) (121,136) -148.06%
Net assets, beginning 2,293,149 2,455,120 161,971 7.06%
Net assets, ending 2,374,964$ 2,415,799$ 40,835$ 1.72%
49

St. Vrain Valley School District RE-1JMinimum Medical Insurance Liability Fund (65)Prior Year Budget to Actual (Unaudited)Statement of Revenues, Expenses, and Changes in Fund Net AssetsFor the period July 1, 2005 to May 31, 2006
FY06 FY06 % ofAmended July - May Balance Actual toBudget Actual Remaining Budget
RevenuesInvestment income, 1510 19,000$ 41,907$ 22,907$ 220.56%Charges for service , 1973, 1990 12,896,000 11,054,602 (1,841,398) 85.72%
Total revenues 12,915,000 11,096,509 (1,818,491) 85.92%
ExpensesSalaries , 0100s 81,000 64,439 16,561 79.55%Benefits , 0200s 15,000 16,201 (1,201) 108.01%Supplies and materials , 0600s 1,000 - 1,000 0.00%Claims paid, 0335 13,396,000 10,934,054 2,461,946 81.62%
Total expenses 13,493,000 11,014,694 2,478,306 81.63%
Change in net assets (578,000) 81,815 659,815
Net assets, 7/1/05 2,293,149 2,293,149 -
Net assets, ending 1,715,149$ 2,374,964$ 659,815$
Expected year-end net assets as percentageof annual expense budget 12.71%
50
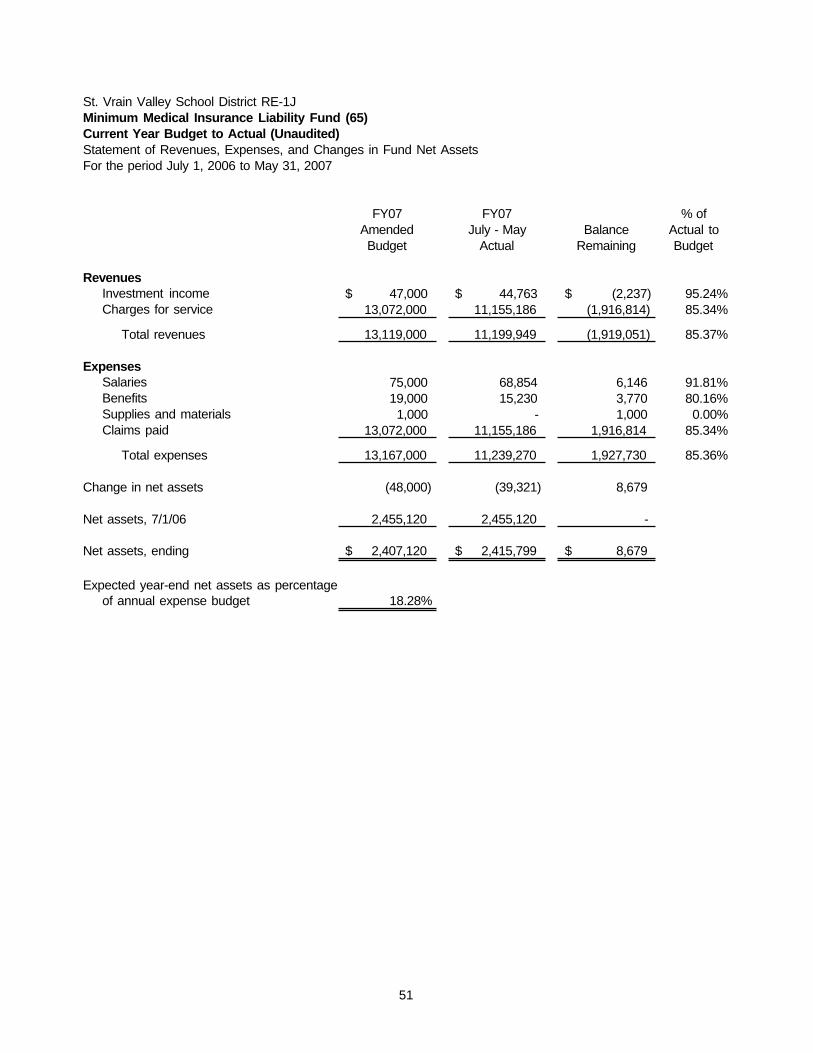
St. Vrain Valley School District RE-1JMinimum Medical Insurance Liability Fund (65)Current Year Budget to Actual (Unaudited)Statement of Revenues, Expenses, and Changes in Fund Net AssetsFor the period July 1, 2006 to May 31, 2007
FY07 FY07 % ofAmended July - May Balance Actual toBudget Actual Remaining Budget
RevenuesInvestment income, 1510 47,000$ 44,763$ (2,237)$ 95.24%Charges for service , 1973, 1990 13,072,000 11,155,186 (1,916,814) 85.34%
Total revenues 13,119,000 11,199,949 (1,919,051) 85.37%
ExpensesSalaries , 0100s 75,000 68,854 6,146 91.81%Benefits , 0200s 19,000 15,230 3,770 80.16%Supplies and materials , 0600s 1,000 - 1,000 0.00%Claims paid, 0335 13,072,000 11,155,186 1,916,814 85.34%
Total expenses 13,167,000 11,239,270 1,927,730 85.36%
Change in net assets (48,000) (39,321) 8,679
Net assets, 7/1/06 2,455,120 2,455,120 -
Net assets, ending 2,407,120$ 2,415,799$ 8,679$
Expected year-end net assets as percentageof annual expense budget 18.28%
51
RISK MANAGEMENT FUND
The Risk Management Fund is used to account for the payment of loss or damage to the property of the school district, workers' compensation, property and liability claims, and the paymen t o f administrative expenses. The main source of revenue is defined by the School Finance Act and is a transfer from General Fund.
52
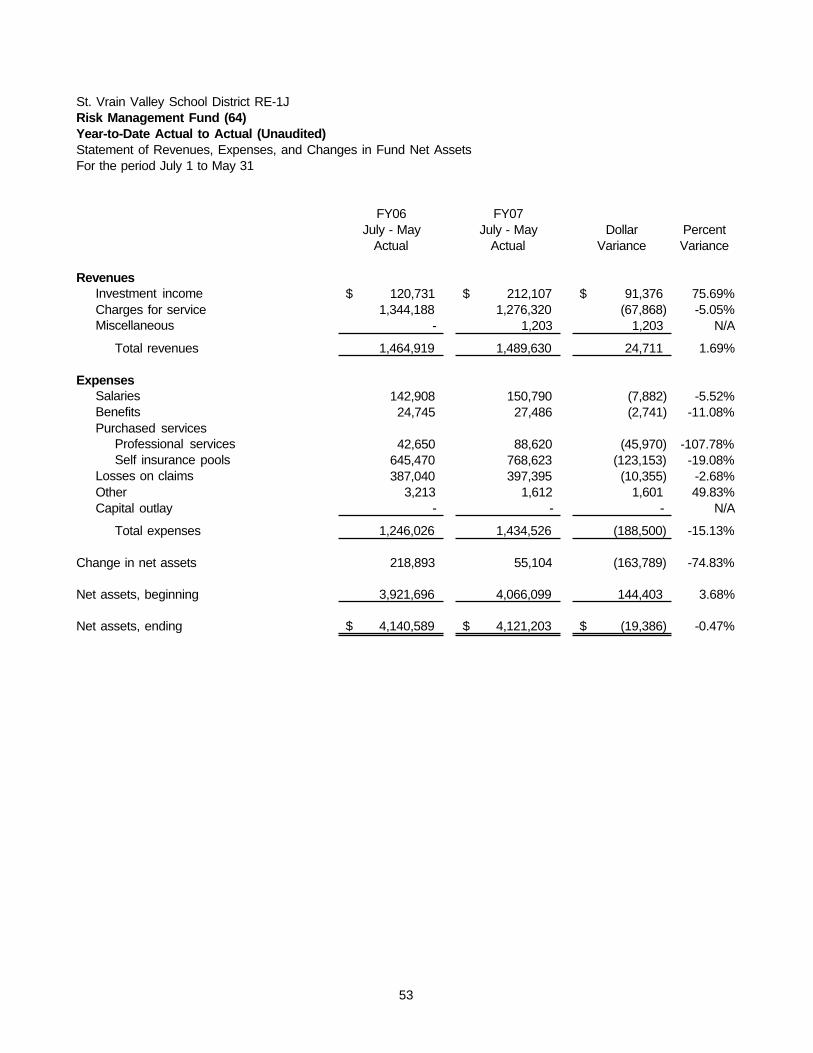
St. Vrain Valley School District RE-1JRisk Management Fund (64)Year-to-Date Actual to Actual (Unaudited)Statement of Revenues, Expenses, and Changes in Fund Net AssetsFor the period July 1 to May 31
FY06 FY07July - May July - May Dollar Percent
Actual Actual Variance Variance
RevenuesInvestment income, 1510 120,731$ 212,107$ 91,376$ 75.69%Charges for service 1,344,188 1,276,320 (67,868) -5.05%Miscellaneous , 1900 - 1,203 1,203 N/A
Total revenues 1,464,919 1,489,630 24,711 1.69%
ExpensesSalaries , 100's 142,908 150,790 (7,882) -5.52%Benefits , 200's 24,745 27,486 (2,741) -11.08%Purchased services 688,120 857,243 (169,123) -24.58%
Professional services , 300,533,550,580,583 42,650 88,620 (45,970) -107.78%Self insurance pools, 520, 521, 522, 526, 529 645,470 768,623 (123,153) -19.08%
Losses on claims, 600 only 387,040 397,395 (10,355) -2.68%Other 3,213 1,612 1,601 49.83%Capital outlay - - - N/A
Total expenses 1,246,026 1,434,526 (188,500) -15.13%
Change in net assets 218,893 55,104 (163,789) -74.83%
Net assets, beginning 3,921,696 4,066,099 144,403 3.68%
Net assets, ending 4,140,589$ 4,121,203$ (19,386)$ -0.47%
53
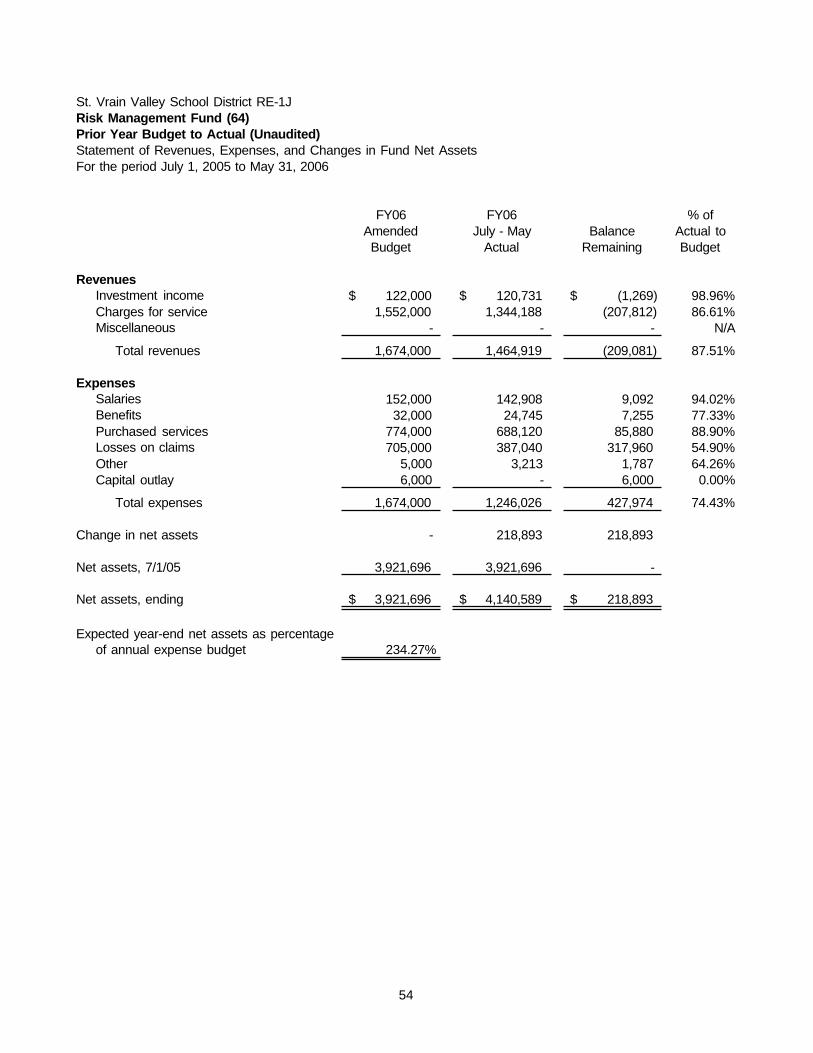
St. Vrain Valley School District RE-1JRisk Management Fund (64)Prior Year Budget to Actual (Unaudited)Statement of Revenues, Expenses, and Changes in Fund Net AssetsFor the period July 1, 2005 to May 31, 2006
FY06 FY06 % ofAmended July - May Balance Actual toBudget Actual Remaining Budget
RevenuesInvestment income, 1510 122,000$ 120,731$ (1,269)$ 98.96%Charges for service 1,552,000 1,344,188 (207,812) 86.61%Miscellaneous , 1900 - - - N/A
Total revenues 1,674,000 1,464,919 (209,081) 87.51%
ExpensesSalaries , 100's 152,000 142,908 9,092 94.02%Benefits , 200's 32,000 24,745 7,255 77.33%Purchased services 774,000 688,120 85,880 88.90%Losses on claims, 600 only 705,000 387,040 317,960 54.90%Other 5,000 3,213 1,787 64.26%Capital outlay 6,000 - 6,000 0.00%
Total expenses 1,674,000 1,246,026 427,974 74.43%
Change in net assets - 218,893 218,893
Net assets, 7/1/05 3,921,696 3,921,696 -
Net assets, ending 3,921,696$ 4,140,589$ 218,893$
Expected year-end net assets as percentageof annual expense budget 234.27%
54

St. Vrain Valley School District RE-1JRisk Management Fund (64)Current Year Budget to Actual (Unaudited)Statement of Revenues, Expenses, and Changes in Fund Net AssetsFor the period July 1, 2006 to May 31, 2007
FY07 FY07 % ofAmended July - May Balance Actual toBudget Actual Remaining Budget
RevenuesInvestment income, 1510 127,000$ 212,107$ 85,107$ 167.01%Charges for service 1,392,000 1,276,320 (115,680) 91.69%Miscellaneous , 1900 - 1,203 1,203 N/A
Total revenues 1,519,000 1,489,630 (29,370) 98.07%
ExpensesSalaries , 100's 169,500 150,790 18,710 88.96%Benefits , 200's 32,000 27,486 4,514 85.89%Purchased services 940,000 857,243 82,757 91.20%Losses on claims, 600 only 987,220 397,395 589,825 40.25%Other - 1,612 (1,612) N/ACapital outlay 6,000 - 6,000 0.00%
Total expenses 2,134,720 1,434,526 700,194 67.20%
Change in net assets (615,720) 55,104 670,824
Net assets, 7/1/06 4,066,099 4,066,099 -
Net assets, ending 3,450,379$ 4,121,203$ 670,824$
Expected year-end net assets as percentageof annual expense budget 161.63%
55

SPECIAL ACTIVITIES FUND The Special Activities Fund records financial transactions related to school-sponsored pupil intrascholastic and interscholastic athletic and other related activities . Although these activities are generally supported by revenues from pupils and gate receipts, they may be supplemented with direct support from the General Fund.
56

St. Vrain Valley School District RE-1JSpecial Activities Fund (23)Current Year Budget to Actual (Unaudited)Statement of Revenues, Expenditures, and Changes in Fund BalanceFor the period July 1, 2006 to May 31, 2007
FY07 FY07 % ofAdopted July - May Balance Actual toBudget Actual Remaining Budget
RevenuesInvestment income -$ 5,914$ 5,914$ N/AAthletic activities - 775,991 775,991 N/APupil activities - 875,324 875,324 N/APTO/Gift activities - 330,491 330,491 N/ACharter school activities - 257,980 257,980 N/A
Total revenues - 2,245,700 2,245,700 N/A
ExpendituresAthletic activities - 824,628 (824,628) N/APupil activities - 559,494 (559,494) N/APTO/Gift activities - 22,531 (22,531) N/ACharter school activities - 69,032 (69,032) N/A
Total expenditures - 1,475,685 (1,475,685) N/A
Excess (deficiency) of revenues
over (under) expenditures - 770,015 770,015
Other Financing SourcesTransfer from General Fund - 226,614 226,614 N/ATransfer from Student Activities (Fund 74) - 789,363 789,363 N/A
- 1,015,977 1,015,977 N/A
Net change in fund balance - 1,785,992 1,785,992
Fund balance, 7/1/06 - - -
Fund balance, ending -$ 1,785,992$ 1,785,992$
57

STUDENT ACTIVITY FUND The Student Activity Fund reports assets held by the Distr ict on behalf of the students . These activities are generally supported by fund-raising events and may not be supplemented with direct support from the General Fund.
58

St. Vrain Valley School District RE-1JStudent Activity Fund (74)Year-to-Date Actual to Actual (Unaudited)Statement of Additions, Deductions, and Changes in Undistributed MoniesFor the period July 1 to May 31
FY06 FY07July - May July - May Dollar Percent
Actual Actual Variance Variance
AdditionsElementary Schools 499,665$ 461,694$ (37,971)$ -7.60%Middle Schools 804,342 837,111 32,769 4.07%High Schools 2,200,188 1,453,610 (746,578) -33.93%Charter Schools 160,655 52,869 (107,786) -67.09%Other additions 640,866 118,841 (522,025) -81.46%
Total additions 4,305,716 2,924,125 (1,381,591) -32.09%
DeductionsElementary Schools 435,298 387,357 47,941 11.01%Middle Schools 675,491 743,559 (68,068) -10.08%High Schools 2,095,938 1,529,938 566,000 27.00%Charter Schools 121,384 49,254 72,130 59.42%Other deductions 415,544 77,257 338,287 81.41%
Total deductions 3,743,655 2,787,365 956,290 25.54%
Change in undistributed moniesbefore transfers 562,061 136,760 (425,301) -75.67%
Transfers outTransfer to Special Activities (Fund 23) - (789,363) (789,363) N/A
Change in undistributed moniesafter transfers 562,061 (652,603) (1,214,664) -216.11%
Undistributed monies, beginning 2,389,859 2,608,342 218,483 9.14%
Undistributed monies, ending 2,951,920$ 1,955,739$ (996,181)$ -33.75%
59
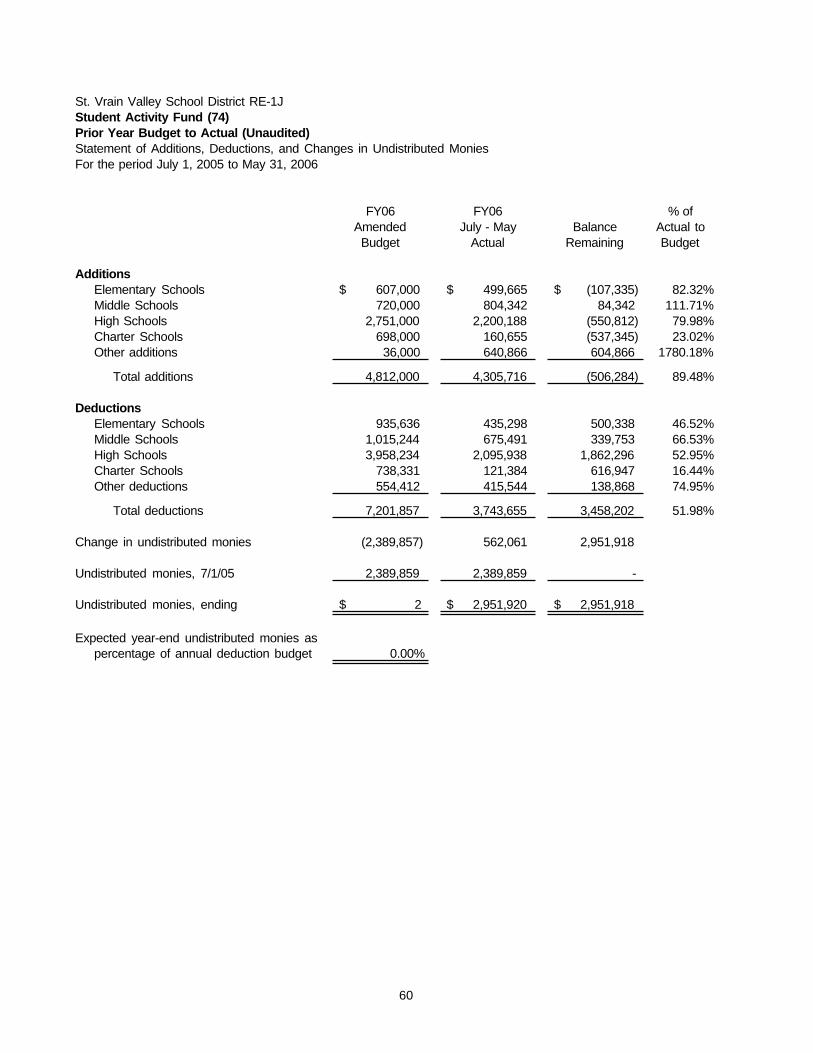
St. Vrain Valley School District RE-1JStudent Activity Fund (74)Prior Year Budget to Actual (Unaudited)Statement of Additions, Deductions, and Changes in Undistributed MoniesFor the period July 1, 2005 to May 31, 2006
FY06 FY06 % ofAmended July - May Balance Actual toBudget Actual Remaining Budget
AdditionsElementary Schools 607,000$ 499,665$ (107,335)$ 82.32%Middle Schools 720,000 804,342 84,342 111.71%High Schools 2,751,000 2,200,188 (550,812) 79.98%Charter Schools 698,000 160,655 (537,345) 23.02%Other additions 36,000 640,866 604,866 1780.18%
Total additions 4,812,000 4,305,716 (506,284) 89.48%
DeductionsElementary Schools 935,636 435,298 500,338 46.52%Middle Schools 1,015,244 675,491 339,753 66.53%High Schools 3,958,234 2,095,938 1,862,296 52.95%Charter Schools 738,331 121,384 616,947 16.44%Other deductions 554,412 415,544 138,868 74.95%
Total deductions 7,201,857 3,743,655 3,458,202 51.98%
Change in undistributed monies (2,389,857) 562,061 2,951,918
Undistributed monies, 7/1/05 2,389,859 2,389,859 -
Undistributed monies, ending 2$ 2,951,920$ 2,951,918$
Expected year-end undistributed monies as percentage of annual deduction budget 0.00%
60

St. Vrain Valley School District RE-1JStudent Activity Fund (74)Current Year Budget to Actual (Unaudited)Statement of Additions, Deductions, and Changes in Undistributed MoniesFor the period July 1, 2006 to May 31, 2007
FY07 FY07 % ofAmended July - May Balance Actual toBudget Actual Remaining Budget
AdditionsElementary Schools 584,000$ 461,694$ (122,306)$ 79.06%Middle Schools 942,000 837,111 (104,889) 88.87%High Schools 2,553,000 1,453,610 (1,099,390) 56.94%Charter Schools 630,000 52,869 (577,131) 8.39%Other additions 162,000 118,841 (43,159) 73.36%
Total additions 4,871,000 2,924,125 (1,946,875) 60.03%
DeductionsElementary Schools 979,884 387,357 592,527 39.53%Middle Schools 1,325,473 743,559 581,914 56.10%High Schools 3,522,359 1,529,938 1,992,421 43.44%Charter Schools 1,445,861 49,254 1,396,607 3.41%Other deductions 205,765 77,257 128,508 37.55%
Total deductions 7,479,342 2,787,365 4,691,977 37.27%
Change in undistributed monies (2,608,342) 136,760 2,745,102 before transfers
Transfers outTransfer to Special Activities (Fund 23) - (789,363) (789,363) N/A
Change in undistributed moniesafter transfers (2,608,342) (652,603) 1,955,739
Undistributed monies, beginning 2,608,342 2,608,342 -
Undistributed monies, ending -$ 1,955,739$ 1,955,739$
0.00%
61

This page intentionally left blank
62

TRUST AND AGENCY FUND - SCHOLARSHIPS
The Trust and Agency Fund is used to account for assets held by a governmental unit in a trustee capacity and is used to record scho la rsh ip award mon ies , according to the individual trust guidelines.
63

St. Vrain Valley School District RE-1JStudent Scholarship Fund (72)Prior Year Budget to Actual (Unaudited)Statement of Additions, Deductions, and Changes in Net AssetsFor the period July 1, 2005 to May 31, 2006
FY06 FY06 % ofAdopted July - May Balance Actual toBudget Actual Remaining Budget
AdditionsInvestment income, 1510 2,000$ 4,187$ 2,187$ 209.35%Contributions , 1920 83,000 69,242 (13,758) 83.42%
Total additions 85,000 73,429 (11,571) 86.39%
DeductionsFees - 10 (10.00) N/AScholarships 165,000 71,380 93,620 43.26%
Total deductions 165,000 71,390 93,610 43.27%
Change in net assets (80,000) 2,039 82,039
Net assets, 7/1/05 199,956 199,956 -
Net assets, ending 119,956$ 201,995$ 82,039$
Expected year-end net assets as percentageof annual deduction budget 72.70%
64

St. Vrain Valley School District RE-1JStudent Scholarship Fund (72)Current Year Budget to Actual (Unaudited)Statement of Additions, Deductions, and Changes in Net AssetsFor the period July 1, 2006 to May 31, 2007
FY07 FY07 % ofAmended July - May Balance Actual toBudget Actual Remaining Budget
AdditionsInvestment income, 1510 5,000$ 6,043$ 1,043$ 120.86%Contributions , 1920 70,000 54,875 (15,125) 78.39%
Total additions 75,000 60,918 (14,082) 81.22%
DeductionsScholarships 81,000 71,725 9,275 88.55%
Total deductions 81,000 71,725 9,275 88.55%
Change in net assets (6,000) (10,807) (4,807)
Net assets, 7/1/06 204,417 204,417 -
Net assets, ending 198,417$ 193,610$ (4,807)$
Expected year-end net assets as percentageof annual deduction budget 244.96%
65

This page intentionally left blank
66

VANCE BRAND CIVIC AUDITORIUM FUND
The Vance Brand Civic Auditorium is a joint effort between the St. Vrain Valley School District and the City of Longmont. This fund accounts for the genera l operat ing revenues, operating expenses, and capital improvements of the auditorium.
67

St. Vrain Valley School District RE-1JVance Brand Civic Auditorium Fund (26)Prior Year Budget to Actual (Unaudited)Statement of Revenues, Expenditures, and Changes in Fund BalanceFor the period July 1, 2005 to May 31, 2006
FY06 FY06 % ofAdopted July - May Balance Actual toBudget Actual Remaining Budget
RevenuesInvestment income, 1510 1,200$ 5,284$ 4,084$ 440.33%Charges for services , 1910, 1911, 1912, 1913, 1990 64,800 60,276 (4,524) 93.02%Contributions 54,000 53,000 (1,000) 98.15% City of Longmont - operations subsidy, 1959 30,000 30,000 - 100.00%
St. Vrain - VBCA capital projects , 1800 12,000 11,000 (1,000) 91.67%City of Longmont - special projects , 1959 12,000 12,000 - 100.00%
Total revenues 120,000 118,560 (1,440) 98.80%
ExpendituresSalaries , 100's 108,500 91,591 16,909 84.42%Benefits , 200's 23,900 19,096 4,804 79.90%Purchased services , 400s and 500s 8,200 2,526 5,674 30.80%Supplies and materials , 600's (including utilities) 11,000 8,701 2,299 79.10%Capital outlay, 0700 15,400 4,975 10,425 32.31%
Total expenditures 167,000 126,889 40,111 75.98%
Excess (deficiency) of revenues over (under) expenditures (47,000) (8,329) 38,671
Other Financing SourcesTransfer from General Fund 47,000 43,083 (3,917) 91.67%
Net change in fund balance - 34,754 34,754
Fund balance, 7/1/05 83,986 83,986 -
Fund balance, ending 83,986$ 118,740$ 34,754$
Expected year-end fund balance as percentageof annual expenditure budget 50.29%
68

St. Vrain Valley School District RE-1JVance Brand Civic Auditorium Fund (26)Current Year Budget to Actual (Unaudited)Statement of Revenues, Expenditures, and Changes in Fund BalanceFor the period July 1, 2006 to May 31, 2007
FY07 FY07 % ofAdopted July - May Balance Actual toBudget Actual Remaining Budget
RevenuesInvestment income, 1510 2,000$ 4,774$ 2,774$ 238.70%Charges for services , 1910, 1911, 1912, 1913, 1990 69,300 64,853 (4,447) 93.58%Contributions 54,000 53,000 (1,000) 98.15% City of Longmont - operations subsidy, 1959 30,000 30,000 - 100.00%
St. Vrain - VBCA capital projects , 1800 12,000 11,000 (1,000) 91.67%City of Longmont - special projects , 1959 12,000 12,000 - 100.00%
Total revenues 125,300 122,627 (2,673) 97.87%
ExpendituresSalaries , 100's 120,264 103,541 16,723 86.09%Benefits , 200's 25,100 20,830 4,270 82.99%Purchased services , 400s and 500s 13,650 2,432 11,218 17.82%Supplies and materials , 600's (including utilities) 10,000 19,144 (9,144) 191.44%Capital outlay, 0700 25,000 19,086 5,914 76.34%
Total expenditures 194,014 165,033 28,981 85.06%
Excess (deficiency) of revenues over (under) expenditures (68,714) (42,406) 26,308
Other Financing SourcesTransfer from General Fund 47,000 43,083 (3,917) 91.67%
Net change in fund balance (21,714) 677 22,391
Fund balance, 7/1/06 105,300 105,300 -
Fund balance, ending 83,586$ 105,977$ 22,391$
Expected year-end fund balance as percentageof annual expenditure budget 43.08%
69

INVESTMENT REPORT
70

St. Vrain Valley School District RE-1J
Monthly Investment ReportMay 31, 2007
Fund Colotrust Csafe Wells Fargo
Morgan
Stanley
Liberty
Savings
George K.
Baum
Centennial
Bank
Annualized
Percent
Current
Month
Interest Total
General -$ 6,674,070$ -$ -$ -$ -$ -$ 5.12 20,443$ 6,674,070$ General 6,639,271 - - - - - - 5.31 20,454 6,639,271
General fund Total 13,313,341
Ute Creek - - - - 17,594 - - 4.16 62 17,594
Carbon Valley - 305,754 - - - - - 5.12 1,328 305,754
Flagstaff - 243,167 - - - - - 5.12 1,080 243,167
Colorado Preschool - 177,816 - - - - - 5.12 772 177,816
Capital Reserve - 782,514 - - - - - 5.12 3,554 782,514Capital Reserve 786,483 - - - - - - 5.31 3,594 786,483
Capital Reserve Total 1,568,998
Student Activity Spec Revenue 1,005,914 5.12 4,369 1,005,914
Vance Brand Civic Auditorium - 104,247 - - - - - 5.12 453 104,247
Community School - 1,064,955 - - - - - 5.12 4,625 1,064,955
Community School 768,645 - - - - - - 5.31 3,360 768,645CVA COMMUNITY SCHOOL 81,091 5.12 352 81,091
Community School Total 1,914,691
Fair Contributions - - - - 3,127,864 - - 4.54 13,227 3,127,864
Bond - - 32,740,679 - - - - NRA 84,398 32,740,679
97 Bldg 351,188 - - - - - - 5.31 1,535 351,188
Building - 345,383 - - - - - 5.12 1,500 345,383
Building - - - - - - 20,192,283 5.25 0 20,192,283
Building - - - 40,853,544 - - - 4.73 160,399 40,853,544Building - - - - 13,073,558 - - 5.11 58,025 13,073,558
Building Total 74,815,955
Food Service - 433,249 - - - - - 5.14 1,882 433,249Food Service 510,330 - - - - - - 5.31 2,231 510,330
Food Service Total 943,579
Self-Insurance - 1,842,794 - - - - - 5.12 8,003 1,842,794
Self-Insurance 151,337 - - - - - - 5.31 662 151,337
Self-Insurance - - - - - 2,721,207 - NRA 1,483 2,721,207
Self-Insurance Total 4,715,338
Minimum Liability - 535,371 - - - - - 5.12 2,325 535,371
Student Activity - - - - 1,915,800 - - 4.51 8,317 1,915,800
CVA STUDENT ACTIVITY 20,294 5.12 88 20,294
Student Activity Total 1,936,094
Scholarship - - - - 127,069 - - 5.30 571 127,069
Total $9,207,255 $13,616,618 $32,740,679 $40,853,544 $18,261,884 $2,721,207 20,192,283$ 409,092$ $137,593,470
71
