may 2013 monthly report - welcome to nyc.gov
TRANSCRIPT

May 21, 2013
Highlights U.S.—Measures of output and employment have been mixed in the face of tight-
ening fiscal policy. Fortunately, several sectors are benefiting from the housing
market recovery which is playing the critical role in keeping the economy afloat.
Financial Markets—Financial markets have been rallying, driven by robust first
quarter earnings and general optimism. Low interest rates due to accommodative
central banks have spurred activity in corporate debt issuance and mortgage mar-
kets. The largest banks completed a respectable quarter and the rate of bank fail-
ures has waned.
Inflation—By any measure, inflation pressure has been muted, which has al-
lowed the Fed to continue its expansionary monetary policy via quantitative eas-
ing. However, much of the new liquidity is returning to the Fed in the form of
excess reserves. In the latest FOMC statement, the Fed opened the possibility
that it may increase the pace of asset purchases.
Labor Markets—The annual benchmark revision to the employment data added
16,000 private sector jobs to the 2012 annual average, suggesting stronger job
growth than earlier employment reports. As of April, private sector jobs are al-
most five percent higher than the pre-recession peak. Gains have been spread
across most sectors, although the securities subsector has been a laggard.
Office Market—After a soft patch in 2012, leasing activity appears to have re-
bounded in early 2013, with net absorption turning positive and roughly con-
sistent with the gains in office-using employment. However, vacancy rates have
jumped due to the addition of the World Trade Center towers to downtown inven-
tory.
Tourism—The sector continues to prove to be a dynamic part of the City’s econ-
omy with record international arrivals in 2012 that are supporting strong occu-
pancy rates and elevated room rates. Hotels continue to expand capacity to wel-
come guests even as they allocate resources to aid displaced residents and relief
workers after Superstorm Sandy.
NYC Personal Income—Personal income in New York City grew over five per-
cent in 2011. The personal income report included revisions to past years’ data.
In particular, revisions to personal income for 2010 were driven by better wage
and salary disbursements and a jump in proprietor’s income.
The City of New York
Michael R. Bloomberg
Mayor
Office of
Management and Budget
Mark Page
Director
Michael Dardia
Deputy Director
Tax Policy, Revenue
Forecasting & Economic
Analysis Task Force
Yousuf Rahman
Chief, U.S. Macroeconomics
Rodney Chun
Chief Economist
Marcelo Yoon
Unit Head
Sathish Vijayan
Senior Analyst
Monthly Report
On
Current Economic
Conditions
-To view current and past monthly reports online please visit our website-
NYC.gov/omb
This report includes forecasts and estimates that are subject to a variety of assumptions, risks and
uncertainties. Such forecasts and estimates are not intended to be representations of fact or guar-
antees of results and should not be relied upon as such.

New York City Office of Management and Budget 1
Monthly Report on Economic Conditions -5/21/2013
While the bulk of economic data has suggested a
positive start for the year, the two most important
indicators of the economy, output and employment,
reveal a mixed picture. Business and consumer sen-
timent reflect extreme caution as federal fiscal tight-
ening will intensify as the year progresses. Accord-
ing to the latest Blue Chip Economic Indicators, the
consensus forecast of GDP growth for the second
and third quarter of this year has been downwardly
revised for the fourth straight month, in reaction to
the mixed U.S. economic news and signs of persis-
tent economic weakness abroad. Fortunately the
housing market turnaround is providing critical sup-
port, creating demand for jobs, raising household
wealth, and even lifting financial markets and feder-
al revenue.
The first quarter GDP growth of 2.5 percent was
supported by an unusually strong 3.2 percent rise in
consumer spending and business inventories con-
tributed a full percentage point to growth. While
this appears to be a comeback from the paltry 0.4
percent GDP growth in the previous quarter, overall
aggregate demand remains sluggish. Real final sales
of domestic product have been decelerating for the
last two quarters and managed only growth of 1.5
percent in the first quarter. Although consumer
spending has been relatively strong, going forward
disposable income will suffer from the effects of the
payroll tax hike and higher taxes for high-income
households. In addition, the federal budget se-
quester will have an impact on job and wage
growth. The strong contribution of inventories to
first quarter growth was almost all due to farm pro-
duce added after last year’s drought; nonfarm busi-
ness inventory showed negligible change. Reflect-
ing these softening trends, the Blue Chip consensus
calls for 1.7 percent and 2.3 percent growth in real
GDP in the second and third quarter of this year,
respectively.
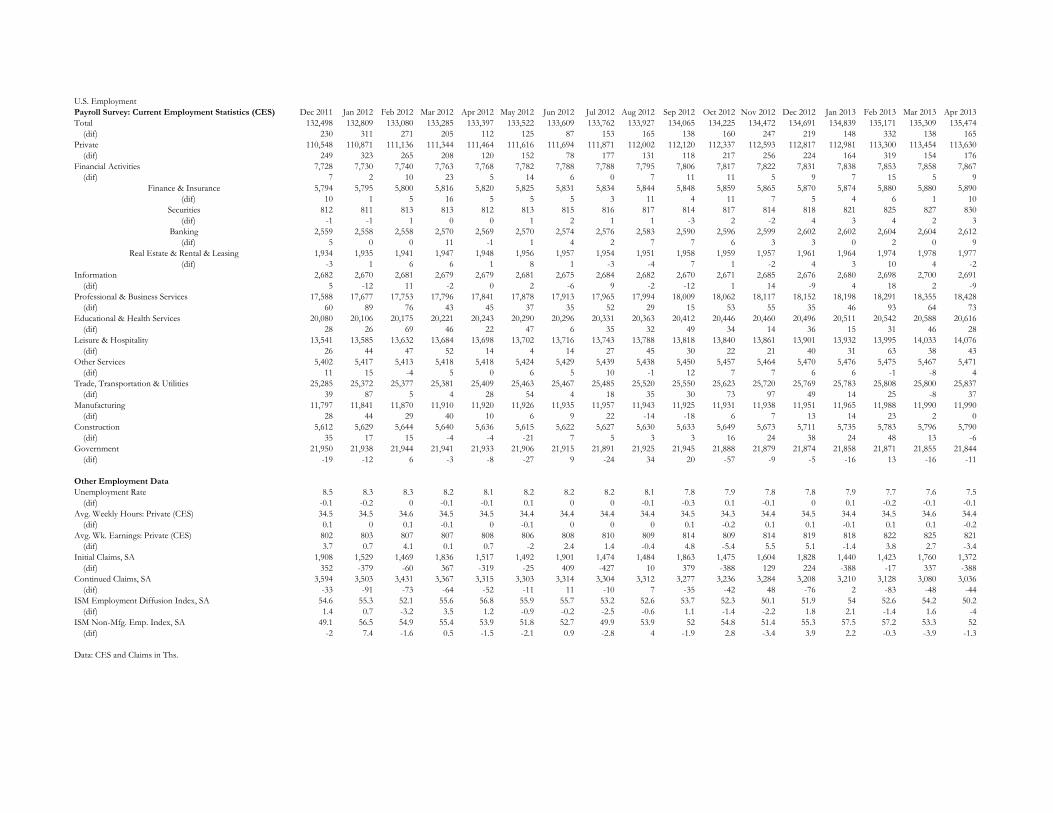
Private sector payrolls grew by 176,000 in April
and, even after the significant upward revisions to
the prior two months’ data, the pace of job growth
does not show upward momentum from the 190,000
average monthly gains seen over the last two years.
All the additions in April occurred in the service-
providing sectors as manufacturing came to a com-
plete halt and commercial construction shrank.
Strong gains of 35,000 jobs in employment services
indicate that employers are still reluctant to hire
staff on a permanent basis. Average weekly hours in
the private sector retracted back to 34.4 from 34.6 in
March. The pace of layoffs may have slowed (4-
week moving average of unemployment claims
have fallen below 340,000) but the pace of hiring
remains tepid. Job openings, based on the JOLTS
report, have been improving since the end of the
recession, but have lately failed to maintain momen-
tum. Further evidence of the sluggish hiring pace is
provided by the BLS diffusion index, which has
slipped to 53.9 in April from 56.2 in March and
from 58.3 a year earlier.1 The comparable figures
for manufacturing are worse. A bright spot of the
latest labor market report was the drop in the unem-
The U.S. Economy
1. The Diffusion Index based on the BLS establishment survey represents the percent of industries with employment increas-
ing plus one-half of the industries with unchanged employment, where 50 percent indicates an equal balance between
industries with increasing and decreasing employment.
Job growth in recent months has failed to maintain
upward momentum.
New York City Office of Management and Budget 2
Monthly Report on Economic Conditions -5/21/2013
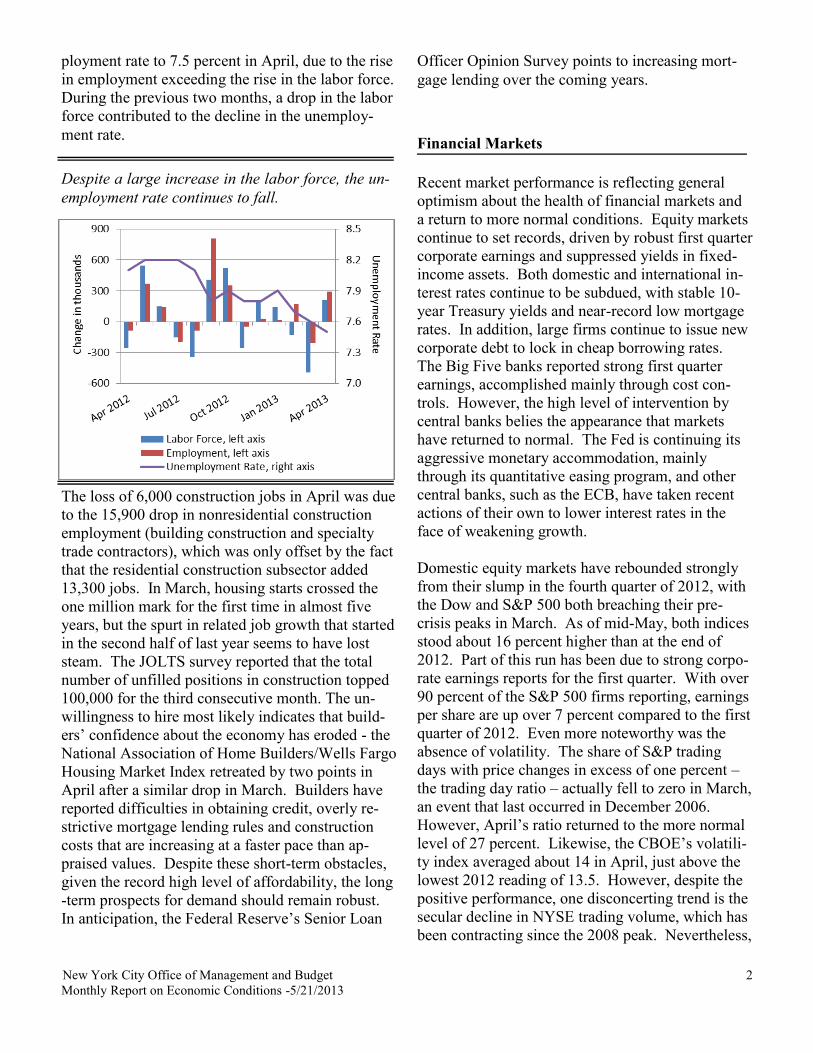
ployment rate to 7.5 percent in April, due to the rise
in employment exceeding the rise in the labor force.
During the previous two months, a drop in the labor
force contributed to the decline in the unemploy-
ment rate.
The loss of 6,000 construction jobs in April was due
to the 15,900 drop in nonresidential construction
employment (building construction and specialty
trade contractors), which was only offset by the fact
that the residential construction subsector added
13,300 jobs. In March, housing starts crossed the
one million mark for the first time in almost five
years, but the spurt in related job growth that started
in the second half of last year seems to have lost
steam. The JOLTS survey reported that the total
number of unfilled positions in construction topped
100,000 for the third consecutive month. The un-
willingness to hire most likely indicates that build-
ers’ confidence about the economy has eroded - the
National Association of Home Builders/Wells Fargo
Housing Market Index retreated by two points in
April after a similar drop in March. Builders have
reported difficulties in obtaining credit, overly re-
strictive mortgage lending rules and construction
costs that are increasing at a faster pace than ap-
praised values. Despite these short-term obstacles,
given the record high level of affordability, the long
-term prospects for demand should remain robust.
In anticipation, the Federal Reserve’s Senior Loan
Officer Opinion Survey points to increasing mort-
gage lending over the coming years.
Recent market performance is reflecting general
optimism about the health of financial markets and
a return to more normal conditions. Equity markets
continue to set records, driven by robust first quarter
corporate earnings and suppressed yields in fixed-
income assets. Both domestic and international in-
terest rates continue to be subdued, with stable 10-
year Treasury yields and near-record low mortgage
rates. In addition, large firms continue to issue new
corporate debt to lock in cheap borrowing rates.
The Big Five banks reported strong first quarter
earnings, accomplished mainly through cost con-
trols. However, the high level of intervention by
central banks belies the appearance that markets
have returned to normal. The Fed is continuing its
aggressive monetary accommodation, mainly
through its quantitative easing program, and other
central banks, such as the ECB, have taken recent
actions of their own to lower interest rates in the
face of weakening growth.
Domestic equity markets have rebounded strongly
from their slump in the fourth quarter of 2012, with
the Dow and S&P 500 both breaching their pre-
crisis peaks in March. As of mid-May, both indices
stood about 16 percent higher than at the end of
2012. Part of this run has been due to strong corpo-
rate earnings reports for the first quarter. With over
90 percent of the S&P 500 firms reporting, earnings
per share are up over 7 percent compared to the first
quarter of 2012. Even more noteworthy was the
absence of volatility. The share of S&P trading
days with price changes in excess of one percent –
the trading day ratio – actually fell to zero in March,
an event that last occurred in December 2006.
However, April’s ratio returned to the more normal
level of 27 percent. Likewise, the CBOE’s volatili-
ty index averaged about 14 in April, just above the
lowest 2012 reading of 13.5. However, despite the
positive performance, one disconcerting trend is the
secular decline in NYSE trading volume, which has
been contracting since the 2008 peak. Nevertheless,
Financial Markets
Despite a large increase in the labor force, the un-
employment rate continues to fall.

New York City Office of Management and Budget 3
Monthly Report on Economic Conditions -5/21/2013
April saw the first year-over-year volume increase
(up 0.1%) in nearly a year and a half.
With the Fed suppressing yields, the low interest
environment continues to support the housing re-
covery and corporate borrowing as well as equity
markets. The benchmark 10-year Treasury yield
has moved in a range between 1.7 and 2.1 percent
since the start of the year. Thirty-year fixed con-
forming mortgage rates reached record lows in No-
vember 2012 at 3.3 percent and were only 10 basis
points (bps) higher in early May. Corporations con-
tinue to take advantage of cheap financing, issuing a
record $1.4 trillion of new debt in 2012. The pace
of issuance through the first four months of 2013
has been about 8 percent higher than last year’s del-
uge.
Preliminary evidence from the Big Five banks’
earnings reports suggests that Wall Street enjoyed a
good first quarter, despite weak revenue. Aggregate
net earnings jumped 54 percent, largely due to strict
cost controls. In particular, first quarter compensa-
tion expenses actually fell slightly. The perfor-
mance of smaller financial institutions has also im-
proved. Due to heavy exposure to real estate, bank
failures peaked in 2010 when the FDIC shuttered
157 banks. This number dropped to 51 institutions
in 2012 and only nine banks have closed so far this
year.
Judging from European sovereign yields, the tur-
moil created by the Cyprus bailout in March was
short-lived. In particular, the sovereign 10-year
yields of southern Eurozone countries extended the
downward trends seen last year. Year-to-date,
Spanish and Portuguese rates have fallen 0.9 and
1.6 percentage points, respectively. Greek yields
finally crossed to single digits in May, the first time
since 2010. However, economic prospects continue
to be daunting for nearly all of the EU countries,
which have suffered from six consecutive quarters
of contraction, the longest since the end of World
War II. As a result, the ECB cut rates in early May
to record lows and is considering the unprecedented
policy of a negative interest rate on bank reserve
deposits in order to encourage stronger banks to
lend excess funds to other banks. In May, several
other central banks cut rates to lift growth, including
India, Denmark, Australia, Poland, Korea and Isra-
el. While the promise that monetary authorities
stand ready to act if needed has clearly reassured
markets, it is hard to argue that the current situation
resembles normalcy.
Another risk for financial markets comes from a
recent effort by eleven members of the European
Union that are pushing a financial transactions tax
(FTT) on equity, debt and derivative sales. The cur-
rent form of the FTT covers not only transactions
that take place within those countries, but also any
trades of securities issued by them. In addition to
extending the imposition of the tax to non-EU fi-
nancial activities, the frequency of certain transac-
tions (e.g. overnight repo purchases) can become
prohibitively expensive over time even with a seem-
ingly low tax rate per transaction. The tax is
planned for January 2014, but is likely to be modi-
fied in response to objections by other countries,
particularly if it is seen to diminish lending or ele-
vate sovereign borrowing costs in the face of a pro-
tracted recession.
The rate of bank failures has declined steadily
since the peak in 2010.
New York City Office of Management and Budget 4
Monthly Report on Economic Conditions -5/21/2013
The uneven pace of the recovery and fiscal uncer-
tainty has pushed the Fed into a more neutral posi-
tion regarding the end of its exceptionally accom-
modative monetary policy. In its last FOMC state-
ment, the central bank recognized that the federal
spending cuts required under the sequester might be
slowing economic growth. As a result, it introduced
the possibility that it might increase the pace of as-
set purchases through its current round of quantita-
tive easing if necessary.
Starting last year, the Fed has been buying about
$85 billion of agency mortgage-backed securities
and longer-term treasury securities per month. As a
consequence, the Fed’s balance sheet passed the $3
trillion mark in the first quarter, growing by nearly
$400 billion through the first four months of 2013.
Simultaneously, the size of the excess reserves that
banks keep at the Fed has also surged, growing by
$310 billion (21 percent) over the same period.
Thus, much of the new liquidity is returning to the
other side of the Fed’s balance sheet and not being
used to support new activity through loans.
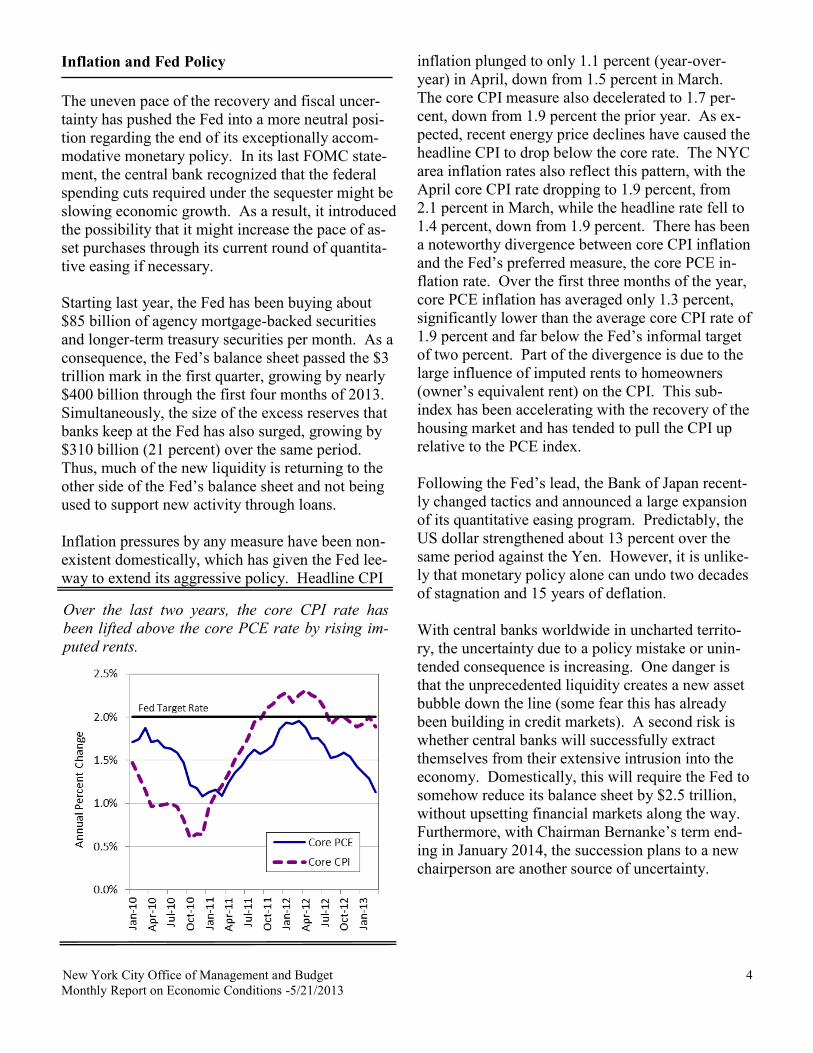
Inflation pressures by any measure have been non-
existent domestically, which has given the Fed lee-
way to extend its aggressive policy. Headline CPI
inflation plunged to only 1.1 percent (year-over-
year) in April, down from 1.5 percent in March.
The core CPI measure also decelerated to 1.7 per-
cent, down from 1.9 percent the prior year. As ex-
pected, recent energy price declines have caused the
headline CPI to drop below the core rate. The NYC
area inflation rates also reflect this pattern, with the
April core CPI rate dropping to 1.9 percent, from
2.1 percent in March, while the headline rate fell to
1.4 percent, down from 1.9 percent. There has been
a noteworthy divergence between core CPI inflation
and the Fed’s preferred measure, the core PCE in-
flation rate. Over the first three months of the year,
core PCE inflation has averaged only 1.3 percent,
significantly lower than the average core CPI rate of
1.9 percent and far below the Fed’s informal target
of two percent. Part of the divergence is due to the
large influence of imputed rents to homeowners
(owner’s equivalent rent) on the CPI. This sub-
index has been accelerating with the recovery of the
housing market and has tended to pull the CPI up
relative to the PCE index.
Following the Fed’s lead, the Bank of Japan recent-
ly changed tactics and announced a large expansion
of its quantitative easing program. Predictably, the
US dollar strengthened about 13 percent over the
same period against the Yen. However, it is unlike-
ly that monetary policy alone can undo two decades
of stagnation and 15 years of deflation.
With central banks worldwide in uncharted territo-
ry, the uncertainty due to a policy mistake or unin-
tended consequence is increasing. One danger is
that the unprecedented liquidity creates a new asset
bubble down the line (some fear this has already
been building in credit markets). A second risk is
whether central banks will successfully extract
themselves from their extensive intrusion into the
economy. Domestically, this will require the Fed to
somehow reduce its balance sheet by $2.5 trillion,
without upsetting financial markets along the way.
Furthermore, with Chairman Bernanke’s term end-
ing in January 2014, the succession plans to a new
chairperson are another source of uncertainty.
Inflation and Fed Policy
Over the last two years, the core CPI rate has
been lifted above the core PCE rate by rising im-
puted rents.
New York City Office of Management and Budget 5
Monthly Report on Economic Conditions -5/21/2013
The benchmark revisions to employment data that
were released in early February show that New
York City’s labor market performed even better
than initially reported. Since hitting the trough in
August 2009, the City has added 295,000 private
sector jobs, surpassing the pre-recession peak em-
ployment level by almost five percent. In compari-
son, national private sector employment remains 1.8
percent below its January 2008 peak.
As of April, most service-providing sectors have
surpassed their pre-recession peaks. The profession-
al and business services sector saw job growth in
the computer services, advertising and consulting
services subsectors. In aggregate, this sector has
surpassed the previous peak by 34,000 jobs.
With the City’s buoyant growth in tourism, the lei-
sure & hospitality sector gained a record 21,000
jobs in 2012, and stood almost 55,000 jobs above
the pre-recession peak as of April 2013. Meanwhile,
retail trade employment has exceeded its previous
peak by 34,000 jobs.
The typically non-cyclical sectors of education and
health services expanded as expected in 2012 with
each adding 8,000 jobs.
The financial activities sector ran into difficulties,
losing approximately 1,000 jobs in 2012. As of
April, the sector remains roughly 36,000 jobs below
its pre-recession level. In particular, the securities
subsector performed rather poorly, shedding almost
3,000 jobs in 2012, following an addition of nearly
6,000 jobs in 2011. Some improvement has been
seen in the last two months, as securities has ex-
panded by a combined 2,300 jobs in March and
April 2013.
The sectors that have weighed on overall employ-
ment growth in recent years are the construction and
manufacturing sectors. However, these employment
sectors appear to have bottomed out in 2012. Manu-
facturing employment grew by nearly 1,000 jobs
and construction added nearly 3,000 jobs. While
construction still remains roughly 16,000 jobs be-
low the pre-recession peak attained in February
2008, it has added over 5,000 jobs in the past four
months.
The most recent household survey showed a move
in the same direction as growth in payrolls. The
New York City unemployment rate was 8.4 percent
in April, the lowest rate since March 2009. While
the rate still remains rather high, it has improved
since late 2009 when it stood at 10.0 percent. By
New York City Employment
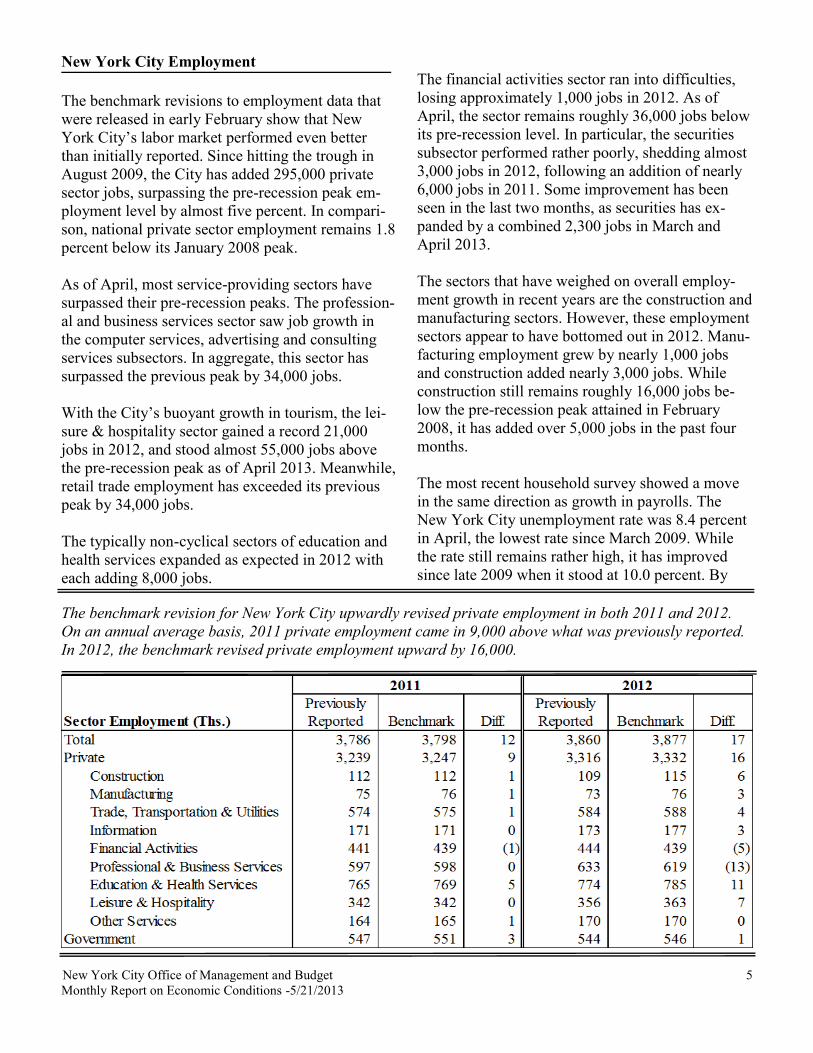
The benchmark revision for New York City upwardly revised private employment in both 2011 and 2012.
On an annual average basis, 2011 private employment came in 9,000 above what was previously reported.
In 2012, the benchmark revised private employment upward by 16,000.
New York City Office of Management and Budget 6
Monthly Report on Economic Conditions -5/21/2013
comparison, the U.S. unemployment rate was 7.5
percent in April.
While the City’s office market was soft for much of
2012, it has rebounded so far in 2013. In 2012, the
office market slowed considerably from the previ-
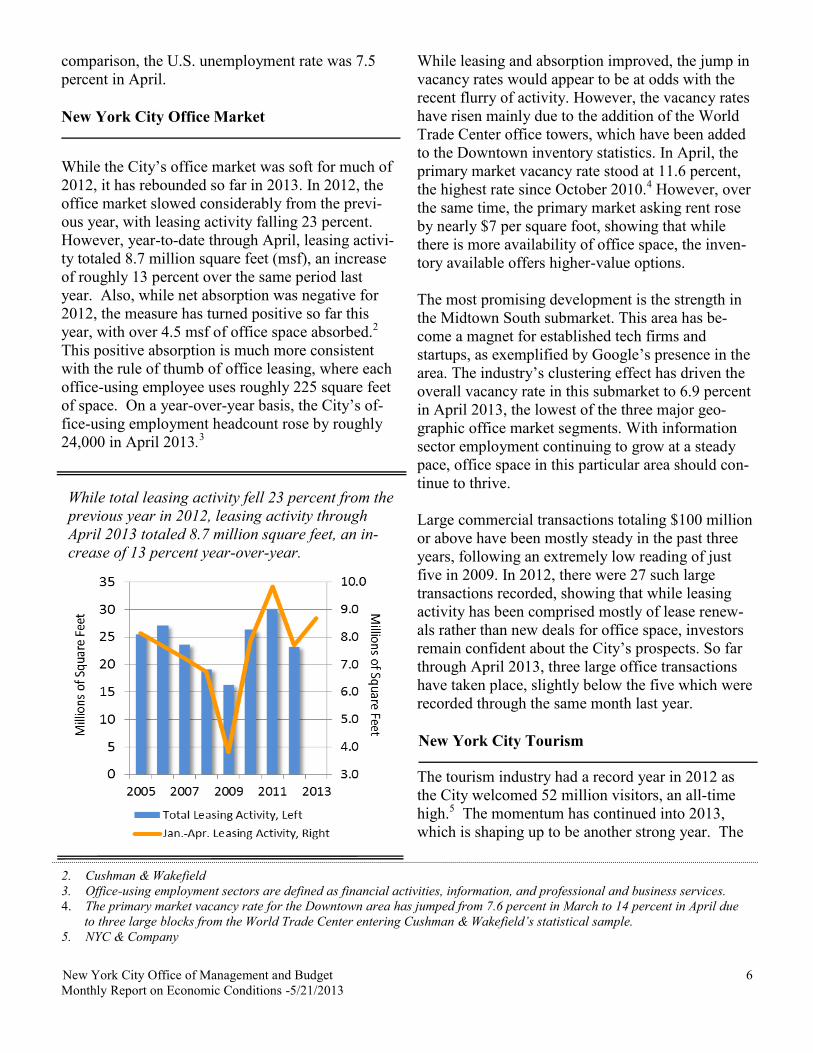
ous year, with leasing activity falling 23 percent.
However, year-to-date through April, leasing activi-
ty totaled 8.7 million square feet (msf), an increase
of roughly 13 percent over the same period last
year. Also, while net absorption was negative for
2012, the measure has turned positive so far this
year, with over 4.5 msf of office space absorbed.2
This positive absorption is much more consistent
with the rule of thumb of office leasing, where each
office-using employee uses roughly 225 square feet
of space. On a year-over-year basis, the City’s of-
fice-using employment headcount rose by roughly
24,000 in April 2013.3
While leasing and absorption improved, the jump in
vacancy rates would appear to be at odds with the
recent flurry of activity. However, the vacancy rates
have risen mainly due to the addition of the World
Trade Center office towers, which have been added
to the Downtown inventory statistics. In April, the
primary market vacancy rate stood at 11.6 percent,
the highest rate since October 2010.4 However, over
the same time, the primary market asking rent rose
by nearly $7 per square foot, showing that while
there is more availability of office space, the inven-
tory available offers higher-value options.
The most promising development is the strength in
the Midtown South submarket. This area has be-
come a magnet for established tech firms and
startups, as exemplified by Google’s presence in the
area. The industry’s clustering effect has driven the
overall vacancy rate in this submarket to 6.9 percent
in April 2013, the lowest of the three major geo-
graphic office market segments. With information
sector employment continuing to grow at a steady
pace, office space in this particular area should con-
tinue to thrive.
Large commercial transactions totaling $100 million
or above have been mostly steady in the past three
years, following an extremely low reading of just
five in 2009. In 2012, there were 27 such large
transactions recorded, showing that while leasing
activity has been comprised mostly of lease renew-
als rather than new deals for office space, investors
remain confident about the City’s prospects. So far
through April 2013, three large office transactions
have taken place, slightly below the five which were
recorded through the same month last year.
The tourism industry had a record year in 2012 as
the City welcomed 52 million visitors, an all-time
high.5 The momentum has continued into 2013,
which is shaping up to be another strong year. The
New York City Office Market
2. Cushman & Wakefield
3. Office-using employment sectors are defined as financial activities, information, and professional and business services.
4. The primary market vacancy rate for the Downtown area has jumped from 7.6 percent in March to 14 percent in April due
to three large blocks from the World Trade Center entering Cushman & Wakefield’s statistical sample.
5. NYC & Company
While total leasing activity fell 23 percent from the
previous year in 2012, leasing activity through
April 2013 totaled 8.7 million square feet, an in-
crease of 13 percent year-over-year.
New York City Tourism

New York City Office of Management and Budget 7
Monthly Report on Economic Conditions -5/21/2013
sector has been a vital engine of growth for the
City’s economy. Hoteliers have benefitted from the
growth in visitor arrivals, even as they allocate
scarce capacity to accommodate displaced residents
and relief workers in the aftermath of Superstorm
Sandy.6 The combination of strong tourist and storm-
related demand has pushed up occupancy rates to
record levels.
Local airports welcomed the most international visi-
tors ever in 2012, while overall arrivals including
domestic air traffic was the second highest after
2007.7 Growing tourist arrivals have been a boon for
hotel construction. In 2012, the City added over
3,000 new rooms to hotel inventories, with more pro-
jects slated for completion in 2013. The expansion
of room inventory has not kept pace with demand, as
evident in persistently high occupancy rates and ris-
ing average daily room rates. After plunging in the
fourth quarter of 2008, occupancy rates have
bounced back to reach the 90 percent threshold in
December 2012. Occupancy rates have since re-
mained near that mark through March 2013, the lat-
est monthly reading. The strength in occupancy has
also been attributed to Superstorm Sandy, which
boosted demand from displaced residents and relief
workers. Another factor lifting occupancy rates is
the growing number of visitors coming from coun-
tries in the Southern hemisphere who collectively are
invigorating the seasonally-slow winter months. The
seasonally adjusted occupancy rate registered 95 per-
cent in January 2013, an all-time high.8
The confluence of these factors is having an appre-
ciable effect on room rates. Average daily room
rates in the City peaked in 2008 at $307. After the
collapse of Lehman Brothers, the hotel industry in
the City reacted rapidly by dropping room rates by
nearly 23 percent, steeper than the decline experi-
enced after 9/11. Activity gradually recovered with
room rates breaching the $300 level in March 2013,
the first reading above that threshold since Septem-
ber 2008. The growth in the average rate is more
remarkable given the steady rise in the share of
budget hotels to the City’s accommodation capacity.
On a year-over-year basis, hotel room rates have ris-
en roughly 7.7 percent in March, a noticeable accel-
eration from the prior month’s measure of 4.7 per-
cent.
The fortunes of the industry will continue to support
employment levels in retail sales and leisure and hos-
pitality, as well as the hotel construction industry.
Though the European financial crisis continues to
weigh on visitor volumes from that region, the diver-
sification of arrivals towards guests from emerging
markets has helped reduce risks to the sector. The
domestic economic recovery, despite uncertainties
stemming from the federal fiscal problems, will also
provide a vital support to the industry.
While only available with a year lag, personal in-
come is one of the most detailed measures available
of the City’s economic activity. The 2011 data for
New York City was released by the Bureau of Eco-
nomic Analysis in November 2012. Personal income
is defined as “the income received by, or on behalf
of, all the residents of an area (nation, state, or coun-
6. New York Times: Relying on Hotel Rooms for Thousands Uprooted by Hurricane Sandy. March 30, 2013
7. Port Authority of New York & New Jersey
8. Not adjusted for seasonal variations in tourist arrivals, the occupancy reading in January was the highest ever for that
month.
Hotel occupancy rates remain elevated, and re-
cently reached an all-time rate of 95 percent in
January 2013 due to a variety of factors.
New York City Personal Income
New York City Office of Management and Budget 8
Monthly Report on Economic Conditions -5/21/2013
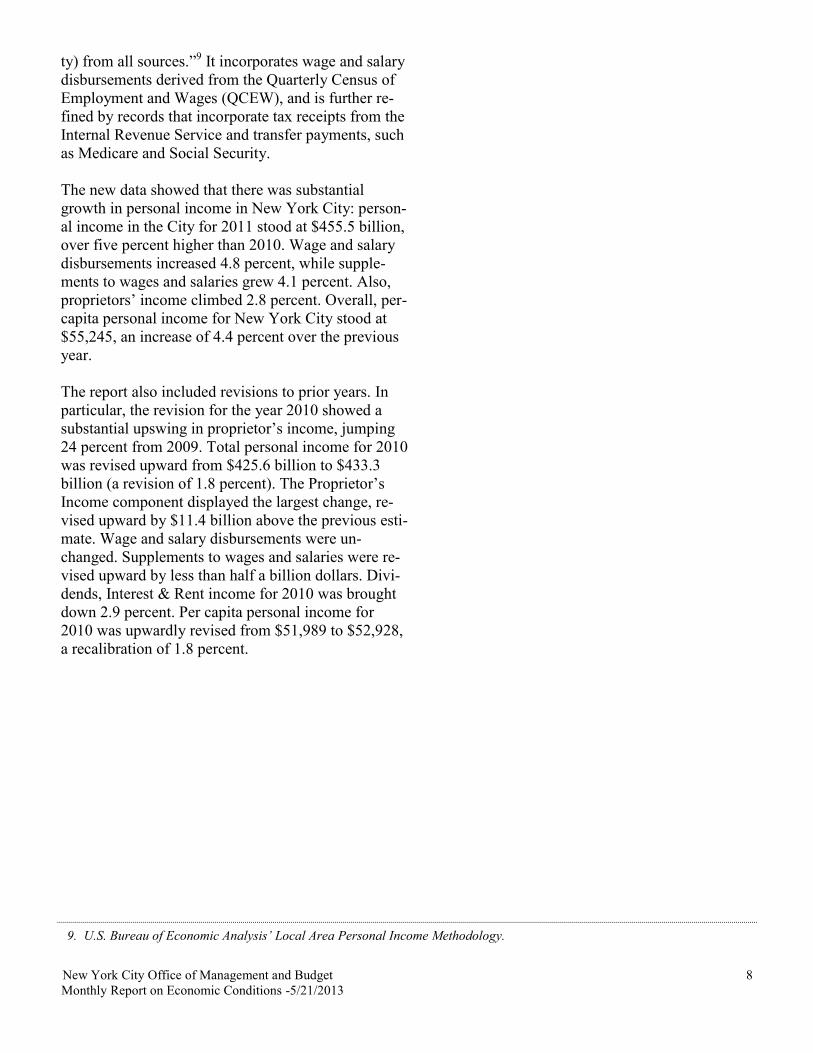
ty) from all sources.”9 It incorporates wage and salary
disbursements derived from the Quarterly Census of
Employment and Wages (QCEW), and is further re-
fined by records that incorporate tax receipts from the
Internal Revenue Service and transfer payments, such
as Medicare and Social Security.
The new data showed that there was substantial
growth in personal income in New York City: person-
al income in the City for 2011 stood at $455.5 billion,
over five percent higher than 2010. Wage and salary
disbursements increased 4.8 percent, while supple-
ments to wages and salaries grew 4.1 percent. Also,
proprietors’ income climbed 2.8 percent. Overall, per-
capita personal income for New York City stood at
$55,245, an increase of 4.4 percent over the previous
year.
The report also included revisions to prior years. In
particular, the revision for the year 2010 showed a
substantial upswing in proprietor’s income, jumping
24 percent from 2009. Total personal income for 2010
was revised upward from $425.6 billion to $433.3
billion (a revision of 1.8 percent). The Proprietor’s
Income component displayed the largest change, re-
vised upward by $11.4 billion above the previous esti-
mate. Wage and salary disbursements were un-
changed. Supplements to wages and salaries were re-
vised upward by less than half a billion dollars. Divi-
dends, Interest & Rent income for 2010 was brought
down 2.9 percent. Per capita personal income for
2010 was upwardly revised from $51,989 to $52,928,
a recalibration of 1.8 percent.
9. U.S. Bureau of Economic Analysis’ Local Area Personal Income Methodology.

U.S. General Economic IndicatorsGDP 2009 Q1 2009 Q2 2009 Q3 2009 Q4 2010 Q1 2010 Q2 2010 Q3 2010 Q4 2011 Q1 2011 Q2 2011 Q3 2011 Q4 2012 Q1 2012 Q2 2012 Q3 2012 Q4 2013 Q1Nominal GDP 13923.4 13885.4 13952.2 14133.6 14270.3 14413.5 14576 14735.9 14814.9 15003.6 15163.2 15321 15478.3 15585.6 15811 15864.1 16010.2Real GDP 12711 12701 12746.7 12873.1 12947.6 13019.6 13103.5 13181.2 13183.8 13264.7 13306.9 13441 13506.4 13548.5 13652.5 13665.4 13750.1 (% ch. a.r.) -5.2 -0.3 1.4 4 2.3 2.2 2.6 2.4 0.1 2.5 1.3 4.1 2 1.3 3.1 0.4 2.5(year % ch.) -4.2 -4.6 -3.3 -0.1 1.9 2.5 2.8 2.4 1.8 1.9 1.6 2 2.4 2.1 2.6 1.7 1.8Final Sales of Domestic Product 12870.3 12890 12928.3 12910.2 12914.7 12985.4 13005.5 13135.6 13154.4 13234.1 13311.2 13361.4 13440.1 13497.9 13577.4 13642 13691.8 (% ch. a.r.) -3.1 0.6 1.2 -0.6 0.1 2.2 0.6 4.1 0.6 2.4 2.4 1.5 2.4 1.7 2.4 1.9 1.5(year % ch.) -3.1 -3.3 -2.2 -0.5 0.3 0.7 0.6 1.7 1.9 1.9 2.4 1.7 2.2 2 2 2.1 1.9Final Sales to Domestic Producers 13261.8 13202.3 13262.3 13245.6 13275.9 13403.9 13454.8 13544.1 13561.9 13623.8 13699.6 13771.3 13847.5 13897.1 13963.6 14016.6 14083.3 (% ch. a.r.) -5.2 -1.8 1.8 -0.5 0.9 3.9 1.5 2.7 0.5 1.8 2.2 2.1 2.2 1.4 1.9 1.5 1.9(year % ch.) -4.1 -4.4 -3.1 -1.5 0.1 1.5 1.5 2.3 2.2 1.6 1.8 1.7 2.1 2 1.9 1.8 1.7
Personal Consumption Expenditures 9039.5 8999.3 9046.2 9045.4 9100.8 9159.4 9216 9308.5 9380.9 9403.2 9441.9 9489.3 9546.8 9582.5 9620.1 9663.9 9740 (% ch. a.r.) -1.6 -1.8 2.1 0 2.5 2.6 2.5 4.1 3.1 1 1.7 2 2.4 1.5 1.6 1.8 3.2(year % ch.) -2.7 -3.1 -1.6 -0.3 0.7 1.8 1.9 2.9 3.1 2.7 2.5 1.9 1.8 1.9 1.9 1.8 2Durable Goods 1091.4 1085.8 1138.6 1120.7 1135.9 1164.5 1184.9 1227.7 1249.4 1242.3 1258.6 1300.1 1336.1 1335.3 1364 1408.3 1436.1 (% ch. a.r.) 1.3 -2 20.9 -6.1 5.5 10.5 7.2 15.3 7.3 -2.3 5.4 13.9 11.5 -0.2 8.9 13.6 8.1(year % ch.) -10.4 -10.2 -2.8 3 4.1 7.2 4.1 9.5 10 6.7 6.2 5.9 6.9 7.5 8.4 8.3 7.5Nondurable Goods 1983.7 1973.3 1981.4 1992.9 2017.7 2018.3 2029.4 2052 2075.3 2073.5 2071.4 2080.5 2088.9 2092 2098.2 2098.8 2104 (% ch. a.r.) -0.3 -2.1 1.7 2.3 5.1 0.1 2.2 4.5 4.6 -0.3 -0.4 1.8 1.6 0.6 1.2 0.1 1(year % ch.) -2.4 -3.4 -1.7 0.4 1.7 2.3 2.4 3 2.9 2.7 2.1 1.4 0.7 0.9 1.3 0.9 0.7
Gross Private Domestic Investment 1516 1400.7 1394.8 1521.1 1591.4 1646.4 1710.1 1684.3 1661.6 1711.3 1735.8 1867.3 1895.1 1898.4 1928.8 1935.1 1991.8 (% ch. a.r.) -43 -27.1 -1.7 41.4 19.8 14.6 16.4 -5.9 -5.3 12.5 5.9 33.9 6.1 0.7 6.6 1.3 12.2(year % ch.) -26.3 -30.8 -27.9 -12.8 5 17.5 22.6 10.7 4.4 3.9 1.5 10.9 14.1 10.9 11.1 3.6 5.1Nonresidential 1324.3 1262 1236.7 1216.4 1222.7 1258.6 1282.1 1310.5 1306.3 1351.3 1411.3 1443.7 1470 1482.9 1476.1 1522.4 1530.3 (% ch. a.r.) -28.9 -17.5 -7.8 -6.4 2.1 12.3 7.7 9.2 -1.3 14.5 19 9.5 7.5 3.6 -1.8 13.1 2.1(year % ch.) -16.7 -20.1 -19.7 -15.7 -7.7 -0.3 3.7 7.7 6.8 7.4 10.1 10.2 12.5 9.7 4.6 5.5 4.1Residential 355.3 333.7 347.2 343 332.7 350.5 322.2 323.3 322.2 325.5 326.6 336 352.1 359.3 370.9 386.2 397.8 (% ch. a.r.) -35.1 -22.2 17.2 -4.8 -11.5 23.2 -28.6 1.4 -1.4 4.2 1.4 12 20.6 8.4 13.6 17.5 12.6(year % ch.) -26.2 -27.9 -20.7 -13.3 -6.4 5 -7.2 -5.7 -3.2 -7.1 1.4 3.9 9.3 10.4 13.6 14.9 13
Net Exports of Goods & Services -403.5 -322.8 -346.9 -347.5 -372.7 -428.7 -458.9 -418.3 -416.6 -399.6 -397.9 -418 -415.5 -407.4 -395.2 -384.7 -400.8 (% ch. a.r.) -49.2 -59 33.4 0.7 32.3 75.1 31.3 -31 -1.6 -15.4 -1.7 21.8 -2.4 -7.6 -11.5 -10.2 17.8(year % ch.) -26.7 -33.6 -25.3 -27.3 -7.6 32.8 32.3 20.4 11.8 -6.8 -13.3 -0.1 -0.3 2 -0.7 -8 -3.5Government Consumption & Investment 2531.6 2590.4 2614.3 2621.1 2600.4 2618.7 2616.7 2587.4 2540.7 2535.4 2516.6 2502.7 2483.7 2479.4 2503.1 2458.1 2432.6 (% ch. a.r.) 1.8 9.6 3.7 1 -3.1 2.8 -0.3 -4.4 -7 -0.8 -2.9 -2.2 -3 -0.7 3.9 -7 -4.1(year % ch.) 2.3 4.3 4.1 4 2.7 1.1 0.1 -1.3 -2.3 -3.2 -3.8 -3.3 -2.2 -2.2 -0.5 -1.8 -2.1Change in Private Inventories -150.2 -185.5 -181.5 -38.8 30.5 33.2 94.9 45 30.3 27.5 -4.3 70.5 56.9 41.4 60.3 13.3 50.3 (dif) -69.9 -35.3 4 142.7 69.3 2.7 61.7 -49.9 -14.7 -2.8 -31.8 74.8 -13.6 -15.5 18.9 -47 37
Additional U.S. IndicatorsGDP Implicit Price Deflator (% ch. a.r.) 0.9 -0.8 0.5 1.2 1.6 1.8 1.9 2 2.1 2.6 3 0.1 2.2 1.5 2.7 1 1.2 (year % ch.) 1.8 0.9 0.3 0.5 0.6 1.3 1.6 1.8 2 2.2 2.4 2 2 1.7 1.6 1.8 1.6Corporate Profits 1198.4 1243.3 1403.2 1524.5 1648 1625.4 1747.5 1788.8 1723.3 1800.9 1830.5 1953.1 1900.1 1921.9 1967.6 2013 -- (% ch.) 23.4 3.7 12.9 8.6 8.1 -1.4 7.5 2.4 -3.7 4.5 1.6 6.7 -2.7 1.1 2.4 2.3 -- (year % ch.) -11.9 -6.8 5.6 57 37.5 30.7 24.5 17.3 4.6 10.8 4.7 9.2 10.3 6.7 7.5 3.1 -- ECI Private: Total Compensation 109.3 109.5 110 110.4 111.1 111.6 112.1 112.7 113.3 114.2 114.6 115.1 115.7 116.3 116.8 117.3 117.7 (% ch. a.r.) 0.7 0.7 1.8 1.5 2.6 1.8 1.8 2.2 2.1 3.2 1.4 1.8 2.1 2.1 1.7 1.7 1.4(year % ch.) 2 1.4 1.3 1.2 1.6 1.9 1.9 2.1 2 2.3 2.2 2.1 2.1 1.8 1.9 1.9 1.7NonFarm Business Productivity 103.9 105.5 106.9 108.1 108.9 108.8 109.7 110.1 109.8 110 109.9 110.5 110.4 110.8 111.7 111.2 111.4 (% ch. a.r.) 5.8 6.5 5.2 4.8 3.1 -0.5 3.2 1.7 -1.3 0.6 -0.1 2.3 -0.7 1.7 3.1 -1.7 0.7(year % ch.) 0.9 1.9 3.5 5.6 4.9 3.1 2.6 1.9 0.8 1 0.2 0.4 0.5 0.8 1.6 0.6 0.9Unit Labor Costs 107.4 107.4 106.5 105.5 105.2 106 105.6 105.2 108.1 107.7 107.6 106.6 108.3 108.2 107.7 108.8 109 (% ch. a.r.) -8.1 -0.2 -3.1 -3.9 -1.2 3.3 -1.5 -1.4 11.4 -1.4 -0.6 -3.4 6.4 -0.5 -1.9 4.4 0.5(year % ch.) -0.6 0.3 -1.6 -3.9 -2.1 -1.3 -0.9 -0.2 2.8 1.6 1.8 1.3 0.2 0.4 0.1 2 0.6
Data: Real GDP & Components in Bil. 2000 $, SAARData: Profits with IDA & CCAdj in Bil $, SAData: ECI All Workers, Index Dec 2005=100, SAData: Prod & Unit Labor All Persons, Index 1992=100, SA
U.S. Employment
Payroll Survey: Current Employment Statistics (CES) Dec 2011 Jan 2012 Feb 2012 Mar 2012 Apr 2012 May 2012 Jun 2012 Jul 2012 Aug 2012 Sep 2012 Oct 2012 Nov 2012 Dec 2012 Jan 2013 Feb 2013 Mar 2013 Apr 2013
Total 132,498 132,809 133,080 133,285 133,397 133,522 133,609 133,762 133,927 134,065 134,225 134,472 134,691 134,839 135,171 135,309 135,474
(dif) 230 311 271 205 112 125 87 153 165 138 160 247 219 148 332 138 165
Private 110,548 110,871 111,136 111,344 111,464 111,616 111,694 111,871 112,002 112,120 112,337 112,593 112,817 112,981 113,300 113,454 113,630
(dif) 249 323 265 208 120 152 78 177 131 118 217 256 224 164 319 154 176
Financial Activities 7,728 7,730 7,740 7,763 7,768 7,782 7,788 7,788 7,795 7,806 7,817 7,822 7,831 7,838 7,853 7,858 7,867
(dif) 7 2 10 23 5 14 6 0 7 11 11 5 9 7 15 5 9
Finance & Insurance 5,794 5,795 5,800 5,816 5,820 5,825 5,831 5,834 5,844 5,848 5,859 5,865 5,870 5,874 5,880 5,880 5,890
(dif) 10 1 5 16 5 5 5 3 11 4 11 7 5 4 6 1 10
Securities 812 811 813 813 812 813 815 816 817 814 817 814 818 821 825 827 830
(dif) -1 -1 1 0 0 1 2 1 1 -3 2 -2 4 3 4 2 3
Banking 2,559 2,558 2,558 2,570 2,569 2,570 2,574 2,576 2,583 2,590 2,596 2,599 2,602 2,602 2,604 2,604 2,612
(dif) 5 0 0 11 -1 1 4 2 7 7 6 3 3 0 2 0 9
Real Estate & Rental & Leasing 1,934 1,935 1,941 1,947 1,948 1,956 1,957 1,954 1,951 1,958 1,959 1,957 1,961 1,964 1,974 1,978 1,977
(dif) -3 1 6 6 1 8 1 -3 -4 7 1 -2 4 3 10 4 -2
Information 2,682 2,670 2,681 2,679 2,679 2,681 2,675 2,684 2,682 2,670 2,671 2,685 2,676 2,680 2,698 2,700 2,691
(dif) 5 -12 11 -2 0 2 -6 9 -2 -12 1 14 -9 4 18 2 -9
Professional & Business Services 17,588 17,677 17,753 17,796 17,841 17,878 17,913 17,965 17,994 18,009 18,062 18,117 18,152 18,198 18,291 18,355 18,428
(dif) 60 89 76 43 45 37 35 52 29 15 53 55 35 46 93 64 73
Educational & Health Services 20,080 20,106 20,175 20,221 20,243 20,290 20,296 20,331 20,363 20,412 20,446 20,460 20,496 20,511 20,542 20,588 20,616
(dif) 28 26 69 46 22 47 6 35 32 49 34 14 36 15 31 46 28
Leisure & Hospitality 13,541 13,585 13,632 13,684 13,698 13,702 13,716 13,743 13,788 13,818 13,840 13,861 13,901 13,932 13,995 14,033 14,076
(dif) 26 44 47 52 14 4 14 27 45 30 22 21 40 31 63 38 43
Other Services 5,402 5,417 5,413 5,418 5,418 5,424 5,429 5,439 5,438 5,450 5,457 5,464 5,470 5,476 5,475 5,467 5,471
(dif) 11 15 -4 5 0 6 5 10 -1 12 7 7 6 6 -1 -8 4
Trade, Transportation & Utilities 25,285 25,372 25,377 25,381 25,409 25,463 25,467 25,485 25,520 25,550 25,623 25,720 25,769 25,783 25,808 25,800 25,837
(dif) 39 87 5 4 28 54 4 18 35 30 73 97 49 14 25 -8 37
Manufacturing 11,797 11,841 11,870 11,910 11,920 11,926 11,935 11,957 11,943 11,925 11,931 11,938 11,951 11,965 11,988 11,990 11,990
(dif) 28 44 29 40 10 6 9 22 -14 -18 6 7 13 14 23 2 0
Construction 5,612 5,629 5,644 5,640 5,636 5,615 5,622 5,627 5,630 5,633 5,649 5,673 5,711 5,735 5,783 5,796 5,790
(dif) 35 17 15 -4 -4 -21 7 5 3 3 16 24 38 24 48 13 -6
Government 21,950 21,938 21,944 21,941 21,933 21,906 21,915 21,891 21,925 21,945 21,888 21,879 21,874 21,858 21,871 21,855 21,844
(dif) -19 -12 6 -3 -8 -27 9 -24 34 20 -57 -9 -5 -16 13 -16 -11
Other Employment Data
Unemployment Rate 8.5 8.3 8.3 8.2 8.1 8.2 8.2 8.2 8.1 7.8 7.9 7.8 7.8 7.9 7.7 7.6 7.5
(dif) -0.1 -0.2 0 -0.1 -0.1 0.1 0 0 -0.1 -0.3 0.1 -0.1 0 0.1 -0.2 -0.1 -0.1
Avg. Weekly Hours: Private (CES) 34.5 34.5 34.6 34.5 34.5 34.4 34.4 34.4 34.4 34.5 34.3 34.4 34.5 34.4 34.5 34.6 34.4
(dif) 0.1 0 0.1 -0.1 0 -0.1 0 0 0 0.1 -0.2 0.1 0.1 -0.1 0.1 0.1 -0.2
Avg. Wk. Earnings: Private (CES) 802 803 807 807 808 806 808 810 809 814 809 814 819 818 822 825 821
(dif) 3.7 0.7 4.1 0.1 0.7 -2 2.4 1.4 -0.4 4.8 -5.4 5.5 5.1 -1.4 3.8 2.7 -3.4
Initial Claims, SA 1,908 1,529 1,469 1,836 1,517 1,492 1,901 1,474 1,484 1,863 1,475 1,604 1,828 1,440 1,423 1,760 1,372
(dif) 352 -379 -60 367 -319 -25 409 -427 10 379 -388 129 224 -388 -17 337 -388
Continued Claims, SA 3,594 3,503 3,431 3,367 3,315 3,303 3,314 3,304 3,312 3,277 3,236 3,284 3,208 3,210 3,128 3,080 3,036
(dif) -33 -91 -73 -64 -52 -11 11 -10 7 -35 -42 48 -76 2 -83 -48 -44
ISM Employment Diffusion Index, SA 54.6 55.3 52.1 55.6 56.8 55.9 55.7 53.2 52.6 53.7 52.3 50.1 51.9 54 52.6 54.2 50.2
(dif) 1.4 0.7 -3.2 3.5 1.2 -0.9 -0.2 -2.5 -0.6 1.1 -1.4 -2.2 1.8 2.1 -1.4 1.6 -4
ISM Non-Mfg. Emp. Index, SA 49.1 56.5 54.9 55.4 53.9 51.8 52.7 49.9 53.9 52 54.8 51.4 55.3 57.5 57.2 53.3 52
(dif) -2 7.4 -1.6 0.5 -1.5 -2.1 0.9 -2.8 4 -1.9 2.8 -3.4 3.9 2.2 -0.3 -3.9 -1.3
Data: CES and Claims in Ths.

The U.S. Consumer & Housing MarketPersonal Income, Consumption and Credit Dec 2011 Jan 2012 Feb 2012 Mar 2012 Apr 2012 May 2012 Jun 2012 Jul 2012 Aug 2012 Sep 2012 Oct 2012 Nov 2012 Dec 2012 Jan 2013 Feb 2013 Mar 2013 Apr 2013Total Personal Income 13032.2 13148.4 13234.7 13298.3 13302.9 13322.3 13355.9 13376.9 13395.7 13446 13452.4 13597.6 13955.5 13448.3 13599.5 13630.4 -- (% ch.) 0.3 0.9 0.7 0.5 0 0.1 0.3 0.2 0.1 0.4 0 1.1 2.6 -3.6 1.1 0.2 -- (year % ch.) 3.6 2.6 2.9 3.2 2.9 3 3.1 3.1 3.3 3.6 3.3 4.6 7.1 2.3 2.8 2.5 -- Disposable Personal Income 11609.1 11708.8 11782.7 11837.7 11841.3 11858.2 11885.9 11904.2 11920.3 11964.7 11964.8 12089.5 12418.8 11925.1 12059.1 12079.8 -- (% ch.) 0.3 0.9 0.6 0.5 0 0.1 0.2 0.2 0.1 0.4 0 1 2.7 -4 1.1 0.2 -- (year % ch.) 2.5 2.2 2.5 2.9 2.6 2.8 2.9 2.9 3 3.4 3.1 4.4 7 1.8 2.3 2 -- Wage Rate ($) 50473 51026 51334 51539 51342 51230 51333 51379 51397 51540 51357 51811 52099 51748 51962 52023 -- (% ch.) 0 1.1 0.6 0.4 -0.4 -0.2 0.2 0.1 0 0.3 -0.4 0.9 0.6 -0.7 0.4 0.1 -- (year % ch.) 1.5 0.9 1.3 1.6 1.2 1.2 1.2 1.1 1.5 1.8 1.1 2.6 3.2 1.4 1.2 0.9 -- Personal Consumption Expenditures (PCE) 10886.3 10941.8 11025.8 11054.1 11080.3 11061.7 11059.5 11102.6 11137.2 11223.4 11219.9 11255.1 11273.9 11302.5 11384.1 11405.1 -- (% ch.) 0.1 0.5 0.8 0.3 0.2 -0.2 0 0.4 0.3 0.8 0 0.3 0.2 0.3 0.7 0.2 -- (year % ch.) 4.2 4.2 4.4 3.9 3.7 3.5 3.5 3.2 3.3 3.6 3.3 3.5 3.6 3.3 3.2 3.2 -- Consumer Installment Credit: Total Outstanding 2615.7 2628.4 2640.3 2650.9 2663.4 2683.3 2691.1 2695.3 2713.9 2723.8 2740 2753.8 2768.2 2780.9 2799.5 2807.5 -- (% ch. a.r.) 6.1 6 5.6 5 5.8 9.4 3.6 1.9 8.6 4.5 7.4 6.2 6.5 5.6 8.3 3.5 -- (year % ch.) 3.7 4.3 4.3 4.4 4.7 5.1 5 4.5 5.6 5.5 5.9 5.8 5.8 5.8 6 5.9 -- Personal Saving as a % of Disposable Personal Income, (%) 3.4 3.7 3.5 3.7 3.5 3.9 4.1 3.9 3.7 3.3 3.4 4.1 6.5 2.3 2.7 2.7 --
Retail SalesTotal Retail Sales & Food Services 397.1 400.2 402.6 406.6 404.3 403.6 400.6 403.6 407.7 412.7 412 414 416.1 415.8 420.5 418.7 419 (% ch.) -0.1 0.8 0.6 1 -0.6 -0.2 -0.7 0.7 1 1.2 -0.2 0.5 0.5 -0.1 1.1 -0.5 0.1(year % ch.) 6.6 6.5 6.2 6.4 5.3 5.2 3.5 4 4.9 5.4 3.9 4.2 4.8 3.9 4.5 3 3.7excl. Food Services & Drinking Places 354.7 357.3 359.2 362.8 360.4 359.8 357 359.7 363.8 368.3 367.5 369 370.4 370.4 375.3 373.2 373.2 (% ch.) -0.1 0.7 0.5 1 -0.7 -0.2 -0.8 0.8 1.1 1.2 -0.2 0.4 0.4 0 1.3 -0.6 0(year % ch.) 6.5 6.2 6 6.3 4.9 4.9 3.2 3.7 4.7 5.3 3.7 3.9 4.4 3.7 4.5 2.9 3.6excl. Autos & Gasoline Stations 280.3 283.1 283.9 287.3 285.3 285.4 284.3 286.9 287.1 289.8 289.3 291.5 293.2 293.4 294.7 294.8 296.5 (% ch.) -0.2 1 0.3 1.2 -0.7 0 -0.4 0.9 0.1 1 -0.2 0.8 0.6 0.1 0.4 0 0.6(year % ch.) 5.6 6.3 5.7 6.2 4.9 4.7 3.3 4.3 3.6 4.5 2.9 3.8 4.6 3.6 3.8 2.6 3.9
TCB Consumer Confidence IndexOverall 64.8 61.5 71.6 69.5 68.7 64.4 62.7 65.4 61.3 68.4 73.1 71.5 66.7 58.4 68 61.9 68.1 (dif) 9.6 -3.2 10.1 -2.2 -0.7 -4.3 -1.7 2.7 -4.1 7.1 4.7 -1.5 -4.8 -8.3 9.6 -6.1 6.2Present Situation 46.5 38.8 46.4 49.9 51.2 44.9 46.6 45.9 46.5 48.7 56.7 57.4 64.6 56.2 61.4 59.2 60.4 (dif) 8.1 -7.7 7.7 3.4 1.3 -6.3 1.7 -0.7 0.6 2.2 8 0.7 7.1 -8.4 5.3 -2.2 1.2Expectations 77 76.7 88.4 82.5 80.4 77.3 73.4 78.4 71.1 81.5 84 80.9 68.1 59.9 72.4 63.7 73.3 (dif) 10.6 -0.3 11.7 -5.9 -2.1 -3 -3.9 4.9 -7.3 10.4 2.5 -3.1 -12.8 -8.2 12.5 -8.8 9.6
The Reuters/UM Index of Consumer SentimentOverall 69.9 75 75.3 76.2 76.4 79.3 73.2 72.3 74.3 78.3 82.6 82.7 72.9 73.8 77.6 78.6 76.4 (dif) 6.2 5.1 0.3 0.9 0.2 2.9 -6.1 -0.9 2 4 4.3 0.1 -9.8 0.9 3.8 1 -2.2Expectations 63.6 69.1 70.3 69.8 72.3 74.3 67.8 65.6 65.1 73.5 79 77.7 63.8 66.6 70.2 70.8 67.8 (dif) 8.7 5.5 1.2 -0.5 2.5 2 -6.5 -2.2 -0.5 8.4 5.5 -1.3 -13.9 2.8 3.6 0.6 -3
Housing MarketNew Single-Family Homes Sold 339 339 366 352 358 369 360 366 367 379 364 394 390 445 411 417 -- (% ch.) 3.7 0 8 -3.8 1.7 3.1 -2.4 1.7 0.3 3.3 -4 8.2 -1 14.1 -7.6 1.5 -- Existing Single-Family Homes Sold 3890 4000 4010 3960 4020 4080 3930 4090 4290 4220 4270 4360 4330 4370 4330 4320 -- (% ch.) -1.3 2.8 0.2 -1.2 1.5 1.5 -3.7 4.1 4.9 -1.6 1.2 2.1 -0.7 0.9 -0.9 -0.2 -- Housing Starts 697 723 713 707 754 711 757 741 749 854 864 842 983 898 969 1021 853 (% ch.) -1.6 3.7 -1.4 -0.8 6.6 -5.7 6.5 -2.1 1.1 14 1.2 -2.5 16.7 -8.6 7.9 5.4 -16.5Housing Permits 701 714 739 785 749 806 785 839 827 921 908 933 943 915 952 890 1017 (% ch.) -1.1 1.9 3.5 6.2 -4.6 7.6 -2.6 6.9 -1.4 11.4 -1.4 2.8 1.1 -3 4 -6.5 14.3Median New Single-Family Home Price 218.6 221.7 239.9 239.8 236.4 239.2 232.6 237.4 253.2 254.6 247.2 245 258.3 245.4 264.9 247 -- (% ch.) 2 1.4 8.2 0 -1.4 1.2 -2.8 2.1 6.7 0.6 -2.9 -0.9 5.4 -5 7.9 -6.8 -- Median Existing Single-Family Home Price 162.6 154.6 156.1 165.1 174.1 180.2 189.6 188.6 185.5 178.9 177 179.4 180.3 171.1 173.5 185.1 -- (% ch.) -0.9 -4.9 1 5.8 5.5 3.5 5.2 -0.5 -1.6 -3.6 -1.1 1.4 0.5 -5.1 1.4 6.7 --
Data: Income & Consumption in Bil. $, SAARData: Credit & Retail Sales in Bil. $, SAData: Home Sales, Starts & Permits in Ths., SAARData: Home Prices in Ths. $

U.S. Price and Production
Consumer Price Index, (1982-84=100, SA) Dec 2011 Jan 2012 Feb 2012 Mar 2012 Apr 2012 May 2012 Jun 2012 Jul 2012 Aug 2012 Sep 2012 Oct 2012 Nov 2012 Dec 2012 Jan 2013 Feb 2013 Mar 2013 Apr 2013
All Items 227.1 227.6 228.3 229 229 228.6 228.9 228.8 230 231.2 231.6 231.1 231.1 231.2 232.8 232.3 231.5
(% ch.) 0 0.2 0.3 0.3 0 -0.1 0.1 0 0.5 0.5 0.2 -0.2 0 0 0.7 -0.2 -0.4
(year % ch.) 3 3 2.9 2.6 2.3 1.7 1.7 1.4 1.7 2 2.2 1.8 1.8 1.6 2 1.5 1.1
Core (All Items Less Food & Energy) 227.2 227.7 227.9 228.4 228.9 229.4 229.9 230.1 230.2 230.6 231 231.3 231.5 232.1 232.5 232.8 232.9
(% ch.) 0.2 0.2 0.1 0.2 0.2 0.2 0.2 0.1 0.1 0.2 0.2 0.1 0.1 0.3 0.2 0.1 0.1
(year % ch.) 2.2 2.3 2.2 2.3 2.3 2.3 2.2 2.1 1.9 2 2 1.9 1.9 1.9 2 1.9 1.7
Commodities 185.7 186.1 187.2 188.1 187.5 186.4 186.3 186 188 189.7 189.9 188.2 187.7 187.1 189.5 188.2 186.1
(% ch.) -0.2 0.2 0.6 0.5 -0.3 -0.6 0 -0.2 1.1 0.9 0.1 -0.9 -0.2 -0.3 1.3 -0.7 -1.2
(year % ch.) 4.3 4.1 4.1 3.5 2.5 1.2 1 0.6 1.3 1.9 2.2 1.2 1.1 0.5 1.2 0.1 -0.7
Services 268.3 268.9 269.1 269.6 270.2 270.7 271.3 271.4 271.8 272.5 273.1 273.7 274.3 275 275.8 276.2 276.6
(% ch.) 0.2 0.2 0.1 0.2 0.2 0.2 0.2 0 0.2 0.3 0.2 0.2 0.2 0.3 0.3 0.2 0.1
(year % ch.) 2.2 2.2 2 2.1 2.1 2.1 2.2 2 2 2.1 2.1 2.2 2.2 2.3 2.5 2.4 2.4
Personal Consumption Expenditures
PCE C-W Price Index, (2000 = 100, SA) 114.7 115 115.3 115.6 115.6 115.4 115.5 115.6 116 116.3 116.5 116.4 116.4 116.4 116.9 116.7 --
(% ch.) 0.1 0.3 0.3 0.2 0 -0.2 0.1 0.1 0.4 0.3 0.2 -0.1 0 0.1 0.4 -0.1 --
(year % ch.) 2.4 2.4 2.4 2.2 1.9 1.5 1.5 1.3 1.4 1.6 1.8 1.5 1.5 1.3 1.3 1 --
PCE C-W Price Index Less Food & Energy, (2000 = 100, SA) 112.7 112.9 113.1 113.3 113.5 113.6 113.8 113.9 113.9 114 114.1 114.2 114.3 114.5 114.6 114.6 --
(% ch.) 0.2 0.3 0.1 0.2 0.1 0.1 0.2 0.1 0 0 0.2 0.1 0 0.2 0.1 0 --
(year % ch.) 1.9 1.9 1.9 2 1.9 1.7 1.8 1.7 1.5 1.5 1.6 1.5 1.4 1.4 1.3 1.1 --
Producer Price Index, (1982=100, SA)
Finished Goods 193.1 193.3 193.9 194 193.6 192.4 192.5 193.2 195.2 197.2 196.9 196 195.8 196 197.3 196.2 194.9
(% ch.) -0.1 0.1 0.3 0.1 -0.2 -0.6 0.1 0.4 1 1 -0.2 -0.5 -0.1 0.1 0.7 -0.6 -0.7
(year % ch.) 4.7 4.1 3.4 2.7 1.8 0.7 0.8 0.6 2 2.1 2.3 1.4 1.4 1.4 1.8 1.1 0.7
Finished Goods Less Food and Energy 180.2 181 181.4 181.7 181.9 182.1 182.4 183.3 183.3 183.4 183.4 183.6 183.9 184.2 184.5 184.8 185
(% ch.) 0.3 0.4 0.2 0.2 0.1 0.1 0.2 0.5 0 0.1 0 0.1 0.2 0.2 0.2 0.2 0.1
(year % ch.) 3.1 3.1 3.1 2.9 2.8 2.8 2.6 2.7 2.6 2.3 2.2 2.2 2.1 1.8 1.7 1.7 1.7
West Texas Intermediate Oil Price, ($ per Bbl) 98.6 100.2 102.3 106.2 103.3 94.7 82.4 87.9 94.2 94.7 89.6 86.7 88.3 94.7 95.3 93.1 92.1
(% ch.) 1.4 1.7 2 3.9 -2.7 -8.4 -13 6.7 7.1 0.6 -5.4 -3.2 1.8 7.3 0.7 -2.4 -1.1
Production
Industrial Production, (Index 2002=100, SA) 95.5 96.2 96.7 96.1 96.9 97.1 97.1 97.6 96.8 97 96.8 98.1 98.2 98.1 99 99.3 98.7
(% ch.) 0.6 0.7 0.5 -0.5 0.7 0.3 0 0.4 -0.8 0.2 -0.1 1.3 0.1 -0.1 0.9 0.3 -0.5
Purchasing Managers Index 52.9 53.7 51.9 53.3 54.1 52.5 50.2 50.5 50.7 51.6 51.7 49.9 50.2 53.1 54.2 51.3 50.7
(dif) 0.6 0.8 -1.8 1.4 0.8 -1.6 -2.3 0.3 0.2 0.9 0.1 -1.8 0.3 2.9 1.1 -2.9 -0.6
Business Activity 56.3 58.7 60.3 58.4 55.2 56 52.4 56.9 56.3 59.6 56.8 60.9 60.8 56.4 56.9 56.5 55
(dif) 0.3 2.4 1.6 -1.9 -3.2 0.8 -3.6 4.5 -0.6 3.3 -2.8 4.1 -0.1 -4.4 0.5 -0.4 -1.5
Total New Orders 230.4 219.1 223.6 215.3 214.7 217.9 221.4 228.6 198.7 216.9 219.2 220.6 228.4 219.9 229.4 216.3 --
(% ch.) 5.1 -4.9 2 -3.7 -0.3 1.5 1.6 3.3 -13.1 9.1 1.1 0.6 3.6 -3.7 4.3 -5.7 --
(year % ch.) 16.1 8.2 14.3 1.8 6.5 4.9 7.8 3.9 -6.6 1.8 3.4 0.6 -0.8 0.4 2.6 0.5 --
Excluding Defense 222.2 209.9 212.7 204.5 206.2 208.1 206.7 216.4 189.8 205.8 208.4 209.5 210.2 212.8 220.1 209.7 --
(% ch.) 6.1 -5.5 1.4 -3.9 0.9 0.9 -0.7 4.7 -12.3 8.5 1.2 0.5 0.3 1.3 3.4 -4.7 --
(year % ch.) 21 11.9 15.1 2.9 9 6.7 7.2 3.6 -5.7 2.5 2.8 0 -5.4 1.4 3.5 2.6 --
Inventory/Sales Ratios, SA
Total Business 1.26 1.28 1.28 1.26 1.26 1.27 1.29 1.28 1.29 1.28 1.28 1.28 1.28 1.29 1.28 -- --
Manufacturing 1.28 1.33 1.33 1.28 1.28 1.27 1.29 1.27 1.28 1.28 1.28 1.27 1.27 1.28 1.27 -- --
Data: Orders in Bil. $, SA

Rates & Trade
Rates Dec 2011 Jan 2012 Feb 2012 Mar 2012 Apr 2012 May 2012 Jun 2012 Jul 2012 Aug 2012 Sep 2012 Oct 2012 Nov 2012 Dec 2012 Jan 2013 Feb 2013 Mar 2013 Apr 2013
M2 Money Stock, (Bil. $, SA) 9638.3 9712.3 9747.8 9784.3 9828.7 9870.3 9921 10012.8 10085.3 10160.9 10245.8 10298.2 10408.9 10448.6 10424.6 10460 10525.9
(year % ch.) 9.7 10.4 10.1 9.9 9.8 9.7 9.2 8 6.3 6.7 7.3 7.2 8 7.6 6.9 6.9 7.1
Discount Rate, (% P.A.) 0.75 0.75 0.75 0.75 0.75 0.75 0.75 0.75 0.75 0.75 0.75 0.75 0.75 0.75 0.75 0.75 0.75
Federal Funds Target Rate, (%) 0.13 0.13 0.13 0.13 0.13 0.13 0.13 0.13 0.13 0.13 0.13 0.13 0.13 0.13 0.13 0.13 0.13
Federal Funds Effective Rate, (% P.A.) 0.07 0.08 0.1 0.13 0.14 0.16 0.16 0.16 0.13 0.14 0.16 0.16 0.16 0.14 0.15 0.14 0.15
Prime Rate, (% P.A.) 3.25 3.25 3.25 3.25 3.25 3.25 3.25 3.25 3.25 3.25 3.25 3.25 3.25 3.25 3.25 3.25 3.25
3-Month T-Bill Auction Average, (%) 0.01 0.03 0.09 0.09 0.08 0.09 0.09 0.1 0.11 0.1 0.1 0.1 0.08 0.07 0.1 0.09 0.06
10-Year T-Bond Nominal, (% P.A.) 1.98 1.97 1.97 2.17 2.05 1.8 1.62 1.53 1.68 1.72 1.75 1.65 1.72 1.91 1.98 1.96 1.76
10-Year T-Bond minus FFunds Rate (Y.Curve) 191 189 187 204 191 164 146 137 155 158 159 149 156 177 183 182 161
Moodys AAA Corporate, (% P.A.) 3.93 3.85 3.85 3.85 3.96 3.8 3.64 3.4 3.48 3.49 3.47 3.5 3.65 3.8 3.9 3.93 3.73
AAA minus 10-Year Bond 195 188 188 168 191 200 202 187 180 177 172 185 193 189 192 197 197
Municipal Bond Yield Average, (%, Seasoned) 4.47 4.32 3.8 4.08 4.12 3.88 4.02 3.9 3.69 3.58 3.53 3.39 3.41 3.4 3.67 3.65 3.7
New York Stock Exchange Vol. (Mil.) 25445 24347 23702 26482 23408 27860 26813 23607 22290 22034 22083 22804 21363 22594 20477 21531 23424
Dow Jones Industrials, (Index 1920=100, Monthly End) 12218 12633 12952 13212 13214 12393 12880 13009 13091 13437 13096 13026 13104 13861 14054 14579 14840
S&P 500 Stock Price (Index 1941-43=10, Monthly Avg) 1243 1301 1352 1389 1386 1341 1323 1360 1403 1443 1438 1395 1422 1480 1512 1551 1571
Nasdaq Composite Index, (Index Feb 05 1971=100) 2602 2744 2929 3036 3035 2900 2850 2920 3033 3137 3060 2941 3004 3126 3169 3236 3251
Trade, (Bil. $, SA)
Total Exports 177.8 178.6 180.2 184.7 182.5 183.1 185.6 182.7 181.1 186.7 180.3 182.5 186.6 184.4 186 184.3 --
(% ch.) 0.6 0.5 0.9 2.5 -1.2 0.4 1.3 -1.5 -0.9 3.1 -3.4 1.2 2.2 -1.2 0.9 -0.9 --
(year % ch.) 7.4 6.3 8.2 6 3.9 4.2 7.5 2.4 1.5 3.3 0.9 3.3 5 3.2 3.2 -0.2 --
Total Imports 229.5 230.9 224.8 236.4 232.2 230.1 226.5 224.6 223.7 227 222.3 230.8 224.8 228.9 229.6 223.1 --
(% ch.) 1.8 0.6 -2.7 5.2 -1.8 -0.9 -1.6 -0.8 -0.4 1.5 -2.1 3.8 -2.6 1.8 0.3 -2.8 --
(year % ch.) 11.3 7.1 6.3 7.9 5.9 3 1.6 0.3 0.2 0.8 -0.9 2.3 -2.1 -0.9 2.2 -5.6 --
Total Trade Balance -51.7 -52.3 -44.6 -51.7 -49.7 -47 -40.9 -41.9 -42.6 -40.3 -42 -48.2 -38.1 -44.5 -43.6 -38.8 --
(% ch.) 6 1 -14.7 16 -3.9 -5.5 -13 2.5 1.4 -5.2 4.2 14.7 -20.9 16.6 -1.9 -11 --
(year % ch.) 27.2 10 -0.5 15.2 14.2 -1.4 -18.7 -8 -5 -9.3 -8 -1.2 -26.3 -15 -2.1 -24.9 --
Import Price Index, (2000=100, NSA)
Total Imports 142.2 142.2 142.2 144.2 144.1 142 138.7 137.7 139.4 140.8 141.2 140.2 139.4 140.1 141 140.3 --
(% ch.) 0 0 0 1.4 -0.1 -1.5 -2.3 -0.7 1.2 1 0.3 -0.7 -0.6 0.5 0.6 -0.5 --
(year % ch.) 8.5 6.9 5.1 3.5 0.8 -0.8 -2.5 -3.3 -1.8 -0.6 0 -1.4 -2 -1.5 -0.8 -2.7 --
Excluding Fuels 120.4 120.6 120.6 121.1 121.3 121.2 120.8 120.3 120.1 120.4 120.7 120.5 120.4 120.6 120.7 120.5 --
(% ch.) 0.1 0.2 0 0.4 0.2 -0.1 -0.3 -0.4 -0.2 0.2 0.2 -0.2 -0.1 0.2 0.1 -0.2 --
(year % ch.) 3.4 2.9 2.4 2 1.3 0.9 0.6 0 -0.4 -0.4 0.1 0.2 0 0 0.1 -0.5 --
Canada (% ch.) 0.3 -0.6 0.1 -0.6 -1.4 -0.7 -1.9 -1.7 1.7 2.3 0.7 0.3 -1.9 0.3 0.9 -0.2 --
Mexico (% ch.) -0.1 1 -1 1.2 -0.3 -1.3 -2.7 -0.1 1 0.8 -0.3 -1.7 -0.1 0.7 1.8 -0.4 --
European Union (% ch.) -0.4 -0.9 -0.1 1 0 -0.2 -0.7 -0.2 -0.1 -0.1 0.7 0 -1 1.6 0.6 -0.7 --
Japan (% ch.) 0.2 0.2 0.2 -0.1 0 0.1 0.1 0 0.1 0.2 0.1 -0.1 -0.1 0 -0.4 -0.2 --
China (% ch.) 0 0.3 0.1 -0.1 -0.4 -0.1 0 0 0 -0.2 -0.2 0 0 -0.1 0 -0.2 --
Export Price Index, (2000=100, NSA)
Total Exports 132.1 132.5 133.1 134.1 134.7 134 131.7 132.2 133.4 134.5 134.6 133.8 133.6 134.1 135.1 134.5 --
(% ch.) -0.5 0.3 0.5 0.8 0.4 -0.5 -1.7 0.4 0.9 0.8 0.1 -0.6 -0.1 0.4 0.7 -0.4 --
(year % ch.) 3.6 2.6 1.8 1.1 0.7 -0.2 -2.1 -1.3 -0.9 -0.6 1.5 0.8 1.1 1.2 1.5 0.3 --
Yen Per U.S. $ 77.8 77 78.5 82.5 81.3 79.7 79.3 78.9 78.7 78.1 79 81 83.8 89.1 93 94.8 97.8
$ per EURO 1.3 1.3 1.3 1.3 1.3 1.3 1.3 1.2 1.2 1.3 1.3 1.3 1.3 1.3 1.3 1.3 1.3
Total Surplus or Deficit, ($Mil.) -85967 -27407 -231677 -198157 59117 -124636 -59741 -69604 -190533 75180 -119995 -172112 -1191 2883 -203539 -106530 112889

NYC Economic Data 2009 Q1 2009 Q2 2009 Q3 2009 Q4 2010 Q1 2010 Q2 2010 Q3 2010 Q4 2011 Q1 2011 Q2 2011 Q3 2011 Q4 2012 Q1 2012 Q2 2012 Q3 2012 Q4 2013 Q1Wage Rate 86,330 65,286 64,781 79,058 94,188 69,917 67,376 80,701 101,961 69,520 70,242 78,900 96,982 69,544 69,102 -- -- (year % ch.) -20.7 -2.8 -3 0.7 9.1 7.1 4 2.1 8.3 -0.6 4.3 -2.2 -4.9 0 -1.6 -- -- Finance Wage Rate 366,098 159,848 154,286 239,841 446,178 204,578 161,537 236,171 499,798 178,415 172,423 228,000 428,571 181,188 167,802 -- -- (year % ch.) -34.7 -5.5 -6.7 5.8 21.9 28 4.7 -1.5 12 -12.8 6.7 -3.5 -14.3 1.6 -2.7 -- -- Securities Wage Rate 502,620 204,639 194,527 335,490 643,435 274,681 205,662 329,469 705,252 226,997 217,998 309,323 582,635 229,180 209,892 -- -- (year % ch.) -38.6 -4.8 -8.5 5.5 28 34.2 5.7 -1.8 9.6 -17.4 6 -6.1 -17.4 1 -3.7 -- -- Private Non-Finance Wage Rate 59,951 56,257 56,336 65,447 62,736 57,716 58,603 67,838 65,605 59,352 60,394 66,587 67,597 59,704 60,012 -- -- (year % ch.) -7.05 -1.64 -1.48 0.11 4.65 2.59 4.02 3.65 4.57 2.84 3.06 -1.84 3.04 0.59 -0.63 -- -- Total Wage Earnings 308.9 233.1 228.2 283.4 332.8 252.1 240.8 294.6 367.3 254.9 256.6 294.1 357.1 260.9 258.7 -- -- (year % ch.) -22.4 -6.1 -6.7 -2.3 7.7 8.1 5.5 4 10.4 1.1 6.6 -0.2 -2.8 2.3 0.8 -- -- Finance Wage Earnings 117.1 49.5 47.4 72.9 134.2 61.8 50.1 73.1 155.9 55.9 55.2 72 133.8 56.5 53 -- -- (year % ch.) -38.6 -13.4 -15.8 -2.9 14.6 24.8 5.7 0.3 16.1 -9.5 10.1 -1.6 -14.1 1.1 -3.9 -- -- Securities Wage Earnings 85.8 33.7 31.8 54.1 101.9 43.9 33.9 53.9 116.4 37.7 37.3 51.7 95.6 37.5 35 -- -- (year % ch.) -43.4 -15 -19.4 -4.9 18.7 30.5 6.5 -0.5 14.2 -14.1 10.2 -4 -17.9 -0.6 -6.2 -- -- Private Non-Finance Wage Earnings 162.2 152.3 150.8 178.8 168.5 158.1 159.8 189.8 180.9 167.2 169.6 191.1 192.6 173.5 174.2 -- -- (year % ch.) -9.02 -4.98 -5.22 -2.69 3.89 3.76 5.93 6.14 7.38 5.78 6.13 0.69 6.46 3.75 2.74 -- --
NYSE Member-Firm Profits, (Bil. $) 8.2 28 13.5 11.7 10.3 3.8 7.3 6.3 9.3 3.3 -3 -2 7.3 3.3 7.1 6.3 6.6 (dif) 19.4 19.8 -14.6 -1.7 -1.4 -6.5 3.5 -1 3.1 -6.1 -6.2 1 9.2 -4 3.8 -0.8 0.3
Total Employment, SA 3732.3 3683.7 3686.3 3672.3 3684.1 3717.7 3706.7 3736.6 3762.7 3788.1 3811.9 3829 3854 3873.4 3890.9 3891.4 3914.9 (year % ch.) -1.68 -3.07 -3.04 -2.85 -1.29 0.92 0.55 1.75 2.14 1.89 2.84 2.47 2.43 2.25 2.07 1.63 1.58Private Employment, SA 3165.8 3122.6 3107 3112 3123.1 3145.7 3158.9 3185.7 3213.5 3240.7 3258.5 3276.8 3306.6 3328.6 3348.6 3343.9 3369.8 (year % ch.) -2.05 -3.53 -4.08 -3.18 -1.35 0.74 1.67 2.37 2.9 3.02 3.15 2.86 2.9 2.71 2.76 2.05 1.91Unemployment Rate 8 9.1 9.9 10 10 9.7 9.4 9.1 8.8 8.9 9.2 9.3 9.4 9.4 9.3 8.9 9 (dif) 1.37 1.13 0.77 0.13 -0.03 -0.27 -0.3 -0.3 -0.27 0.03 0.33 0.13 0.07 0.03 -0.17 -0.37 0.13
Consumer Price Index, (1982-84=100, SA)All Items 234.4 236.2 238.2 238.5 239.3 240.8 241.4 241.9 244 247.7 249.9 249.2 250.5 252.5 253.3 254 255.9 (year % ch.) 1.31 0.02 -0.9 1.37 2.11 1.93 1.36 1.43 1.97 2.86 3.53 3.01 2.65 1.93 1.37 1.93 2.15Core (All Items Less Food & Energy) 245.3 246.8 247.6 248.3 248.6 249.9 251.1 251 251.6 253.9 256.5 257.1 257.9 259.8 260.7 261.5 263.4 (year % ch.) 2.62 2.32 1.4 1.58 1.35 1.26 1.4 1.07 1.21 1.61 2.13 2.45 2.5 2.33 1.65 1.71 2.14
NYC Real Estate Dec 2011 Jan 2012 Feb 2012 Mar 2012 Apr 2012 May 2012 Jun 2012 Jul 2012 Aug 2012 Sep 2012 Oct 2012 Nov 2012 Dec 2012 Jan 2013 Feb 2013 Mar 2013 Apr 2013Primary Asking Rent ($) 66.12 66.79 67.26 67.3 67.33 67.21 66.91 66.72 66.92 67.03 66.29 67.17 67.93 67.98 68.26 67.26 67.09 (dif) 0.45 0.67 0.47 0.04 0.03 -0.12 -0.31 -0.18 0.2 0.1 -0.73 0.87 0.76 0.06 0.27 -1 -0.17Midtown Asking Rent (Pri, $) 70.75 71.16 71.7 71.91 71.78 71.64 71.47 71.38 71.49 71.6 70.64 71.62 72.24 71.92 72.18 71.17 71.95 (dif) 0.28 0.41 0.54 0.2 -0.12 -0.15 -0.17 -0.09 0.11 0.11 -0.96 0.98 0.62 -0.31 0.26 -1.01 0.78Midtown North Asking Rent (Pri, $) 71.22 71.58 72.06 72.08 71.96 71.81 71.67 71.59 71.64 71.76 70.83 71.89 72.54 72.27 72.57 71.66 72.47 (dif) 0.48 0.36 0.48 0.02 -0.12 -0.15 -0.14 -0.08 0.05 0.12 -0.93 1.06 0.65 -0.27 0.3 -0.91 0.81Midtown South Asking Rent (Pri, $) 57.44 59.87 62.51 67.52 66.74 66.74 66.19 64.41 66.18 66.38 63.59 63.59 63.59 65.12 63.45 60.56 61.07 (dif) 2.6 2.43 2.64 5.01 -0.78 0 -0.55 -1.78 1.77 0.2 -2.79 0 0 1.53 -1.67 -2.89 0.51Downtown Asking Rent (Pri, $) 44.36 45.44 45.75 45.24 44.69 44.92 45.29 45.33 45.14 45.19 45.15 45.18 45.16 45.39 45.71 45.36 51.3 (dif) 0.79 1.08 0.31 -0.51 -0.55 0.23 0.37 0.04 -0.19 0.05 -0.04 0.03 -0.02 0.23 0.32 -0.35 5.94
Primary Vacancy Rate 9.7 10.1 10.1 10.1 10.2 10.1 10 10.1 10.2 10.3 10.3 10.4 10 10 9.7 9.8 11.6Midtown Vacancy Rate (Pri) 9.9 10.4 10.4 10.4 10.6 10.5 10.3 10.3 10.5 10.6 10.6 10.7 10.5 10.6 10.3 10.3 11Midtown North Vacancy Rate (Pri) 10.3 10.8 10.8 10.8 11 10.9 10.7 10.8 11 11.1 11.1 11.2 10.9 10.9 10.7 10.7 11.4Midtown South Vacancy Rate (Pri) 4.6 4.9 5.3 5.4 4.9 4.9 5.1 4 3.9 4.4 3.8 4.8 4.8 6.6 5.7 5.9 6.5Downtown Vacancy Rate (Pri) 8.7 8.8 8.9 9 8.6 8.6 9 9.3 9.1 9.2 9 9 8.2 7.6 7.4 7.6 14
NYC Housing Permits 971 814 774 645 1026 800 921 1009 1039 839 934 673 1125 1368 717 471 -- (dif) 233 -157 -40 -129 381 -226 121 88 30 -200 95 -261 452 243 -651 -246 --
NY Metro Area CSW Index 162.5 160.7 158.9 157.4 157.9 160.2 163.3 165.1 166.4 166.2 165.2 163.1 161.9 161.4 162 -- -- (year % ch.) -3.3 -3.2 -3.4 -3 -3.6 -3 -2.1 -2.6 -2.2 -2.2 -1.3 -1.1 -0.3 0.4 1.9 -- --

NYC Employment Seasonally AdjustedDec 2011 Jan 2012 Feb 2012 Mar 2012 Apr 2012 May 2012 Jun 2012 Jul 2012 Aug 2012 Sep 2012 Oct 2012 Nov 2012 Dec 2012 Jan 2013 Feb 2013 Mar 2013 Apr 2013
Total Nonfarm 3835.5 3843.6 3854 3864.3 3861 3879.3 3880 3878.8 3890.7 3903.2 3900.1 3881 3893.2 3918.7 3903.2 3922.8 3938.8 (dif) 4.3 8.2 10.4 10.2 -3.2 18.2 0.7 -1.2 11.9 12.5 -3.1 -19.1 12.2 25.6 -15.6 19.6 16Private 3284.4 3297.2 3306.1 3316.6 3315.2 3333.9 3336.6 3337.9 3351 3356.9 3352.9 3333.1 3345.6 3373.1 3357.4 3378.8 3396.5 (dif) 6.8 12.7 8.9 10.5 -1.4 18.7 2.7 1.2 13.1 5.9 -4 -19.7 12.5 27.4 -15.6 21.3 17.7Financial Activities 439.1 439.1 440.1 439.8 440 439.8 439.8 439.6 438.7 438.3 437.3 434.3 436.9 438.6 435 435 435.4 (dif) -0.9 -0.1 1.1 -0.3 0.2 -0.1 0 -0.2 -0.8 -0.4 -1.1 -3 2.5 1.7 -3.6 0 0.5Finance & Insurance 321.6 320.9 321.9 321.2 321.4 321.5 321.5 321.3 320.4 319.9 320.1 318.9 319.2 319.8 316.8 317.9 318.8 (dif) -0.7 -0.7 1 -0.8 0.2 0.1 0 -0.2 -1 -0.5 0.2 -1.2 0.3 0.6 -3 1.1 1Securities 168.5 167.7 168.3 167.6 167.7 167.5 167 167.5 166.8 165.8 165.9 165.3 164.9 165.5 164.2 165.4 166.5 (dif) -0.9 -0.7 0.6 -0.7 0.1 -0.1 -0.5 0.5 -0.7 -0.9 0.1 -0.6 -0.5 0.6 -1.3 1.2 1.1Banking 89.6 89.6 89.7 89.8 90.1 90.1 90.5 90.2 89.7 90.3 91.3 90.7 90.6 90.4 89.2 89.5 89.3 (dif) 0.2 0 0.1 0.1 0.3 0.1 0.3 -0.3 -0.5 0.6 1.1 -0.7 -0.1 -0.2 -1.1 0.2 -0.2Real Estate & Rental & Leasing 117.5 118.1 118.2 118.6 118.5 118.4 118.3 118.3 118.4 118.4 117.2 115.4 117.7 118.7 118.2 117.1 116.6 (dif) -0.2 0.6 0.1 0.5 -0.1 -0.2 -0.1 0 0.1 0 -1.3 -1.8 2.3 1.1 -0.5 -1.1 -0.5Information 173.2 175.1 175.5 175.3 176.6 177.7 178.3 177.7 177.9 177.5 177.2 175.8 173.9 172.7 171 174.4 175.1 (dif) 0.5 1.9 0.4 -0.2 1.3 1.1 0.6 -0.6 0.2 -0.5 -0.3 -1.4 -1.9 -1.2 -1.7 3.4 0.7Professional & Business Services 605.8 607.3 608.2 611.5 611.5 615.3 617.6 620.3 624.2 627.7 627.5 629 630 632 635.1 636.2 641.7 (dif) 1 1.5 0.9 3.3 0 3.8 2.2 2.7 3.9 3.5 -0.3 1.5 1 2.1 3.1 1.1 5.5Professional, Scientific, & Technical Services 343.6 344.4 345.1 347.5 347.9 349.6 350.7 351.3 353.4 355.4 351.9 350.4 351.5 355.6 357.6 357.4 358.7 (dif) 1.4 0.8 0.8 2.4 0.4 1.7 1 0.6 2.1 2 -3.6 -1.4 1 4.2 2 -0.2 1.3Management of Companies & Enterprises 65.1 65.3 65.4 65.3 65.3 65.3 65.3 65.2 65.2 65.1 65 65.5 65.2 64 62.9 63.4 62.9 (dif) -0.1 0.1 0.1 -0.1 0 0 0 -0.1 0 -0.1 0 0.5 -0.3 -1.1 -1.1 0.4 -0.5Administrative Services 197.1 197.7 197.7 198.7 198.3 200.4 201.6 203.9 205.7 207.2 210.6 213 213.3 212.4 214.6 215.4 220.1 (dif) -0.3 0.6 0 1 -0.4 2.1 1.2 2.3 1.8 1.6 3.3 2.5 0.3 -1 2.3 0.8 4.7Employment Services 65.7 65.1 65.4 66.1 66.3 67.4 68.1 70.3 71.1 72.2 73 70.8 71.9 73.1 73.8 73.6 78 (dif) -0.2 -0.6 0.3 0.6 0.2 1.1 0.6 2.2 0.8 1.1 0.8 -2.2 1 1.3 0.7 -0.2 4.5Educational & Health Services 774.1 775.4 777.2 780.4 780.3 786.1 783.6 788.6 789.1 791.2 791.3 787.8 791 802 794.9 802.9 806.9 (dif) 2 1.3 1.8 3.2 -0.1 5.8 -2.5 5 0.5 2 0.1 -3.4 3.2 11 -7.1 8 4Educational Services 179.8 181.9 182.7 183.8 182.9 186.6 182.7 185.2 185.6 186.6 187.2 186.3 186.7 189.9 182.3 187.6 188 (dif) 0.2 2 0.8 1.1 -0.9 3.7 -3.9 2.5 0.4 1 0.6 -0.9 0.4 3.2 -7.5 5.3 0.4Health Care & Social Assistance 594.3 593.6 594.5 596.6 597.4 599.5 600.9 603.4 603.5 604.5 604.1 601.6 604.3 612.1 612.5 615.3 618.9 (dif) 1.7 -0.7 0.9 2.2 0.8 2.1 1.4 2.5 0.1 1 -0.4 -2.5 2.7 7.8 0.4 2.8 3.6Leisure & Hospitality 352.8 355.9 360 362.4 362.2 365.7 366.6 365.3 368.1 367.7 364.9 356.2 361.4 366.4 363.4 363.7 367.8 (dif) 1.2 3.1 4 2.5 -0.2 3.5 0.9 -1.3 2.7 -0.4 -2.8 -8.7 5.2 4.9 -3 0.3 4.1Arts, Entertainment, & Recreation 71 72.1 72.8 73.2 74.1 75.2 75.1 72.9 73.9 73.3 72.9 71.3 72.8 74.8 73.6 74 74.4 (dif) 0.4 1.1 0.7 0.4 0.8 1.1 -0.1 -2.1 1 -0.6 -0.4 -1.6 1.5 2 -1.1 0.4 0.4Accommodation & Food Services 281.8 283.8 287.1 289.2 288.1 290.5 291.5 292.4 294.1 294.4 292 284.9 288.6 291.6 289.8 289.7 293.4 (dif) 0.8 2 3.3 2 -1.1 2.4 1 0.9 1.7 0.3 -2.4 -7.1 3.8 3 -1.9 -0.1 3.7Other Services 167.2 168.2 168.4 169.1 169 169.6 170.4 170.3 170.6 171.3 173.1 170.5 171.7 174.2 174.1 173.9 174.1 (dif) 0.7 1 0.2 0.7 -0.1 0.6 0.8 -0.1 0.3 0.7 1.8 -2.6 1.2 2.4 0 -0.2 0.2Trade, Transportation, & Utilities 581.9 584.1 585.1 586.6 583.6 587.9 588.6 584.5 591.2 591.6 588.3 589.2 591.8 596.5 592.2 599.4 601.6 (dif) 1.7 2.2 1 1.5 -3 4.2 0.7 -4.1 6.7 0.3 -3.2 0.9 2.5 4.8 -4.3 7.2 2.1Retail Trade 321.5 323.1 323.4 324.7 324.2 325.9 325.7 327.4 328.2 329.1 326.8 327.9 329 331.6 333 334 335.6 (dif) 1.2 1.6 0.3 1.3 -0.5 1.7 -0.2 1.7 0.8 1 -2.4 1.1 1.2 2.5 1.4 1 1.6Wholesale Trade 139.8 140.2 140.7 140.7 140.1 140.3 140.9 140.9 140.7 140.6 139.8 139.2 140.6 141.6 141.8 142.3 143.7 (dif) 0.5 0.4 0.5 0 -0.6 0.2 0.6 0 -0.1 -0.1 -0.8 -0.6 1.3 1 0.2 0.5 1.4Transportation & Warehousing 105.4 105.4 105.6 106 104.1 106.2 106.4 107 106.8 106.5 106.6 107 107.2 108.5 102.7 108.3 107.4 (dif) -0.1 0 0.2 0.4 -1.9 2.2 0.2 0.6 -0.2 -0.3 0.1 0.3 0.2 1.3 -5.8 5.6 -0.9Utilities 15.3 15.4 15.3 15.2 15.3 15.5 15.6 9.3 15.5 15.3 15.1 15.2 15 14.9 14.7 14.8 14.8 (dif) 0 0.1 -0.1 -0.1 0 0.2 0.1 -6.3 6.2 -0.3 -0.2 0.1 -0.2 -0.1 -0.2 0.1 0Construction 113.9 115.2 115 114.9 115.6 115 115.1 114.8 114.6 115 116.2 114.5 113.7 115.7 116.6 118.1 118.8 (dif) 0.5 1.3 -0.2 -0.1 0.8 -0.6 0.1 -0.3 -0.2 0.4 1.2 -1.7 -0.8 2 1 1.5 0.6Manufacturing 76.3 76.8 76.6 76.5 76.4 76.7 76.6 76.6 76.4 76.6 77.1 75.7 75.2 75 75.1 75.1 75 (dif) 0.2 0.4 -0.1 -0.1 -0.1 0.3 -0.1 0 -0.2 0.1 0.5 -1.4 -0.5 -0.2 0 0 0Government 551 546.5 547.9 547.7 545.8 545.4 543.4 540.9 539.8 546.4 547.3 547.8 547.5 545.6 545.7 544 542.3 (dif) -2.5 -4.6 1.5 -0.3 -1.9 -0.4 -2 -2.4 -1.2 6.6 0.9 0.6 -0.3 -1.9 0.1 -1.7 -1.7
Source: NYS DOLData: Ths., Seasonally Adjusted by OMB

NYC Employment Non-Seasonally AdjustedJan 2012 Feb 2012 Mar 2012 Apr 2012 May 2012 Jun 2012 Jul 2012 Aug 2012 Sep 2012 Oct 2012 Nov 2012 Dec 2012 Jan 2013 Feb 2013 Mar 2013 Apr 2013 2012 2013
Total 3787.1 3821.7 3848.6 3865 3892.5 3892 3874.9 3867.2 3894.1 3920.9 3921.9 3943.9 3860.5 3870.4 3907.4 3943.9 3877.5 3895.6 (year dif) 85.2 89.9 95.4 74.2 93.7 92.1 72.4 77.9 84.3 80.7 50.6 57.5 73.4 48.7 58.8 78.9 79.5 18.1Private 3252.3 3277.5 3300.9 3316.3 3342.6 3349.6 3319.7 3322.5 3353.2 3374.7 3375.9 3398.3 3327.1 3328.4 3363.3 3398.4 3332 3354.3 (year dif) 90.1 91.5 95.3 77.2 94.8 95.2 83.9 97.2 87.2 85.2 56.1 61.1 74.8 50.9 62.4 82.1 84.6 22.3Financial Activities 435.7 437.7 437.4 437.1 436.3 442.1 444.8 444.3 438.3 436.7 434.4 438.8 435.2 432.6 432.5 432.7 438.6 433.3 (year dif) 2.9 3.5 2.5 1.2 -0.4 -0.7 -1.7 -3 -2.9 -3.2 -5.8 -2.4 -0.5 -5.1 -4.9 -4.4 -0.8 -5.4Finance & Insurance 318.8 320.8 319.5 318.4 318 323 326.3 325.9 319.5 319.2 318.6 320.2 317.7 315.7 316.1 315.9 320.7 316.4 (year dif) 2.4 2.6 0.8 1 0 -1 -2.1 -3.5 -3.6 -2.7 -3.5 -2.5 -1.1 -5.1 -3.4 -2.5 -1 -4.3Securities 166.2 167.4 166.1 165.4 165 168.3 171.2 171.2 165.4 165.6 165.2 165 164 163.4 163.9 164.2 166.8 163.9 (year dif) -0.2 -0.1 -1.4 -1 -1.7 -3 -3.1 -4 -4.4 -3.8 -4.1 -3.7 -2.2 -4 -2.2 -1.2 -2.5 -3Banking 89.3 89.7 89.8 89.5 89.4 90.5 90.9 90.4 90.3 90.9 90.6 91.1 90.1 89.2 89.4 88.8 90.2 89.4 (year dif) 2.9 2.7 2.5 2.7 2.3 2.1 1.5 0.6 1.1 2.1 1.3 1 0.8 -0.5 -0.4 -0.7 1.9 -0.8Real Estate & Rental & Leasing 116.9 116.9 117.9 118.7 118.3 119.1 118.5 118.4 118.8 117.5 115.8 118.6 117.5 116.9 116.4 116.8 118 116.9 (year dif) 0.5 0.9 1.7 0.2 -0.4 0.3 0.4 0.5 0.7 -0.5 -2.3 0.1 0.6 0 -1.5 -1.9 0.2 -1Information 171.5 172.9 173.6 176.3 178.1 179.2 178.2 178.3 178.3 178.7 177.5 176.1 169.1 168.5 172.7 174.9 176.6 171.3 (year dif) 5.3 5.4 4.5 5.5 6.9 7.4 5.8 12.8 4.8 5.5 3.2 0.7 -2.4 -4.4 -0.9 -1.4 5.6 -5.3Professional & Business Services 598.3 602.6 607.4 609.6 612.9 622 624.8 627.4 625.9 629 634.3 636.8 622.4 629.1 631.9 639.8 619.3 630.8 (year dif) 20 18.8 19.7 16.1 20.4 20.9 20.8 23.6 25 25.3 24.4 24.3 24.1 26.5 24.5 30.2 21.6 11.5Professional, Scientific, & Technical Services 341.3 344.7 347.2 347.9 347 353.6 354.9 354.7 351.1 350.7 352 353.9 352.5 357.2 357.1 358.8 349.9 356.4 (year dif) 17.2 16.7 17.8 15.4 17.1 16.6 14.9 15.7 15.4 11.4 8.2 7.8 11.2 12.5 9.9 10.9 14.5 6.5Management of Companies & Enterprises 64.8 65 65 64.9 65 65.9 65.7 65.6 64.6 64.8 65.9 65.8 63.5 62.6 63.1 62.5 65.2 62.9 (year dif) 0.9 0.9 0.6 0.4 0.5 0.3 0 0 -0.1 -0.1 0.3 0 -1.3 -2.4 -1.9 -2.4 0.3 -2.3Administrative Services 192.2 192.9 195.2 196.8 200.9 202.5 204.2 207.1 210.2 213.5 216.4 217.1 206.4 209.3 211.7 218.5 204.1 211.5 (year dif) 1.9 1.2 1.3 0.3 2.8 4 5.9 7.9 9.7 14 15.9 16.5 14.2 16.4 16.5 21.7 6.8 7.4Employment Services 63 63.6 64.8 64.9 67.1 68.2 68.8 70.2 73.8 74.9 73.4 75.7 70.7 71.7 72.2 76.4 69 72.8 (year dif) 1.2 1.2 1 1 2.5 2.8 5.2 5.5 7.1 8.1 5.2 6.5 7.7 8.1 7.4 11.5 3.9 3.7Educational & Health Services 771.1 785.5 792.8 793 796.1 777.3 761.9 757.2 781.7 799.2 800.7 805.3 797.4 803.1 815.8 820.1 785.1 809.1 (year dif) 13.2 13.3 16.7 11.2 15.9 17 17.6 16.4 16.4 19.8 15.9 16.8 26.3 17.6 23 27.1 15.8 24Educational Services 180.1 192.4 195.4 194.5 193.5 174.2 161.3 158.5 180.8 194.9 196.5 195.9 188 192 199.6 199.9 184.8 194.9 (year dif) 9.3 9.7 11.3 7.1 8.4 7.7 6.9 6.7 6.4 9 7 6.8 7.9 -0.4 4.2 5.4 8 10Health Care & Social Assistance 591 593.1 597.4 598.5 602.6 603.1 600.6 598.7 600.9 604.3 604.2 609.4 609.4 611.1 616.2 620.2 600.3 614.2 (year dif) 3.9 3.6 5.4 4.1 7.5 9.3 10.7 9.7 10 10.8 8.9 10 18.4 18 18.8 21.7 7.8 13.9Leisure & Hospitality 342.3 349 355.1 363.2 372.3 373.8 367.9 368.2 370.6 368.3 360.7 365.2 352.4 352.5 356.5 368.9 363.1 357.6 (year dif) 21.2 24.5 25.1 22.9 28.9 27.1 23.7 25.5 22.9 15.9 4.5 8.5 10.1 3.5 1.4 5.7 20.9 -5.5Arts, Entertainment, & Recreation 69.3 70.8 72.5 75.2 76.5 76.1 73.8 73.2 71.8 73.1 73.1 74.3 71.9 71.6 73.3 75.6 73.3 73.1 (year dif) 4.4 5.2 5.6 5.4 9.4 8.1 5 6.1 5.1 1.9 0.7 1.8 2.6 0.8 0.8 0.4 4.9 -0.2Accommodation & Food Services 273 278.2 282.6 288 295.8 297.7 294.1 295 298.8 295.2 287.6 290.9 280.5 280.9 283.2 293.3 289.7 284.5 (year dif) 16.8 19.3 19.5 17.5 19.5 19 18.7 19.4 17.8 14 3.8 6.7 7.5 2.7 0.6 5.3 16 -5.3Other Services 166.5 167.6 168.4 169.3 171 171.9 169.8 168.7 170.8 174 171.5 172.8 172.4 173.3 173.2 174.5 170.2 173.4 (year dif) 5.4 5.2 5.6 4.1 4.6 5.2 4.8 5 4.6 6.7 4 4.5 5.9 5.7 4.8 5.2 5 3.2Trade, Transportation, & Utilities 582.3 577.4 579.1 578 584.4 589.9 577.7 583 591.6 591.6 603.7 613.8 594.9 584.5 591.8 595.9 587.7 591.8 (year dif) 16.3 15.4 16.4 11 14.4 14 9.8 14.8 13.5 10.7 9.2 10.1 12.6 7.1 12.7 17.9 13 4.1Retail Trade 322.9 317.7 318.3 318.9 321.9 324.7 324.4 324.8 328.2 328.8 339.1 345.7 331.5 327.2 327.5 330.2 326.3 329.1 (year dif) 15.2 13.3 13.9 11.8 13 12.1 13.2 12.6 12.5 9.3 7.8 7.8 8.6 9.5 9.2 11.3 11.9 2.8Wholesale Trade 138.9 139.7 140.1 139.3 139.9 141.5 141.1 141 140.9 140.2 140.1 141.9 140.3 140.8 141.7 142.9 140.4 141.4 (year dif) 1.4 1.7 1.6 0.4 0.5 1.2 1.1 0.7 0.7 -0.1 -0.1 0.7 1.4 1.1 1.6 3.6 0.8 1Transportation & Warehousing 105 104.6 105.3 104.3 107.2 108.2 103 101.8 107.3 107.5 109.3 111.3 108.1 101.7 107.6 107.7 106.2 106.3 (year dif) -0.1 0.7 1.2 -1 1.1 0.9 1.9 1.6 0.6 1.6 1.6 1.9 3.1 -2.9 2.3 3.4 1 0Utilities 15.5 15.4 15.4 15.5 15.4 15.5 9.2 15.4 15.2 15.1 15.2 14.9 15 14.8 15 15.1 14.8 15 (year dif) -0.2 -0.3 -0.3 -0.2 -0.2 -0.2 -6.4 -0.1 -0.3 -0.1 -0.1 -0.3 -0.5 -0.6 -0.4 -0.4 -0.7 0.2Construction 109.6 109.1 111.2 114.1 115 116.2 118 118.8 118.4 118.9 116.5 113.9 110 110.6 114.4 117.3 115 113.1 (year dif) 4.9 4.2 3.6 4.4 2.8 3 1.9 1.5 2 3.1 1.1 -0.3 0.4 1.5 3.2 3.2 2.7 -1.9Manufacturing 75 75.7 75.9 75.7 76.5 77.2 76.6 76.6 77.6 78.3 76.6 75.6 73.3 74.2 74.5 74.3 76.4 74.1 (year dif) 0.9 1.2 1.2 0.8 1.3 1.3 1.2 0.6 0.9 1.4 -0.4 -1.1 -1.7 -1.5 -1.4 -1.4 0.8 -2.4Government 534.8 544.2 547.7 548.7 549.9 542.4 555.2 544.7 540.9 546.2 546 545.6 533.4 542 544.1 545.5 545.5 541.3 (year dif) -4.9 -1.6 0.1 -3 -1.1 -3.1 -11.5 -19.3 -2.9 -4.5 -5.5 -3.6 -1.4 -2.2 -3.6 -3.2 -5.1 -4.3
Source: NYS DOLData: Ths.Annual Figures: Average YTD

NY Household EmploymentNew York City Jan 2012 Feb 2012 Mar 2012 Apr 2012 May 2012 Jun 2012 Jul 2012 Aug 2012 Sep 2012 Oct 2012 Nov 2012 Dec 2012 Jan 2013 Feb 2013 Mar 2013 Apr 2013 2012 2013Labor Force SA 3,995 3,999 4,002 4,004 4,003 4,002 4,000 4,000 4,002 4,004 4,007 4,010 4,023 4,016 3,992 3,982 4,002 4,003 (dif) 4.2 3.9 3.5 1.5 -0.6 -1.7 -1.5 0.1 1.4 2.5 2.6 3.3 12.7 -6.6 -24.5 -9.9 48.6 0.7Labor Force NSA 3,986 4,011 4,005 3,976 3,994 4,005 4,040 4,003 3,990 4,022 3,993 4,006 4,028 4,001 3,967 3,966 4,003 3,990 (year dif) 51.8 66.5 60.8 48.7 65 77.5 70 33.8 30.2 37.5 14.9 28.5 41.7 -9.3 -38.2 -9.8 48.8 -12.1(year % ch.) 1.3 1.7 1.5 1.2 1.7 2 1.8 0.9 0.8 0.9 0.4 0.7 1 -0.2 -1 -0.2 1.2 -0.1
Employed Residents SA 3,621 3,625 3,627 3,627 3,625 3,624 3,625 3,629 3,637 3,645 3,652 3,658 3,659 3,651 3,637 3,645 3,633 3,648 (dif) 3.9 3.7 2.3 -0.2 -2 -1.4 1.1 4.7 7.4 8.1 7.1 6.4 0.2 -7.8 -13.6 8.1 37.1 15Employed Residents NSA 3,595 3,618 3,628 3,628 3,627 3,623 3,640 3,628 3,640 3,659 3,652 3,653 3,629 3,634 3,630 3,660 3,633 3,638 (year dif) 30.3 31.9 24.7 31.1 35.6 47.3 41.1 25.2 45.7 49.1 37.3 36.6 33.7 15.7 2.6 32 36.3 5.6(year % ch.) 0.8 0.9 0.7 0.9 1 1.3 1.1 0.7 1.3 1.4 1 1 0.9 0.4 0.1 0.9 1 0.6
Unemployed Residents SA 374 374 375 377 378 378 375 371 365 359 355 352 364 365 354 336 369 355 (dif) 0.3 0.2 1.2 1.7 1.4 -0.3 -2.6 -4.6 -6 -5.6 -4.5 -3.1 12.5 1.2 -10.9 -18 11.5 -14.3Unemployed Residents NSA 391 393 377 348 367 383 399 375 349 363 342 353 399 368 336 306 370 352 (year dif) 21.5 34.7 36 17.6 29.4 30.3 29 8.6 -15.5 -11.6 -22.5 -8.2 8 -25 -40.8 -41.8 12.4 -17.7(year % ch.) 5.8 9.7 10.6 5.3 8.7 8.6 7.8 2.3 -4.2 -3.1 -6.2 -2.3 2 -6.4 -10.8 -12 3.6 -6.8
LF Participation Rate SA 60 60.1 60.1 60.1 60 59.9 59.9 59.8 59.8 59.8 59.8 59.8 59.9 59.8 59.4 59.2 59.9 59.6LF Participation Rate NSA 59.9 60.2 60.1 59.6 59.9 60 60.5 59.9 59.6 60.1 59.6 59.7 60 59.6 59 59 59.9 59.4Emp Pop Ratio SA 54.4 54.4 54.4 54.4 54.3 54.3 54.3 54.3 54.3 54.4 54.5 54.5 54.5 54.3 54.1 54.2 54.4 54.3Emp Pop Ratio NSA 54 54.3 54.5 54.4 54.4 54.3 54.5 54.3 54.4 54.6 54.5 54.5 54.1 54.1 54 54.4 54.4 54.2
Unemployment Rate SA 9.4 9.4 9.4 9.4 9.5 9.4 9.4 9.3 9.1 9.0 8.9 8.8 9.1 9.1 8.9 8.4 9.3 8.9Unemployment Rate NSA 9.8 9.8 9.4 8.8 9.2 9.6 9.9 9.4 8.8 9.0 8.6 8.8 9.9 9.2 8.5 7.7 9.3 8.8
New York StateLabor Force SA 9,580 9,588 9,593 9,592 9,590 9,585 9,582 9,581 9,582 9,587 9,589 9,597 9,623 9,616 9,579 9,563 9,587 9,595 (dif) 7.5 8.1 5.2 -0.7 -2.4 -4.5 -3.1 -1.3 1.2 5.2 1.6 7.8 25.9 -6.4 -37.6 -15.7 59.1 7.9Labor Force NSA 9,522 9,561 9,546 9,502 9,573 9,685 9,737 9,646 9,556 9,616 9,543 9,560 9,607 9,549 9,489 9,487 9,587 9,533 (year dif) 32.3 73 63.6 40.7 85.2 115.6 104.6 40.5 37.4 68.6 16.3 29.6 84.8 -12.1 -56.2 -15.2 59 -54.2(year % ch.) 0.3 0.8 0.7 0.4 0.9 1.2 1.1 0.4 0.4 0.7 0.2 0.3 0.9 -0.1 -0.6 -0.2 0.6 0
Employed Residents SA 8,771 8,777 8,778 8,772 8,761 8,752 8,750 8,757 8,771 8,786 8,798 8,810 8,817 8,809 8,795 8,815 8,773 8,809 (dif) 6.6 5.5 1.2 -5.9 -10.8 -9 -2.3 7.2 13.6 15 12.5 11.6 7.7 -8 -14.9 20 33.5 35.5Employed Residents NSA 8,654 8,688 8,714 8,731 8,769 8,844 8,866 8,827 8,782 8,835 8,791 8,772 8,710 8,706 8,726 8,796 8,773 8,735 (year dif) 11.8 24.7 10.6 4.3 27.5 59.3 41.6 8.9 53.1 70.9 39.9 30.1 56.8 18.2 12 65.6 31.9 -38(year % ch.) 0.1 0.3 0.1 0 0.3 0.7 0.5 0.1 0.6 0.8 0.5 0.3 0.7 0.2 0.1 0.8 0.4 0.4
Unemployed Residents SA 809 811 815 820 829 833 833 824 812 802 791 787 805 807 784 749 814 786 (dif) 0.8 2.6 4 5.2 8.4 4.5 -0.8 -8.5 -12.4 -9.8 -10.9 -3.8 18.2 1.6 -22.7 -35.7 25.6 -27.6Unemployed Residents NSA 868 873 832 772 804 841 871 820 773 781 753 788 896 843 764 691 815 798 (year dif) 20.5 48.4 53 36.2 57.7 56.2 63 31.6 -15.7 -2.2 -23.7 -0.5 28 -30.4 -68.3 -80.7 27 -16.3(year % ch.) 2.4 5.9 6.8 4.9 7.7 7.2 7.8 4 -2 -0.3 -3.1 -0.1 3.2 -3.5 -8.2 -10.5 3.4 -4.7
LF Participation Rate SA 61.7 61.7 61.7 61.7 61.7 61.6 61.6 61.5 61.5 61.5 61.4 61.5 61.6 61.5 61.3 61.1 61.6 61.4LF Participation Rate NSA 61.3 61.6 61.4 61.1 61.6 62.3 62.6 61.9 61.3 61.7 61.2 61.2 61.5 61.1 60.7 60.6 61.6 61Emp Pop Ratio SA 56.5 56.5 56.5 56.4 56.3 56.3 56.2 56.2 56.3 56.3 56.4 56.4 56.4 56.4 56.2 56.3 56.4 56.3Emp Pop Ratio NSA 55.7 55.9 56.1 56.2 56.4 56.8 57 56.7 56.3 56.6 56.3 56.2 55.8 55.7 55.8 56.2 56.4 55.9
Unemployment Rate SA 8.4 8.5 8.5 8.6 8.6 8.7 8.7 8.6 8.5 8.4 8.2 8.2 8.4 8.4 8.2 7.8 8.5 8.2Unemployment Rate NSA 9.1 9.1 8.7 8.1 8.4 8.7 8.9 8.5 8.1 8.1 7.9 8.2 9.3 8.8 8 7.3 8.5 8.4
Source: NYS DOLLabor Force Data in Ths., Rates & Ratios in %Annual Figures: Average YTD
U.S. General Economic Indicators
GDP 1996 1997 1998 1999 2000 2001 2002 2003 2004 2005 2006 2007 2008 2009 2010 2011 2012
Nominal GDP 7838.5 8332.4 8793.5 9353.5 9951.5 10286.2 10642.3 11142.2 11853.3 12623 13377.2 14028.7 14291.6 13973.7 14498.9 15075.7 15684.8
Real GDP 9425.8 9845.9 10274.8 10770.6 11216.4 11337.5 11543.1 11836.4 12246.9 12623 12958.5 13206.4 13161.9 12758 13063 13299.1 13593.2
(% ch.) 3.7 4.5 4.4 4.8 4.1 1.1 1.8 2.5 3.5 3.1 2.7 1.9 -0.3 -3.1 2.4 1.8 2.2
Final Sales of Domestic Product 9404.4 9774.3 10208.3 10706.5 11158 11382 11533.7 11820.5 12181.3 12573 12899.3 13177.6 13200.6 12899.7 13010.3 13265.3 13539.4
(% ch.) 3.7 3.9 4.4 4.9 4.2 2 1.3 2.5 3.1 3.2 2.6 2.2 0.2 -2.3 0.9 2 2.1
Final Sales to Domestic Producers 9512.5 9912.5 10464.7 11067.7 11613.3 11860.9 12088.3 12429 12869.8 13295.8 13629 13826.5 13691.2 13243 13419.7 13664.2 13931.2
(% ch.) 3.8 4.2 5.6 5.8 4.9 2.1 1.9 2.8 3.5 3.3 2.5 1.4 -1 -3.3 1.3 1.8 2
Personal Consumption Expenditures 6288.3 6520.4 6862.4 7237.7 7604.6 7810.4 8018.3 8244.5 8515.8 8803.5 9054.4 9262.9 9211.7 9032.6 9196.2 9428.8 9603.3
(% ch.) 3.5 3.7 5.2 5.5 5.1 2.7 2.7 2.8 3.3 3.4 2.9 2.3 -0.6 -1.9 1.8 2.5 1.9
Durable Goods 548.5 593.4 665.6 752 818 862.4 927.9 989.1 1061 1123.3 1174.2 1232.4 1171.8 1109.1 1178.3 1262.6 1360.9
(% ch.) 7.5 8.2 12.2 13 8.8 5.4 7.6 6.6 7.3 5.9 4.5 5 -4.9 -5.4 6.2 7.2 7.8
Nondurable Goods 1479.2 1522.7 1580.2 1660.7 1714.5 1745.4 1780.1 1840.7 1892.8 1953.4 2005 2042.9 2019.1 1982.8 2029.4 2075.2 2094.5
(% ch.) 2.9 2.9 3.8 5.1 3.2 1.8 2 3.4 2.8 3.2 2.6 1.9 -1.2 -1.8 2.3 2.3 0.9
Gross Private Domestic Investment 1365.3 1535.2 1688.9 1837.6 1963.1 1825.2 1800.4 1870.1 2058.2 2172.3 2231.8 2159.5 1939.8 1458.2 1658.1 1744 1914.4
(% ch.) 8.8 12.4 10 8.8 6.8 -7 -1.4 3.9 10.1 5.5 2.7 -3.2 -10.2 -24.8 13.7 5.2 9.8
Nonresidential 861.5 965.5 1081.4 1194.3 1311.3 1274.8 1173.7 1189.6 1263 1347.3 1455.5 1549.9 1537.7 1259.8 1268.5 1378.2 1487.9
(% ch.) 9.3 12.1 12 10.4 9.8 -2.8 -7.9 1.4 6.2 6.7 8 6.5 -0.8 -18.1 0.7 8.6 8
Residential 492.5 501.8 540.4 574.2 580 583.2 613.9 664.3 729.5 775 718.2 584.2 444.4 344.8 332.2 327.6 367.1
(% ch.) 8 1.9 7.7 6.3 1 0.6 5.3 8.2 9.8 6.2 -7.3 -18.7 -23.9 -22.4 -3.7 -1.4 12.1
Net Exports of Goods & Services -110.7 -139.8 -252.5 -356.4 -451.3 -471.9 -548.5 -603.7 -687.9 -722.7 -729.4 -648.8 -494.8 -355.2 -419.7 -408 -400.7
(% ch.) 12.1 26.3 80.6 41.2 26.6 4.5 16.2 10.1 13.9 5.1 0.9 -11 -23.7 -28.2 18.2 -2.8 -1.8
Government Consumption & Investment 1907.9 1943.8 1985 2056.1 2097.8 2178.3 2279.6 2330.4 2362 2369.9 2402.1 2434.2 2497.4 2589.4 2605.8 2523.9 2481.1
(% ch.) 1 1.9 2.1 3.6 2 3.8 4.7 2.2 1.4 0.3 1.4 1.3 2.6 3.7 0.6 -3.1 -1.7
Change in Private Inventories 31.2 77.4 71.6 68.6 60.2 -41.8 12.8 17.3 66.4 49.9 59.4 27.7 -36.3 -139 50.9 31 43
(dif) -0.9 46.2 -5.8 -3.1 -8.3 -102 54.5 4.6 49 -16.4 9.5 -31.7 -64 -102.7 189.9 -19.9 12
Additional U.S. Indicators
GDP Implicit Price Deflator (% ch.) 1.9 1.8 1.1 1.5 2.2 2.3 1.6 2.1 2.8 3.3 3.2 2.9 2.2 0.9 1.3 2.1 1.8
Corporate Profits 801.5 884.9 812.4 856.3 819.2 784.2 872.2 977.8 1246.9 1456.1 1608.3 1510.7 1248.4 1342.3 1702.4 1827 1950.7
(% ch.) 11.9 10.4 -8.2 5.4 -4.3 -4.3 11.2 12.1 27.5 16.8 10.5 -6.1 -17.4 7.5 26.8 7.3 6.8
ECI Private: Total Compensation 72 74.2 76.8 79.3 82.9 86.3 89.3 92.7 96.2 99.2 102.1 105.2 108.2 109.8 111.9 114.3 116.5
(% ch.) 2.8 3.1 3.5 3.2 4.5 4.1 3.5 3.8 3.8 3.1 2.9 3.1 2.9 1.5 1.9 2.2 1.9
NonFarm Business Productivity 76.9 78.1 80.4 83 85.8 88.4 92.4 95.8 98.3 100 100.9 102.4 103.1 106.1 109.4 110.1 111
(% ch.) 2.6 1.5 2.9 3.3 3.3 3.1 4.5 3.7 2.7 1.7 0.9 1.5 0.6 2.9 3.1 0.6 0.9
Unit Labor Costs 87.5 88.9 91.5 92.4 96 97.4 96.2 97.1 97.8 100 102.8 105.3 108.3 106.7 105.5 107.5 108.2
(% ch.) 0.7 1.6 3 0.9 3.9 1.5 -1.3 1 0.7 2.3 2.9 2.4 2.8 -1.4 -1.1 1.9 0.7
Data: Real GDP & Components in Bil. 2000 $, SA
Data: Profits with IDA & CCAdj in Bil $, SA
Data: ECI All Workers, Index Dec 2005=100, SA
Data: Prod & Unit Labor All Persons, Index 1992=100, SA
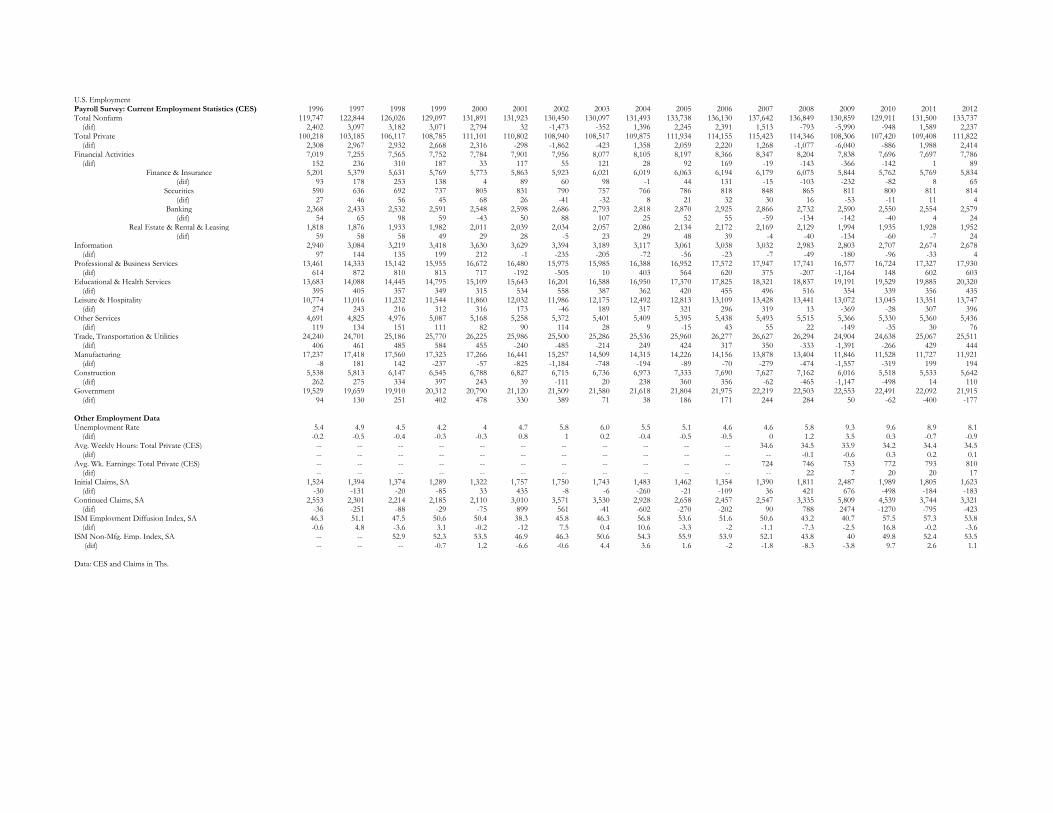
U.S. EmploymentPayroll Survey: Current Employment Statistics (CES) 1996 1997 1998 1999 2000 2001 2002 2003 2004 2005 2006 2007 2008 2009 2010 2011 2012Total Nonfarm 119,747 122,844 126,026 129,097 131,891 131,923 130,450 130,097 131,493 133,738 136,130 137,642 136,849 130,859 129,911 131,500 133,737 (dif) 2,402 3,097 3,182 3,071 2,794 32 -1,473 -352 1,396 2,245 2,391 1,513 -793 -5,990 -948 1,589 2,237Total Private 100,218 103,185 106,117 108,785 111,101 110,802 108,940 108,517 109,875 111,934 114,155 115,423 114,346 108,306 107,420 109,408 111,822 (dif) 2,308 2,967 2,932 2,668 2,316 -298 -1,862 -423 1,358 2,059 2,220 1,268 -1,077 -6,040 -886 1,988 2,414Financial Activities 7,019 7,255 7,565 7,752 7,784 7,901 7,956 8,077 8,105 8,197 8,366 8,347 8,204 7,838 7,696 7,697 7,786 (dif) 152 236 310 187 33 117 55 121 28 92 169 -19 -143 -366 -142 1 89
Finance & Insurance 5,201 5,379 5,631 5,769 5,773 5,863 5,923 6,021 6,019 6,063 6,194 6,179 6,075 5,844 5,762 5,769 5,834 (dif) 93 178 253 138 4 89 60 98 -1 44 131 -15 -103 -232 -82 8 65
Securities 590 636 692 737 805 831 790 757 766 786 818 848 865 811 800 811 814 (dif) 27 46 56 45 68 26 -41 -32 8 21 32 30 16 -53 -11 11 4
Banking 2,368 2,433 2,532 2,591 2,548 2,598 2,686 2,793 2,818 2,870 2,925 2,866 2,732 2,590 2,550 2,554 2,579 (dif) 54 65 98 59 -43 50 88 107 25 52 55 -59 -134 -142 -40 4 24
Real Estate & Rental & Leasing 1,818 1,876 1,933 1,982 2,011 2,039 2,034 2,057 2,086 2,134 2,172 2,169 2,129 1,994 1,935 1,928 1,952 (dif) 59 58 58 49 29 28 -5 23 29 48 39 -4 -40 -134 -60 -7 24
Information 2,940 3,084 3,219 3,418 3,630 3,629 3,394 3,189 3,117 3,061 3,038 3,032 2,983 2,803 2,707 2,674 2,678 (dif) 97 144 135 199 212 -1 -235 -205 -72 -56 -23 -7 -49 -180 -96 -33 4Professional & Business Services 13,461 14,333 15,142 15,955 16,672 16,480 15,975 15,985 16,388 16,952 17,572 17,947 17,741 16,577 16,724 17,327 17,930 (dif) 614 872 810 813 717 -192 -505 10 403 564 620 375 -207 -1,164 148 602 603Educational & Health Services 13,683 14,088 14,445 14,795 15,109 15,643 16,201 16,588 16,950 17,370 17,825 18,321 18,837 19,191 19,529 19,885 20,320 (dif) 395 405 357 349 315 534 558 387 362 420 455 496 516 354 339 356 435Leisure & Hospitality 10,774 11,016 11,232 11,544 11,860 12,032 11,986 12,175 12,492 12,813 13,109 13,428 13,441 13,072 13,045 13,351 13,747 (dif) 274 243 216 312 316 173 -46 189 317 321 296 319 13 -369 -28 307 396Other Services 4,691 4,825 4,976 5,087 5,168 5,258 5,372 5,401 5,409 5,395 5,438 5,493 5,515 5,366 5,330 5,360 5,436 (dif) 119 134 151 111 82 90 114 28 9 -15 43 55 22 -149 -35 30 76Trade, Transportation & Utilities 24,240 24,701 25,186 25,770 26,225 25,986 25,500 25,286 25,536 25,960 26,277 26,627 26,294 24,904 24,638 25,067 25,511 (dif) 406 461 485 584 455 -240 -485 -214 249 424 317 350 -333 -1,391 -266 429 444Manufacturing 17,237 17,418 17,560 17,323 17,266 16,441 15,257 14,509 14,315 14,226 14,156 13,878 13,404 11,846 11,528 11,727 11,921 (dif) -8 181 142 -237 -57 -825 -1,184 -748 -194 -89 -70 -279 -474 -1,557 -319 199 194Construction 5,538 5,813 6,147 6,545 6,788 6,827 6,715 6,736 6,973 7,333 7,690 7,627 7,162 6,016 5,518 5,533 5,642 (dif) 262 275 334 397 243 39 -111 20 238 360 356 -62 -465 -1,147 -498 14 110Government 19,529 19,659 19,910 20,312 20,790 21,120 21,509 21,580 21,618 21,804 21,975 22,219 22,503 22,553 22,491 22,092 21,915 (dif) 94 130 251 402 478 330 389 71 38 186 171 244 284 50 -62 -400 -177
Other Employment DataUnemployment Rate 5.4 4.9 4.5 4.2 4 4.7 5.8 6.0 5.5 5.1 4.6 4.6 5.8 9.3 9.6 8.9 8.1 (dif) -0.2 -0.5 -0.4 -0.3 -0.3 0.8 1 0.2 -0.4 -0.5 -0.5 0 1.2 3.5 0.3 -0.7 -0.9Avg. Weekly Hours: Total Private (CES) -- -- -- -- -- -- -- -- -- -- -- 34.6 34.5 33.9 34.2 34.4 34.5 (dif) -- -- -- -- -- -- -- -- -- -- -- -- -0.1 -0.6 0.3 0.2 0.1Avg. Wk. Earnings: Total Private (CES) -- -- -- -- -- -- -- -- -- -- -- 724 746 753 772 793 810 (dif) -- -- -- -- -- -- -- -- -- -- -- -- 22 7 20 20 17Initial Claims, SA 1,524 1,394 1,374 1,289 1,322 1,757 1,750 1,743 1,483 1,462 1,354 1,390 1,811 2,487 1,989 1,805 1,623 (dif) -30 -131 -20 -85 33 435 -8 -6 -260 -21 -109 36 421 676 -498 -184 -183Continued Claims, SA 2,553 2,301 2,214 2,185 2,110 3,010 3,571 3,530 2,928 2,658 2,457 2,547 3,335 5,809 4,539 3,744 3,321 (dif) -36 -251 -88 -29 -75 899 561 -41 -602 -270 -202 90 788 2474 -1270 -795 -423ISM Employment Diffusion Index, SA 46.3 51.1 47.5 50.6 50.4 38.3 45.8 46.3 56.8 53.6 51.6 50.6 43.2 40.7 57.5 57.3 53.8 (dif) -0.6 4.8 -3.6 3.1 -0.2 -12 7.5 0.4 10.6 -3.3 -2 -1.1 -7.3 -2.5 16.8 -0.2 -3.6ISM Non-Mfg. Emp. Index, SA -- -- 52.9 52.3 53.5 46.9 46.3 50.6 54.3 55.9 53.9 52.1 43.8 40 49.8 52.4 53.5 (dif) -- -- -- -0.7 1.2 -6.6 -0.6 4.4 3.6 1.6 -2 -1.8 -8.3 -3.8 9.7 2.6 1.1
Data: CES and Claims in Ths.

The U.S. Consumer & Housing MarketPersonal Income, Consumption and Credit 1996 1997 1998 1999 2000 2001 2002 2003 2004 2005 2006 2007 2008 2009 2010 2011 2012Total Personal Income 6591.6 7000.8 7525.4 7910.8 8559.4 8883.3 9060.1 9378.1 9937.3 10485.9 11268.1 11912.3 12460.2 11867 12321.9 12947.3 13407.2 (% ch.) 6.3 6.2 7.5 5.1 8.2 3.8 2 3.5 6 5.5 7.5 5.7 4.6 -4.8 3.8 5.1 3.6Disposable Personal Income 5759.6 6074.6 6499 6803.3 7327.2 7648.5 8009.7 8377.8 8889.4 9277.3 9915.7 10423.6 11024.5 10722.4 11127 11549.3 11931.4 (% ch.) 5.5 5.5 7 4.7 7.7 4.4 4.7 4.6 6.1 4.4 6.9 5.1 5.8 -2.7 3.8 3.8 3.3Wage Rate ($) 30197 31553 33178 34545 36603 37539 38308 39506 41260 42626 44580 46655 47870 47921 49299 50656 51449 (% ch.) 3.7 4.5 5.1 4.1 6 2.6 2.1 3.1 4.4 3.3 4.6 4.7 2.6 0.1 2.9 2.8 1.6Personal Consumption Expenditures (PCE) 5273.6 5570.6 5918.5 6342.8 6830.4 7148.8 7439.2 7804.1 8270.5 8803.5 9301 9772.3 10035.5 9845.9 10215.7 10729 11119.6 (% ch.) 5.7 5.6 6.2 7.2 7.7 4.7 4.1 4.9 6 6.4 5.7 5.1 2.7 -1.9 3.8 5 3.6Consumer Installment Credit: Total Outstanding 1253.4 1324.8 1421 1531.1 1717 1867.9 1972.1 2077.4 2192.2 2290.9 2361.8 2506.3 2525.9 2420.2 2522.2 2615.7 2768.2 (% ch.) 9.9 5.7 7.3 7.7 12.1 8.8 5.6 5.3 5.5 4.5 3.1 6.1 0.8 -4.2 4.2 3.7 5.8Personal Saving as a % of Disposable Personal Income, (%) 4.9 4.6 5.3 3.1 2.9 2.7 3.5 3.5 3.6 1.6 2.6 2.4 5.3 4.7 5.1 4.2 3.9
Retail SalesTotal Retail Sales & Food Services 216.5 227.4 237.8 257.1 273.6 281.6 288.4 301 319.5 340.3 358.6 370.5 366.2 340 358.9 387.6 407 (% ch.) 5.9 5 4.6 8.1 6.4 2.9 2.4 4.4 6.1 6.5 5.4 3.3 -1.2 -7.1 5.5 8 5excl. Food Services & Drinking Places 196.3 205.9 215.2 233.4 248.3 255.2 260.8 271.8 288.5 307.3 323.4 333.4 328.2 302.4 320 346.4 362.9 (% ch.) 6.1 4.9 4.5 8.5 6.4 2.8 2.2 4.2 6.1 6.5 5.2 3.1 -1.6 -7.9 5.8 8.3 4.8excl. Autos & Gasoline Stations 148.1 156.1 164.4 175.7 186.5 192.7 199.3 207.9 220.6 234.8 248.2 257 259.3 251.4 259.4 274.7 287.2 (% ch.) 5.1 5.4 5.3 6.9 6.1 3.3 3.4 4.3 6.1 6.5 5.7 3.5 0.9 -3.1 3.2 5.9 4.6
TCB Consumer Confidence IndexOverall 104.6 125.4 131.7 135.3 139 106.6 96.6 79.8 96.1 100.3 105.9 103.3 57.9 45.2 54.5 58.1 67.1 (dif) 4.5 20.8 6.3 3.6 3.6 -32.4 -9.9 -16.8 16.3 4.2 5.6 -2.5 -45.4 -12.7 9.3 3.6 8.9Present Situation 121 151.4 169.3 176.6 181 141.7 94.6 68 94.9 116.1 130.2 128.8 69.9 24 25.7 36.1 49.8 (dif) 8.1 30.5 17.9 7.3 4.4 -39.4 -47.1 -26.6 26.9 21.2 14.1 -1.4 -58.9 -45.8 1.7 10.5 13.7Expectations 93.7 108 106.6 107.8 110.9 83.2 98 87.7 96.9 89.7 89.7 86.4 50 59.4 73.7 72.8 78.6 (dif) 2.2 14.3 -1.4 1.2 3.1 -27.7 14.8 -10.3 9.1 -7.1 -0.1 -3.3 -36.4 9.4 14.3 -0.9 5.8
The Reuters/UM Index of Consumer SentimentOverall 93.6 103.2 104.6 105.8 107.6 89.2 89.6 87.6 95.2 88.6 87.3 85 63.8 66.3 71.8 67.4 76.5 (dif) 1.4 9.6 1.4 1.2 1.8 -18.3 0.3 -2 7.6 -6.7 -1.2 -2.3 -21.3 2.5 5.6 -4.5 9.2Expectations 85.7 97.7 98.3 99.3 102.7 82.3 84.6 81.4 88.5 77.4 75.9 75.6 57.3 64.1 66 59.8 70.7 (dif) 2.5 12 0.6 1 3.4 -20.4 2.3 -3.1 7.1 -11.1 -1.5 -0.3 -18.3 6.8 1.9 -6.2 10.9
Housing MarketNew Single-Family Homes Sold 756 806 889 879 880 907 976 1091 1201 1279 1049 769 482 374 321 307 367 (% ch.) 12.9 6.7 10.3 -1.2 0.2 3.1 7.6 11.7 10.1 6.5 -18 -26.7 -37.3 -22.4 -14.2 -4.5 19.6Existing Single-Family Homes Sold 3783 3973 4492 4636 4614 4727 4998 5443 5914 6181 5712 4418 3655 3868 3705 3793 4130 (% ch.) 7.6 5 13.1 3.2 -0.5 2.4 5.7 8.9 8.6 4.5 -7.6 -22.6 -17.3 5.8 -4.2 2.4 8.9Housing Starts 1469 1475 1621 1647 1573 1601 1710 1854 1950 2073 1812 1342 900 554 586 612 783 (% ch.) 7.9 0.4 9.9 1.6 -4.5 1.8 6.8 8.4 5.2 6.3 -12.6 -25.9 -32.9 -38.4 5.7 4.5 28Housing Permits 1419 1442 1619 1664 1598 1637 1749 1888 2058 2160 1844 1392 896 582 604 624 829 (% ch.) 6.2 1.6 12.3 2.7 -3.9 2.4 6.8 8 9 5 -14.6 -24.5 -35.6 -35 3.7 3.4 32.8Median New Single-Family Home Price 139.8 145.1 152 159.8 166.5 172.6 185 191.4 217.8 234.2 243.1 243.7 230.4 214.5 221.2 224.3 242.1 (% ch.) 4.7 3.8 4.8 5.2 4.2 3.6 7.2 3.4 13.8 7.5 3.8 0.3 -5.5 -6.9 3.1 1.4 7.9Median Existing Single-Family Home Price 121.9 128 135 140.3 146 154.5 166.2 178.3 192.8 217.5 221.9 215.5 195.8 172.5 172.7 164.9 175.8 (% ch.) 5.2 5.1 5.4 3.9 4.1 5.8 7.6 7.3 8.1 12.8 2 -2.9 -9.2 -11.9 0.1 -4.5 6.6
Data: Income & Consumption in Bil. $, SAData: Credit & Retail Sales in Bil. $, SAData: Home Sales, Starts & Permits in Ths., SAData: Home Prices in Ths. $

U.S. Price and Production
Consumer Price Index, (1982-84=100, SA) 1996 1997 1998 1999 2000 2001 2002 2003 2004 2005 2006 2007 2008 2009 2010 2011 2012
All Items 156.9 160.5 163 166.6 172.2 177 179.9 184 188.9 195.3 201.6 207.3 215.3 214.6 218.1 224.9 229.6
(% ch.) 2.9 2.3 1.5 2.2 3.4 2.8 1.6 2.3 2.7 3.4 3.2 2.9 3.8 -0.3 1.6 3.1 2.1
Core (All Items Less Food & Energy) 165.6 169.5 173.4 177 181.3 186.1 190.4 193.2 196.6 200.9 205.9 210.7 215.6 219.2 221.3 225 229.8
(% ch.) 2.7 2.4 2.3 2.1 2.4 2.7 2.3 1.5 1.8 2.1 2.5 2.3 2.3 1.7 1 1.7 2.1
Commodities 139.9 141.8 141.9 144.4 149.2 150.6 149.7 151.2 154.7 160.2 164 167.5 174.7 169.8 174.6 183.9 187.6
(% ch.) 2.5 1.4 0.1 1.8 3.3 1 -0.6 1 2.3 3.5 2.4 2.2 4.3 -2.8 2.9 5.3 2
Services 174.1 179.4 184.2 188.8 195.3 203.4 209.8 216.5 222.8 230.1 238.9 246.8 255.5 259.2 261.3 265.8 271.4
(% ch.) 3.2 3.1 2.6 2.5 3.4 4.2 3.2 3.2 2.9 3.3 3.8 3.3 3.5 1.4 0.8 1.7 2.1
Personal Consumption Expenditures
PCE C-W Price Index, (2000 = 100, SA) 83.9 85.4 86.2 87.6 89.8 91.5 92.8 94.7 97.1 100 102.7 105.5 108.9 109 111.1 113.8 115.8
(% ch.) 2.2 1.9 1 1.6 2.5 1.9 1.4 2 2.6 3 2.7 2.7 3.3 0.1 1.9 2.4 1.8
PCE C-W Price Index Less Food & Energy, (2000 = 100, SA) 85.4 87 88.3 89.6 91.2 92.8 94.4 95.8 97.8 100 102.3 104.6 107 108.5 110.2 111.8 113.7
(% ch.) 1.9 1.9 1.4 1.5 1.7 1.8 1.7 1.5 2.1 2.2 2.3 2.3 2.3 1.4 1.5 1.4 1.7
Producer Price Index, (1982=100, SA)
Finished Goods 131.3 131.8 130.7 133 138 140.7 138.9 143.3 148.5 155.8 160.4 166.6 177.3 172.8 180 190.8 194.5
(% ch.) 2.6 0.4 -0.9 1.8 3.8 1.9 -1.3 3.2 3.6 4.9 2.9 3.9 6.4 -2.5 4.2 6 1.9
Finished Goods Less Food and Energy 142 142.4 143.7 146.1 148 150 150.1 150.4 152.7 156.3 158.7 161.9 167.4 171.7 173.8 178 182.6
(% ch.) 1.5 0.3 0.9 1.6 1.3 1.4 0.1 0.2 1.5 2.4 1.5 2 3.4 2.5 1.2 2.4 2.6
West Texas Intermediate Oil Price, ($ per Bbl) 22.2 20.6 14.4 19.3 30.3 25.9 26.1 31.1 41.4 56.5 66.1 72.4 99.6 61.7 79.4 95.1 94.2
(% ch.) 20.2 -7 -30.2 33.8 57.4 -14.4 0.7 19.3 33.1 36.3 17.1 9.5 37.6 -38 28.7 19.7 -0.9
Production
Industrial Production, (Index 2002=100, SA) 74.9 80.4 85 88.7 92.2 89.1 89.3 90.3 92.5 95.5 97.6 100 96.6 85.7 90.6 93.6 97
(% ch.) 4.4 7.2 5.8 4.3 4 -3.4 0.2 1.2 2.3 3.2 2.2 2.5 -3.4 -11.3 5.7 3.4 3.6
Purchasing Managers Index 50.1 55 50.2 54.6 51.7 43.4 50.8 51.7 59.1 54.5 53.2 51.2 45.5 46.4 57.3 55.2 51.7
(dif) 0.7 4.9 -4.8 4.4 -3 -8.3 7.4 0.9 7.4 -4.6 -1.4 -1.9 -5.7 0.9 10.9 -2.1 -3.5
Business Activity -- -- 57.3 59.1 59.3 49 55.1 58.3 62.5 60.2 58 56 47.4 48.1 57.6 57.2 57.7
(dif) -- -- -- 1.8 0.1 -10.3 6.2 3.2 4.2 -2.3 -2.2 -2 -8.6 0.7 9.4 -0.3 0.5
Total New Orders 161.9 174.5 178.1 187.8 193.6 172.6 169.5 175.1 186.2 203.9 219.6 230.4 216.1 151.2 192.1 211 218.7
(% ch.) 5 7.8 2.1 5.4 3.1 -10.8 -1.8 3.3 6.3 9.5 7.7 4.9 -6.2 -30 27.1 9.8 3.7
Excluding Defense 153.9 168.5 172 181.3 185.9 164.9 161.8 165.6 177.1 195.7 209.2 219.9 202.8 140.5 177.6 199.4 207.4
(% ch.) 4 9.5 2 5.4 2.5 -11.3 -1.9 2.4 6.9 10.6 6.9 5.1 -7.8 -30.7 26.4 12.3 4
Inventory/Sales Ratios, SA
Total Business 1.46 1.42 1.43 1.4 1.41 1.42 1.36 1.34 1.3 1.27 1.29 1.28 1.32 1.39 1.28 1.26 1.28
Manufacturing 1.44 1.37 1.39 1.35 1.35 1.38 1.29 1.24 1.19 1.17 1.2 1.22 1.27 1.41 1.32 1.29 1.29
Data: Orders in Bil. $, SA
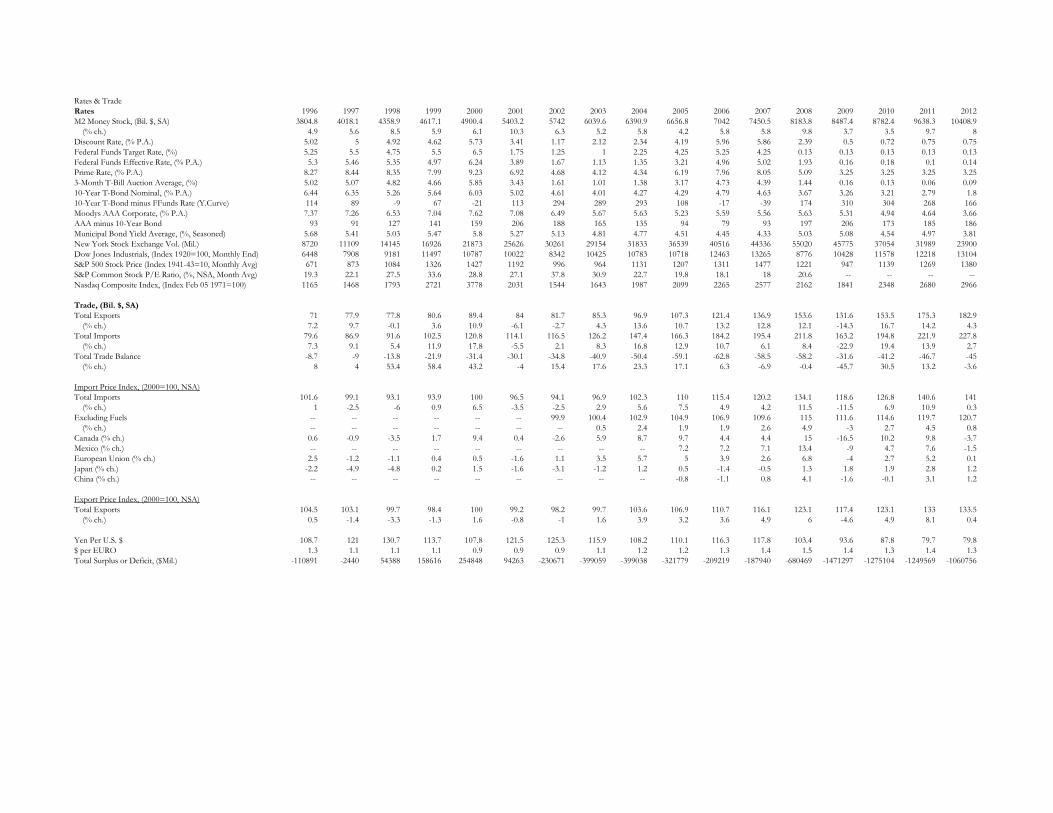
Rates & Trade
Rates 1996 1997 1998 1999 2000 2001 2002 2003 2004 2005 2006 2007 2008 2009 2010 2011 2012
M2 Money Stock, (Bil. $, SA) 3804.8 4018.1 4358.9 4617.1 4900.4 5403.2 5742 6039.6 6390.9 6656.8 7042 7450.5 8183.8 8487.4 8782.4 9638.3 10408.9
(% ch.) 4.9 5.6 8.5 5.9 6.1 10.3 6.3 5.2 5.8 4.2 5.8 5.8 9.8 3.7 3.5 9.7 8
Discount Rate, (% P.A.) 5.02 5 4.92 4.62 5.73 3.41 1.17 2.12 2.34 4.19 5.96 5.86 2.39 0.5 0.72 0.75 0.75
Federal Funds Target Rate, (%) 5.25 5.5 4.75 5.5 6.5 1.75 1.25 1 2.25 4.25 5.25 4.25 0.13 0.13 0.13 0.13 0.13
Federal Funds Effective Rate, (% P.A.) 5.3 5.46 5.35 4.97 6.24 3.89 1.67 1.13 1.35 3.21 4.96 5.02 1.93 0.16 0.18 0.1 0.14
Prime Rate, (% P.A.) 8.27 8.44 8.35 7.99 9.23 6.92 4.68 4.12 4.34 6.19 7.96 8.05 5.09 3.25 3.25 3.25 3.25
3-Month T-Bill Auction Average, (%) 5.02 5.07 4.82 4.66 5.85 3.43 1.61 1.01 1.38 3.17 4.73 4.39 1.44 0.16 0.13 0.06 0.09
10-Year T-Bond Nominal, (% P.A.) 6.44 6.35 5.26 5.64 6.03 5.02 4.61 4.01 4.27 4.29 4.79 4.63 3.67 3.26 3.21 2.79 1.8
10-Year T-Bond minus FFunds Rate (Y.Curve) 114 89 -9 67 -21 113 294 289 293 108 -17 -39 174 310 304 268 166
Moodys AAA Corporate, (% P.A.) 7.37 7.26 6.53 7.04 7.62 7.08 6.49 5.67 5.63 5.23 5.59 5.56 5.63 5.31 4.94 4.64 3.66
AAA minus 10-Year Bond 93 91 127 141 159 206 188 165 135 94 79 93 197 206 173 185 186
Municipal Bond Yield Average, (%, Seasoned) 5.68 5.41 5.03 5.47 5.8 5.27 5.13 4.81 4.77 4.51 4.45 4.33 5.03 5.08 4.54 4.97 3.81
New York Stock Exchange Vol. (Mil.) 8720 11109 14145 16926 21873 25626 30261 29154 31833 36539 40516 44336 55020 45775 37054 31989 23900
Dow Jones Industrials, (Index 1920=100, Monthly End) 6448 7908 9181 11497 10787 10022 8342 10425 10783 10718 12463 13265 8776 10428 11578 12218 13104
S&P 500 Stock Price (Index 1941-43=10, Monthly Avg) 671 873 1084 1326 1427 1192 996 964 1131 1207 1311 1477 1221 947 1139 1269 1380
S&P Common Stock P/E Ratio, (%, NSA, Month Avg) 19.3 22.1 27.5 33.6 28.8 27.1 37.8 30.9 22.7 19.8 18.1 18 20.6 -- -- -- --
Nasdaq Composite Index, (Index Feb 05 1971=100) 1165 1468 1793 2721 3778 2031 1544 1643 1987 2099 2265 2577 2162 1841 2348 2680 2966
Trade, (Bil. $, SA)
Total Exports 71 77.9 77.8 80.6 89.4 84 81.7 85.3 96.9 107.3 121.4 136.9 153.6 131.6 153.5 175.3 182.9
(% ch.) 7.2 9.7 -0.1 3.6 10.9 -6.1 -2.7 4.3 13.6 10.7 13.2 12.8 12.1 -14.3 16.7 14.2 4.3
Total Imports 79.6 86.9 91.6 102.5 120.8 114.1 116.5 126.2 147.4 166.3 184.2 195.4 211.8 163.2 194.8 221.9 227.8
(% ch.) 7.3 9.1 5.4 11.9 17.8 -5.5 2.1 8.3 16.8 12.9 10.7 6.1 8.4 -22.9 19.4 13.9 2.7
Total Trade Balance -8.7 -9 -13.8 -21.9 -31.4 -30.1 -34.8 -40.9 -50.4 -59.1 -62.8 -58.5 -58.2 -31.6 -41.2 -46.7 -45
(% ch.) 8 4 53.4 58.4 43.2 -4 15.4 17.6 23.3 17.1 6.3 -6.9 -0.4 -45.7 30.5 13.2 -3.6
Import Price Index, (2000=100, NSA)
Total Imports 101.6 99.1 93.1 93.9 100 96.5 94.1 96.9 102.3 110 115.4 120.2 134.1 118.6 126.8 140.6 141
(% ch.) 1 -2.5 -6 0.9 6.5 -3.5 -2.5 2.9 5.6 7.5 4.9 4.2 11.5 -11.5 6.9 10.9 0.3
Excluding Fuels -- -- -- -- -- -- 99.9 100.4 102.9 104.9 106.9 109.6 115 111.6 114.6 119.7 120.7
(% ch.) -- -- -- -- -- -- -- 0.5 2.4 1.9 1.9 2.6 4.9 -3 2.7 4.5 0.8
Canada (% ch.) 0.6 -0.9 -3.5 1.7 9.4 0.4 -2.6 5.9 8.7 9.7 4.4 4.4 15 -16.5 10.2 9.8 -3.7
Mexico (% ch.) -- -- -- -- -- -- -- -- -- 7.2 7.2 7.1 13.4 -9 4.7 7.6 -1.5
European Union (% ch.) 2.5 -1.2 -1.1 0.4 0.5 -1.6 1.1 3.5 5.7 5 3.9 2.6 6.8 -4 2.7 5.2 0.1
Japan (% ch.) -2.2 -4.9 -4.8 0.2 1.5 -1.6 -3.1 -1.2 1.2 0.5 -1.4 -0.5 1.3 1.8 1.9 2.8 1.2
China (% ch.) -- -- -- -- -- -- -- -- -- -0.8 -1.1 0.8 4.1 -1.6 -0.1 3.1 1.2
Export Price Index, (2000=100, NSA)
Total Exports 104.5 103.1 99.7 98.4 100 99.2 98.2 99.7 103.6 106.9 110.7 116.1 123.1 117.4 123.1 133 133.5
(% ch.) 0.5 -1.4 -3.3 -1.3 1.6 -0.8 -1 1.6 3.9 3.2 3.6 4.9 6 -4.6 4.9 8.1 0.4
Yen Per U.S. $ 108.7 121 130.7 113.7 107.8 121.5 125.3 115.9 108.2 110.1 116.3 117.8 103.4 93.6 87.8 79.7 79.8
$ per EURO 1.3 1.1 1.1 1.1 0.9 0.9 0.9 1.1 1.2 1.2 1.3 1.4 1.5 1.4 1.3 1.4 1.3
Total Surplus or Deficit, ($Mil.) -110891 -2440 54388 158616 254848 94263 -230671 -399059 -399038 -321779 -209219 -187940 -680469 -1471297 -1275104 -1249569 -1060756

NYC Economic Data
1996 1997 1998 1999 2000 2001 2002 2003 2004 2005 2006 2007 2008 2009 2010 2011 2012
Nominal GCP 332.9 357.3 368.3 405.8 451.8 438.3 433.4 458.4 492.8 542.1 594.9 633.7 608.4 595.8 642.4 651.4 --
(% ch.) 8.2 7.3 3.1 10.2 11.3 -3 -1.1 5.8 7.5 10 9.7 6.5 -4 -2.1 7.8 1.4 --
Real GCP 409.7 432.1 440.1 479 523.5 497.8 479.9 493.4 511.7 542 573.3 594 557 536.8 570.9 568.7 --
(year % ch.) 6.2 5.5 1.9 8.8 9.3 -4.9 -3.6 2.8 3.7 5.9 5.8 3.6 -6.2 -3.6 6.4 -0.4 --
Wage Rate 45,980 48,884 51,336 54,000 59,139 61,014 59,477 60,355 64,861 67,912 73,508 80,070 80,325 73,864 78,045 80,156 --
(% ch.) 5.96 6.32 5.02 5.19 9.52 3.17 -2.52 1.48 7.47 4.7 8.24 8.93 0.32 -8.04 5.66 2.7 --
Finance Wage Rate 107,861 124,363 129,215 144,072 174,561 181,137 165,568 167,061 196,190 209,405 245,253 286,001 280,353 230,018 262,116 269,659 --
(% ch.) 14.8 15.3 3.9 11.5 21.2 3.8 -8.6 0.9 17.4 6.7 17.1 16.6 -2 -18 14 2.9 --
Securities Wage Rate 160,102 176,802 195,568 196,054 242,211 247,252 225,750 226,519 270,589 291,244 343,123 403,358 391,158 309,319 363,312 364,892 --
(% ch.) 20.9 10.4 10.6 0.2 23.5 2.1 -8.7 0.3 19.5 7.6 17.8 17.6 -3 -20.9 17.5 0.4 --
Private Non-Finance Wage Rate 38,134 39,627 42,177 43,730 46,449 47,852 48,615 49,757 51,768 53,923 56,429 59,799 61,063 59,498 61,723 62,985 --
(% ch.) 3.88 3.92 6.44 3.68 6.22 3.02 1.59 2.35 4.04 4.16 4.65 5.97 2.11 -2.56 3.74 2.04 --
Total Wage Earnings 150.9 163.2 175.9 189.5 213.1 217.4 205.9 206.7 223 236.8 260.8 291 295.2 263.4 280.1 293.2 --
(% ch.) 7.3 8.2 7.8 7.7 12.5 2 -5.3 0.4 7.9 6.2 10.1 11.6 1.4 -10.8 6.3 4.7 --
Finance Wage Earnings 37.4 43.4 45.9 51.2 62.9 64.8 53.9 52.1 61.3 67.1 80.9 97.2 94.8 71.7 79.8 84.8 --
(% ch.) 13.1 15.8 5.8 11.6 22.8 3.1 -16.8 -3.4 17.6 9.5 20.5 20.1 -2.4 -24.4 11.3 6.2 --
Securities Wage Earnings 23.2 27.3 32 33.1 46 47.4 37.7 35.8 43.6 48.8 59.8 73.5 71.9 51.4 58.4 60.8 --
(% ch.) 21.3 17.5 17.1 3.4 38.9 3.1 -20.5 -5.1 21.9 11.8 22.7 22.8 -2.2 -28.6 13.7 4.1 --
Private Non-Finance Wage Earnings 92.4 98.2 107.2 114.2 125.3 127.2 125.6 127.7 133.8 141.5 151.1 164.6 170.4 161 169 177.2 --
(% ch.) 6.17 6.33 9.15 6.55 9.72 1.52 -1.31 1.73 4.74 5.76 6.78 8.93 3.53 -5.48 4.96 4.83 --
Personal Income, (Bil. $) 234 246.5 260.5 273.6 293.2 299 299.5 305.7 327.6 351.6 386.7 416.5 427.9 403.2 433.3 455.5 --
(% ch.) 6.09 5.33 5.67 5.03 7.16 1.98 0.19 2.07 7.16 7.32 9.98 7.72 2.73 -5.78 7.47 5.12 --
NYSE Member-Firm Profits, (Bil. $) 11.3 12.2 9.8 16.3 21 10.4 6.9 16.7 13.7 9.4 20.9 -11.3 -42.6 61.4 27.6 7.7 23.9
(% ch.) 52.2 8.3 -19.8 66.2 28.9 -50.4 -33.5 142.1 -18.3 -30.9 121.2 -154.1 276.8 -244.3 -55 -72.3 212
Total Employment, SA 3367.1 3439.7 3526.8 3618.4 3717.1 3689.4 3581.2 3531.3 3549.4 3602.5 3667.3 3744.6 3794.6 3693.7 3711.3 3797.9 3877.4
(% ch.) 0.89 2.16 2.53 2.6 2.73 -0.75 -2.93 -1.39 0.51 1.5 1.8 2.11 1.34 -2.66 0.48 2.34 2.09
Private Employment, SA 2822 2889.4 2966.4 3051.5 3148.3 3127.1 3015 2974.6 2995 3046.8 3112 3185.5 3230.5 3126.9 3153.4 3247.4 3331.9
(% ch.) 1.58 2.39 2.67 2.87 3.17 -0.67 -3.59 -1.34 0.68 1.73 2.14 2.36 1.41 -3.21 0.85 2.98 2.6
Unemployment Rate 8.82 9.43 7.92 6.86 5.78 6.03 8.05 8.29 7.04 5.77 5 4.91 5.48 9.23 9.54 9.06 9.25
(dif) 0.64 0.6 -1.51 -1.06 -1.08 0.26 2.02 0.24 -1.25 -1.28 -0.77 -0.09 0.58 3.75 0.31 -0.48 0.19
Consumer Price Index, (1982-84=100, SA)
All Items 166.9 170.8 173.6 177 182.5 187.1 191.9 197.8 204.8 212.7 220.7 226.9 235.8 236.8 240.9 247.7 252.6
(% ch.) 2.94 2.33 1.63 1.94 3.11 2.55 2.55 3.07 3.53 3.88 3.78 2.81 3.9 0.44 1.71 2.85 1.97
Core (All Items Less Food & Energy) 176.9 181.4 185.4 188.8 193.5 198.7 205.8 210.9 217 223.5 231 236.4 242.2 247 250.1 254.8 260
(% ch.) 2.91 2.55 2.23 1.83 2.5 2.69 3.56 2.46 2.92 2.96 3.38 2.33 2.46 1.97 1.27 1.85 2.05
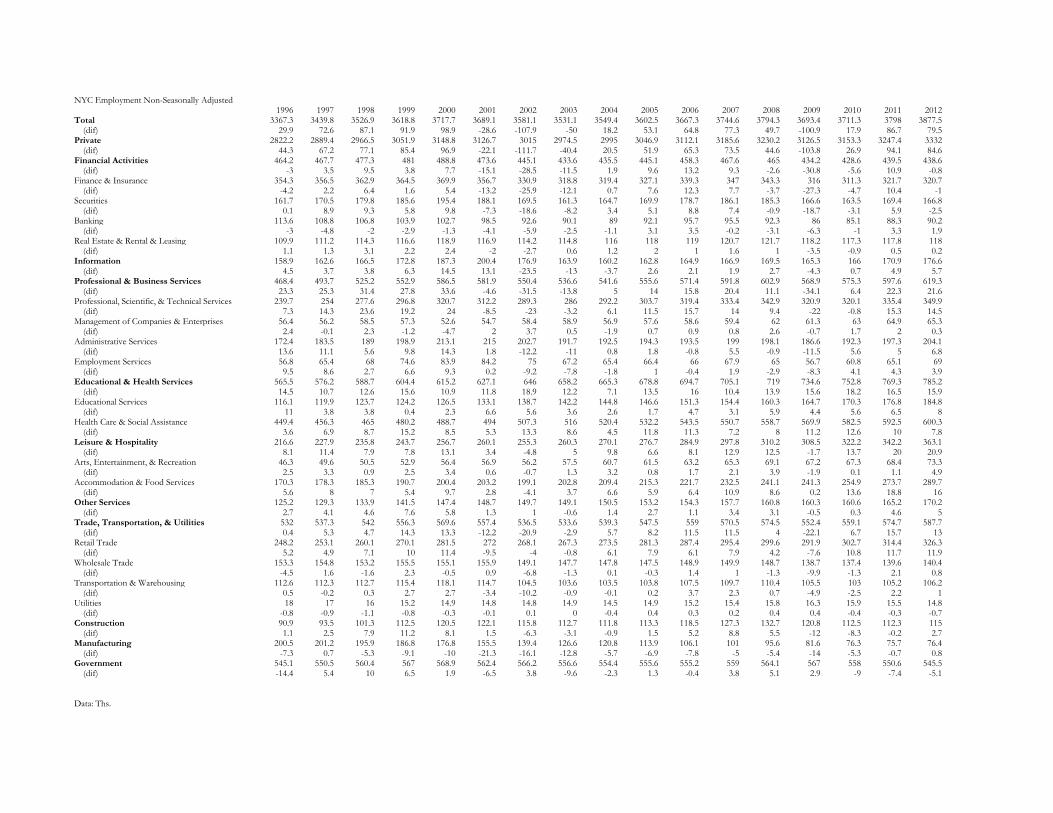
NYC Employment Non-Seasonally Adjusted1996 1997 1998 1999 2000 2001 2002 2003 2004 2005 2006 2007 2008 2009 2010 2011 2012
Total 3367.3 3439.8 3526.9 3618.8 3717.7 3689.1 3581.1 3531.1 3549.4 3602.5 3667.3 3744.6 3794.3 3693.4 3711.3 3798 3877.5 (dif) 29.9 72.6 87.1 91.9 98.9 -28.6 -107.9 -50 18.2 53.1 64.8 77.3 49.7 -100.9 17.9 86.7 79.5Private 2822.2 2889.4 2966.5 3051.9 3148.8 3126.7 3015 2974.5 2995 3046.9 3112.1 3185.6 3230.2 3126.5 3153.3 3247.4 3332 (dif) 44.3 67.2 77.1 85.4 96.9 -22.1 -111.7 -40.4 20.5 51.9 65.3 73.5 44.6 -103.8 26.9 94.1 84.6Financial Activities 464.2 467.7 477.3 481 488.8 473.6 445.1 433.6 435.5 445.1 458.3 467.6 465 434.2 428.6 439.5 438.6 (dif) -3 3.5 9.5 3.8 7.7 -15.1 -28.5 -11.5 1.9 9.6 13.2 9.3 -2.6 -30.8 -5.6 10.9 -0.8Finance & Insurance 354.3 356.5 362.9 364.5 369.9 356.7 330.9 318.8 319.4 327.1 339.3 347 343.3 316 311.3 321.7 320.7 (dif) -4.2 2.2 6.4 1.6 5.4 -13.2 -25.9 -12.1 0.7 7.6 12.3 7.7 -3.7 -27.3 -4.7 10.4 -1Securities 161.7 170.5 179.8 185.6 195.4 188.1 169.5 161.3 164.7 169.9 178.7 186.1 185.3 166.6 163.5 169.4 166.8 (dif) 0.1 8.9 9.3 5.8 9.8 -7.3 -18.6 -8.2 3.4 5.1 8.8 7.4 -0.9 -18.7 -3.1 5.9 -2.5Banking 113.6 108.8 106.8 103.9 102.7 98.5 92.6 90.1 89 92.1 95.7 95.5 92.3 86 85.1 88.3 90.2 (dif) -3 -4.8 -2 -2.9 -1.3 -4.1 -5.9 -2.5 -1.1 3.1 3.5 -0.2 -3.1 -6.3 -1 3.3 1.9Real Estate & Rental & Leasing 109.9 111.2 114.3 116.6 118.9 116.9 114.2 114.8 116 118 119 120.7 121.7 118.2 117.3 117.8 118 (dif) 1.1 1.3 3.1 2.2 2.4 -2 -2.7 0.6 1.2 2 1 1.6 1 -3.5 -0.9 0.5 0.2Information 158.9 162.6 166.5 172.8 187.3 200.4 176.9 163.9 160.2 162.8 164.9 166.9 169.5 165.3 166 170.9 176.6 (dif) 4.5 3.7 3.8 6.3 14.5 13.1 -23.5 -13 -3.7 2.6 2.1 1.9 2.7 -4.3 0.7 4.9 5.7Professional & Business Services 468.4 493.7 525.2 552.9 586.5 581.9 550.4 536.6 541.6 555.6 571.4 591.8 602.9 568.9 575.3 597.6 619.3 (dif) 23.3 25.3 31.4 27.8 33.6 -4.6 -31.5 -13.8 5 14 15.8 20.4 11.1 -34.1 6.4 22.3 21.6Professional, Scientific, & Technical Services 239.7 254 277.6 296.8 320.7 312.2 289.3 286 292.2 303.7 319.4 333.4 342.9 320.9 320.1 335.4 349.9 (dif) 7.3 14.3 23.6 19.2 24 -8.5 -23 -3.2 6.1 11.5 15.7 14 9.4 -22 -0.8 15.3 14.5Management of Companies & Enterprises 56.4 56.2 58.5 57.3 52.6 54.7 58.4 58.9 56.9 57.6 58.6 59.4 62 61.3 63 64.9 65.3 (dif) 2.4 -0.1 2.3 -1.2 -4.7 2 3.7 0.5 -1.9 0.7 0.9 0.8 2.6 -0.7 1.7 2 0.3Administrative Services 172.4 183.5 189 198.9 213.1 215 202.7 191.7 192.5 194.3 193.5 199 198.1 186.6 192.3 197.3 204.1 (dif) 13.6 11.1 5.6 9.8 14.3 1.8 -12.2 -11 0.8 1.8 -0.8 5.5 -0.9 -11.5 5.6 5 6.8Employment Services 56.8 65.4 68 74.6 83.9 84.2 75 67.2 65.4 66.4 66 67.9 65 56.7 60.8 65.1 69 (dif) 9.5 8.6 2.7 6.6 9.3 0.2 -9.2 -7.8 -1.8 1 -0.4 1.9 -2.9 -8.3 4.1 4.3 3.9Educational & Health Services 565.5 576.2 588.7 604.4 615.2 627.1 646 658.2 665.3 678.8 694.7 705.1 719 734.6 752.8 769.3 785.2 (dif) 14.5 10.7 12.6 15.6 10.9 11.8 18.9 12.2 7.1 13.5 16 10.4 13.9 15.6 18.2 16.5 15.9Educational Services 116.1 119.9 123.7 124.2 126.5 133.1 138.7 142.2 144.8 146.6 151.3 154.4 160.3 164.7 170.3 176.8 184.8 (dif) 11 3.8 3.8 0.4 2.3 6.6 5.6 3.6 2.6 1.7 4.7 3.1 5.9 4.4 5.6 6.5 8Health Care & Social Assistance 449.4 456.3 465 480.2 488.7 494 507.3 516 520.4 532.2 543.5 550.7 558.7 569.9 582.5 592.5 600.3 (dif) 3.6 6.9 8.7 15.2 8.5 5.3 13.3 8.6 4.5 11.8 11.3 7.2 8 11.2 12.6 10 7.8Leisure & Hospitality 216.6 227.9 235.8 243.7 256.7 260.1 255.3 260.3 270.1 276.7 284.9 297.8 310.2 308.5 322.2 342.2 363.1 (dif) 8.1 11.4 7.9 7.8 13.1 3.4 -4.8 5 9.8 6.6 8.1 12.9 12.5 -1.7 13.7 20 20.9Arts, Entertainment, & Recreation 46.3 49.6 50.5 52.9 56.4 56.9 56.2 57.5 60.7 61.5 63.2 65.3 69.1 67.2 67.3 68.4 73.3 (dif) 2.5 3.3 0.9 2.5 3.4 0.6 -0.7 1.3 3.2 0.8 1.7 2.1 3.9 -1.9 0.1 1.1 4.9Accommodation & Food Services 170.3 178.3 185.3 190.7 200.4 203.2 199.1 202.8 209.4 215.3 221.7 232.5 241.1 241.3 254.9 273.7 289.7 (dif) 5.6 8 7 5.4 9.7 2.8 -4.1 3.7 6.6 5.9 6.4 10.9 8.6 0.2 13.6 18.8 16Other Services 125.2 129.3 133.9 141.5 147.4 148.7 149.7 149.1 150.5 153.2 154.3 157.7 160.8 160.3 160.6 165.2 170.2 (dif) 2.7 4.1 4.6 7.6 5.8 1.3 1 -0.6 1.4 2.7 1.1 3.4 3.1 -0.5 0.3 4.6 5Trade, Transportation, & Utilities 532 537.3 542 556.3 569.6 557.4 536.5 533.6 539.3 547.5 559 570.5 574.5 552.4 559.1 574.7 587.7 (dif) 0.4 5.3 4.7 14.3 13.3 -12.2 -20.9 -2.9 5.7 8.2 11.5 11.5 4 -22.1 6.7 15.7 13Retail Trade 248.2 253.1 260.1 270.1 281.5 272 268.1 267.3 273.5 281.3 287.4 295.4 299.6 291.9 302.7 314.4 326.3 (dif) 5.2 4.9 7.1 10 11.4 -9.5 -4 -0.8 6.1 7.9 6.1 7.9 4.2 -7.6 10.8 11.7 11.9Wholesale Trade 153.3 154.8 153.2 155.5 155.1 155.9 149.1 147.7 147.8 147.5 148.9 149.9 148.7 138.7 137.4 139.6 140.4 (dif) -4.5 1.6 -1.6 2.3 -0.5 0.9 -6.8 -1.3 0.1 -0.3 1.4 1 -1.3 -9.9 -1.3 2.1 0.8Transportation & Warehousing 112.6 112.3 112.7 115.4 118.1 114.7 104.5 103.6 103.5 103.8 107.5 109.7 110.4 105.5 103 105.2 106.2 (dif) 0.5 -0.2 0.3 2.7 2.7 -3.4 -10.2 -0.9 -0.1 0.2 3.7 2.3 0.7 -4.9 -2.5 2.2 1Utilities 18 17 16 15.2 14.9 14.8 14.8 14.9 14.5 14.9 15.2 15.4 15.8 16.3 15.9 15.5 14.8 (dif) -0.8 -0.9 -1.1 -0.8 -0.3 -0.1 0.1 0 -0.4 0.4 0.3 0.2 0.4 0.4 -0.4 -0.3 -0.7Construction 90.9 93.5 101.3 112.5 120.5 122.1 115.8 112.7 111.8 113.3 118.5 127.3 132.7 120.8 112.5 112.3 115 (dif) 1.1 2.5 7.9 11.2 8.1 1.5 -6.3 -3.1 -0.9 1.5 5.2 8.8 5.5 -12 -8.3 -0.2 2.7Manufacturing 200.5 201.2 195.9 186.8 176.8 155.5 139.4 126.6 120.8 113.9 106.1 101 95.6 81.6 76.3 75.7 76.4 (dif) -7.3 0.7 -5.3 -9.1 -10 -21.3 -16.1 -12.8 -5.7 -6.9 -7.8 -5 -5.4 -14 -5.3 -0.7 0.8Government 545.1 550.5 560.4 567 568.9 562.4 566.2 556.6 554.4 555.6 555.2 559 564.1 567 558 550.6 545.5 (dif) -14.4 5.4 10 6.5 1.9 -6.5 3.8 -9.6 -2.3 1.3 -0.4 3.8 5.1 2.9 -9 -7.4 -5.1
Data: Ths.