may 2019 | investor relations · # 1 digital music distribution production: multi-label system...
TRANSCRIPT
May 2019 | Investor Relations

2
Disclaimer
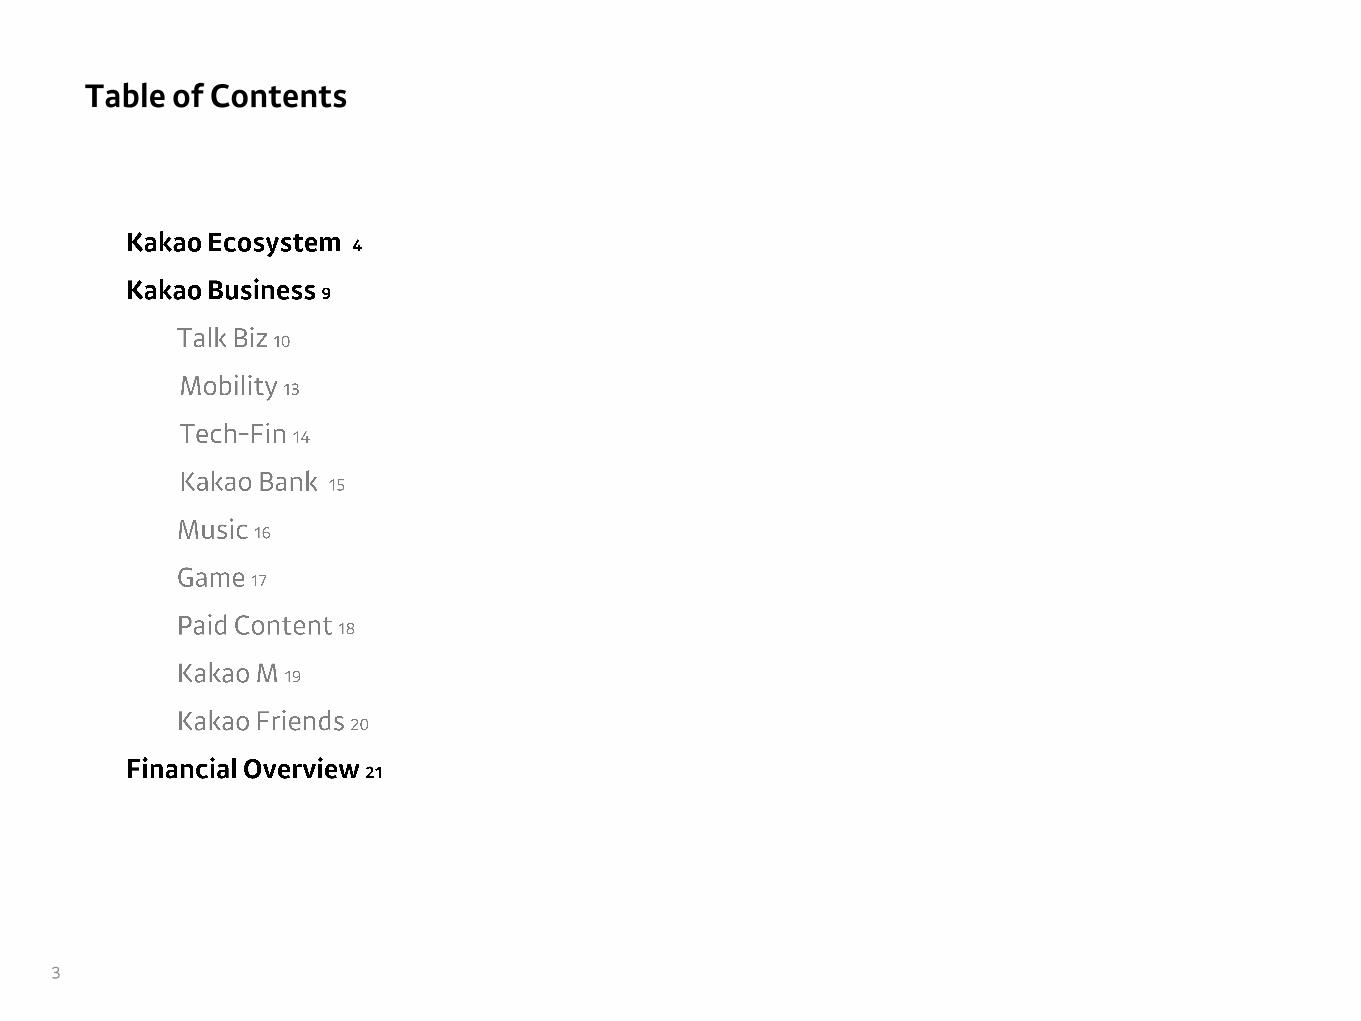
Table of Contents
3

4
Kakao ecosystemKakao business
Financial overview

5
Undisputed Market Leader
Korea 42,746 43,044 43,201 43,526 43,577 43,662 43,812 44,076
Global 49,468 49,844 49,709 50,348 50,113 50,187 50,219 50,547

6
Advertising Commerce
Interactive Business Platform
Mobility
“ExplosiveGrowth &Business
ModelExpansion”
“Multimodal Platform with All-Inclusive
Transportation Needs”
Unrivaled Positioning
No.1
Tech-FinAI /
Blockchain
“Reshaping the Korean
Financial Industry”
“Future Growth Engine”
LeadingTech-Fin
28 Million Domestic User
Sustained Growth for
Future
Expanding Kakao i &
BlockchainMain Net
Kakao Ecosystem
Content Ecosystem & Global Expansion
IP BusinessMusic / Video
Game
“Regaining Leadership via
Integration”
Business Expansion
In-house IP Game
Development
Web Literature
“AggressiveGlobal
Expansion via Unique
Business Model”
#1 App
In Mobile Literature
Talk BizboardLaunching
Evolving as a Business Platform
“Launching TalkBoard
based on Big Data and AI technology”
Kakao Commerce
Talk based transactional
Business Model
In Music Streaming &
Downloading
“One-of-a-Kind Business Model
with Superior Profitability”
Most Likeable among Koreans
“Cash &Loyalty
Generator Through IP”

7
Notes: (1) In terms of asset size. (2) In terms of Japan App Store Books category. (3) Source: Kakao Mobility (4) Based on app downloads. (5) App Annie. Based on number of games in Top 100 on App Store in Korea in terms of grossing. (6) Korea Creative Content Agency survey
Repeatable Success Formula

Stake of Major Subsidiaries and Strategic Partnerships
HongKong
┃┃10%┃4%
┃4%┃4%
┃4%┃4%
┃2%
8

9
Kakao ecosystem
Kakao businessFinancial overview
10
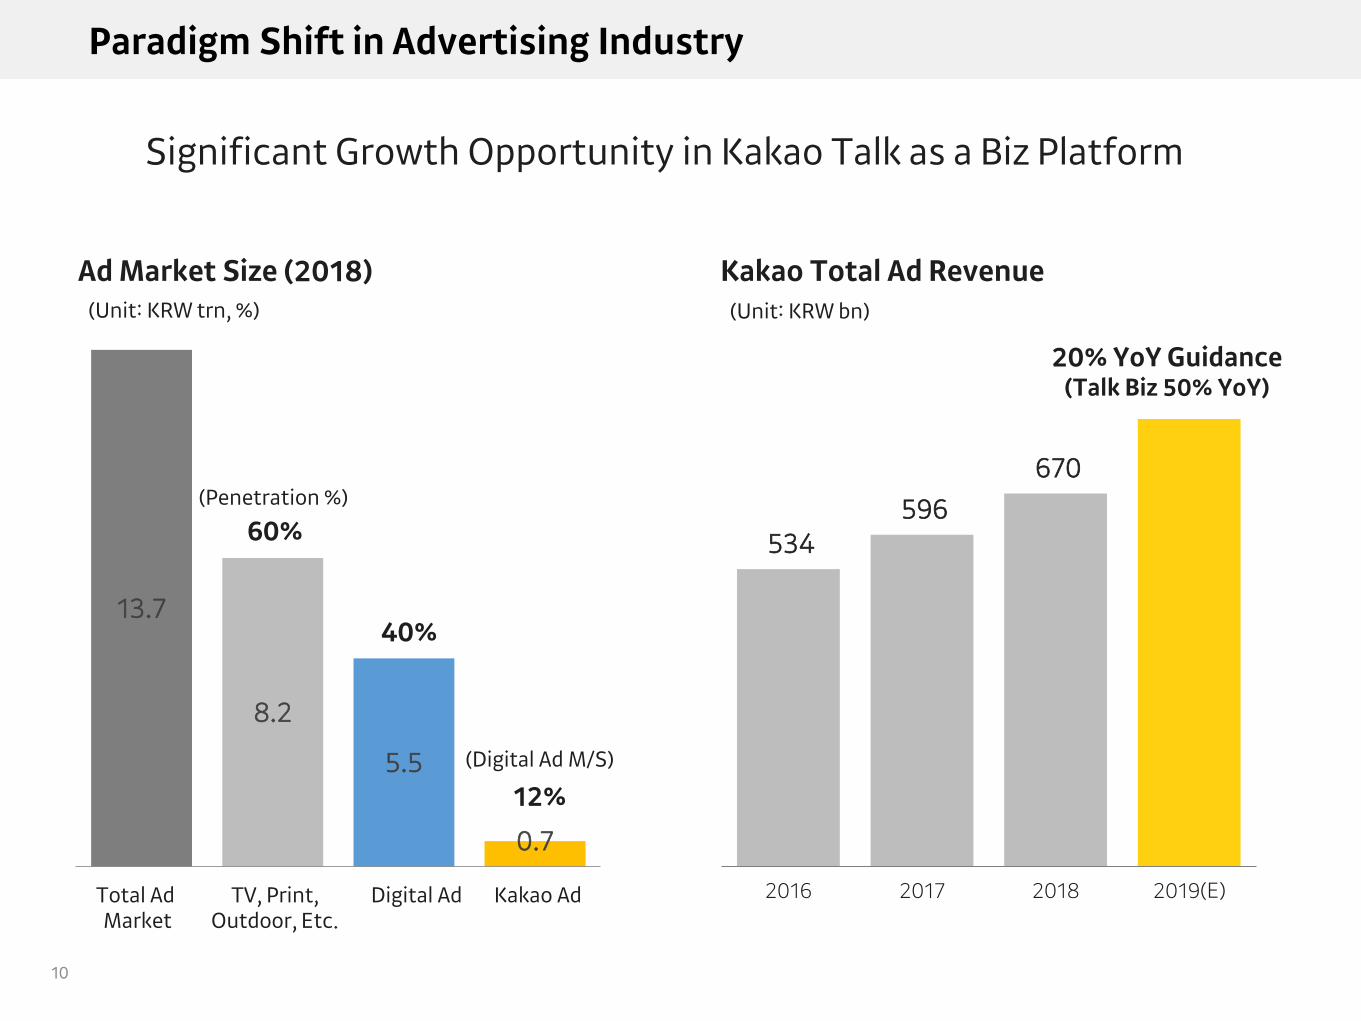
13.7
8.2
5.5
0.7
Ad Market Size (2018)
60%
40%
12%
(Penetration %)
534 596
670
2016 2017 2018 2019(E)
Kakao Total Ad Revenue
20% YoY Guidance(Talk Biz 50% YoY)
(Unit: KRW bn)(Unit: KRW trn, %)
Paradigm Shift in Advertising Industry
Significant Growth Opportunity in Kakao Talk as a Biz Platform
Total Ad Market
TV, Print,Outdoor, Etc.
Digital Ad Kakao Ad
(Digital Ad M/S)

11
Purchase
Reservation
Download
Registration
Customer Service
…
#DISCOVER #ACTION#CONNECT
Users can get recommendations of their interests
TalkBoard, a New Innovative Way to Connect 44million Mega Traffic
Kakao Talk Bizboard (TalkBoard)
Users may fulfill any actions that wish to take
PlusFriends
AIChatbot
Sync
Payment
Brand Tab Talk GiftSupport
Talk
TalkStore
Chat list tab is where users spend the most time

12
2011 2012 2013 2014 2015 2016 2017 2018
Kakao TalkGift
Talk Biz Commerce
From Leveraging the Social Graph to any Talk-based Transactions
TalkBoard will revolutionize daily commerce experience
KRW 1trn
13
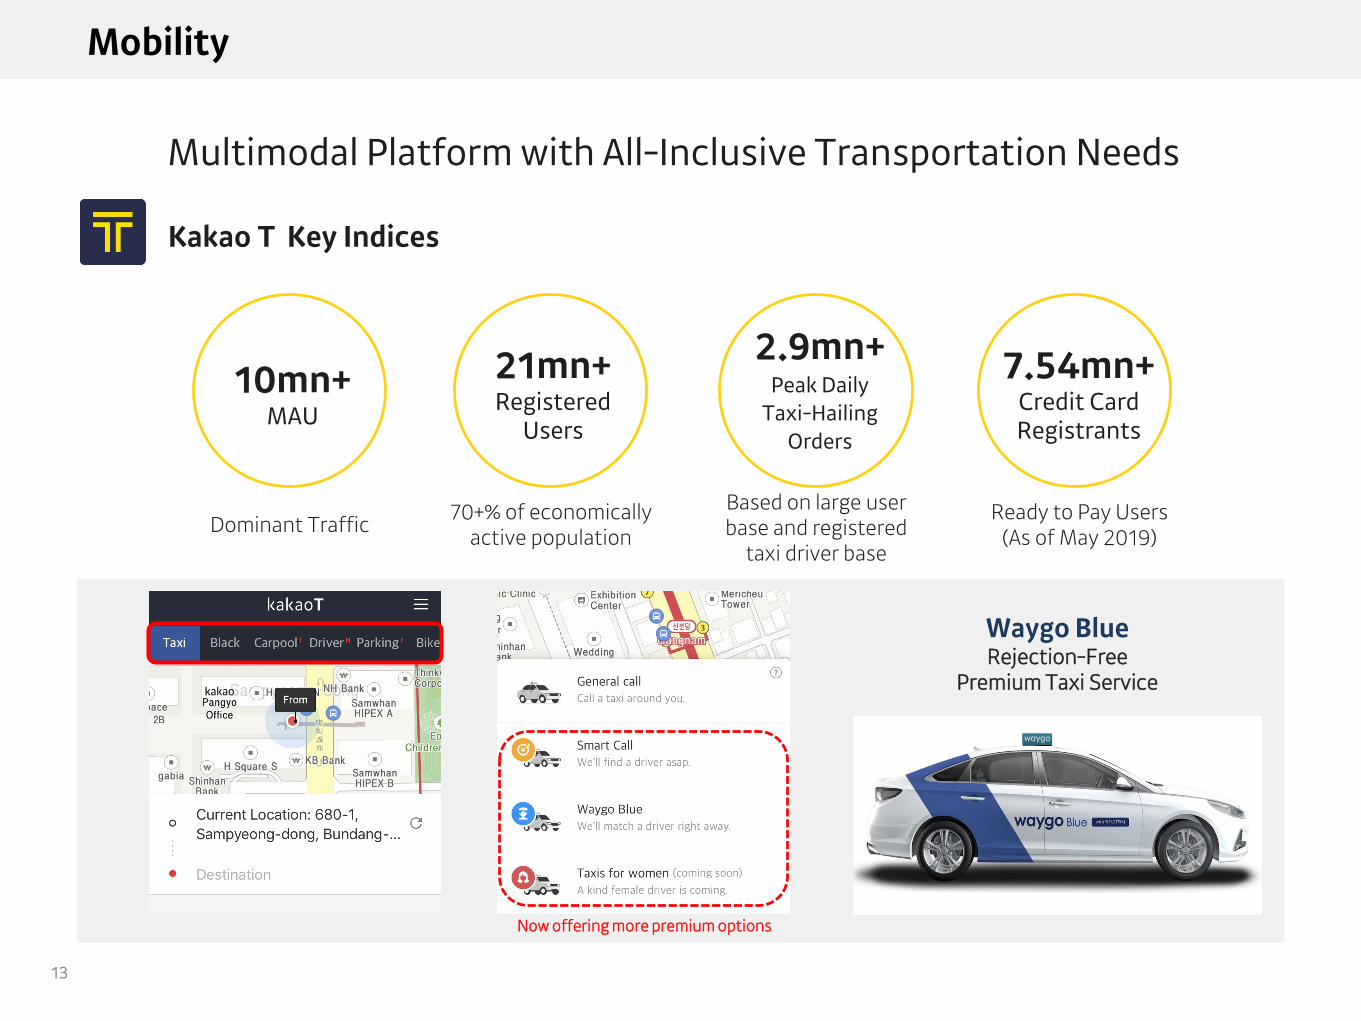
Multimodal Platform with All-Inclusive Transportation Needs
Kakao T Key Indices
Mobility
10mn+MAU
21mn+Registered
Users
2.9mn+Peak Daily
Taxi-Hailing Orders
7.54mn+Credit Card Registrants
Ready to Pay Users(As of May 2019)
Dominant Traffic70+% of economically
active population
Based on large user base and registered
taxi driver base
Waygo BlueRejection-Free
Premium Taxi Service
Now offering more premium options

14
No.1 All-Encompassing Financial Platform
Kakao Pay Key Indices
Embedded inKakaoTalk
Landing Page Investment Service(Launched Nov 2018)
Apeach
Tech-Fin
Payment Finance B2B
Money Transfer Payment
MembershipPayment Bills
E-ReceiptsCredit-based transaction
InvestmentInsurance
CertificationElectronic Bills
Business Portfolio
28mn+Accumulated
Members
15mn+MAU
W10trn+1Q19 GMV
FY2018 Total GMV W20trn

15
Kakao Bank Key Indices
Kakao Bank
No.1 Internet-Only Bank with Innovation
W1.3trnCapital
9mn+ W14.9trnDeposits
W6.6bn1Q19
Net Income
26 weeks installment saving
Kakao bank moim service
Money transfer to abroad
My credit information
W9.7trnCredit Loans

16
3.554.00
4.555.08 5.13
4Q15 4Q16 4Q17 4Q18 1Q19
Melon Paying Subscribers(Unit: mn)
Real-Time Charts(Brand Power)
Melon DJ (Human Curation)
Music DNA(Big Data)
Kakao related contents
Music
# 1 Digital Music Platform with Unparalleled Market Presence
6mn+Unique Visitor
40mn+Song Library
85mn+Playlists
Dominant Traffic Largest Music Content
Melon Key Indices
More personalized,customized functions

17
Mobile/PC Game PublishingMobile Game Channel Mobile Game Development Global Expansion
✔
Multi-Platform Publisher to Global Game Provider
✔
✔

18
웹툰
드라마
영화
뮤지컬
Global Expansion
20 mm cumulative registered users
5.5 mm monthly active users
Largest original IP Pool in Korea
Daewon C.I
Haksan Publishing
Seoul Media Comics
DNC Media
Samyang CNC
Daon Creative
+177%YOY
+32%YOY
Japanese webtoon platform launched by kakao Japan in 2016
Ranking #1 Top, #2 Grossing App in the Google Play Store book category
Successful localization efforts
Launched ‘Piccoma TV’ in July 2018
Established K-Content ecosystem in Southeast Asia
WEB NOVEL
DRAMAWEBTOON
MOVIEGAME
SUPER IP
Maximize the content value through creating Super IPs
Neobazzar,Indonesia
Growth through Innovative Business Model and Original IPs
Kakao Page Piccoma (Kakao Japan)
SecuredIPs
Kakao Page Piccoma
19
<1theK> K-POP Content Production
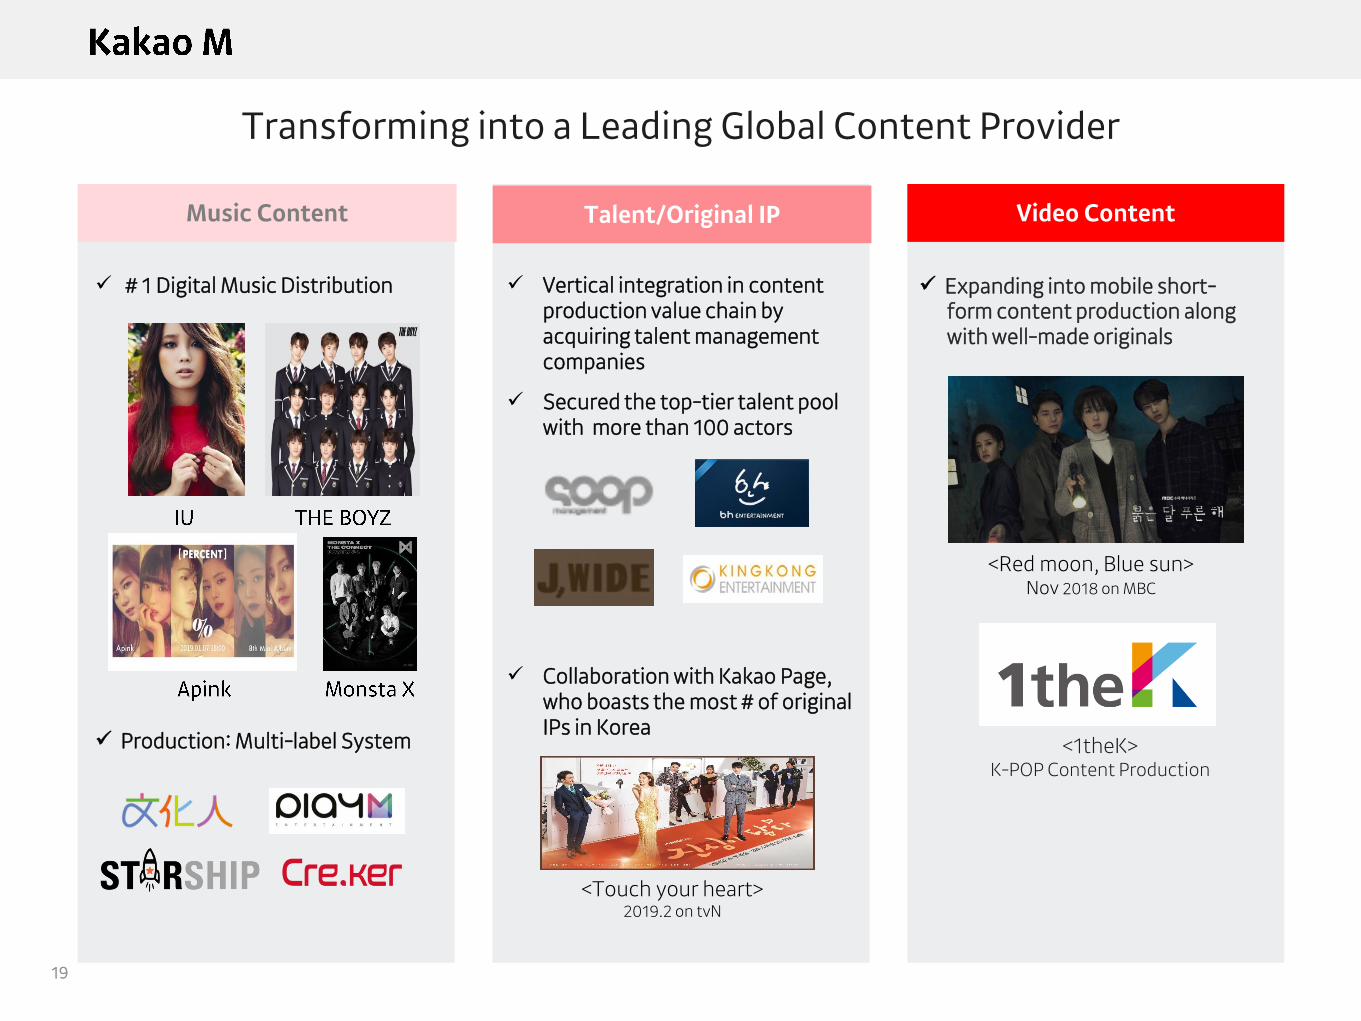
Transforming into a Leading Global Content Provider
# 1 Digital Music Distribution
Production: Multi-label System
Vertical integration in content production value chain by acquiring talent management companies
Secured the top-tier talent pool with more than 100 actors
<Touch your heart> 2019.2 on tvN
Collaboration with Kakao Page, who boasts the most # of original IPs in Korea
Expanding into mobile short-form content production along with well-made originals
<Red moon, Blue sun> Nov 2018 on MBC
Video ContentMusic Content Talent/Original IP

20
Kakao Friends IP
Japan┃Tokyo Omotesando store open(Dec. 2018)
China┃Tmall(domestic & global), JD.com
North America ┃ Amazon
Going Global
Merchandising LicensingGame
Successfully Expanded into a Full-Fledged IP Business Player
GangNamJuly 2016
HongDaeNovember 2016
BusanAugust 2017
Japan Tokyo Omotesando
December 2018
Flagship & Global Stores

21
Kakao ecosystem
Kakao business
Financial overview

© Kakao Corp.
22
Advertising
Kakao
KakaoTalk
(Plus Friends, #Tab, Talk Store, etc.)KakaoTalk Brand EmoticonKakao Story/Style/Page
DaumDaum PC Daum Mobile
Other Subsidiaries’ Ad
Content
Game Mobile PC Kakao VX
MusicMelon Kakao Music
Digital Music Distribution Ticket
Paid
Content
Kakao Page Daum Webtoon
Piccoma
KakaoTalk B2C Emoticon
Others
Commerce
Talk Gift Shop
Kakao Makers
Kakao IX
Misc.
Mobility, Pay
Kakao M
(Excluding Digital Music Distribution)
Misc.
AS-IS TO-BE
Changes in Revenue Breakdown
Platform
Talk Biz
KakaoTalk
(Plus Friends, #Tab, Talk Store, etc.)
Talk Gift Shop, Kakao Makers
KakaoTalk Brand/B2C Emoticon
New BM in KakaoTalk
(Talk Bizboard, Chat Bot, etc.)
Portal Biz
Daum PC Daum Mobile
Other Subsidiaries’ Ad
Kakao Story/Style/Page
New BizMobility, Pay
Misc. (Other Subsidiaries)
Content
Game Mobile PC Kakao VX
MusicMelon Kakao Music
Digital Music Distribution Ticket
Paid
Content
Kakao Page Daum Webtoon
Piccoma
IP Business
and Others
Kakao IX
Kakao M
(Excluding Digital Music Distribution)
Changes in revenue breakdown from 1Q 2019 to reflect KakaoTalk platform-centric business strategies

© Kakao Corp.
23
Total Revenue
58% 57% 58% 55% 56%
42%43% 42%
45%44%
1Q18 2Q18 3Q18 4Q18 1Q19
Platform Content
673,345
555,421
706,312
1Q Total Revenue YoY +27% / QoQ +5%Platform Business accounts for 44%, Content Business 56%
(in million KRW)
588,933 599,293
Revenue Breakdown
Platform
Talk Biz
KakaoTalk
(Plus Friends, #Tab, Talk Store, etc.)
Talk Gift Shop, Kakao Makers
KakaoTalk Brand/B2C Emoticon
New BM in KakaoTalk
(Talk Bizboard, Chat Bot, etc.)
Portal Biz
Daum PC Daum Mobile
Other subsidiaries’ ad
Kakao Story/Style/Page
New BizMobility, Pay
Misc. (Other Subsidiaries)
Content
Game Mobile PC Kakao VX
MusicMelon Kakao Music
Digital music distribution Ticket
Paid
Content
Kakao Page Daum Webtoon
Piccoma
IP Business
and Others
Kakao IX
Kakao M
(Excluding digital music distribution)
© Kakao Corp.
24
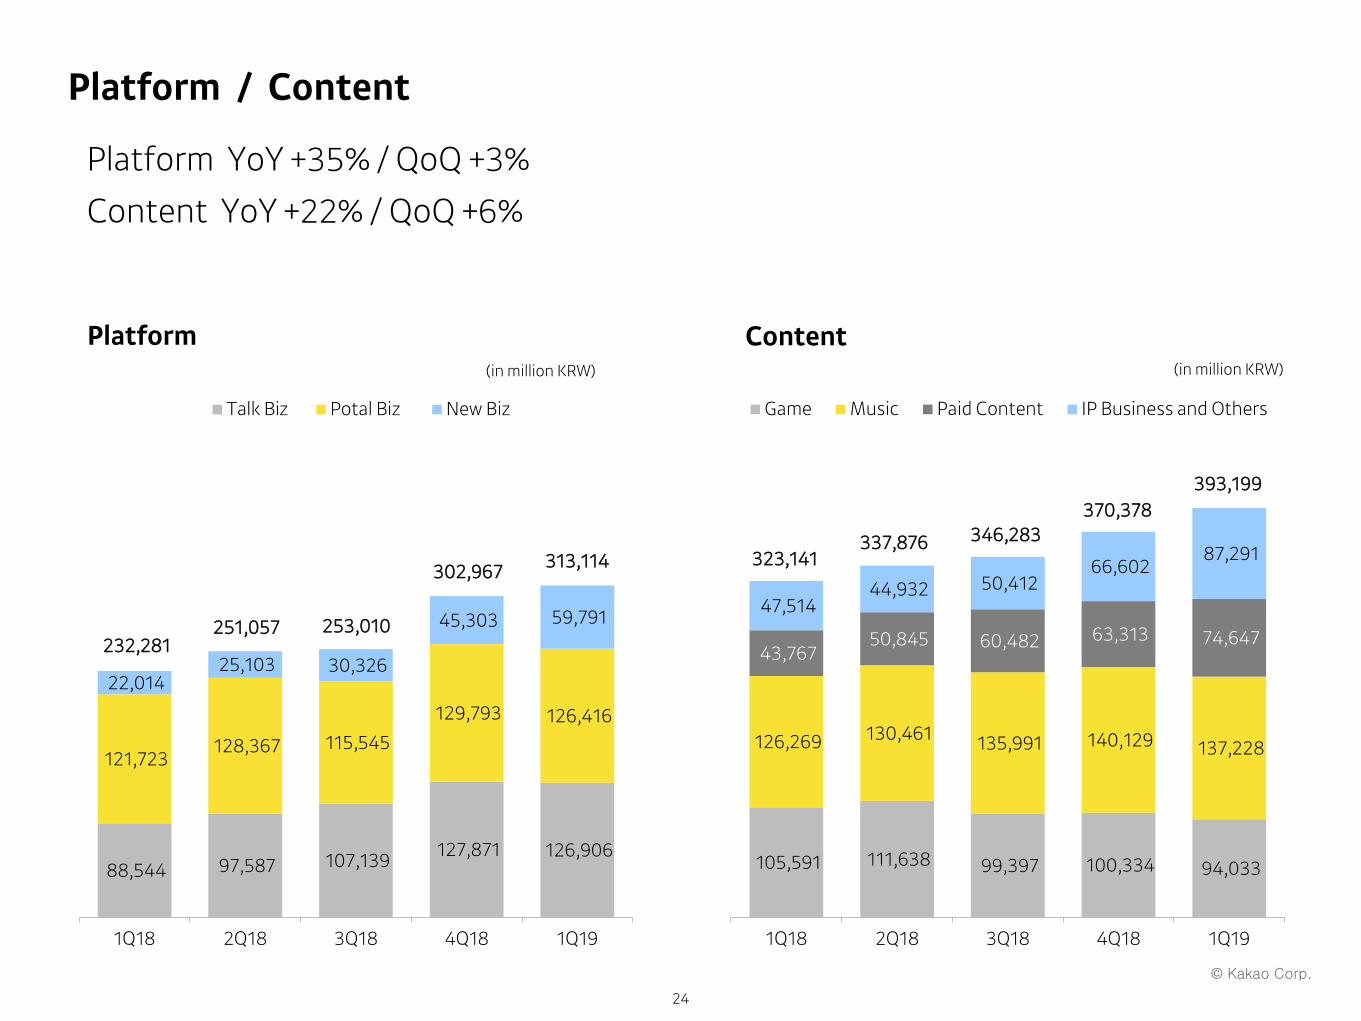
Platform / Content
Platform YoY +35% / QoQ +3%
Content YoY +22% / QoQ +6%
88,544 97,587 107,139 127,871 126,906
121,723 128,367 115,545
129,793 126,416
22,014 25,103 30,326
45,303 59,791
1Q18 2Q18 3Q18 4Q18 1Q19
Talk Biz Potal Biz New Biz
Platform Content(in million KRW)
232,281 251,057 253,010
302,967 313,114 323,141
337,876 346,283 370,378
393,199
(in million KRW)
105,591 111,638 99,397 100,334 94,033
126,269 130,461 135,991 140,129 137,228
43,767 50,845 60,482 63,313 74,647
47,514 44,932 50,412
66,602 87,291
1Q18 2Q18 3Q18 4Q18 1Q19
Game Music Paid Content IP Business and Others
© Kakao Corp.
25
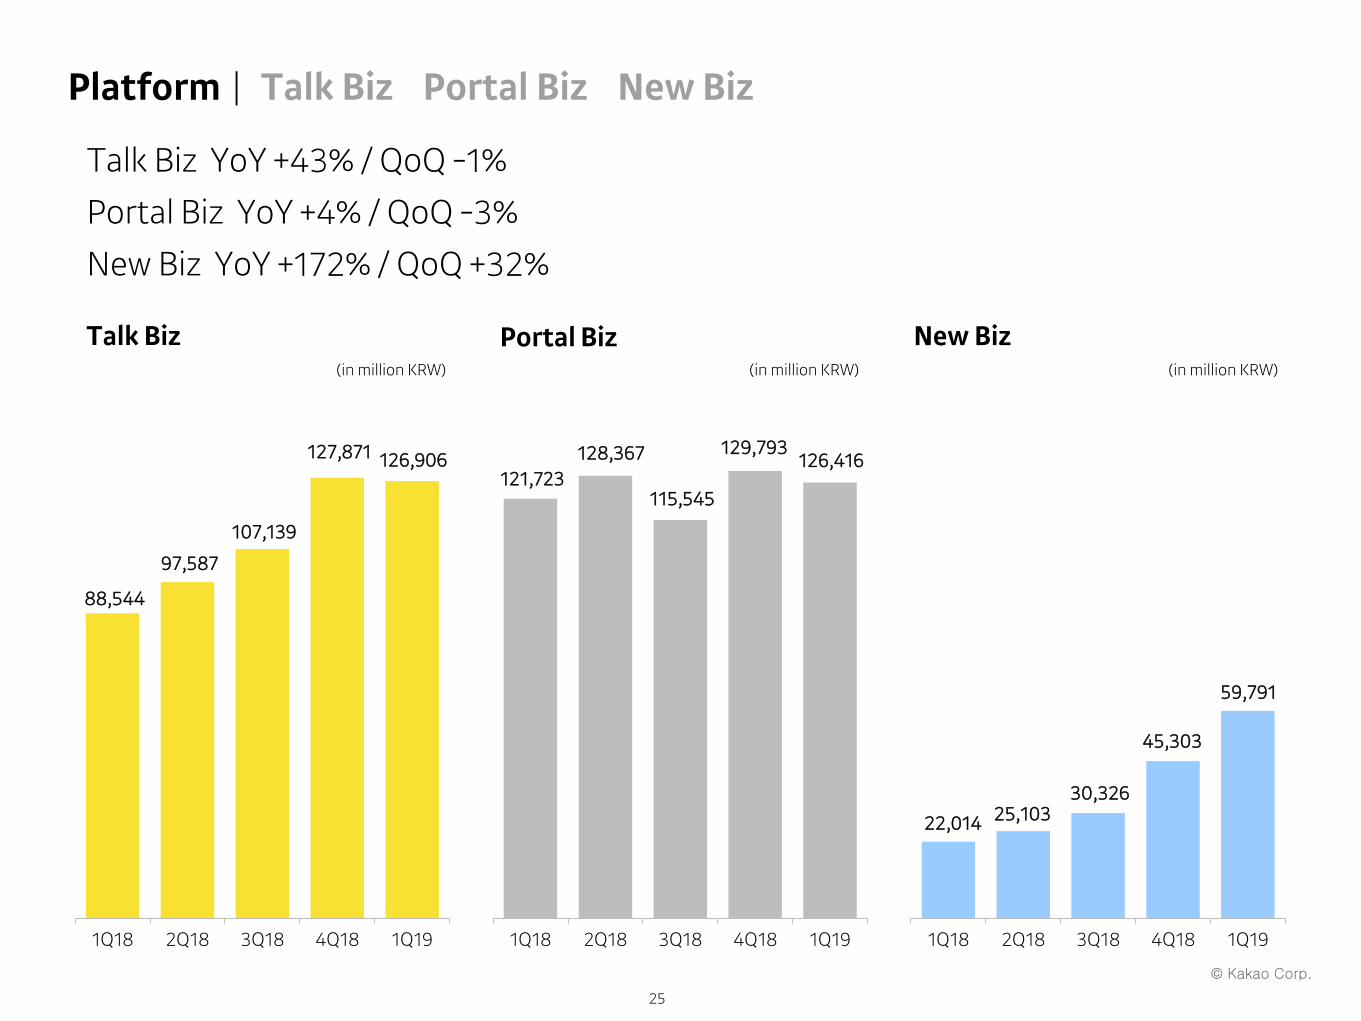
Platform┃ Talk Biz Portal Biz New Biz
88,544
97,587
107,139
127,871 126,906
1Q18 2Q18 3Q18 4Q18 1Q19
Talk Biz(in million KRW)
Talk Biz YoY +43% / QoQ -1%
Portal Biz YoY +4% / QoQ -3%
New Biz YoY +172% / QoQ +32%
121,723 128,367
115,545
129,793 126,416
1Q18 2Q18 3Q18 4Q18 1Q19
Portal Biz(in million KRW)
22,014 25,103 30,326
45,303
59,791
1Q18 2Q18 3Q18 4Q18 1Q19
New Biz(in million KRW)
© Kakao Corp.
26
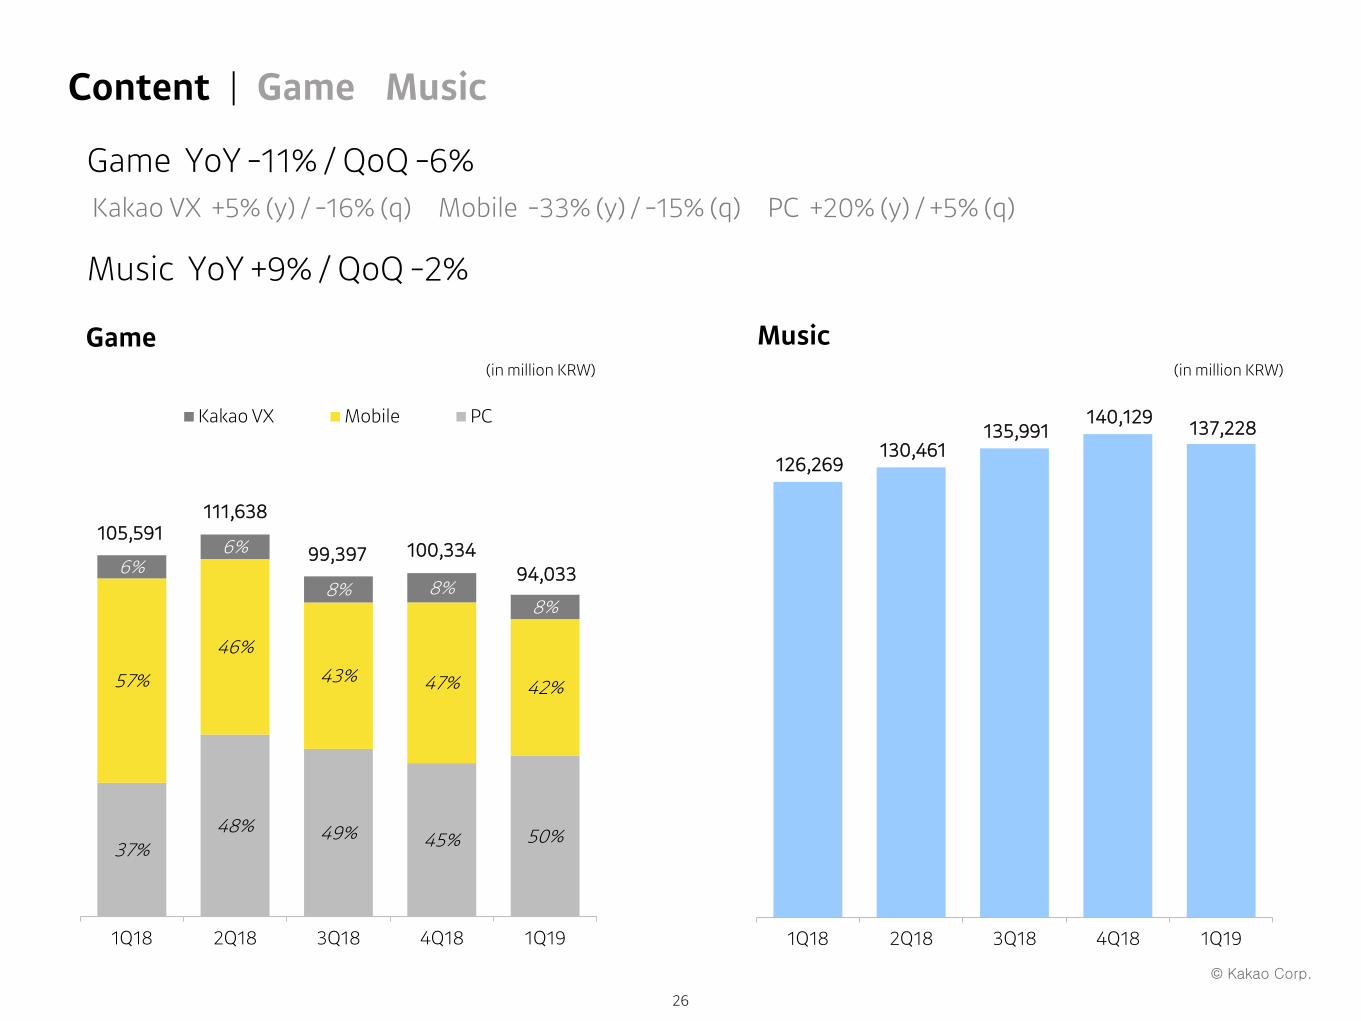
Content ┃ Game Music
126,269 130,461
135,991 140,129
137,228
1Q18 2Q18 3Q18 4Q18 1Q19
37%48% 49% 45% 50%
57%
46%
43% 47% 42%
6%6%
8% 8%8%
1Q18 2Q18 3Q18 4Q18 1Q19
Kakao VX Mobile PC
Game Music
Game YoY -11% / QoQ -6%Kakao VX +5% (y) / -16% (q) Mobile -33% (y) / -15% (q) PC +20% (y) / +5% (q)
Music YoY +9% / QoQ -2%
105,591111,638
99,397 100,33494,033
(in million KRW)(in million KRW)

© Kakao Corp.
27
Content ┃ Paid Content IP Business and Others
81%78%
75% 73%70%
19%
22%
25% 27%
30%
1Q18 2Q18 3Q18 4Q18 1Q19
Piccoma (Japan) Kakao Page
47,514 44,932
50,412
66,602
87,291
1Q18 2Q18 3Q18 4Q18 1Q19
Paid Content IP Business and Others
Paid Content YoY +71% / QoQ +18% Piccoma (Japan) +177% (y) / +34% (q) Kakao Page +46% (y) / +12% (q)
IP Business and Others YoY +84% / QoQ +31%
43,767
50,845
60,48263,313
74,647
(in million KRW)(in million KRW)

© Kakao Corp.
28
1Q18 4Q18 1Q19Chg.
YoY QoQ
Total Revenue 555,421 673,345 706,312 27% 5%
Platform 232,281 302,967 313,114 35% 3%
Talk Biz 88,544 127,871 126,906 43% -1%
Portal Biz 121,723 129,793 126,416 4% -3%
New Biz 22,014 45,303 59,791 172% 32%
Content 323,141 370,378 393,199 22% 6%
Game 105,591 100,334 94,033 -11% -6%
Music 126,269 140,129 137,228 9% -2%
Paid Content 43,767 63,313 74,647 71% 18%
IP Business and Others 47,514 66,602 87,291 84% 31%
Operating Expenses 545,020 669,052 678,649 25% 1%
Operating Profit 10,402 4,293 27,663 166% 544%
Margin (%) 1.9% 0.6% 3.9% +2.0%p +3.3%p
Net Profit 14,649 -28,639 17,564 20% -
Controlling Interests 13,854 -969 27,512 99% -
Non-controlling Interests 796 -27,670 -9,948 - -
(in million KRW)

© Kakao Corp.
29
Changes in Operating Expense Classification
Labor Cost
Employee Benefit Expense
Commission Cost
(Cost of sales) Market Commission Cost, Payment Agency Fee, Operation Agency Fee, TAC, Partner R/S , Management Royalty(Fixed Cost) Outsourcing, Consulting, Firm Banking Cost, Infrastructure Maintenance Expense
Content Fee CP CommissionContent Commission
Ad Agency Fee
Cost of Good Sold Talk Gift, Makers, Kakao M, etc.
Advertising Cost
Event Cost
Bad Debts Expense
Amortization Cost
Depreciation Cost
Rental Fee
Misc. Misc.
Labor CostLabor Cost, Employee Benefit Expense, Misc.
Cost of Revenue
Commission Cost (Cost of sales)Content Fee (CP commission)Ad Agency FeeCost of Good Sold
Outsourcing /Infrastructure
Commission Cost (Fixed Cost)Content Commission
Marketing Expense Marketing Cost, Event Cost
Depreciation andAmortization Cost
Depreciation Cost, Amortization Cost, Bad Debts Expense
Misc. Rental Fee, Misc.
AS-IS TO-BE
Changes in operating expense classification to clarify cost structure and business roadmap

© Kakao Corp.
30
1Q18 4Q18 1Q19Chg.
YoY QoQ
Operating Expenses 545,020 669,052 678,649 25% 1%
Labor Cost 127,258 158,323 160,127 26% 1%
Cost of Revenue 250,720 306,867 330,644 32% 8%
Outsourcing /
Infrastructure68,112 87,804 89,930 32% 2%
Marketing Expense 48,324 55,741 32,947 -32% -41%
Depreciation and Amortization Cost
31,445 38,193 50,142 59% 31%
Misc. 19,159 22,124 14,859 -22% -33%
(in million KRW)

© Kakao Corp.
31
Operating Profit Net Profit
10,402
27,590
30,664
4,293
27,663
1.9%
4.7%5.1%
0.6%
3.9%
1Q18 2Q18 3Q18 4Q18 1Q19
14,649
22,494
7,384
(28,639)
17,564
2.6%3.8%
1.2%
-4.3%
2.5%
1Q18 2Q18 3Q18 4Q18 1Q19
1Q Operating Profit YoY + W17.3bn/ QoQ + W23.4bn Operating Profit from Existing Businesses excluding New Businesses(Mobility, Tech-fin, Global Expansion, Artificial Intelligence and Block Chain) W79.9bn
Net Profit YoY + W2.9bn / QoQ + W46.2bn
Profits
(in million KRW)(in million KRW)

© Kakao Corp.
32
CapEx / Employees
CapEx 1Q CapEx to Revenue Ratio 6% / YoY +74%
Employees 1Q Total 8,278 employees, QoQ +1,003QoQ Increase mostly due to the New Inclusion of Consolidated Subsidiaries
2,529 2,533 2,952 2,775 2,598
3,809 4,073 3,985 4,500
5,680
1Q18 2Q18 3Q18 4Q18 1Q19
Subsidiaries Kakao
CapEx Employees
6,3386,606
6,9377,275
8,278
(in million KRW) (# of people)
17,173
7,117
27,043
33,938
24,908
8,517
12,234
8,492
16,117
19,681
5%3%
6%7% 6%
1Q18 2Q18 3Q18 4Q18 1Q19
IntangibleProperty and EquipmentCapEx to Revenue Ratio
32
25,690
19,351
35,535
50,055
44,589

© Kakao Corp.
33
Consolidated Income Statement
(in million KRW) 1Q18 2Q18 3Q18 4Q18 1Q19Total Revenue 555,421 588,933 599,293 673,345 706,312Platform 232,281 251,057 253,010 302,967 313,114
Talk Biz 88,544 97,587 107,139 127,871 126,906Portal Biz 121,723 128,367 115,545 129,793 126,416New Biz 22,014 25,103 30,326 45,303 59,791
Content 323,141 337,876 346,283 370,378 393,199Game 105,591 111,638 99,397 100,334 94,033Music 126,269 130,461 135,991 140,129 137,228Paid Content 43,767 50,845 60,482 63,313 74,647IP Business and Others 47,514 44,932 50,412 66,602 87,291
Operating Expenses 545,020 561,343 568,629 669,052 678,649Labor Cost 127,258 125,921 130,349 158,323 160,127Cost of Revenue 250,720 260,802 261,099 306,867 330,644Outsourcing / Infrastructure 68,112 73,743 84,719 87,804 89,930Marketing Expense 48,324 46,062 37,187 55,741 32,947Depreciation andAmortization Cost
31,445 33,943 34,532 38,193 50,142
Misc. 19,159 20,872 20,742 22,124 14,859
Operating Profit 10,402 27,590 30,664 4,293 27,663Margin (%) 1.9% 4.7% 5.1% 0.6% 3.9%
Other Non-Operating Income 12,858 12,504 27,492 21,676 8,837Other Non-Operating Expenses 14,205 13,415 24,616 33,536 16,048Financial Income 14,559 35,388 18,429 44,077 22,801Financial Expenses 8,585 7,140 6,500 27,918 5,729Income from Equity Inv., Net 22,151 2,093 2,769 -20,361 2,988
Profit before Income Tax 37,181 57,021 48,238 -11,769 40,512Income Tax 22,531 34,527 40,854 16,870 22,948
Net Profit 14,649 22,494 7,384 -28,639 17,564Controlling Interests 13,854 18,366 16,635 -969 27,512Non-controlling Interests 796 4,128 -9,251 -27,670 -9,948
EBITDA 40,970 60,607 65,648 40,753 78,113
Consolidated Financial Statements Summary
Consolidated Statement of Financial Position
(in million KRW) 2017.12.31 2018.12.31 2019. 3.31Current Assets 1,993,096 2,858,950 2,772,525
Cash and Cash Equivalents 1,116,793 1,247,013 1,633,397S-T Financial Instruments 394,152 924,215 496,452Account Receivable 179,238 193,669 104,408Other Financial Assets 134,445 233,437 322,031Other Current Assets 168,468 260,616 216,236
Non-Current Assets 4,356,332 5,100,592 5,302,443Equity Method Investments 161,950 305,188 302,881Tangible Assets 271,044 314,812 331,638Intangible Assets 3,689,582 3,865,265 3,867,635Other Non-current Assets 233,756 615,327 800,289
Total Assets 6,349,428 7,959,542 8,074,969
Current Liabilities 1,040,863 2,039,196 1,969,879Account Payable and Other payable
280,380 460,813 413,977
Short-term Borrowings 174,372 609,480 554,202Income Taxes Payable 115,123 71,040 83,985Other Current Liabilities 470,989 897,863 917,714
Non-Current Liabilities 800,745 293,188 467,147Corporate Bonds 620,808 41,894 44,703Deferred Income Tax Liabilities 139,502 151,228 155,890Other Non-Current Liabilities 40,435 100,066 266,554
Total Liabilities 1,841,609 2,332,385 2,437,026
Paid-in Capital 34,004 41,744 41,749Capital Surplus 3,603,587 4,647,543 4,645,830Other Accumulated Earnings -6,026 1,492 3,854Accumulated Other Comprehensive Income
-4,968 -7,329 -9,322
Retained Earnings 402,542 453,400 470,860Minority Interest 478,681 490,307 484,972
Total Equity 4,507,820 5,627,158 5,637,943Total Liabilities & Equity 6,349,428 7,959,542 8,074,969

© Kakao Corp.
34
Financial Statements Summary (Kakao only)
Income Statement
(in million KRW) 1Q18 2Q18 3Q18 4Q18 1Q19
Total Revenue 244,578 252,523 291,778 385,046 331,522
Operating Expenses 228,192 223,005 255,788 344,574 296,869
Labor cost 63,853 59,443 63,665 83,431 66,316
Cost of revenue 93,908 92,106 110,641 164,786 151,260
Outsourcing / Infrastructure 41,257 44,123 47,963 50,438 45,234
Marketing expense 6,146 3,380 7,140 12,875 2,184
Depreciation andAmortization Cost
17,305 17,478 19,471 25,810 28,277
Misc. 5,724 6,476 6,908 7,234 3,599
Operating Profit 16,386 29,518 35,990 40,472 34,654
Margin (%) 6.7% 11.7% 12.3% 10.5% 10.5%
Other Non-Operating Income 50,042 3,545 2,613 2,359 1,006
Other Non-Operating Expenses 4,973 7,317 3,192 26,873 13,664
Financial Income 17,829 39,812 5,791 16,795 13,638
Financial Expenses 9,207 1,439 6,934 18,552 3,995
Profit before Income Tax 70,077 64,120 34,268 14,201 31,639
Income Tax 16,693 19,806 40,820 15,117 10,435
Net Profit 53,384 44,314 -6,552 -915 21,204
EBITDA 33,497 46,614 56,313 65,396 63,188
(in million KRW) 2017.12.31 2018.12.31 2019. 3.31
Current Assets 632,508 1,261,480 1,269,433Cash and Cash Equivalents 388,574 250,920 666,790S-T Financial Instruments 14,834 601,712 257,254Account Receivable 77,955 71,333 64,135Other Current Assets 151,145 337,515 281,254
Non-Current Assets 4,324,369 4,941,359 5,053,845Equity Method Investments 2,368,582 1,496,538 1,485,643Tangible Assets 208,084 236,016 252,342Intangible Assets 1,620,416 2,875,510 2,882,313Other Non-current Assets 127,287 333,295 433,548
Total Assets 4,956,878 6,202,839 6,323,279
Current Liabilities 948,931 1,250,706 1,268,220Account Payable and Other payable
163,318 404,760 520,230
Short-term Borrowings 378,088 564,921 516,575Income Taxes Payable 81,507 59,204 67,533Other Current Liabilities 326,018 221,821 163,881
Non-Current Liabilities 450,237 200,790 289,560Corporate Bonds 392,974 39,939 39,946Deferred Income Tax Liabilities 28,992 126,350 125,046Other Non-Current Liabilities 28,271 34,501 124,568
Total Liabilities 1,399,168 1,451,496 1,557,780
Paid-in Capital 34,004 41,744 41,749Capital Surplus 3,036,434 4,096,216 4,097,226Other Accumulated Earnings -6,026 35,547 37,909Accumulated Other Comprehensive Income
-4,472 -1,606 -1,978
Retained Earnings 497,769 579,442 590,594
Total Equity 3,557,710 4,751,343 4,765,499Total Liabilities & Equity 4,956,878 6,202,839 6,323,279
