mbpc study stakeholder meeting preliminary & partial
TRANSCRIPT
ERSC
MBPC Study – Stakeholder meetingPreliminary & Partial Results for Review & Discussion
Entergy Regional State Committee (ERSC)Southwest Power Pool (SPP)
May 3, 2011
ABB Inc. , Electric System Consulting Dept.
ERSC
© ABB Group May 3, 2010 | Slide 1
ERSCAgenda
1. Study Overview
Study Status
Task List and Study Approach
2. Reference Case - Production Costing & Power Flow
3. Results for Western Region - Production Costing & Power Flow
4. Results for WOTAB Region - Production Costing & Power Flow
5. Economic Comparison – Method and Metrics
© ABB Group May 3, 2010 | Slide 2

ERSCStudy Status
Study assumption document submitted for review
Completed development of production costing and
power flow models for 2013 Reference Case
(nomograms enforced)
Analysis for Western and WOTAB Regions under way
Development of production costing and power flow
models for year 2022 conditions – on-going
© ABB Group May 3, 2010 | Slide 3

ERSC Task ListTask 1 – Develop Data base and System Models
Task 2 – Transmission Analyses with High Cost Unit
Task 3 – Transmission Analyses w/o High Cost Unit & no Transmission Change
Task 4 – Transmission Analyses w/o High Cost Unit & Transmission Change
Task 5 – Production Cost Simulation with High Cost Unit
Task 6 – Production Cost Simulation w/o High Cost Unit & no related Transfer Limit
Constraint
Task 7 – Production Cost Simulation w/o High Cost Generation Unit & with
Transmission Changes
Task 8 – Economic Comparison of Benefits and Costs
Task 9 – Collate results by Units, Plants and Groups.
Task 10 – Congestion Analysis
Task 11 – Fuel Price Elasticity
Task 12 – Sensitivity Analysis
Task 13 – Perform ATC Calculations
Task 14 – Study Report Preparation, Discussion and Presentation
Task 15 – Additional Transmission Upgrades required for Flexible Capacity
(Optional)© ABB Group May 3, 2010 | Slide 4

ERSC Study Approach - Overview
© ABB Group May 3, 2010 | Slide 5

ERSCReference Case Development
Reference case provides a base for determining the
impact of removing any nomograms for the study units
Nomograms are enforced in the reference case
Modeling assumptions described in Study
Assumptions Document
© ABB Group May 3, 2010 | Slide 6

ERSCReference Case (Production Costing) Benchmarked with Entergy units, using following
statistics for 2007, 2008, 2009:
Annual energy production
Annual service hours
Nomogram guidelines modeling was verified
Operating reserve modeling was verified
Entergy generation units data were checked
© ABB Group May 3, 2010 | Slide 7
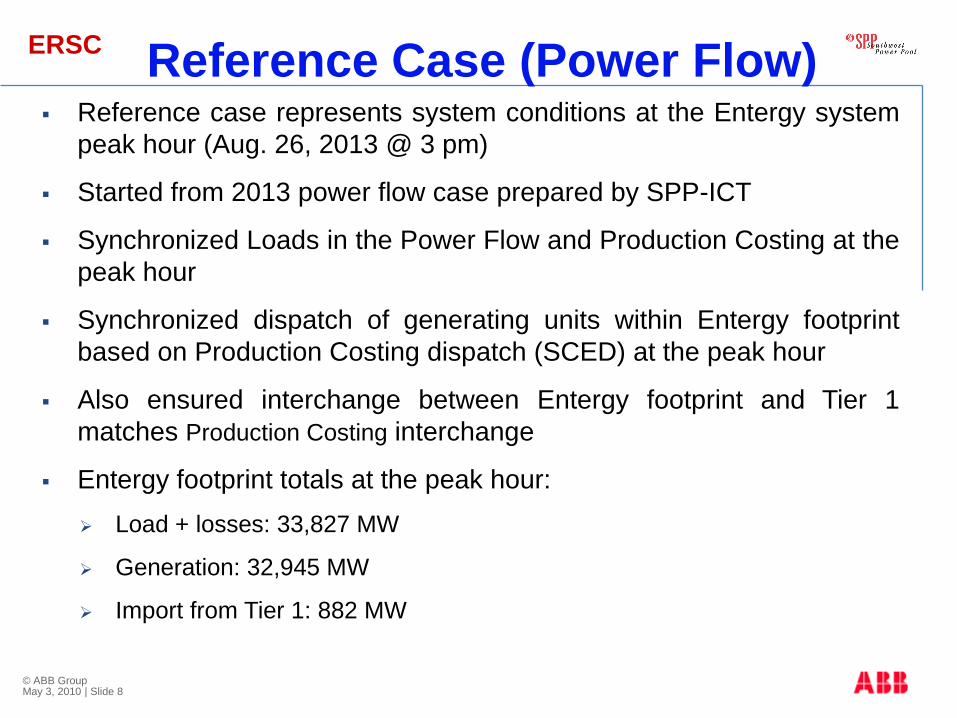
ERSCReference Case (Power Flow)
Reference case represents system conditions at the Entergy system
peak hour (Aug. 26, 2013 @ 3 pm)
Started from 2013 power flow case prepared by SPP-ICT
Synchronized Loads in the Power Flow and Production Costing at the
peak hour
Synchronized dispatch of generating units within Entergy footprint
based on Production Costing dispatch (SCED) at the peak hour
Also ensured interchange between Entergy footprint and Tier 1
matches Production Costing interchange
Entergy footprint totals at the peak hour:
Load + losses: 33,827 MW
Generation: 32,945 MW
Import from Tier 1: 882 MW
© ABB Group May 3, 2010 | Slide 8

ERSC
© ABB Group
August 23,2010 | Slide 9
Reference Case (Power Flow)
© ABB Group May 3, 2010 | Slide 9
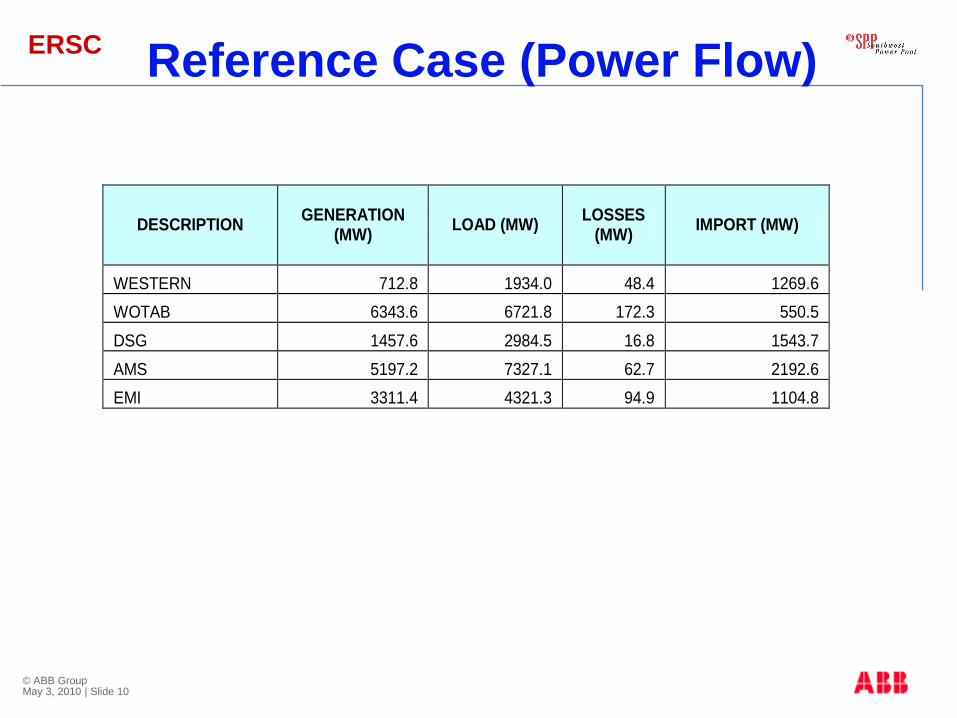
ERSCReference Case (Power Flow)
DESCRIPTION GENERATION
(MW) LOAD (MW)
LOSSES (MW)
IMPORT (MW)
WESTERN 712.8 1934.0 48.4 1269.6
WOTAB 6343.6 6721.8 172.3 550.5
DSG 1457.6 2984.5 16.8 1543.7
AMS 5197.2 7327.1 62.7 2192.6
EMI 3311.4 4321.3 94.9 1104.8
© ABB Group May 3, 2010 | Slide 10
ERSCReference Case Results (Power Flow)
Ran power flow analysis on Reference Case to check steady-
state performance in Entergy footprint for following conditions:
System intact
N-1 contingencies
G1N1 contingencies (WOTAB and Amite South)
Power flow results show several post-contingency thermal and
voltage violations in the Entergy footprint
Western Region Violations:
o Several 138 kV facilities became overloaded for two 230
kV Double Contingencies
o Several G1N1 violations
© ABB Group May 3, 2010 | Slide 11

ERSC Reference Case Results (Power Flow): N-1
RATING % LOADING
(MVA) (ON RATE-B)
BUS # NAME KV BUS # NAME KV CKT RATE-B Ref. Case
334023 4NAVSOTA 138 334024 4SOTA 1 138 1 143 334021 4COLSTAJNCT 138 334026 4GRIMES 138 1 106
334026 4GRIMES 138 334040 4WALDEN 138 1 191 230kV Double Contingency 1 102.4
334112 4HICKORY 138 334113 4EASTGAT 138 1 233 230kV Double Contingency 2 112.7
334113 4EASTGAT 138 334115 6L533TP8 138 1 233 230kV Double Contingency 2 121
334115 6L533TP8 138 334210 4ADAYTON 138 1 271 230kV Double Contingency 2 104.5
334120 4NU LJON 138 334211 4BDAYTON 138 1 99 230kV Double Contingency 2 108.2
334151 4MENARD 138 334152 4BRAGG 138 1 233 230kV Double Contingency 1 118.1
334152 4BRAGG 138 334193 4HONEY 138 1 233 230kV Double Contingency 1 118.9
334193 4HONEY 138 334319 4CYPRESS 138 1 239 230kV Double Contingency 1 121.2
334194 4RYE 13 138 334195 4HIGHTWR 138 1 206 230kV Double Contingency 1 123.1
334194 4RYE 13 138 334319 4CYPRESS 138 1 206 230kV Double Contingency 1 126.8
334195 4HIGHTWR 138 334208 4JACINTO 138 1 206 230kV Double Contingency 1 116.2
334214 4DEVERS 138 334215 4CHINA 138 1 216 230kV Double Contingency 2 101.3
334218 5L541T43 138 334219 4SHILOH 138 1 109 230kV Double Contingency 1 100.6
334219 4SHILOH 138 334220 4BRKSCRK 138 1 109 230kV Double Contingency 1 105.5
334220 4BRKSCRK 138 334221 4BAYSHOR 138 1 109 230kV Double Contingency 1 107.3
334226 4BYUFARM 138 334227 4BIGHILL 138 1 151 230kV Double Contingency 1 102.1
334226 4BYUFARM 138 334228 4MEMORIL 138 1 151 230kV Double Contingency 1 104.3
334228 4MEMORIL 138 334412 4MID CO 138 1 151 230kV Double Contingency 1 108.5
MONITORED ELEMENT
CONTINGENCY
FROM BUS TO BUS
© ABB Group May 3, 2010 | Slide 12

ERSCReference Case Results (Power Flow): G1N1 Wotab
RATING % LOADING
(MVA) (ON RATE-B)
BUS # NAME KV BUS # NAME KV CKT RATE-B
303202 3GRENWD 115 336033 3TEREBN 115 1 229 21180 106.5
334023 4NAVSOTA 138 334024 4SOTA 1 138 1 143 140 119.1
334026 4GRIMES 138 334028 7GRIMES 345 1 525 1805 102.9
334026 4GRIMES 138 334028 7GRIMES 345 2 525 1800 102.9
334026 4GRIMES 138 334040 4WALDEN 138 1 191 11025 101.1
334026 4GRIMES 138 334060 4MT.ZION 138 1 206 11860 107.4
334043 4TUBULAR 138 334044 4DOBBIN 138 1 112 30793 103.1
334319 4CYPRESS 138 334320 8CYPRESS 500 1 750 12735 114.8
334333 4NEWTONB 138 334334 4LEACH 138 1 141 11860 105.3
334334 4LEACH 138 334335 4TOLEDO 138 1 134 11860 113.2
334413 4PNEC BK 138 334430 4SABINE 138 1 288 12100 104.8
334414 4LINDE 138 334430 4SABINE 138 1 288 12095 101.1
MONITORED ELEMENT
CONTINGENCYFROM BUS TO BUS
© ABB Group May 3, 2010 | Slide 13

ERSCReference Case Results (Power Flow): G1N1 AMS
RATING % LOADING
(MVA) (ON RATE-B)
BUS # NAME KV BUS # NAME KV CKT RATE-B
336037 3VLNTIN 115 336080 3CLOVEL 115 1 115 4140 101.9
336525 3SMTHD* 115 336526 3ARLGTN# 115 1 120 5905 100.5
335569 6POLSCAR 230 335573 6A.A.C. 230 1 685 4895 105.7
335573 6A.A.C. 230 335574 6LICAR 230 1 685 4895 105.1
335574 6LICAR 230 335575 6BELL HE 230 1 685 4895 102.7
336069 6TEZCUCO 230 336154 6WATFRD 230 1 641 4140 100.8
MONITORED ELEMENT
CONTINGENCYFROM BUS TO BUS
© ABB Group May 3, 2010 | Slide 14

ERSC Western Region Analysis – Production Costing
The following cases were simulated:
Case Name Definition
West_0 Western study unit- reference case
West_1 Nomogram(s) off
West_2 Nomogram(s) off + no Western area transmission limit
West_3 Nomogram(s) off + Lewis Creek plant turned off
West_4Nomogram(s) off + Lewis Creek plant turned off + no Western area transmission limit
West_5 Same as West 3 with Trans Solution 1
West_6 Same as West 3 with Trans Solution 2
© ABB Group May 3, 2010 | Slide 15

ERSC Western Region Analysis – Production Costing
Production costing and power flow analysis performed in parallel
Western Region generation dispatch (MW) and import (MW) at
Entergy System peak load hour (Aug. 26, 2013 @ 3 pm) are shown
below:
West_0 West_2 West_3 West_4
Total Generation 712 850 451 483
Lewis Creek 468 520 0 0
Frontier 245 330 281 330
Pelican Road 0 0 170 153
Import into Western 1270 1125 1546 1513
© ABB Group May 3, 2010 | Slide 16

ERSC
Changes in Entergy’s footprint production cost and import cost
Without Crockett – Grimes 345 kV hourly flow limit as in West_0 case
Western Region Analysis – Production Costing
Sensitivity Runs
© ABB Group May 3, 2010 | Slide 17
Case Name
Production Cost
Change (M$)
Import Cost
Change (M$)
Adjusted
Production Cost
Change (M$)
West_0 0 0 0
West_1 0 0 0
West_2 -39 30 -10
West_3 2 -5 -2
West_4 -55 52 -3
West_5 -1 0 -1
West_6 -2 -1 -3

ERSC
Lewis Creek plant annual dispatch change
Without Crockett – Grimes 345 kV hourly flow limit as in West_0
case
Western Region Analysis – Production Costing
Sensitivity Runs
Case Name Annual Summary
Lewis Creek
Total Plant
Annual Production (MWh) 0
Number of Hours Dispatched
Annual Production (MWh) -28,826
Number of Hours Dispatched
Annual Production (MWh) -476,089
Number of Hours Dispatched
West_0
West_1
West_2
© ABB Group May 3, 2010 | Slide 18
-3,443
-234
ERSC Western Region Analysis – Power Flow
West_1 Case
When applicable nomograms are turned off (Case West_1), generation
dispatch is identical to that in the Reference Case (West_0 with
nomograms on) at the peak load hour
Hence, there was no need to repeat power flow for the West_1 Case
West_2 Case
Same as West_1 case with no Western area transmission limits and no
limits on tie-lines between Western & WOTAB in production costing
analysis
Similar steady-state performance compared to West_0 case
© ABB Group May 3, 2010 | Slide 19

ERSC
West_3 Case
The same as West_0 with Lewis Creek plant turned off
Further degradation in steady-state performance compared to West_0
and West_2 cases
Voltage collapse for the double contingencies
Also voltage collapse for several G1N1 contingencies
Voltage collapse is due to erosion of reactive capability in Western
Region
Western Region Analysis – Power Flow
© ABB Group May 3, 2010 | Slide 20
ERSC
West_4 Case
Same as West_3 with no Western area transmission
limits and no limits on tie-lines between Western &
WOTAB in production costing analysis
Voltage collapse for the same double contingencies
as in West_3
Also, voltage collapse for several G1N1 contingencies
Western Region Analysis – Power Flow
© ABB Group May 3, 2010 | Slide 21
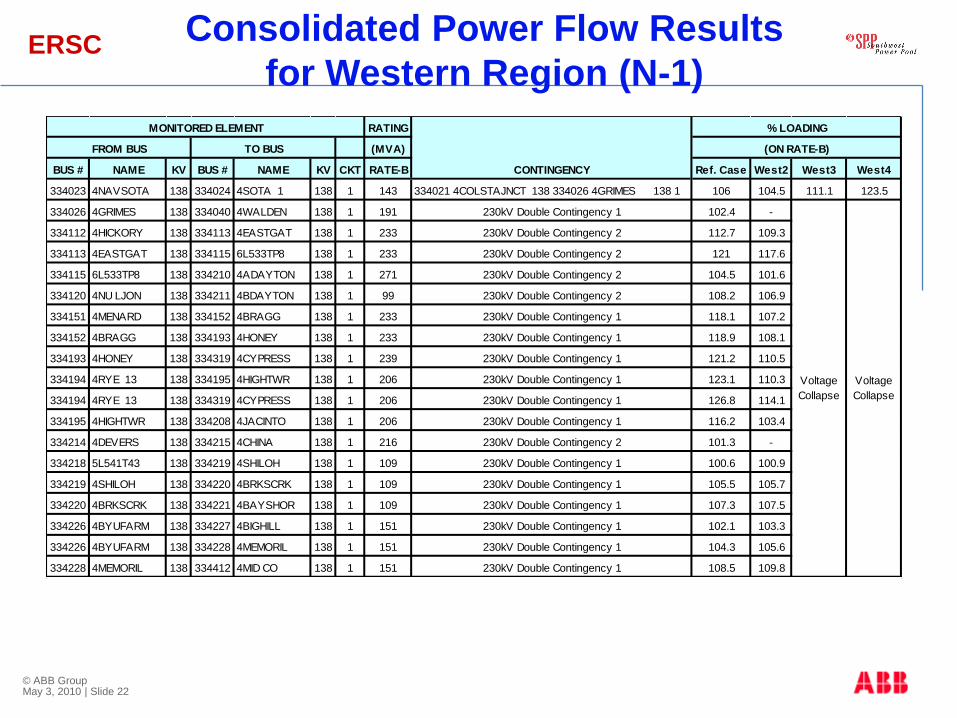
ERSCConsolidated Power Flow Results
for Western Region (N-1)
RATING
(MVA)
BUS # NAME KV BUS # NAME KV CKT RATE-B Ref. Case West2 West3 West4
334023 4NAVSOTA 138 334024 4SOTA 1 138 1 143 334021 4COLSTAJNCT 138 334026 4GRIMES 138 1 106 104.5 111.1 123.5
334026 4GRIMES 138 334040 4WALDEN 138 1 191 230kV Double Contingency 1 102.4 -
334112 4HICKORY 138 334113 4EASTGAT 138 1 233 230kV Double Contingency 2 112.7 109.3
334113 4EASTGAT 138 334115 6L533TP8 138 1 233 230kV Double Contingency 2 121 117.6
334115 6L533TP8 138 334210 4ADAYTON 138 1 271 230kV Double Contingency 2 104.5 101.6
334120 4NU LJON 138 334211 4BDAYTON 138 1 99 230kV Double Contingency 2 108.2 106.9
334151 4MENARD 138 334152 4BRAGG 138 1 233 230kV Double Contingency 1 118.1 107.2
334152 4BRAGG 138 334193 4HONEY 138 1 233 230kV Double Contingency 1 118.9 108.1
334193 4HONEY 138 334319 4CYPRESS 138 1 239 230kV Double Contingency 1 121.2 110.5
334194 4RYE 13 138 334195 4HIGHTWR 138 1 206 230kV Double Contingency 1 123.1 110.3
334194 4RYE 13 138 334319 4CYPRESS 138 1 206 230kV Double Contingency 1 126.8 114.1
334195 4HIGHTWR 138 334208 4JACINTO 138 1 206 230kV Double Contingency 1 116.2 103.4
334214 4DEVERS 138 334215 4CHINA 138 1 216 230kV Double Contingency 2 101.3 -
334218 5L541T43 138 334219 4SHILOH 138 1 109 230kV Double Contingency 1 100.6 100.9
334219 4SHILOH 138 334220 4BRKSCRK 138 1 109 230kV Double Contingency 1 105.5 105.7
334220 4BRKSCRK 138 334221 4BAYSHOR 138 1 109 230kV Double Contingency 1 107.3 107.5
334226 4BYUFARM 138 334227 4BIGHILL 138 1 151 230kV Double Contingency 1 102.1 103.3
334226 4BYUFARM 138 334228 4MEMORIL 138 1 151 230kV Double Contingency 1 104.3 105.6
334228 4MEMORIL 138 334412 4MID CO 138 1 151 230kV Double Contingency 1 108.5 109.8
Voltage
Collapse
Voltage
Collapse
MONITORED ELEMENT
CONTINGENCY
% LOADING
FROM BUS TO BUS (ON RATE-B)
© ABB Group May 3, 2010 | Slide 22
ERSCWestern Region Study Summary
Lewis Creek plant lower cost displacement generation
was limited due to transmission constraints
Additional analysis (production costing and power flow)
required to determine :
The production cost savings by replacing Lewis Creek
units with more economical generation from elsewhere
in the Entergy Foot print
New transmission to ensure reliability criteria is met
when with such replacement
© ABB Group May 3, 2010 | Slide 23

ERSC Transmission Solution(s) for Western Region
Option 1: New, Cypress to Jacinto 230 kV + Jacinto to Porter 230 kV
Option 2: New, Cypress to Lewis Creek 230 kV + Lewis Creek to Porter 230 kV
© ABB Group May 3, 2010 | Slide 24

ERSC
Step-1: Obtain economic dispatch without the Lewis
Creek units (transmission limits within and into Western
Region relaxed in GridView)
Step–2: Apply the dispatch from Step–1 to power flow;
Perform N-1, G-1_N-1 (preliminary evaluation)
Step–3: Re-run production cost with the transmission
solution from Step-2; however now all the relevant
transmission constraints enforced in GridView.
Step–4: Re-run power case, N-1 and G-1_N-1 with
dispatch from Step–3; ensure reliability criteria are met
Transmission Solution(s) for Western Region
© ABB Group May 3, 2010 | Slide 25
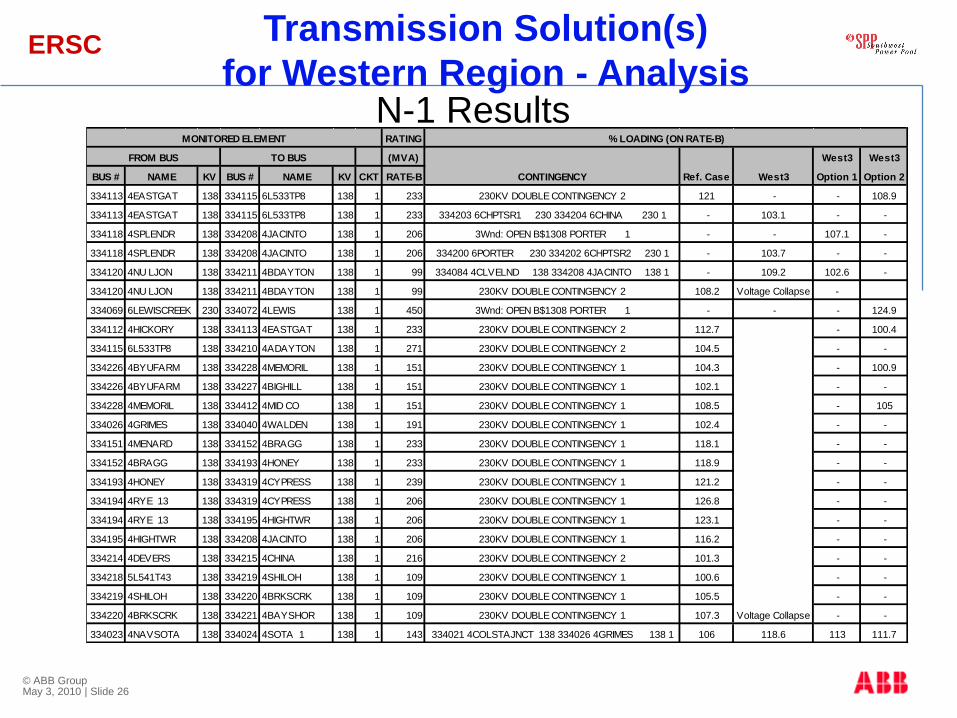
ERSCTransmission Solution(s)
for Western Region - AnalysisN-1 Results
RATING
(MVA) West3 West3
BUS # NAME KV BUS # NAME KV CKT RATE-B Option 1 Option 2
334113 4EASTGAT 138 334115 6L533TP8 138 1 233 230KV DOUBLE CONTINGENCY 2 121 - - 108.9
334113 4EASTGAT 138 334115 6L533TP8 138 1 233 334203 6CHPTSR1 230 334204 6CHINA 230 1 - 103.1 - -
334118 4SPLENDR 138 334208 4JACINTO 138 1 206 3Wnd: OPEN B$1308 PORTER 1 - - 107.1 -
334118 4SPLENDR 138 334208 4JACINTO 138 1 206 334200 6PORTER 230 334202 6CHPTSR2 230 1 - 103.7 - -
334120 4NU LJON 138 334211 4BDAYTON 138 1 99 334084 4CLVELND 138 334208 4JACINTO 138 1 - 109.2 102.6 -
334120 4NU LJON 138 334211 4BDAYTON 138 1 99 230KV DOUBLE CONTINGENCY 2 108.2 Voltage Collapse -
334069 6LEWISCREEK 230 334072 4LEWIS 138 1 450 3Wnd: OPEN B$1308 PORTER 1 - - - 124.9
334112 4HICKORY 138 334113 4EASTGAT 138 1 233 230KV DOUBLE CONTINGENCY 2 112.7 - 100.4
334115 6L533TP8 138 334210 4ADAYTON 138 1 271 230KV DOUBLE CONTINGENCY 2 104.5 - -
334226 4BYUFARM 138 334228 4MEMORIL 138 1 151 230KV DOUBLE CONTINGENCY 1 104.3 - 100.9
334226 4BYUFARM 138 334227 4BIGHILL 138 1 151 230KV DOUBLE CONTINGENCY 1 102.1 - -
334228 4MEMORIL 138 334412 4MID CO 138 1 151 230KV DOUBLE CONTINGENCY 1 108.5 - 105
334026 4GRIMES 138 334040 4WALDEN 138 1 191 230KV DOUBLE CONTINGENCY 1 102.4 - -
334151 4MENARD 138 334152 4BRAGG 138 1 233 230KV DOUBLE CONTINGENCY 1 118.1 - -
334152 4BRAGG 138 334193 4HONEY 138 1 233 230KV DOUBLE CONTINGENCY 1 118.9 - -
334193 4HONEY 138 334319 4CYPRESS 138 1 239 230KV DOUBLE CONTINGENCY 1 121.2 - -
334194 4RYE 13 138 334319 4CYPRESS 138 1 206 230KV DOUBLE CONTINGENCY 1 126.8 - -
334194 4RYE 13 138 334195 4HIGHTWR 138 1 206 230KV DOUBLE CONTINGENCY 1 123.1 - -
334195 4HIGHTWR 138 334208 4JACINTO 138 1 206 230KV DOUBLE CONTINGENCY 1 116.2 - -
334214 4DEVERS 138 334215 4CHINA 138 1 216 230KV DOUBLE CONTINGENCY 2 101.3 - -
334218 5L541T43 138 334219 4SHILOH 138 1 109 230KV DOUBLE CONTINGENCY 1 100.6 - -
334219 4SHILOH 138 334220 4BRKSCRK 138 1 109 230KV DOUBLE CONTINGENCY 1 105.5 - -
334220 4BRKSCRK 138 334221 4BAYSHOR 138 1 109 230KV DOUBLE CONTINGENCY 1 107.3 - -
334023 4NAVSOTA 138 334024 4SOTA 1 138 1 143 334021 4COLSTAJNCT 138 334026 4GRIMES 138 1 106 118.6 113 111.7
Voltage Collapse
MONITORED ELEMENT % LOADING (ON RATE-B)
FROM BUS TO BUS
CONTINGENCY Ref. Case West3
© ABB Group May 3, 2010 | Slide 26

ERSC
G-1_N-1
Transmission Solution(s)
for Western Region – Analysis (Cont’d)
RATING
(MVA) West3 West3
BUS # NAME KV BUS # NAME KV CKT RATE-B Option 1 Option 2
334113 4EASTGAT 138 334115 6L533TP8 138 1 233 28935 - 105.7 - -
334113 4EASTGAT 138 334115 6L533TP8 138 1 233 32557 - - 102.9 -
334118 4SPLENDR 138 334208 4JACINTO 138 1 206 32557 - - 117.3 -
334118 4SPLENDR 138 334208 4JACINTO 138 1 206 710 - 103.7 - -
334120 4NU LJON 138 334211 4BDAYTON 138 1 99 30877 - 118.6 110.5 101.2
334069 6LEWISCREEK 230 334072 4LEWIS 138 1 450 32557 - - 105.9 140.5
334117 4APOLLO 138 334118 4SPLENDR 138 1 206 32557 - - 103.7 -
334119 4TARKING 138 334120 4NU LJON 138 1 99 30877 - 104.2 - -
334193 4HONEY 138 334319 4CYPRESS 138 1 239 31261 - 105.6 - -
334152 4BRAGG 138 334193 4HONEY 138 1 233 31261 - 103 - -
334151 4MENARD 138 334152 4BRAGG 138 1 233 31261 - 102.1 - -
334069 6LEWISCREEK 230 334085 6PEACHCREEK 230 1 501 32557 - - 101.4 -
334085 6PEACHCREEK 230 334206 6JACINTO 230 1 501 32557 - - 103.6 -
334320 8CYPRESS 500 334326 6CYPRESS 230 1 750 12720 - - 112.1 103.5
334319 4CYPRESS 138 334320 8CYPRESS 500 1 750 12735 114.8 104.2 113.2 107.1
334326 6CYPRESS 230 334328 6BEVIL 230 1 685 12740 - 104 - -
334229 4COLEYCREEK 138 334231 4PELCNRD 138 1 206 31207 - - 101.1 -
334204 6CHINA 230 334434 6SABINE 230 1 685 31261 - 110.7 - -
334204 6CHINA 230 334327 6AMELIA 230 1 797 31267 - 107.3 - -
334327 6AMELIA 230 334328 6BEVIL 230 1 685 11975 - 100.3 - -
334360 6HELBIG 230 334361 6MCLEWIS 230 1 681 11860 - 107.6 106 105.9
335070 6CARLYSS 230 335190 6NLSON 230 1 405 12320 - 106.9 - -
335070 6CARLYSS 230 335073 6BOUDIN 230 1 405 21735 - 101.1 101.6 -
335072 6ROSEBF 230 335136 6PPG 23 230 1 470 12315 - 109.9 - 102.1
MONITORED ELEMENT % LOADING (ON RATE-B)
FROM BUS TO BUS
CONTINGENCY Ref. Case West3
© ABB Group May 3, 2010 | Slide 27
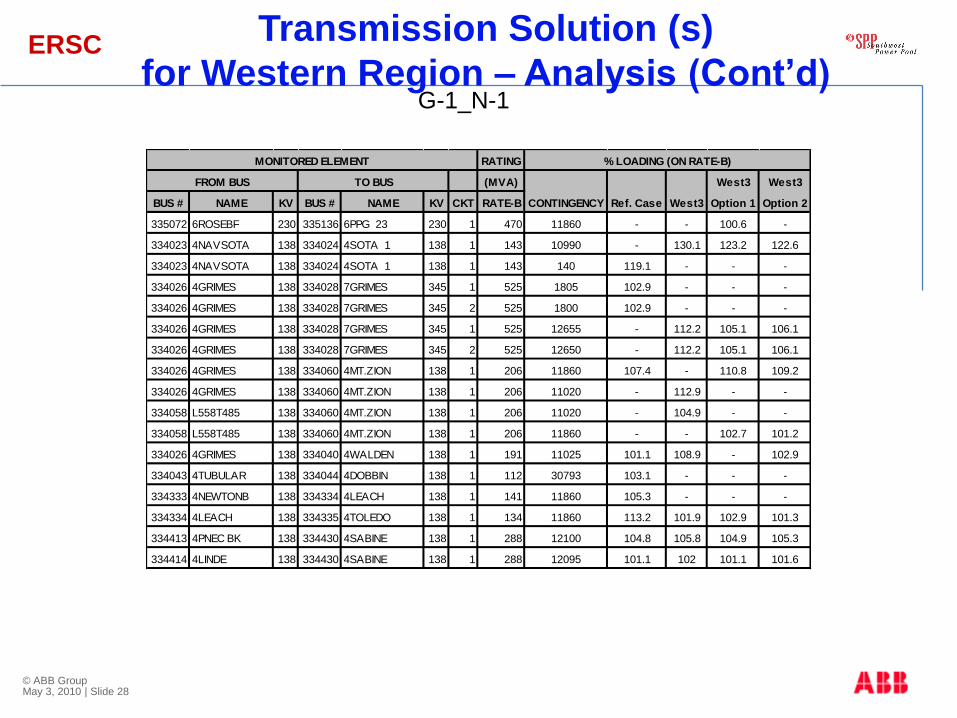
ERSC
G-1_N-1
Transmission Solution (s)
for Western Region – Analysis (Cont’d)
RATING
(MVA) West3 West3
BUS # NAME KV BUS # NAME KV CKT RATE-B Option 1 Option 2
335072 6ROSEBF 230 335136 6PPG 23 230 1 470 11860 - - 100.6 -
334023 4NAVSOTA 138 334024 4SOTA 1 138 1 143 10990 - 130.1 123.2 122.6
334023 4NAVSOTA 138 334024 4SOTA 1 138 1 143 140 119.1 - - -
334026 4GRIMES 138 334028 7GRIMES 345 1 525 1805 102.9 - - -
334026 4GRIMES 138 334028 7GRIMES 345 2 525 1800 102.9 - - -
334026 4GRIMES 138 334028 7GRIMES 345 1 525 12655 - 112.2 105.1 106.1
334026 4GRIMES 138 334028 7GRIMES 345 2 525 12650 - 112.2 105.1 106.1
334026 4GRIMES 138 334060 4MT.ZION 138 1 206 11860 107.4 - 110.8 109.2
334026 4GRIMES 138 334060 4MT.ZION 138 1 206 11020 - 112.9 - -
334058 L558T485 138 334060 4MT.ZION 138 1 206 11020 - 104.9 - -
334058 L558T485 138 334060 4MT.ZION 138 1 206 11860 - - 102.7 101.2
334026 4GRIMES 138 334040 4WALDEN 138 1 191 11025 101.1 108.9 - 102.9
334043 4TUBULAR 138 334044 4DOBBIN 138 1 112 30793 103.1 - - -
334333 4NEWTONB 138 334334 4LEACH 138 1 141 11860 105.3 - - -
334334 4LEACH 138 334335 4TOLEDO 138 1 134 11860 113.2 101.9 102.9 101.3
334413 4PNEC BK 138 334430 4SABINE 138 1 288 12100 104.8 105.8 104.9 105.3
334414 4LINDE 138 334430 4SABINE 138 1 288 12095 101.1 102 101.1 101.6
MONITORED ELEMENT % LOADING (ON RATE-B)
FROM BUS TO BUS
CONTINGENCY Ref. Case West3
© ABB Group May 3, 2010 | Slide 28

ERSC
WOTAB Region Analysis
© ABB Group May 3, 2010 | Slide 29

ERSC WOTAB Region Analysis The following cases were simulated:
Case Name Sudy
Units
Nomograms Transmission
Limits
Definition
WOTAB_0 Available ON ON WOTAB - reference case
WOTAB_1 Available OFF ON Same as WOTAB_0 with nomogram rules turned off
WOTAB_2 Available OFF OFF No WOTAB & Western area transmission limits
Nomogram(s) off
WOTAB_3 OFF OFF ON Nomograms(s) off
Sabine 1-5, Nelson 3&4, Lewis Creek 1&2 turned off
WOTAB_4 OFF OFF OFF Nomograms(s) off
Sabine 1-5, Nelson 3&4, Lewis Creek 1&2 turned off
No WOTAB & Western area transmission limits
© ABB Group May 3, 2010 | Slide 30

ERSCWOTAB Region Analysis (Cont’d)
Study Units and Dispatch
Ref. Case WOTAB1 WOTAB2 WOTAB3 WOTAB4
G1LEWIS_1 234 234 0 0 0
G2LEWIS_1 234 234 0 0 0
G4NELSON_1 200 0 0 0 0
G1SABIN_1 158.8 158.8 0 0 0
G2SABIN_1 126.88 126.88 0 0 0
G3SABIN_1 204.05 232 420 0 0
G4SABIN_1 477 477 530 0 0
G5SABIN_1 199.04 252.14 0 0 0
Dispatch (MW)
Generating Unit
© ABB Group May 3, 2010 | Slide 31

ERSC Results for WOTAB Region –
Production Costing
Changes in Entergy’s footprint production cost and import cost
Without Crockett – Grimes 345 kV hourly flow limit as in
WOTAB_0 case
© ABB Group May 3, 2010 | Slide 32
Case Name
Production Cost Change
(M$)
Import Cost
Change (M$)
Adjusted
Production Cost
Change (M$)
Wotab_0 0 0 0
Wotab_1 -4 2 -3
Wotab_2 -102 26 -75
Wotab_3 68 99 167
Wotab_4 -127 33 -95

ERSC
Lewis Creek plant annual dispatch change
Without Crockett – Grimes 345 kV hourly flow limit as in
WOTAB_0 case
Results for WOTAB Region –
Production Costing
Case Name Annual Summary
Lewis Creek
Total Plant
Annual Production (MWh) 0
Number of Hours Dispatched
Annual Production (MWh) -20,999
Number of Hours Dispatched
Annual Production (MWh) -938,277
Number of Hours Dispatched
WOTAB_0
WOTAB_1
WOTAB_2
© ABB Group May 3, 2010 | Slide 33
0
-303
-7,907
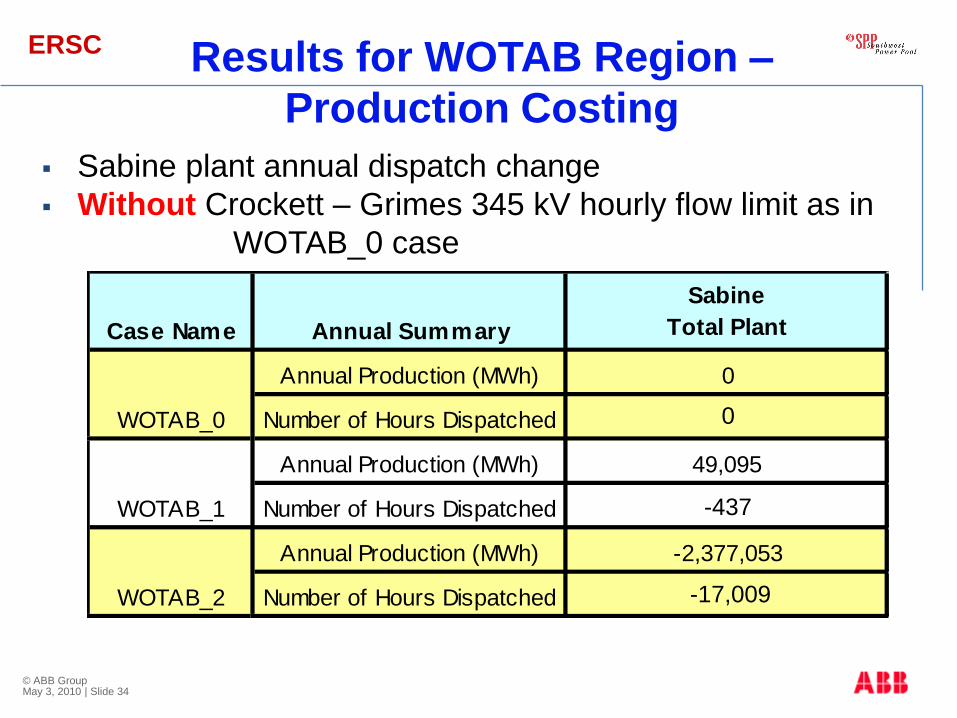
ERSC Results for WOTAB Region –
Production Costing
Sabine plant annual dispatch change
Without Crockett – Grimes 345 kV hourly flow limit as in
WOTAB_0 case
Case Name Annual Summary
Sabine
Total Plant
Annual Production (MWh) 0
Number of Hours Dispatched
Annual Production (MWh) 49,095
Number of Hours Dispatched
Annual Production (MWh) -2,377,053
Number of Hours Dispatched
WOTAB_1
WOTAB_2
WOTAB_0
© ABB Group May 3, 2010 | Slide 34
0
-437
-17,009
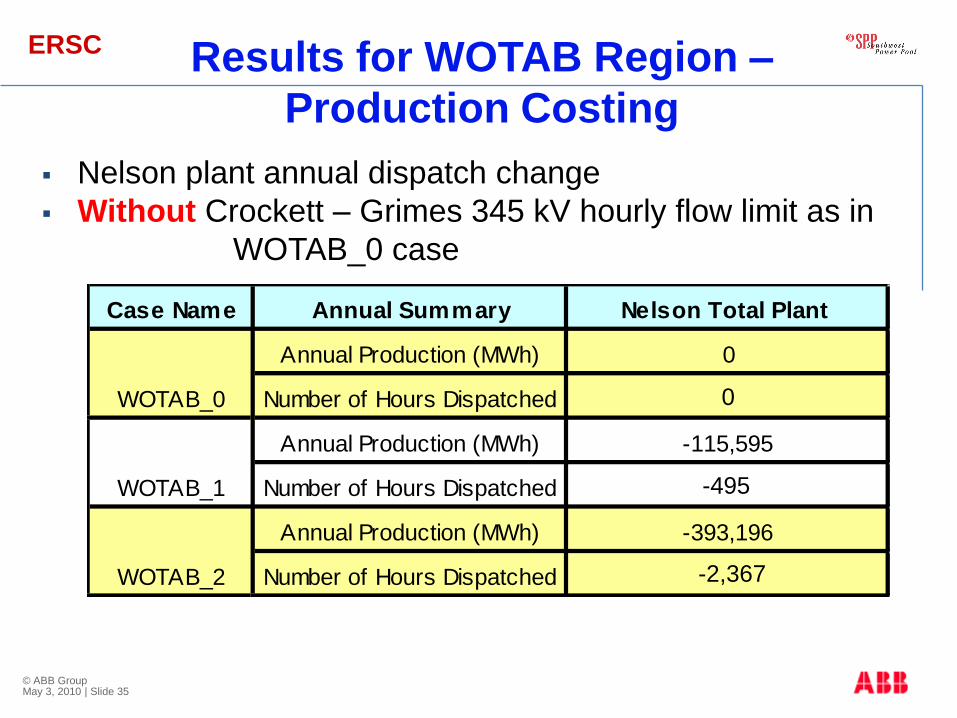
ERSC
Nelson plant annual dispatch change
Without Crockett – Grimes 345 kV hourly flow limit as in
WOTAB_0 case
Results for WOTAB Region –
Production Costing
Case Name Annual Summary Nelson Total Plant
Annual Production (MWh) 0
Number of Hours Dispatched
Annual Production (MWh) -115,595
Number of Hours Dispatched
Annual Production (MWh) -393,196
Number of Hours Dispatched
WOTAB_0
WOTAB_1
WOTAB_2
© ABB Group May 3, 2010 | Slide 35
0
-495
-2,367
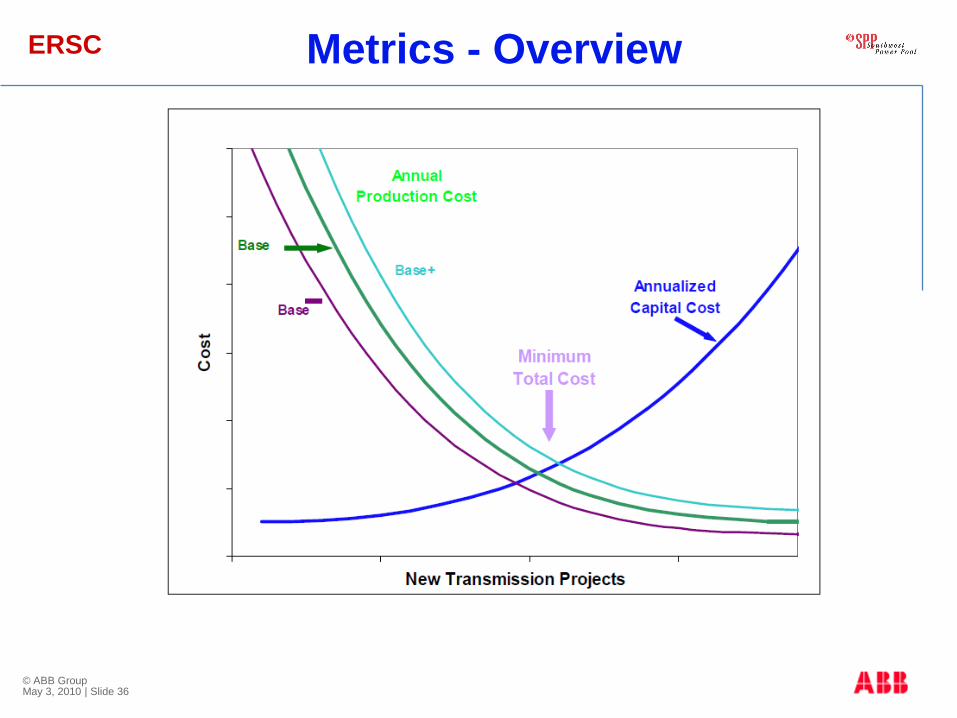
ERSC Metrics - Overview
© ABB Group May 3, 2010 | Slide 36

ERSC
Based on one year and extrapolate to other
years, as necessary
Entergy Footprint’s Adjusted Production Cost =
Entergy Footprint’s units production cost
+ import cost
Import Cost =
hourly import flow * area simple average LMP
(?)
Adjusted Production Cost
© ABB Group May 3, 2010 | Slide 37

ERSC
Capital Cost for Transmission Projects – C1,C2,….
Annual Fixed Charge Rate(s) – F1, F2,….
Total Annual Transmission Cost = Ci*Fi
Annual Transmission Cost
© ABB Group May 3, 2010 | Slide 38
ERSC
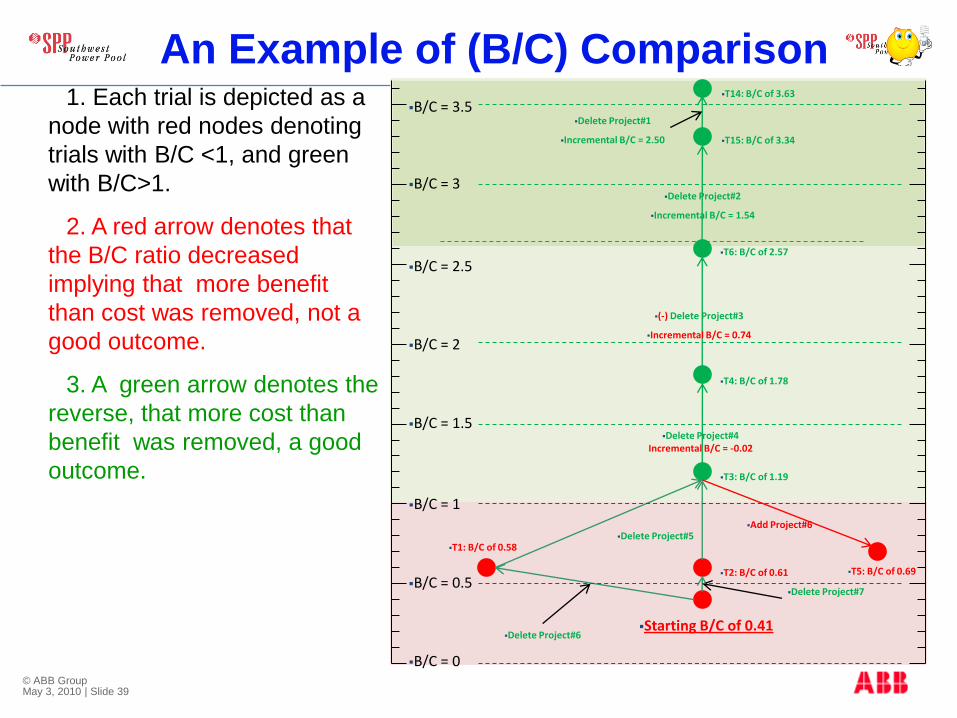
B/C = 0
B/C = 0.5
B/C = 1
B/C = 1.5
B/C = 2
B/C = 2.5
B/C = 3
B/C = 3.5
Starting B/C of 0.41
T2: B/C of 0.61
T1: B/C of 0.58
T5: B/C of 0.69
T3: B/C of 1.19
T4: B/C of 1.78
T6: B/C of 2.57
T14: B/C of 3.63
Add Project#6
Delete Project#7
Delete Project#5
Delete Project#6
Delete Project#4Incremental B/C = -0.02
(-) Delete Project#3
Incremental B/C = 0.74
Delete Project#2
Incremental B/C = 1.54
Delete Project#1
Incremental B/C = 2.50 T15: B/C of 3.34
1. Each trial is depicted as a
node with red nodes denoting
trials with B/C <1, and green
with B/C>1.
2. A red arrow denotes that
the B/C ratio decreased
implying that more benefit
than cost was removed, not a
good outcome.
3. A green arrow denotes the
reverse, that more cost than
benefit was removed, a good
outcome.
An Example of (B/C) Comparison
© ABB Group May 3, 2010 | Slide 39
ERSC
Perform 2022 evaluations for Western and fine tune transmission solution
Develop and Test Transmission Solution(s) for WOTAB
Proceed with Study for DSG and Amite South (2013)
Study WOTAB, DSG and Amite South for year 2022
Next Steps
© ABB Group May 3, 2010 | Slide 40

ERSC Q & A
Thank you!
© ABB Group May 3, 2010 | Slide 41