mcp graphical abstracts—guidelines
TRANSCRIPT

MCP GRAPHICAL ABSTRACTS—GUIDELINES The graphical abstract is an image that is displayed on the first page of the article PDF, along with “In Brief” and “Highlights.” It will also be prominently displayed online on the MCP website in both the Table of Contents and the article page view. The graphical abstract is intended to be the first landing page for readers to give them an immediate impression of the primary message of the paper. It is designed to help readers easily identify papers that are most relevant to their research interests. Technical Requirements Size: The submitted image should be square in size with a minimum of 996 × 996 pixels (h × w) at 300 dpi or 1659 × 1659 pixels (h × w) at 500 dpi. Font: Arial, 12–16 points. Smaller fonts will not be legible. Preferred file types: TIFF, EPS, PDF or MS Office files. Content: The graphical abstract should consist of one single panel; you may reuse elements from figures in the paper. The graphical abstract should: • Consist of one single panel diagram • Preferably be a new figure not included in the paper itself; we would accept an adapted
figure from the paper as long as it captures all the salient points of a graphical abstract • Have a clear direction, start and end, “reading” from top-to-bottom or left-to-right • Provide a visual indication of the biological context of the results depicted (subcellular
location, tissue or cell type, species, etc.) • Emphasize the new findings from the current paper without including excess details from
previous literature • Avoid the inclusion of features that are more speculative (unless the speculative nature can
be made apparent visually) • Not include data items of any type; all the content should be in a graphical form • Use simple labels • Keep text to a minimum • Highlight one process or make one point clear • Be free of distracting and cluttering elements • Use colors effectively to enhance the graphical abstract both aesthetically and by directing
the reader’s attention to focal points of interest Please see examples of what we deem as good graphical abstracts in the following pages. References
1. Burlingame, A.L., Carr, S.A., Gingras, A.C. (2018) Gaining an easy visual grasp on MCP content. Mol. Cell Proteomics 17, 1259-1260

RESEARCH
Quantitative Proteomics Links the LRRC59Interactome to mRNA Translation on the ERMembraneAuthorsMolly M. Hannigan, Alyson M. Hoffman, J. Will Thompson, Tianli Zheng, and Christopher V. Nicchitta
In Brief
Hannigan et al. characterize theprotein interactomes of fourcandidate ER ribosome-bindingproteins, providing evidencethat ER-bound ribosomes re-side in distinct molecular envi-ronments. Their data linkSEC62 to ER redox regulationand chaperone trafficking, andsuggest a new role for LRRC59in the regulation of mRNAtranslation.
Graphical Abstract
Highlights
� Identification of subcellular protein interactomes via proximity labeling and quantitative multiplexedproteomics.
� SEC61b and RPN1 interactomes overlap with translocon-associated protein networks.� SEC62 interacts with redox-linked proteins and ER luminal chaperones.� LRRC59 directly interacts with mRNA translation factors and SRP machinery on the ER.
Hannigan et al., 2020, Mol Cell Proteomics 19(11), 1826–1849November 2020 © 2020 Hannigan et al. Published under exclusive license by The American Societyfor Biochemistry and Molecular Biology, Inc.https://doi.org/10.1074/mcp.RA120.002228
This is an Open Access article under the CC BY license.
RESEARCH
Radiosensitization byKinase InhibitionRevealed byPhosphoproteomicAnalysis of Pancreatic Cancer CellsAuthorsSvenja Wiechmann, Elena Saupp, Daniela Schilling, Stephanie Heinzlmeir, Günter Schneider,Roland M. Schmid, Stephanie E. Combs, Bernhard Kuster, and Sophie Dobiasch
In Brief
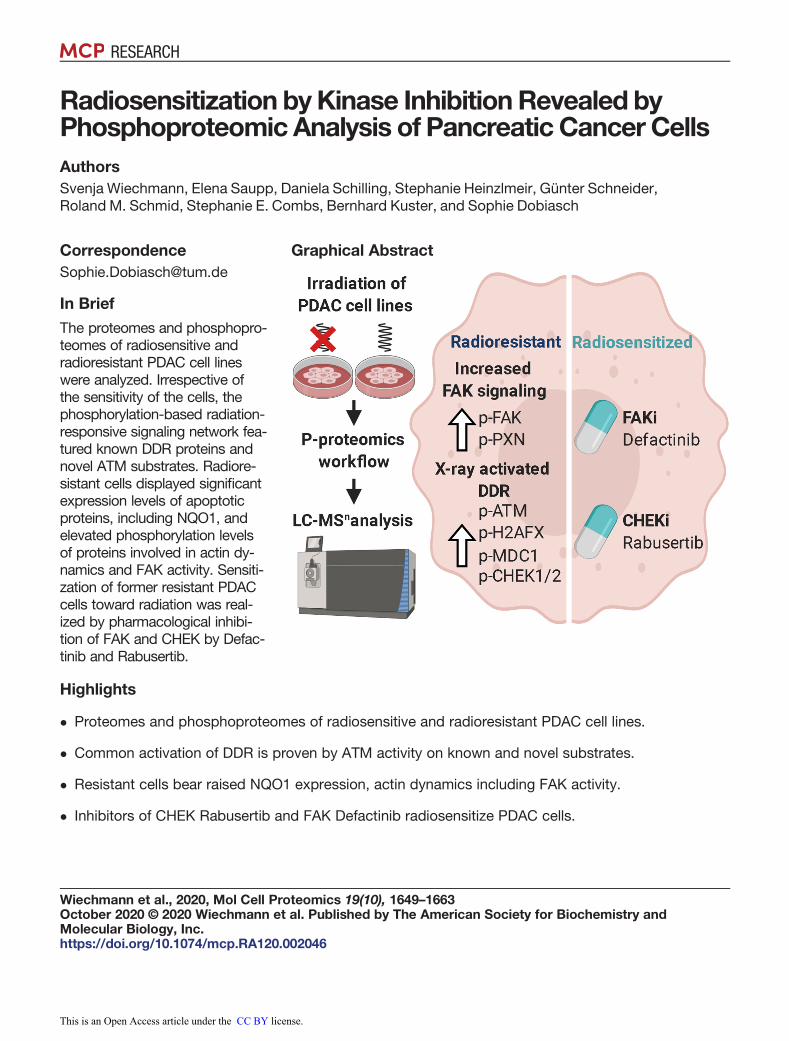
The proteomes and phosphopro-teomes of radiosensitive andradioresistant PDAC cell lineswere analyzed. Irrespective ofthe sensitivity of the cells, thephosphorylation-based radiation-responsive signaling network fea-tured known DDR proteins andnovel ATM substrates. Radiore-sistant cells displayed significantexpression levels of apoptoticproteins, including NQO1, andelevated phosphorylation levelsof proteins involved in actin dy-namics and FAK activity. Sensiti-zation of former resistant PDACcells toward radiation was real-ized by pharmacological inhibi-tion of FAK and CHEK by Defac-tinib and Rabusertib.
Graphical Abstract
Highlights
� Proteomes and phosphoproteomes of radiosensitive and radioresistant PDAC cell lines.
� Common activation of DDR is proven by ATM activity on known and novel substrates.
� Resistant cells bear raised NQO1 expression, actin dynamics including FAK activity.
� Inhibitors of CHEK Rabusertib and FAK Defactinib radiosensitize PDAC cells.
Wiechmann et al., 2020, Mol Cell Proteomics 19(10), 1649–1663October 2020 © 2020 Wiechmann et al. Published by The American Society for Biochemistry andMolecular Biology, Inc.https://doi.org/10.1074/mcp.RA120.002046
This is an Open Access article under the CC BY license.

Multisample Mass Spectrometry-Based Approach forDiscovering Injury Markers in Chronic Kidney DiseaseAuthorsJi Eun Kim, Dohyun Han, Jin Seon Jeong, Jong Joo Moon, Hyun Kyung Moon, Sunhwa Lee,Yong Chul Kim, Kyung Don Yoo, Jae Wook Lee, Dong Ki Kim, Young Joo Kwon, Yon Su Kim, andSeung Hee Yang
Correspondence Graphical [email protected]
In BriefThe key renal-expressedproteins including protein S andgalectin-1 associated with CKDstages were determined byapplying quantitative MS-basedproteomics using multiple typesof samples. The discoveredproteins represent potentialmarkers of chronic kidney injuryrelated to renal hypoxia andcandidate contributors to CKDpathophysiology.
Highlights
• This study aimed to specify chronic kidney injury markers through proteomics
• Ten putative candidate proteins were found to increase with chronic kidney injury
• Galectin-1 and protein S were elevated in glomeruli and tubules after chronic injury
• Galectin-1 also showed an inverse correlation with renal function
2021, Mol Cell Proteomics 20, 100037© 2021 THE AUTHORS. Published by Elsevier Inc on behalf of American Society for Biochemistry andMolecular Biology. This is an open access article under the CC BY license (http://creativecommons.org/licenses/by/4.0/).https://doi.org/10.1074/mcp.RA120.002159
RESEARCH

HIGD2A is Required for Assembly of the COX3Module of Human Mitochondrial Complex IVAuthorsDaniella H. Hock, Boris Reljic, Ching-Seng Ang, Linden Muellner-Wong, Hayley S. Mountford,Alison G. Compton, Michael T. Ryan, David R. Thorburn, and David A. Stroud
In BriefAssembly factors play a criticalrole in the biogenesis of mito-chondrial respiratory chain com-plexes, some of which are pres-ent in large structures known assupercomplexes. Various assem-bly factors have been proposedas required for supercomplexassembly, including HIGD2A. Weused quantitative proteomicsand gene editing to clarify thefunction of human HIGD2A, re-vealing it to be a classical as-sembly factor required for bio-genesis of mitochondrial DNAencoded COX3, a subunit ofcomplex IV.
Graphical Abstract
Highlights
• Quantitative proteomics reveals HIGD2A is required for assembly of the COX3 module.
• Pulse-SILAC demonstrates that HIGD2A is involved in COX3 biogenesis.
• Supercomplexes in HIGD2A knockout cells are depleted of COX3.
• HIGD2A is the first assembly factor identified for the COX3 module of Complex IV.
RESEARCH
Hock et al., 2020, Mol Cell Proteomics 19(7), 1145–1160July 2020 © 2020 Hock et al. Published under exclusive license by The American Society forBiochemistry and Molecular Biology, Inc.https://doi.org/10.1074/mcp.RA120.002076
This is an Open Access article under the CC BY license.

Arginine in C9ORF72 Dipolypeptides MediatesPromiscuous Proteome Binding and Multiple Modesof ToxicityAuthorsMona Radwan, Ching-Seng Ang, Angelique R. Ormsby, Dezerae Cox, James C. Daly, Gavin E. Reid,and Danny M. Hatters
In BriefC9ORF72-associated MotorNeuron Disease patients featureabnormal expression of 5 dipep-tide repeat (DPR) polymers. Wefound the most toxic DPRs, PRand GR, were particularly pro-miscuous binders to endoge-nous proteins. This included ri-bosomal proteins, translationinitiation factors and translationelongation factors. The corre-sponding biological impactswere multipronged and includedstalling of ribosomes duringtranslation, hypomethylation ofendogenous proteins, and thedestabilization of the actin cyto-skeleton. The findings point tonew mechanisms of toxicity indisease caused by arg-richDPRs.
Graphical Abstract
Highlights
• Quantitative proteome interactions with 5 different C9ORF72 dipolypeptides (DPRs).
• The arg-rich DPRs promiscuously bound to the proteome compared with the other DPRs.
• Long repeat lengths of arg-rich DPRs, but not short lengths, stalled ribosomes.
• The arg-rich DPRs also reduced arginine methylation and actin cytoskeleton assembly.
Research
Radwan et al., 2020, Molecular & Cellular Proteomics 19, 640–654April 2020 © 2020 Radwan et al. Published by The American Society for Biochemistry and MolecularBiology, Inc.https://doi.org/10.1074/mcp.RA119.001888
This is an Open Access article under the CC BY license.
TECHNOLOGICAL INNOVATION AND RESOURCES
ReactomeGSA - Efficient Multi-Omics ComparativePathway AnalysisAuthorsJohannes Griss, Guilherme Viteri, Konstantinos Sidiropoulos, Vy Nguyen, Antonio Fabregat, andHenning Hermjakob
[email protected];[email protected]
In Brief
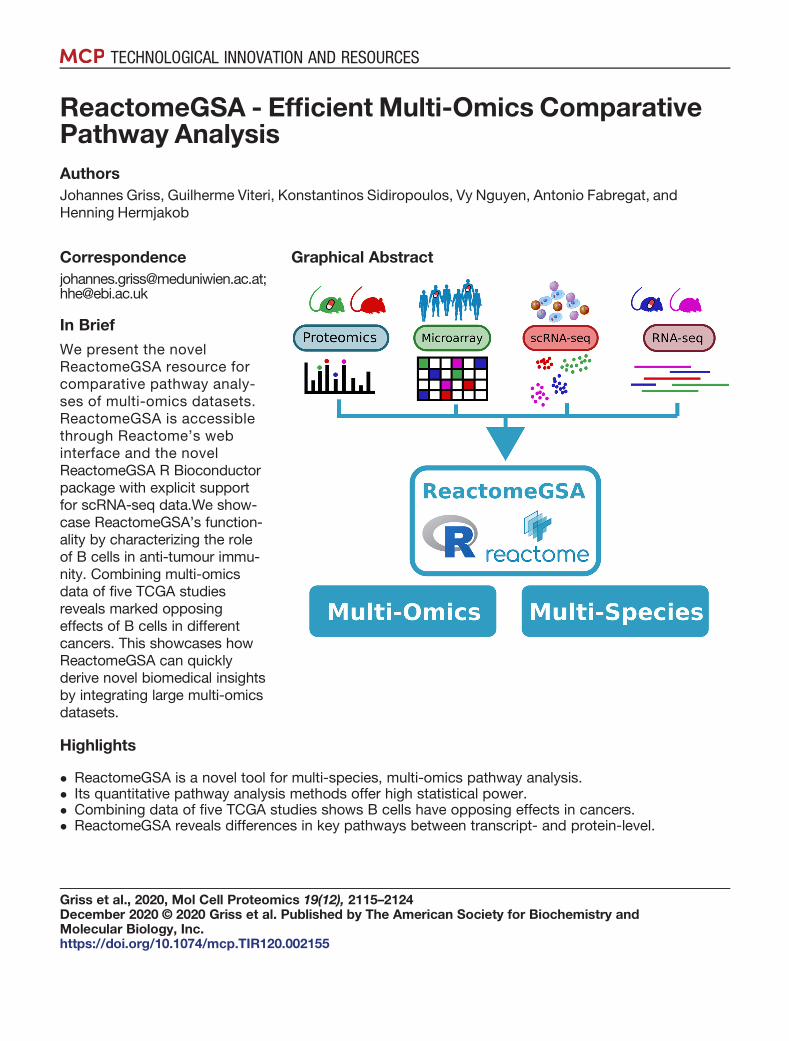
We present the novelReactomeGSA resource forcomparative pathway analy-ses of multi-omics datasets.ReactomeGSA is accessiblethrough Reactome’s webinterface and the novelReactomeGSA R Bioconductorpackage with explicit supportfor scRNA-seq data.We show-case ReactomeGSA’s function-ality by characterizing the roleof B cells in anti-tumour immu-nity. Combining multi-omicsdata of five TCGA studiesreveals marked opposingeffects of B cells in differentcancers. This showcases howReactomeGSA can quicklyderive novel biomedical insightsby integrating large multi-omicsdatasets.
Graphical Abstract
Highlights
� ReactomeGSA is a novel tool for multi-species, multi-omics pathway analysis.� Its quantitative pathway analysis methods offer high statistical power.� Combining data of five TCGA studies shows B cells have opposing effects in cancers.� ReactomeGSA reveals differences in key pathways between transcript- and protein-level.
Griss et al., 2020, Mol Cell Proteomics 19(12), 2115–2124December 2020 © 2020 Griss et al. Published by The American Society for Biochemistry andMolecular Biology, Inc.https://doi.org/10.1074/mcp.TIR120.002155

Fast and Accurate Bacterial Species Identificationin Urine Specimens Using LC-MS/MS MassSpectrometry and Machine LearningAuthorsFlorence Roux-Dalvai, Clarisse Gotti, Mickael Leclercq, Marie-Claude Helie, Maurice Boissinot,Tabiwang N. Arrey, Claire Dauly, Frederic Fournier, Isabelle Kelly, Judith Marcoux,Julie Bestman-Smith, Michel G. Bergeron, and Arnaud Droit
In BriefWe have developed a newmethod for the identification ofbacterial species causing UrinaryTract Infections. The first trainingstep used DIA analysis on multi-ple replicates of bacterial inocu-lates to define a peptide signa-ture by machine learningclassifiers. In a second identifi-cation step, the signature ismonitored by targeted proteom-ics on unknown samples. Thisfast, culture-free and accuratemethod paves the way of thedevelopment of new diagnosticapproaches limiting the emer-gence of antimicrobialresistances.
Graphical Abstract
Highlights
• Fast and culture-free method for the identification of the 15 bacterial species causing UTIs.
• Combination of DIA analysis and machine learning algorithms to define a peptide signature.
• High accuracy, good linearity and reproducibility, sensitivity below standard threshold.
• Transferability to other laboratories and other mass spectrometers.
Technological Innovation and Resources
Roux-Dalvai et al., 2019, Molecular & Cellular Proteomics 18, 2492–2505December 2019 © 2019 Roux-Dalvai et al. Published by The American Society for Biochemistry andMolecular Biology, Inc.https://doi.org/10.1074/mcp.TIR119.001559

REVIEW
Proteomics andMetaproteomics Add Functional,Taxonomic and Biomass Dimensions to Modelingthe Ecosystem at the Mucosal-luminal InterfaceAuthorsLeyuan Li and Daniel Figeys
In Brief
Proteomics and metaproteo-mics are important tools forstudying the spatiotemporalheterogeneous ecosystem inour gut. We review strategiesand their applications to gutecology studies, such as build-ing a dynamical model of theMLI.
Graphical Abstract
Highlights
� The gut mucosal-luminal interface is a spatiotemporal heterogeneous ecosystem.
� Proteomics and metaproteomics are tools to study the host and microbiome functionality.
� Insights into functional diversity, biomass, and matter flow can be obtained.
� Such data can be complementary inputs for building ecology models of the microbiome.
Li and Figeys, 2020, Mol Cell Proteomics 19(9), 1409–1417September 2020 © 2020 Li and Figeys. Published under exclusive license by The American Societyfor Biochemistry and Molecular Biology, Inc.https://doi.org/10.1074/mcp.R120.002051

Proximity Dependent Biotinylation: Key Enzymesand Adaptation to Proteomics ApproachesAuthorsPayman Samavarchi-Tehrani, Reuben Samson, and Anne-Claude Gingras
In BriefProximity-dependent biotinylationapproaches such as BioID andAPEX overcome classical limita-tions of biochemical purificationand have gained widespread usein recent years for revealing cellu-lar neighborhoods. Here we focuson the structural diversity andmechanisms of the two classes ofenzymes, biotin protein ligasesand peroxidases, and discusscurrent and emerging applicationsof these enzymes for proximitydependent biotinylation. We pro-vide guidelines for enzyme selec-tion and experimental design forperforming and interpreting prox-imity-dependent biotinylationexperiments.
Graphical Abstract
Highlights
• Proximity-dependent biotinylation (PDB) approaches involve fusion of a bait with an enzyme.
• BioID (biotin protein ligase) and APEX (peroxidase) are distinct enzymes used in PDB.
• Past, present and future development and applications of PDB are discussed.
• We review labeling mechanisms and kinetics to provide guidance for experimental design.
• We discuss controls and considerations for data interpretation.
Review
Samavarchi-Tehrani et al., 2020, Molecular & Cellular Proteomics 19, 757–773May 2020 © 2020 Samavarchi-Tehrani et al. Published under exclusive license by The American Societyfor Biochemistry and Molecular Biology, Inc.https://doi.org/10.1074/mcp.R120.001941
This is an Open Access article under the CC BY license.