measure, application, segment, industry (masi) - … application, segment, industry (masi): ......
TRANSCRIPT

Measure, Application, Segment, Industry (MASI):
Wastewater Treatment Facilities Prepared for: Southern California Edison
Navigant Consulting, Inc. One Market Street Spear Street Tower, Suite 1200 San Francisco, CA 940105 415.399.2109 www.navigant.com Reference No.: 170661 March 13, 2015
This document is confidential and proprietary in its entirety. It may be copied and distributed solely for the purpose of evaluation. © 2015 Navigant Consulting, Inc.

Table of Contents
Executive Summary ................................................................................................................. iv
1 Introduction ....................................................................................................................... 1
1.1 Study Overview ................................................................................................................................... 1 1.2 Methodology ........................................................................................................................................ 1
1.2.1 Literature Review ................................................................................................................. 1 1.2.2 In-Depth Interviews ............................................................................................................. 1
2 Background ........................................................................................................................ 3
2.1 California Utility Programs and Initiatives ..................................................................................... 3 2.1.1 All Utilities ............................................................................................................................. 3 2.1.2 PG&E ...................................................................................................................................... 4 2.1.3 SCG ......................................................................................................................................... 5 2.1.4 SCE .......................................................................................................................................... 5 2.1.5 SDGE ...................................................................................................................................... 6
2.2 Regulations Affecting the Market ..................................................................................................... 6 2.2.1 National Regulations ............................................................................................................ 6 2.2.2 State Regulations ................................................................................................................... 7
3 Market and Industry Analysis........................................................................................ 8
3.1 Industry Characterization .................................................................................................................. 8 3.2 General Drivers and Barriers ........................................................................................................... 10
3.2.1 Process Needs ...................................................................................................................... 10 3.2.2 Costs and Savings Mechanisms ........................................................................................ 10 3.2.3 Utility Programs .................................................................................................................. 11 3.2.4 Regulations .......................................................................................................................... 12 3.2.5 Customer Awareness and Experience ............................................................................. 13 3.2.1 Decision Makers .................................................................................................................. 13
3.3 Industry Standard Practice .............................................................................................................. 14
4 Technology Analysis ...................................................................................................... 15
4.1 Methane or Biogas Recovery ........................................................................................................... 15 4.1.1 Description of Technology ................................................................................................. 15 4.1.2 Baseline or ISP ..................................................................................................................... 15 4.1.3 Market Trends, Drivers, and Barriers .............................................................................. 16 4.1.4 Energy Savings Potential ................................................................................................... 18
4.2 Improving Aeration Efficiency ........................................................................................................ 19 4.2.1 Description of Technology ................................................................................................. 19
Confidential and Proprietary Page i Southern California Edison, Wastewater Treatment Facilities Market Segmentation and Characterization Study

4.2.2 Baseline or ISP ..................................................................................................................... 20 4.2.3 Market Trends, Drivers, and Barriers .............................................................................. 20 4.2.4 Energy Savings Potential ................................................................................................... 22
4.3 More Efficient Sludge Processing ................................................................................................... 22 4.3.1 Description of Technology ................................................................................................. 23 4.3.2 Baseline or ISP ..................................................................................................................... 23 4.3.3 Market Trends, Drivers, and Barriers .............................................................................. 23 4.3.4 Energy Savings Potential ................................................................................................... 24
4.4 VFD Pumps ........................................................................................................................................ 25 4.4.1 Description of Technology ................................................................................................. 25 4.4.2 Baseline or ISP ..................................................................................................................... 25 4.4.3 Market Trends, Drivers, and Barriers .............................................................................. 26 4.4.4 Energy Savings Potential ................................................................................................... 27
4.5 Reducing Energy Intensity of UV disinfection ............................................................................. 27 4.5.1 Description of Technology ................................................................................................. 27 4.5.2 Baseline or ISP ..................................................................................................................... 27 4.5.3 Market Trends, Drivers, and Barriers .............................................................................. 28 4.5.4 Energy Savings Potential ................................................................................................... 28
4.6 Other Measures or Energy Savings Opportunities....................................................................... 29 4.6.1 New or Emerging Technologies ....................................................................................... 29 4.6.2 Paradigm Shifts ................................................................................................................... 30 4.6.3 Non-Water-Related Measures ........................................................................................... 31
5 Recommendations ........................................................................................................... 32
5.1 Consider the Size of the Plant .......................................................................................................... 32 5.2 Help Customers Handle Competing Regulations ........................................................................ 32 5.3 Focus on Process as well as Technology ........................................................................................ 32 5.4 Continue Long-Term Relationship Development through Account Managers ....................... 33 5.5 Continue to Share Industry Knowledge ........................................................................................ 33
Appendix A References .................................................................................................. A-1
Appendix B Program Manager Interview Guide ..................................................... B-1
Appendix C Subject Matter Expert Interview Guide .............................................. C-1
Appendix D Facility Manager Interview Guide ...................................................... D-1
Confidential and Proprietary Page ii Southern California Edison, Wastewater Treatment Facilities Market Segmentation and Characterization Study

List of Figures and Tables
Figures: Figure 1. Distribution of Wastewater Treatment Plants in California Sorted by Average Flow Rate .......... 9 Figure 2. Linear Motion Mixer (Left) and Egg-Shaped Digesters (Right) ....................................................... 24 Tables: Table ES-1. Electricity Savings Potential for Selected Measures ....................................................................... iv Table ES-2. Natural Gas Savings Potential for Selected Measures .................................................................... v Table 1. Facility Characteristics Reported by Interviewees ................................................................................ 2 Table 2. Energy Consumption of California Wastewater Treatment Facilities ................................................ 8 Table 3. Biogas Practices at Interviewed Facilities ............................................................................................. 16 Table 4. Energy Savings Potential for Methane or Biogas Recovery ............................................................... 19 Table 5. Energy Savings Potential for Methane or Biogas Recovery for Natural Gas Heating.................... 19 Table 6. Aeration Efficiency Practices at Interviewed Facilities ....................................................................... 20 Table 7. Energy Savings Potential for Aeration Efficiency Measures .............................................................. 22 Table 8. VFD Practices Reported by Facility Interviewees ............................................................................... 26 Table 9. Energy Savings Potential for VFD Pumps ............................................................................................ 27 Table 10. Energy Savings Potential for UV Disinfection Energy Reduction .................................................. 29
Confidential and Proprietary Page iii Southern California Edison, Wastewater Treatment Facilities Market Segmentation and Characterization Study

Executive Summary
In the Wastewater Treatment Efficiency Study, Navigant Consulting, Inc. (Navigant) provides data and insights useful for developing strategies to effectively address wastewater treatment facility efficiency opportunities. The study assesses the technical potential of select retrofit efficiency measures for wastewater treatment plants (WWTPs) operating within California. The study objective is to provide program planners with information that is immediately useful in program design efforts. Navigant estimated the technical potential for energy efficiency (EE) measures in wastewater treatment facilities by conducting secondary source research and interviewing utility program managers, subject matter experts, utility account managers, and facility operators. Technology areas of focus included biogas recovery, aeration, sludge processing, variable frequency drive (VFD) pumps, and ultraviolet (UV) disinfection. In estimating technical potential, Navigant considered small and large plants separately, with small being defined as processing, on average, 10 million gallons per day (MGD) or less of wastewater). Table ES-1 shows electricity savings potential, while Table ES-2 shows gas savings potential.
Table ES-1. Electricity Savings Potential for Selected Measures
Measure Small Plants (≤10 MGD) Large Plants (>10 MGD)
Electricity Site Savings (%)
California Savings Potential (kWh)1
Electricity Site Savings (%)
California Savings Potential (kWh)1
Methane/biogas recovery for electricity generation
34%2 74,379,0003 27%2 151,884,0003
High-speed turbo blowers 7.8%2,4 28,080,0005 7.8%2,4 46,800,0006
Turblex blowers N/A7 N/A7 26.0%4 156,000,0006
Other VFD blowers 8.5%2,4 154,0005 8.5%2,4 922,0006
Fine bubble diffusion 18%2,4 131,040,0008 18%2,4 72,800,0009 VFD pumps 1.7%4 13,860,00010 7.7%4 154,000,00010
Low-pressure UV lamps 6.0%4 9,608,0004,11 6.0%4 24,020,0004,11
Total 345,887,000 1,538,904,000 Table notes: 1 Calculated as annual site savings multiplied by applicability multiplied by total number of plants in each size category. 2 Source: Energy Efficiency in Water and Wastewater Facilities, EPA (2013). 3 Technical potential applicability is calculated from the percentage of California plants that use biogas but do not use it for electricity generation. Source: WEF Biogas Data Collection Project (2012) 4 Source: Evaluation of Energy Conservation Measures for Wastewater Treatment Facilities, EPA (2010) 5 Improved aeration efficiency measures only apply to plants that use activated sludge. One of the interviewees did not use activated sludge; however, it was a small plant in a cold environment. Based on data from the WEF Biogas Project, we estimated that 90% of small plants use activated sludge. Of those, we assumed half would implement high-speed turbo blowers and the other half would implement VFD blowers. Confidential and Proprietary Page iv Southern California Edison, Wastewater Treatment Facilities Market Segmentation and Characterization Study

6 Based on interview findings that large plants are beginning to implement advanced blowers, we assumed that 10% of large plants are already using advanced blowers, and split the remaining 90% applicability evenly between the three blower types. 7 We assumed Turblex blowers, because of their large size, could only be implemented in large plants. 8 We assumed the number of small plants already using fine bubble diffusion is negligible, and therefore applicability is 100% among plants that have activated sludge, or 90% of all small plants. 9 Based on interview feedback, we assumed 80% of large plants are already using fine bubble diffusion, and therefore this measure is applicable to 20% of large plants. 10 Interview findings suggested that most plants are already using VFD pumps in some applications, but all plants have at least some non-VFD pumps that could be converted to VFD. 11 We assumed that 20% of plants use UV disinfection, based on interview findings.
Table ES-2. Natural Gas Savings Potential for Selected Measures
Measure Small Plants (≤10 MGD) Large Plants (>10 MGD)
Gas Site Savings (%)
California Savings Potential (Therms)
Gas Site Savings (%)
California Savings Potential (Therms)
Replacing natural gas usage for heating 100%1 5,897,0002 0% N/A2
Table notes: 1 Assumption based on site using biogas for heating instead of flaring it. 2 Calculated from percentage of California plants that have anaerobic digestion but do not use the gas for heating. Only one plant larger than 10 MGD (out of 50 total) had anaerobic digestion but did not use the biogas for heating. Source: WEF Biogas Data Collection Project.
Through interviews, Navigant developed the following recommendations for utilities to strengthen their relationships with wastewater treatment plants and further reduce energy usage within this sector.
» Consider plant size: Small facilities (those that process 10 MGD or less on average) and large facilities (those that process more than 10 MGD on average) are vastly different in their energy intensity, budgeting process, priorities, and needs; therefore, for these reasons, future studies should consider them as separate categories. Many large plants have already picked the low-hanging fruit and are looking for the next frontier of energy savings. Utilities can help by being a resource for information on the most advanced features, continuing to fund pilot studies of emerging technologies and generally helping these plants come up with customized solutions for their needs. Small plants, on the other hand, are not as sophisticated and many, because of their size, do not have the revenues or budget to invest in advanced technologies. More study needs to be done on EE measures that would be appropriate for smaller plants, as well as the expected energy savings, keeping in mind that the savings would be aggregated across hundreds of plants.
» Help customers handle competing regulations: Utilities should try to help their customers save energy even in the presence of competing regulations from the Air Quality Management Districts in California, which restrict emissions from biogas-using equipment. Utilities may not be able to affect the regulations, but should adapt their incentives to the fact that the barrier is no longer to production of biogas but to making that biogas usable.
Confidential and Proprietary Page v Southern California Edison, Wastewater Treatment Facilities Market Segmentation and Characterization Study

» Focus on process as well as technology: Utilities should look beyond specific technologies to consider how the treatment process itself can be made more efficient. Beyond the low-hanging fruit, the logical next step in EE for some plants could be redesigning the process altogether or looking for energy savings beyond the process itself.
» Continue long-term relationship development through account managers: California utilities should continue to be both proactive and responsive in their communications with WWTPs. Interviewees at wastewater treatment facilities consistently saw their relationship with their utility account managers as positive.
» Continue to share industry knowledge: Utilities should stay educated and up-to-date on the latest information on advanced technologies and energy-saving measures. Since WWTPs generally do not compete with each other, they are willing to share their knowledge among themselves. Likewise, utilities must be willing and able to both share knowledge with treatment plants and learn from them in order to continue to promote energy savings in the industry.
Confidential and Proprietary Page vi Southern California Edison, Wastewater Treatment Facilities Market Segmentation and Characterization Study

1 Introduction
1.1 Study Overview In the Wastewater Treatment Efficiency Study, Navigant Consulting, Inc. (Navigant) provides data and insights useful for developing strategies to effectively address wastewater treatment facility efficiency opportunities. In this study, Navigant assesses the technical and market potential of select retrofit efficiency measures for wastewater treatment plants (WWTPs) operating within California. The study objective is to provide program planners with information that is immediately useful in program design efforts. Navigant estimated the technical potential for energy efficiency (EE) measures in wastewater treatment facilities by conducting secondary source research and interviewing utility program managers, subject matter experts (SMEs), utility account managers, and facility operators. Technology areas of focus included biogas recovery, aeration, sludge processing, variable frequency drive (VFD) pumps, and ultraviolet (UV) disinfection.
1.2 Methodology Navigant used a combination of secondary research and in-depth interviews to identify technology and market opportunities for energy savings opportunities in California’s WWTPs. This section describes Navigant’s research methodology.
1.2.1 Literature Review
Navigant began the study by reviewing relevant literature on EE opportunities in this sector. A summary of the sources that informed this study is listed in Appendix A.
1.2.2 In-Depth Interviews
Navigant investigated the market and technical potential for EE measures in wastewater treatment facilities by interviewing utility program managers, SMEs, utility account managers, and facility operators. Navigant first interviewed program managers at utilities to focus the research objectives and identify barriers and opportunities in the sector. Navigant interviewed program managers from each of the California investor-owned utilities (IOUs)—Pacific Gas and Electric Company (PG&E), Southern California Edison Company (SCE), San Diego Gas & Electric Company (SDG&E), and Southern California Gas Company (SCG). For the detailed interview guide, please see Appendix B. After the program manager interviews, Navigant interviewed an account manager at SCE and the director of a trade organization that represents the interests of WWTPs in Southern California. For the detailed interview guide, please see Appendix C.
Confidential and Proprietary Page 1 Southern California Edison, Wastewater Treatment Facilities Market Segmentation and Characterization Study

Navigant then interviewed seven facility managers from facilities representing a wide range of treatment plant sizes and treatment types. Table 1 provides basic information on these facilities. For the full facility manager interview guide, please see Appendix D.
Table 1. Facility Characteristics Reported by Interviewees
Plant or Facility
Average Operating
Capacity (MGD) Average Daily kWh per MGD*
Average Daily Therms per
MGD* Treatment Type Role of Interviewee(s)
1 1 5,080 Advanced secondary, nutrient removal, no activated sludge
Wastewater Operations Supervisor
2 1.5 5,000 Advanced tertiary with UV
Operations Superintendent
3 12.5 Advanced water reclamation General Manager
4 22 Preliminary, primary, and activated sludge secondary treatment processes
Chief Executive
5 45 (4 plants) 2,780 261 Water reclamation
Water & Wastewater Services; Director of Purchasing and Contracts; General Manager for Operations and Maintenance; Director of Engineering
6 190—Plant 1 144—Plant 2 1,850 Secondary Senior Engineer
7 280
(largest of multiple plants)
1,200 0.5
(may not include reclaimed biogas)
Six upstream tertiary plants send solids to secondary plants with solids handling that discharge to an ocean outfall
Supervising Engineer
*Not all interviewees reported this figure; where they did not report it, it is left blank.
Confidential and Proprietary Page 2 Southern California Edison, Wastewater Treatment Facilities Market Segmentation and Characterization Study

2 Background
This section discusses the unique operating environment of wastewater treatment facilities in California. Plants have access to a number of utility programs to help them identify and implement EE measures; however, they also have strict regulatory guidelines that influence their options and how they evaluate the risk associated with each one.
2.1 California Utility Programs and Initiatives WWTPs in California have a number of program options available to them to help make energy-efficient upgrades. Several of these programs are common across the IOUs, and others are unique to various utilities. This section first describes programs that are common across the IOUs, then describes IOU-specific programs.
2.1.1 All Utilities
There are a number of EE programs available to WWTPs across the California IOU service territories under either the statewide Commercial Energy Efficiency Program or local and third-party commercial programs.1 This section describes the programs all California IOUs offer WWTPs in California. The statewide Commercial Energy Efficiency Program is a set of programs offered to non-residential customers across all California IOUs. The goal of this set of programs is to accelerate the adoption of EE measures in support of California’s Long-Term Energy Efficiency Strategic Plan. These programs are open to non-residential customers, and the following programs were found to have wastewater treatment facility participation through our interviews.
» The Commercial Deemed Incentives program provides fixed-amount rebates for measures that have well-defined energy and demand savings. Wastewater treatment facilities may use this program to install more efficient lighting, for example.
» The Commercial Calculated Incentives program provide rebates to industrial facilities for installing EE measures that have more variable savings, depending on the specific application. Utilities assess the value of calculated incentives on a case-by-case basis depending on the estimated savings for a particular customer’s measure installation. Many technologies that are not specific to wastewater treatment processes can be upgraded through this program.
» The Energy Advisor Program is an educational program that helps customers identify and implement energy savings solutions that meet their particular needs. Utilities typically offer the following services through this type of program:
o Benchmarking
o Online Energy Audits
1 http://www.cpuc.ca.gov/NR/rdonlyres/BB0D11D4-E6AA-471B-A5BA-8A70A18B4ECB/0/201314CommercialFactSheet.pdf. Confidential and Proprietary Page 3 Southern California Edison, Wastewater Treatment Facilities Market Segmentation and Characterization Study

o Site Energy Audits
o Continuous Energy Improvement (CEI)
o Retrocommissioning (RCx) assessments
» Savings by Design is a program that uses a whole-building or whole-facility approach to identify and implement energy-saving measures in new construction projects.2 Wastewater facilities use this program to facilitate major process improvement operations, and with upcoming plant expansions, it will continue to be a valuable resource.
The IOUs also each offer their own suite of local and third-party programs. All of the IOUs have individually developed RCx and demand response (DR) programs outside of the Commercial Energy Efficiency Program.
» Retrocommissioning programs take a system approach rather than a widget-based approach and focus on optimizing the operation of existing equipment. This can include the replacement of outdated equipment, but focuses on getting the most out of what is already in place. Examples of projects that may come out of RCx at a wastewater treatment facility include right-sizing a blower if the system characteristics change or fixing air leaks in the distribution. RCx may be an underutilized program at present, according to one project manager.
» Demand response programs are another opportunity for WWTPs to receive incentive dollars from their energy utility for taking conservation actions during hours of peak demand. Various program types allow customers to receive incentives for managing their load in different ways.
Though not a program on their own, account executives are utility representatives assigned to particular customers as a more direct liaison to the energy utility and all it has to offer. These account executives primarily promote and help facilitate efficiency projects, but also make sure customers are on the least expensive rate tariff for the facility’s use patterns and keep facility managers abreast of new technologies.
2.1.2 PG&E
PG&E currently offers two programs that apply specifically to wastewater treatment facilities—the California Wastewater Process Optimization Program (CalPOP) and the Water Infrastructure and System Efficiency (WISE) Program—along with a couple less structured initiatives. CalPOP is a third-party program run by QuEST. 3 This program uses the traditional approach of getting involved when the customer is doing an upgrade. Through this program, wastewater treatment facilities can get a free EE audit and receive up to 100% of the cost to implement a project. While optimal to tailor this program to the long capital planning cycles of WWTPs, the need for many municipal agencies to issue bonds to fund these projects presents a significant barrier.
2 http://www.savingsbydesign.com/ . 3 http://www.calwastewater.com/index.html. Confidential and Proprietary Page 4 Southern California Edison, Wastewater Treatment Facilities Market Segmentation and Characterization Study

The WISE Program is a more recent third-party program that has been launched to target system optimization in water distribution with opportunities for wastewater facilities to also participate.4 Run by Lincus, this program focuses on better hydrologic system modeling and identifies controls, operations, and enhanced maintenance approaches. This may include RCx opportunities as well. Other PG&E program initiatives include the submetering of industrial facilities and a program focused on biologic system emerging technology. Submetering is useful for benchmarking individual pieces of equipment against similar equipment at other facilities. The biologic system is a worm-based process that is currently being tested at two facilities that handle specific kinds of waste—dairy and tomato.
2.1.3 SCG
SCG has no specific program for wastewater treatment facilities. Instead, SCG opts to serve WWTPs through its custom incentives program and focuses its efforts on researching more innovative ideas. The SCG program manager interviewed for this sturdy said the utility is investigating how customers might benefit from treating their own wastewater onsite.5 SCG is also examining possibilities opened up by the water-energy nexus, such as claiming water savings that result from EE projects.
2.1.4 SCE
SCE also offers the WISE program, and additionally offers a software option to medium and large customers, a Pump Test and Hydraulic Services (PT&HS) Program,6 and has specifically engaged the water industry in its service territory. The SCE EnergyManager®7 suite of tools allows facility managers to track bills and view electric use data at 15-minute intervals. The reporting function also provides pre-built charts for easy visualization of data. A long-standing program at SCE is the PT&HS Program. Delivering testing services and technical information, this program helps customers improve pump operating efficiency and implement efficiency measures in hydraulic systems. Since 2013, SCE has had an initiative to engage the large wastewater agencies in its service territory called the Water-Energy Team – Program Advisory Group (WET-PAG). This resource has been a platform for water and wastewater agencies to interact with SCE. The communications facilitated by this
4 http://eestats.cpuc.ca.gov/EEGA2010Files/PGE/PIP/Clean/13-14_PGE%20IDEEA365_Lincus%20WISE_PIP_PGE210135.pdf. 5 http://sustainca.org/programs/water_energy/overview. 6 http://www.calmac.org/publications/PY2002_SCE_Pump_Test_and_Hydraulic_Services_Final_Evaluation_Report. pdf 7 https://www.sce.com/wps/portal/home/business/tools/energy-manager/!ut/p/b1/hc_dCoJAEAXgZ-kBcsYf1C5XMd0lWswo25vQsM1St0zy9VPwKqjO3YFvYA4ISEE02auUWVeqJqvGLuyj7oYkoglS7lEbqecTn3OGFncGcBgAfgnBf_d7EL-Iy6xPEG4cAynbBSvu6QZaxgQWIQYR4wPYxiZSM8Z1QoiJaE_gx5MMhKxUPgzeeyAet5Jf-3EaaXLTlSDa4ly0Ratd1LODtO97TSolq0I7qRrudYolnYulnM3el39DTQ!!/dl4/d5/L2dBISEvZ0FBIS9nQSEh/?from=energymanager. Confidential and Proprietary Page 5 Southern California Edison, Wastewater Treatment Facilities Market Segmentation and Characterization Study

initiative has helped wastewater agency participants better understand the programs available through SCE and at the state level.
2.1.5 SDGE
Though SDG&E currently has no wastewater-specific programs, a program manager did describe a past program in which account representatives would visit wastewater facilities to find out what the plants wanted to do and then offer incentives for EE. The program sought out customers, provided training, and educated customers on what the energy utility could offer. The project manager admitted that the utility could have improved and made the program more successful by bolstering marketing and adding audits and education on the economics of the program (specifically return on investment [ROI]).
2.2 Available Funding from Other Sources There are a number of opportunities for funding wastewater treatment plant projects in California. The State Water Resources Control Board (SWRCB) and Rural Community Assistance Corporation (RCAC) both have programming that targets the wastewater industry. The SWCRB offers the Clean Water State Revolving Fund8 that wastewater agencies can take advantage of for financing construction of new facilities. This low interest option can be used on even the largest of projects. The SWRCB also promotes water recycling efforts through the Water Recycling Funding Program.9 There are a number of different grants and loans available through this program for the purposes of augmenting the availability of recycled water. Finally, across the western United States, RCAC offers a variety of services to wastewater treatment facilities.10 For facilities in rural areas, RCAC can help design, construct, and finance wastewater systems or help improve existing operations.
2.3 Regulations Affecting the Market Wastewater treatment facilities answer to many regulatory bodies regarding various aspects of their processes. Regulations primarily revolve around discharges, placing restrictions based on health or environmental concerns.
2.3.1 National Regulations
The National Pollutant Discharge Elimination System (NPDES) program handles permitting of discharges to surface waters to maintain ecosystem health.11 California is authorized to administer these
8 http://www.waterboards.ca.gov/water_issues/programs/grants_loans/srf/# 9 http://www.waterboards.ca.gov/water_issues/programs/grants_loans/water_recycling/ 10 http://www.rcac.org/pages/108 11 http://water.epa.gov/polwaste/npdes/. Confidential and Proprietary Page 6 Southern California Edison, Wastewater Treatment Facilities Market Segmentation and Characterization Study

discharge permits within the state.12 These permits cover discharges directly into surface water and set limits on total dissolved solids, chlorides, and sulfates, among other water quality constituents.
2.3.2 State Regulations
The California Department of Public Health sets effluent standards at the state level without dictating the method of treatment. The rules dictate only that there be monitoring and that test results must reach a certain level, whether for biological oxygen demand, nitrogen, etc. The Department of Public Health may also mandate precautions such as testing for E. coli by qualified personnel. Several interview respondents predicted that as California’s population increases, regulations may evolve to include managing new risks (e.g., pharmaceuticals in the wastewater stream), more testing, or even new treatments.
12 http://water.epa.gov/polwaste/npdes/basics/NPDES-State-Program-Status.cfm. Confidential and Proprietary Page 7 Southern California Edison, Wastewater Treatment Facilities Market Segmentation and Characterization Study

3 Market and Industry Analysis
3.1 Industry Characterization Wastewater treatment facilities represent a unique subsector in the industrial sector. Though these facilities are bound by reliability constraints and consume much of the energy attributed to water infrastructure, their governance structures are largely municipal or semi-municipal. As utility agencies themselves, they do not serve overlapping areas, and therefore do not compete for business with each other. This contributes to an atmosphere of collaboration among entities in which the sharing of best practices is welcome and bragging rights emerge over the most advanced technologies. The Quarterly Fuel and Energy Report (QFER) data in Table 2 illustrates decreasing electricity consumption in the wastewater treatment industry for California’s combined IOU territories from 2011 to 2013. Since population has increased during the same time period, this trend suggests that WWTPs have become more energy-efficient over the past few years with respect to electricity usage.
Table 2. Energy Consumption of California Wastewater Treatment Facilities
2011 2012 2013
Electricity (MWh) 1,341,165 1,302,422 1,287,304 Natural Gas (therms) 28,612,949 not available not available
Source: QFER data for North American Industry Classification System (NAICS) Code 221320, Sewage Treatment Facilities
Confidential and Proprietary Page 8 Southern California Edison, Wastewater Treatment Facilities Market Segmentation and Characterization Study

There is a huge range in terms of treatment plant capacity in California. Capacities range from around 1 million gallons per day (MGD) for the smallest plants to eight facilities in California that process upwards of 100 MGD as they collect waste streams for densely populated areas.13 The number of plants is concentrated at the small-capacity end of the spectrum—of the approximately 250 WWTPs in California, 80% treat less than 10 MGD. As another way of envisioning the breakdown, 20% of the plants treat 80% of the water in California. Figure 1 illustrates the capacity distribution of California WWTPs.
Figure 1. Distribution of Wastewater Treatment Plants in California Sorted by Average Flow Rate
With respect to industry growth, interviews with facility managers reveal that new construction and expansions are being planned at existing plants. While some wastewater agencies look to these new construction projects to increase their level of treatment (i.e., moving from secondary treatment to water reclamation), others simply need to expand capacity and are expanding existing facilities or adding small (~1 MGD) new plants to their systems. These projects are planned years in advance and present excellent opportunities for utility account executives to facilitate installation of the most efficient equipment.
13 WEF Biogas Project.
0
50
100
150
200
250
300
350
0 50 100 150 200 250 300
Aver
age T
reat
men
t Rat
e (MG
D)
Plants in California
Confidential and Proprietary Page 9 Southern California Edison, Wastewater Treatment Facilities Market Segmentation and Characterization Study

3.2 General Drivers and Barriers Interviewees discussed several factors in energy-related decision-making that could act as either drivers or barriers to improved efficiency. This section discusses general drivers and barriers that could apply to a range of technology improvements; technology-specific improvements are discussed in Section 4
3.2.1 Process Needs
Facility managers consistently mentioned reliability and redundancy as their first priority. One facility manager looked at this from a cost perspective—the cost of a sewage spill is far greater than the costs or savings of a typical EE project. Several facility managers cited process improvements as the most significant benefits of EE measures, often outweighing energy savings. Specific examples include the following:
» The upgrade of one facility’s UV disinfection system was driven by the anticipation of saving time for repairs on the old system, and it considered EE to be a side benefit.
» Sludge digestion implemented by one plant reduced the amount of sludge volume that it has to dispose of.
» One plant reported that adding VFDs to pumps allows the plant to control return flow and avoid hydraulic pushes that disrupt the flow.
» A plant converting internal combustion engine (ICE) pumps to electrical pumps did so primarily to reduce operations and maintenance (O&M).
By the same token, facility managers wanted to avoid compromising reliability at all costs due to the stringent regulations discussed in Section 2.2. The manager of a very large plant said that they would not implement any measures that would put them at risk of a spill that would violate their NPDES permit. Several plants reported having redundant equipment to guard against spills. This can also affect logistics of implementing measures—as one SME pointed out, wastewater comes into the plant 24 hours a day at varying rates, so it is difficult to shift loads. An account manager said that to some customers, wastewater treatment is a black box, and some operators are just interested in meeting the health department regulations, without considering that they can get the same results with less energy.
3.2.2 Costs and Savings Mechanisms
Avoiding cost was a frequently cited driver for implementing EE measures. Facility manager interviewees consistently said that utility costs were their second biggest expense after labor, and this held true from the very smallest to the very largest plant. One SME said that cost is the main driver for EE because if wastewater agencies can lower their operational costs, they can reduce rates. Three facility managers, representing facilities of different sizes, also said that cost savings drive EE improvements. Policies surrounding cost can also drive energy changes—one facility manager said that he can propose any project as long as it has less than a 5-year payback, it does not impact reliability, and he can find the money in the budget. Two treatment plants—one medium and one large—have a formal asset management plan that governs equipment replacement. One said that they assess the ROI of new equipment through their plan, while the other said that they use their plan to guide whether they retire Confidential and Proprietary Page 10 Southern California Edison, Wastewater Treatment Facilities Market Segmentation and Characterization Study

equipment early and implement proven technology upgrades. Another facility manager said that they do not have a formal asset management plant but they try not to be “penny wise but pound foolish.” They will consider more efficient equipment with a 7-year payback period or less. On the other hand, costs can also act as a barrier. One of the same facility managers that said keeping operational costs down is a driver also said that the high cost of upgrading can be a barrier to implementing new technologies. Another facility manager with an asset management plan said that sometimes a tight budget will keep them from replacing equipment on the renewal schedule. Given the importance of cost, utilities can influence energy savings by communicating the financial benefits of EE. A program manager emphasized the importance of demonstrating how the economics work out when promoting efficiency projects, and believes it is best practice to use an economic model to show the ROI. Another program manager said his utility was working on a benchmarking tool that will help facilities compare themselves to other plants. The program manager expected the tool to soon be able to examine the efficiency of each piece of equipment in a facility. Facility manager interviewees echoed the importance of financial metrics in making the case for implementing EE projects. One facility manager has been able to implement millions of dollars of renovations because each project had a payback of under 3 years—well below the maximum of 7 years used as a criterion for the facility. A facility manager who shared his experience had come to understand that a good case also presented the alternatives and why it was important to act in a timely manner.
3.2.3 Utility Programs
In interviews, facility managers also discussed utility incentives and programs intended to promote or offset the cost of EE projects. One facility manager stated that the high cost of electricity had led to implementing leading-edge technology and receiving grants from SCE to help offset costs. However, interviewees expressed growing concern over the amount of time and effort required to file for and receive these incentives. Though one facility manager said he could get underutilized staff to complete the additional reporting required for the incentives, others claim that the increasingly onerous process has become such a hassle that pursuing an incentive on an efficiency project is no longer the default. Another facility manager said that it took 3 years from one project’s completion to receive the incentive check for that project. As a result, for many facilities, the presence of incentives does not necessarily drive energy-saving measures, although they factor into the project economics. One facility manager mentioned that the presence of an incentive does not affect go/no-go decisions on upgrade projects, but each incentive opportunity can be put to a cost-benefit test. Another facility manager related a story of involving the utility after the facility had decided which projects to implement. Because the utility had not been involved earlier in the process, it was too late for the facility to receive a rebate. Although these anecdotes describe situations in which the facility proceeded with the project without the incentive, there may be situations in which energy savings opportunities are missed because of a missed incentive. We suggest that utilities ensure that their incentive process is consistent and communicate this to their customers.
Confidential and Proprietary Page 11 Southern California Edison, Wastewater Treatment Facilities Market Segmentation and Characterization Study
Another utility program with mixed results in driving efficiency was DR. One SME interviewed expressed disappointment with DR as a way to lower energy bills because of the small incentive size and the speed with which facilities were expected to react. This sentiment was echoed by a facility manager who said the incentives, which were calculated based on test day savings, were not worth the disruption to operations it required in practice. Nevertheless, DR programs take many forms, and high summer demand charges have made automated demand response (ADR) an option of interest to some facilities. One facility manager expressed the ability to adjust process operations, particularly with respect to UV disinfection and water pumping encompassing one quarter to one third of the load at the plant, and is looking into ADR because of the additional incentives available. Peak management is another form of DR program that already has participating wastewater facilities. Four out of the five facility managers in SCE territory and one from SDG&E territory all emphasized how important their good working relationship with the utility account executive has been in implementing EE measures. Account executives who are both proactive and responsive are seen as partners in saving electricity. One facility manager was impressed that his account executive keeps him in the loop on classes and conferences. Another went so far as to write leaders within SCE’s organization to ensure that he did not get reassigned to a new account executive when SCE underwent a reorganization. He noted that without someone on the utility side to personally coordinate an application’s progress through SCE’s departments, the process was liable to stall—a good account executive is the key to successfully navigating the incentive process for efficiency projects.
3.2.4 Regulations
As described in Section 2.2, wastewater treatment facilities must abide by a host of national and state regulations. One facility manager worried that if regulations became more stringent, he would have to implement more costly measures like reverse osmosis, which is often used to remove salts. Noncompliance can result in large fines or even plant shutdown, which has created a heightened sense of risk adversity among WWTPs. This in turn can lead facilities to avoid measures with the potential for saving energy. One facility manager said that running wet wells higher was an example of a practice that would save energy because the pumps would not have to work as hard, but the risk of a spill if the pump shut down is too high. A similar situation exists with gas compression: a shutdown would cause the facility to vent, which is a violation. Nevertheless, meeting more stringent discharge requirements is the number one factor driving technology improvements, according to a program manager. One example of this was provided by a facility manager regarding nitrate removal in response to limits being cut to a third of what they were previously. This facility manager said that it is difficult to get to the new limits with standard technology, but is hopeful that the promising technology being piloted today will lead to reasonably priced options by the time the new limits take effect in 2025. For facilities already planning to implement technology improvements, it may be possible for utilities to promote energy savings measures at the same time. One facility manager was also considering other sources of policy change. The new Water Resources Development Act and its effect on the state revolving fund loan program was a point of interest. In
Confidential and Proprietary Page 12 Southern California Edison, Wastewater Treatment Facilities Market Segmentation and Characterization Study

addition, the Regional Water Quality Control Boards and the U.S. Environmental Protection Agency (EPA) may affect the direction of the wastewater treatment industry in the next 5 to 10 years.
3.2.5 Customer Awareness and Experience
Facility manager interviewees reported a high level of awareness of, and experience with, advanced technologies and EE. Most were able to describe in detail the processes and technologies implemented at their plant, and many also discussed complex emerging technologies in the industry. It is possible that there is some selection bias in our sample because those who were willing to speak with us may also be those who are proud of their systems’ efficiency. This was certainly the case with one facility manager, who actively seeks to share the opportunities he sees in challenging projects with professional organizations through presenting at conferences, even out of state. The energy utilities had their own perspectives to share. One program manager added that besides sharing knowledge with each other, wastewater agencies also sometimes have preferred vendors who are seen as trusted information providers. This program manager was confident that because of outreach performed through trade organizations, there was someone at each facility who was aware of the EE programming available. He added that his utility had account representatives for the largest 100 facilities out of the 800 in the service territory. Another program manager commented on the range of attitudes among the boards that control whether projects are implemented. He said that even though a larger agency may have more budget, they can be complacent and slow-moving, and he has seen examples of smaller agencies being very progressive. The energy utilities are just one source of information for facility managers. Account executives and initiatives like SCE’s WET-PAG bring to light programs available through SCE and at the state level. One facility manager also mentioned a quarterly outlook and training session available through his energy utility. Trade associations like the Southern California Association of Publicly-Owned Treatment Works (SCAP), California Association of Sanitation Agencies (CASA), and the Water Environment Federation (WEF) also put on events like the WEF Technical Exhibition and Conference (WEFTEC). These forums provide platforms for talking shop and comparing notes. Additional sources of information include the Internet, neighboring agencies, professional publications, and consultants who pride themselves on being up-to-date. These all present avenues that energy utilities could take advantage of to reach out to their customers in this sector. One facility manager noted that the energy industry does not currently publish in the wastewater trade journals or sponsor scholarships, and energy industry representatives are generally not as visible at conferences as industry vendors. He said he would appreciate the utility being more involved in the water industry, beyond the account executives’ involvement with facilities. He says it would help to foster the feeling that the energy utility was more teamwork-oriented with the wastewater business.
3.2.1 Decision Makers
The governance structure varies greatly for WWPTs, but interviewees agreed that organizations’ attitudes toward efficiency greatly depend on that of decision makers at the plant. An account manager
Confidential and Proprietary Page 13 Southern California Edison, Wastewater Treatment Facilities Market Segmentation and Characterization Study

said that it was important to get the right people involved in the decision-making—plants see the most success in achieving EE with a “champion” who has the authority to make things happen, and that all the important players need to share the vision. Navigant spoke to several such champions—every one of the facility manager interviewees was personally invested in making their plant as efficient as possible within the constraints they had. Support from the top of the organization is also key, extending beyond financial parameters. A facility manager from a large agency said that upper management emphasizes the use of the best designs for new facilities and the most efficient equipment, and even if the level of expenditure did not seem to convey this priority, the agency now has a whole group focused on efficiency. Likewise, a plant’s management or board can make a huge difference in driving or hindering energy improvements. One facility manager said that their board of directors is a strong driver for change. The board set a goal to be energy independent 7 years ago, a move that has driven many energy-related decisions. Another facility manager of a small plant mentioned that the board of directors is environmentally conscious and supports sustainability-focused decisions. However, a facility manager of another small plant said that red tape in their organization is a barrier and that the purchasing process is daunting. A program manager pointed out that especially with city agencies, the board may not have much technical knowledge and may need to be educated on how a measure actually works to be able to support it. In these instances, outreach to boards of directors would be another avenue for utilities to influence energy savings.
3.3 Industry Standard Practice There is very little information about industry standard practice (ISP) in the wastewater treatment industry. Navigant is only aware of two recent ISP studies: one for blowers in aeration, conducted by ASW Engineering Management Consultants in 2013, and another for VFD pumps in small WWTPs, conducted by ASWB Engineering in 2014. (See Sections 4.2.2 and 4.4.2, respectively, for details on these two studies.) Program managers with all four IOUs expressed the need for more data and information in ISPs to help them establish program baselines. One said that currently the public utility commissions (PUCs) dispute incentives because of disagreements on what technologies are ISP, and well-established ISPs would help bring consistency to the incentive process. By the same token, one account manager recommended that current ISP studies need more data to support the declaration of technologies as ISP.
Confidential and Proprietary Page 14 Southern California Edison, Wastewater Treatment Facilities Market Segmentation and Characterization Study

4 Technology Analysis
This section discusses five energy-saving technology areas that Navigant focused on in our interviews and secondary research: methane or biogas recovery; improving aeration efficiency; more efficient sludge processing; VFD pumps; and reducing energy intensity of UV radiation. This section also discusses new and emerging technologies that interviewees identified.
4.1 Methane or Biogas Recovery
4.1.1 Description of Technology
Methane is a natural by-product of anaerobic digestion of waste-activated sludge. Anaerobic digestion is a secondary treatment method that uses microorganisms to break down organic material in wastewater biosolids. Treatment plants can use recovered methane, called biogas, onsite in several ways; otherwise, it is flared. Facility managers described using biogas in the following ways at their facilities:
» Electricity generation (e.g., a combined heat and power [CHP] plant.)
» ICEs
» Microturbines (Interviewee lamented that they are not reliable enough to incur the contractor cost to keep them running – they only ran 50% of the time.)
» Fuel cells (Interviewee did a 5-year demonstration pilot, but by the end the unit was obsolete.)
» To replace natural gas in heating applications (Interviewee uses biogas in a heat dryer system that produces fertilizer.)
An alternative that was discussed—though interviewees were divided on whether this was feasible—was to potentially sell excess biogas to other customers to treat and use.
4.1.2 Baseline or ISP
There is no established ISP for methane or biogas recovery. Interviews with facility managers revealed a clear breakdown by plant size for this measure, with the larger facilities saying that biogas recovery is common for plants similar to theirs, particularly better-managed facilities, and with smaller facilities observing that it is not common. Several facility managers noted factors that may affect the likelihood that a facility would implement biogas recovery. One large facility noted that the economies of scale have to do with the amount of electricity that can be generated and said that 2 megawatts (MW) was his estimate for the cutoff for making biogas recovery cost-effective. There are facilities selling the treated gas when it is not used onsite. The smallest plants we spoke with did not have activated sludge as part of their treatment process. A very small facility observed that for agencies like itself at high elevations, it is too cold to effectively digest sludge. These facilities are forced to transport their sludge to other facilities and focus instead on dewatering their sludge as much as possible to avoid hauling costs. The smaller facilities that did capture their biogas were more likely to use it for cogenerating electricity for
Confidential and Proprietary Page 15 Southern California Edison, Wastewater Treatment Facilities Market Segmentation and Characterization Study

the facility and heat for the digesters, with any excess biogas being flared instead of used for excess energy production.
4.1.3 Market Trends, Drivers, and Barriers
Table 3 lists the practices of the interviewees with respect to recovering biogas, and the applications in which interviewees are using the biogas if it is recovered.
Table 3. Biogas Practices at Interviewed Facilities
Interviewee Has Digested Sludge?
Recovers Biogas? Details
1 No N/A Too cold to digest sludge 2 No N/A 3 Yes Yes 800 kW engines 4 Yes Yes Now on 3rd Generation 5 Yes Yes Uses for ICEs and fuel cells 6 Yes Yes Compresses to 60 psi, dries, then removes H2S and siloxane 7 Yes Yes Runs 20 MW generator but shut down 250-400-kW plants
Overall, while biogas recovery is an attractive option to wastewater treatment facilities, it is often cost-prohibitive to smaller facilities, leaving them to flare their gas while larger facilities invest in the capital to utilize the resource to offset energy costs. Innovation continues to improve the quantity and quality of biogas that a single digester can produce, but uptake is slow because of risk aversion and high installation costs. Account managers from SCE were able to help characterize this technology in their areas. There are at least eight facilities using recovered biogas, with at least five using fuel cells, and two more projects are planned for construction in the near future. In addition, one facility without activated sludge processing predicted that it may be a consideration in the future and noted that cogeneration would be a complementary technology to consider. One of the veterans in using biogas had engine-driven influent pumps installed when the plant was constructed 45 years ago. Twenty years ago, those engines were replaced to comply with Air Quality Management District (AQMD) emissions controls requirements. Now this facility sends the biogas through a compressor to get it to 60 pounds per square inch (psi) (even for flaring), then dries it in a gas dryer, then removes hydrogen sulfide (H2S), siloxane,14 formaldehyde, and other chemicals before being sent through the engines. This cleaned biogas offsets two-thirds of the facility’s gas use.
14 Siloxane comes out of hair conditioners. When burned in the engines, it comes out as glass that ruins the emissions controls. Confidential and Proprietary Page 16 Southern California Edison, Wastewater Treatment Facilities Market Segmentation and Characterization Study

One facility manager we spoke with is interested in using biogas for reasons that include improving emissions and possibly earning environmental credits as ancillary benefits, but has found that the AQMD is a barrier. Pilot programs are testing two technologies—one that treats the emissions and one that treats the gas before running it through the engine—both with the goal of reducing nitrogen oxides (NOx) emissions to meet AQMD requirements. Both are reported as promising and may be economically feasible for smaller facilities when used with ICEs, which have low capital costs compared to other options. This agency’s acid-based digestion process produces higher quality biogas in higher quantities than the anaerobic process used in the other 80% of WWTPs. Acid-based digestion is a two-step process that adds to the complexity, and adds 20%–40% to the capital cost of the system. The facility’s biogas currently fuels two fuel cells (one at 900 kilowatts [kW], the other at 600 kW) and more than one boiler. This medium-sized utility is engaging various stakeholders, including SCG, to explore options like treating the gas to pipeline quality and injecting it into the pipeline, but sees the technology investment cost as too high. With facilities that are not close together, transporting the biogas to a central location is also not feasible for this agency. One of the facilities interviewed is pushing the boundaries in biogas recovery. A multi-million- dollar California Energy Commission (CEC) grant enabled this facility to upgrade a decommissioned digester with new technology. The facility manager said that with the private-public partnership, over $10 million had been invested in the facility without the agency having to raise rates for customers. The facility is now mixing in external feedstock to be 6% of the influent—beyond the perceived limit of 3%—and is producing approximately 30% more biogas since the upgrade. That biogas fuels ICEs that were chosen over fuel cells. This same facility adds ferric to the solids to reduce the H2S levels and resulting strain on the gas-scrubbing system. The engines can also run on low pressure to power the blowers. The facility manager said the generators that come online soon will be able to generate energy for the entire plant, at which point they will no longer need utility electricity or gas. (They will still need to maintain their interconnections for emergency backup situations.) Beyond producing enough energy to make up for the embedded energy in the chemicals the facility uses, the next goal is to continue to increase power production and put that back onto the grid to offset fixed energy costs. Once facilities are up and running, another option is to create a business model to sell the gas directly to large-scale customers at retail prices. The gas contains only 10% less energy by volume than propane, but would need to be stored, so this has been placed into the bucket of phase two biogas projects. Interviewees predicted that over the next few years, a new generation of WWTPs will be built to replace aging infrastructure and to meet water recycling targets. The Clean Water Act of 1972 spurred the installation of much of the existing infrastructure that is now reaching the end of its useful life. Recycled water targets and policies will play a role in determining which technologies get installed, and according to one facility manager, will ultimately determine whether wastewater facilities are charged with producing energy or merely minimizing their energy use. The reported size and cost barriers associated with utilizing biogas flows from wastewater treatment processes mostly boil down to the tight regulations that exist around using biogas in different capacities. Most of the capital cost is attributed to the equipment required to scrub the biogas of odors, volatile organic compounds (VOCs), corrosive components, and carbon dioxide, as well as removing any associated fluids so that it can run in an engine that meets AQMD emissions standards. If this is too Confidential and Proprietary Page 17 Southern California Edison, Wastewater Treatment Facilities Market Segmentation and Characterization Study

expensive, the facility resorts to flaring the gas, which is counterintuitive because it provides no benefit, but it is the reality that results from the regulation of NOx, sulfur oxides (SOx), and particulate matter. Nevertheless, at least one of the large facilities in Southern California is capable of producing pipeline quality gas. The regulations continue to tighten. One facility manager said that as recently as 5 years ago, his agency had four digester gas plants, but because of new AQMD requirements for weekly testing and monitoring, only one still runs. One of the facilities that was no longer cost-effective was a 400 kW ICE. This facility manager foresees more shutdowns as this trend continues. Another facility manager mentioned that his facility had to agree to limit emissions from their engines by limiting their runtime. Current operations only dehumidify the biogas because they remain under the 100 ton limit, at which point they would need a different permit and would need to scrub the gas. The South Coast AQMD is the most stringent because it regulates a non-attainment area for EPA-regulated air pollutants. The latest emissions control measure requirements present a significant barrier to those wanting to produce electricity with their biogas-using ICEs. Compliance would require costly retrofits of existing technologies, but pilots on these retrofits have not shown that they are effective enough to meet the requirements, according to an SME interview. These facilities will not be able to comply in the allotted timeframe because the technology is simply not available.
4.1.4 Energy Savings Potential
In estimating the energy savings potential, Navigant limited the estimate to plants that have anaerobic digestion but are not already recovering methane or biogas for electricity generation or heating. Navigant used data from a previous project by WEF on biogas implementation nationwide, compiled in September 2012 (the WEF Biogas Data Collection Project).15 There may be more potential to convert plants that do not have anaerobic digestion to anaerobic digestion, or to increase the biogas production of plants that already recover biogas, but as that is a significant process and structural change we did not consider it for this estimate. Table 4 and Table 5 present the estimated energy savings potential for recovering biogas for electricity generation and for offsetting natural gas heating, respectively.
15 WEF Biogas Data Collection Project (2012). Confidential and Proprietary Page 18 Southern California Edison, Wastewater Treatment Facilities Market Segmentation and Characterization Study

Table 4. Energy Savings Potential for Methane or Biogas Recovery
Measure Plant Size Electric Site Savings (%)
Average Annual Site Savings (kWh)*
Applicability (%)**
California Savings Potential (kWh)†
Methane/biogas recovery for electricity generation
≤ 10 MGD 34% 1,355,000 28% 74,379,000 >10 MGD 27% 9,962,000 28% 151,884,000
* Calculated for the average site in each size category. Source: Energy Efficiency in Water and Wastewater Facilities, EPA (2013) ** Calculated from percentage of California plants that use biogas but do not use it for electricity generation. Source: WEF Biogas Data Collection Project (2012). †Calculated as annual site savings multiplied by applicability multiplied by total number of plants in each size category.
Table 5. Energy Savings Potential for Methane or Biogas Recovery for Natural Gas Heating
Measure Plant Size Gas Site Savings (%)
Annual Site Savings (therms)
Applicability (%)
California Savings Potential (therms)
Replacing natural gas usage for heating
≤ 10 MGD 100%* 122,000 24%** 5,897,000 >10 MGD N/A N/A 0%** N/A
* Assumption based on site using biogas for heating instead of flaring it. **Calculated from percentage of California plants that have anaerobic digestion but do not use the gas for heating. Only one plant larger than 10 MGD (out of 50 total) had anaerobic digestion but did not use the biogas for heating. Source: WEF Biogas Data Collection Project (2012).
4.2 Improving Aeration Efficiency
4.2.1 Description of Technology
WWTPs that use microorganisms to digest wastewater often implement some kind of mechanism to add oxygen to the sludge and speed up the biological activity. The simplest method involves a mechanical mixer to mix in air. Other mechanisms include blowers that bubble air into the wastewater. It is also important not to add too much air to the water, so these systems often include some sort of control mechanism to adjust the amount of air being added. These aeration technologies can use over half of the energy at a WWTP.16 Technologies that can improve the efficiency of aeration include:
» High-efficiency blowers that use less energy to add air to the wastewater. Some specific types include:
o VFD blowers: Instead of cycling on and off or operating at discrete stages to optimize the amount of air being added in the water, VFD blowers continuously vary the rate at which they add air to the water.
16 http://www.cwea.org/sarbs/pdfs/Blower%20Technologies%20Loera%20061712.pdf Confidential and Proprietary Page 19 Southern California Edison, Wastewater Treatment Facilities Market Segmentation and Characterization Study
o Turbo blowers: A special type of VFD blower that operates at high speed but achieves very high efficiencies due to its advanced design.
o Turblex blowers: Another type of centrifugal blower that uses an advanced turbine and both variable inlet guide vanes and variable diffuser vanes to achieve high efficiencies. Turblex blowers are very large (several hundred horsepower each) and are generally appropriate for large WWTPs.
» Fine bubble aeration: Diffusion membranes that decrease the size of the bubbles produced to improve oxygen transfer and increase efficiency.17
» Dissolved oxygen (DO) controls: Uses sensors and a control mechanism to detect the amount of dissolved oxygen already in the wastewater and adjust the input accordingly. This avoids wasting energy over-aerating the water and improves the process.
4.2.2 Baseline or ISP
A study conducted by ASWB in 2013 investigated ISP for blowers. The study compared the existing baseline, constant-speed multistage centrifugal blowers with inlet valve throttling to a single-stage, high-speed turbine blower with a VFD. After market research and discussion with industry experts, the study authors determined that although VFDs are becoming more popular, the constant-speed multistage centrifugal blowers with inlet valve throttling remain the ISP.18
4.2.3 Market Trends, Drivers, and Barriers
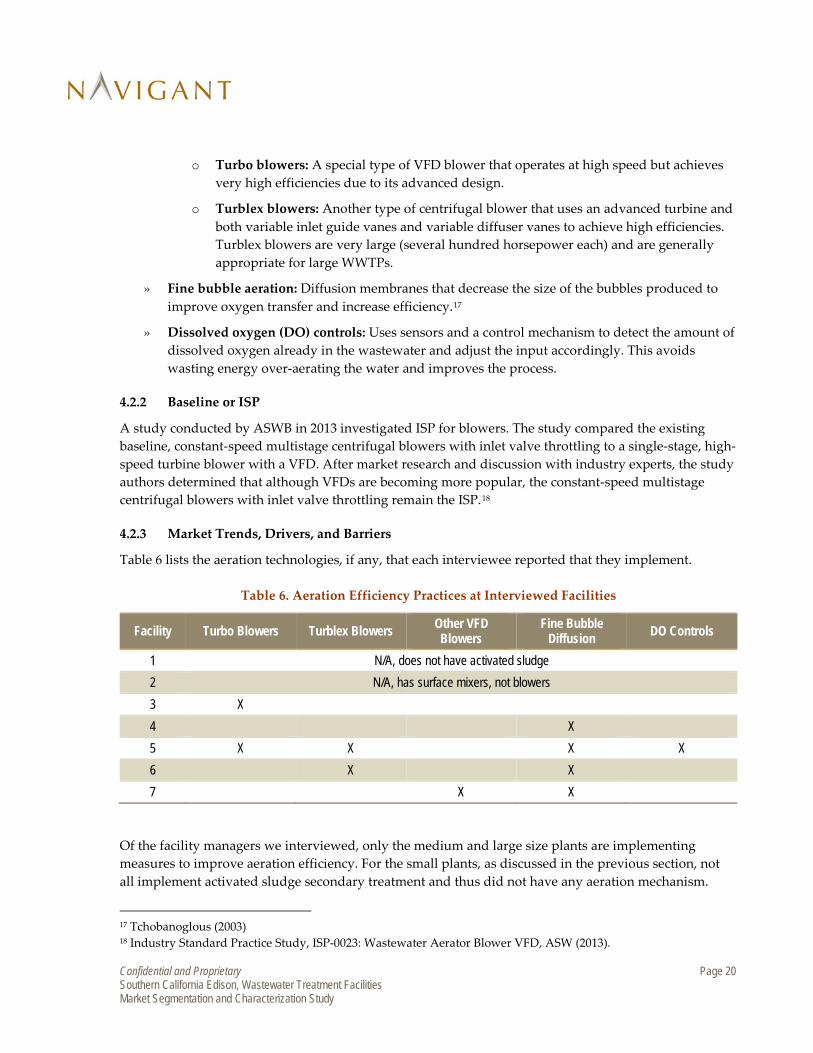
Table 6 lists the aeration technologies, if any, that each interviewee reported that they implement.
Table 6. Aeration Efficiency Practices at Interviewed Facilities
Facility Turbo Blowers Turblex Blowers Other VFD Blowers
Fine Bubble Diffusion DO Controls
1 N/A, does not have activated sludge 2 N/A, has surface mixers, not blowers 3 X 4 X 5 X X X X 6 X X 7 X X
Of the facility managers we interviewed, only the medium and large size plants are implementing measures to improve aeration efficiency. For the small plants, as discussed in the previous section, not all implement activated sludge secondary treatment and thus did not have any aeration mechanism.
17 Tchobanoglous (2003) 18 Industry Standard Practice Study, ISP-0023: Wastewater Aerator Blower VFD, ASW (2013). Confidential and Proprietary Page 20 Southern California Edison, Wastewater Treatment Facilities Market Segmentation and Characterization Study

This was the case for the smallest treatment plant we spoke with. At the second largest, the facility manager said that the plant does not have aerobic digestion but does have surface mixers, which they were planning to put VFDs on. A program manager said that high-efficiency blowers, fine bubble diffusion, and DO controls are usually included in a package. The next sections discuss trends, drivers, and barriers for three advanced technologies: high-efficiency blowers; fine bubble aeration; and DO controls.
4.2.3.1 High-Efficiency Blowers
High-efficiency blowers, such as high-speed turbo blowers, Turblex blowers, and other kinds of VFD blowers, are becoming increasingly popular among plants that have aeration. Four of the five plants we interviewed with aeration implement some sort of VFD blower—two implement turbo blowers, two implement Turblex blowers (one of the facilities implements turbo blowers in one plant and Turblex in another), and one implements another kind of VFD blower. One program manager noted that turbo blowers are most appropriate for small or medium applications because they are generally 400 hp and below in size. Facilities implementing turbo blowers were extremely pleased with them. One estimated that it achieved 50% savings in aeration energy consumption with their 400 hp turbo blower. The interviewee added that installing turbo blowers is becoming more prevalent, with smaller blowers around 200 hp in size being common. An account manager and an SME also mentioned that turbo blowers are becoming increasingly popular among smaller facilities. The account manager said that turbo blowers can only be built to a certain size, but are ideal for handling small-increment loads. Turblex blowers are very large and very efficient—one facility manager whose process implements Turblex blowers called them the most efficient blower on the market. This interviewee said that they are becoming more common. An SME agreed that a lot of agencies are moving toward Turblex blowers. One account manager said that another customer of theirs, a large facility, have been very happy with their Turblex blowers. Their O&M needs are unclear—the account manager reported that the Turblex blowers are “extremely reliable,” but a program manager said that they are “high maintenance.” Other sources point to the lack of an oil cooling system and few moving parts as indications of low maintenance requirements.19 The program manager also said that they are very expensive, suggesting that customers would need help implementing them, possibly in the form of incentives.
4.2.3.2 Fine Bubble Diffusers
The four largest facilities we spoke with reported implementing fine bubble diffusion. One mentioned that fine bubble aerators are common, while another said that most medium and large plants have converted to fine bubble aeration. One facility said it was using fine air bubble diffusion with a soft shell diffuser instead of a hard shell diffuser.
19 http://www.cwea.org/sarbs/pdfs/Blower%20Technologies%20Loera%20061712.pdf Confidential and Proprietary Page 21 Southern California Edison, Wastewater Treatment Facilities Market Segmentation and Characterization Study

4.2.3.3 DO Controls
Only one of the facility managers we interviewed said that they were implementing DO controls, and that they were doing so via a supervisory control and data acquisition (SCADA) system.
4.2.4 Energy Savings Potential
Table 7 shows the estimated energy savings potential for high-efficiency blowers (turbo blowers, Turblex, or other VFD blowers) and fine bubble diffusion. Because DO control is a complex measure and may be incorporated with other control functions, we were not able to estimate the energy savings potential for this measure.
Table 7. Energy Savings Potential for Aeration Efficiency Measures
Measure Plant Size Electric Site Savings (%)1
Average Annual Site Savings (kWh)
Applicability (%)
California Savings Potential (kWh)
High-speed turbo blowers ≤ 10 MGD 7.8% 315,000 45%2 28,080,000 >10 MGD 7.8% 2,836,000 30%3 46,800,000
Turblex blowers ≤ 10 MGD N/A N/A 0%4 N/A >10 MGD 26.0% 9,455,000 30% 156,000,000
Other VFD blowers ≤ 10 MGD 8.5% 341,000 45%2 154,000 >10 MGD 8.5% 3,073,000 30% 922,000
Fine bubble diffusion ≤ 10 MGD 18% 735,000 90%5 131,040,000 >10 MGD 18% 6,618,000 20%6 72,800,000
1 Sources: Energy Efficiency in Water and Wastewater Facilities, EPA (2013); Evaluation of Energy Conservation Measures for Wastewater Treatment Facilities, EPA (2010) 2 Improved aeration efficiency measures only apply to plants that use activated sludge. One of the interviewees did not use activated sludge; however, it was a small plant in a cold environment. We used 90% as an approximation for the number of plants that use activated sludge. Of those plants, we assumed half would implement VFD blowers and the other half would implement high-speed turbo blowers. 3 Based on interview findings that large plants are beginning to implement advanced blowers, we assumed that 10% of large plants are already using advanced blowers, and split the remaining 90% applicability evenly between the three blower types. 4 We assumed only large plants use this technology. 5 Based on the number of small plants we assumed use activated sludge. 6 Based on interview findings. Four out of the five plants > 10 MGD that we interviewed implement fine bubble diffusion.
4.3 More Efficient Sludge Processing Sludge refers to solids have been separated from liquids during the wastewater treatment process. To be able to dispose of the sludge properly, it has to be further processed. Processing can involve reducing the volume of the sludge by removing water; stabilizing sludge to remove odors and pathogens, either by applying chemicals or using other bacteria to digest biological material; and/or simply transporting or
Confidential and Proprietary Page 22 Southern California Edison, Wastewater Treatment Facilities Market Segmentation and Characterization Study

storing the sludge within the plant or elsewhere.20 Energy-using functions include transporting the sludge, digesting the sludge, mixing the sludge during storage, and removing water from the sludge.
4.3.1 Description of Technology
Although several technologies are available to improve sludge processing efficiency by targeting various functions, most of the interviewees spoke about centrifuges for thickening the sludge, also called dewatering. Centrifuges use a high-speed spinning mechanism to separate liquids from solids in a sludge stream. They can be used to thicken sludge before digestion or remove water from sludge after digestion. They are compared with belt-filter presses, which compress the sludge between two fabric belts to remove water; screw presses, which push water through a cylindrical screen to separate out the solids; or more passive methods such as sludge lagoons and drying beds, which work by simply evaporating the water.21 Although centrifuges themselves do not always use less energy than belt-filter presses or passive methods, they can improve overall process efficiency by achieving a higher solids concentration.22
4.3.2 Baseline or ISP
There is no established ISP for sludge thickening or dewatering. Of the four largest facilities, three are already implementing centrifuges in sludge processing, while the fourth is planning to install centrifuges within 2 years. The two smallest facilities use either rotary screw presses or belt presses. The last facility uses solar drying beds, but the interview said that was because they were in the desert and is an otherwise unusual practice.
4.3.3 Market Trends, Drivers, and Barriers
One program manager said that one of their customers that implemented new thickening centrifuges achieved savings that were better than originally anticipated. Of the facilities that implement centrifuges, one interviewee said that they currently have about half belt presses and half centrifuges, and they are in the process of replacing belt presses with centrifuges. The interviewee said that they were specifically doing this not for energy conservation reasons, but for saving on the costs of sludge hauling, as the centrifuges remove more water than belt presses. This same interviewee mentioned that they actually had centrifuges 30 years ago, but they were not reliable and did not dewater as well as belt presses, so they, like many in the industry, transitioned to belt presses at the time. Currently, this interviewee believes that centrifuges have improved and are becoming more prevalent. However, one of the smaller plants that is currently implementing belt presses “would take some convincing to switch” to centrifuges because centrifuges require more maintenance. Account managers identified two other mechanisms for more efficient sludge processing in addition to centrifuges. One is linear motion mixers, which use an up-and-down motion within a sludge tank to mix sludge instead of spinning like a traditional rotary mixer. One account manager observed that customers have backed out of installing linear motion mixers because they are too expensive and ultimately not
20 Tchobanoglous (2003) 21 Tchobanoglous (2003) 22 http://water.epa.gov/scitech/wastetech/upload/2002_06_28_mtb_centrifuge_thickening.pdf. Confidential and Proprietary Page 23 Southern California Edison, Wastewater Treatment Facilities Market Segmentation and Characterization Study

economic. The second measure is egg-shaped digesters. Egg-shaped digesters have a smaller footprint than conventional cylindrical digesters and result in more efficient mixing. An account manager said that one of their customers implemented egg-shaped digesters using an incentive through the Savings by Design program. None of the energy managers at the WWTPs we interviewed said they were implementing these measures.
Figure 2. Linear Motion Mixer (Left) and Egg-Shaped Digesters (Right)
4.3.4 Energy Savings Potential
In summary, the most common improvement to sludge processing appears to be replacing belt or screw presses with centrifuges, at least among larger plants. The opportunity for savings on sludge hauling is driving these changes, and interview evidence suggested that direct energy savings would be negligible. For smaller plants, the most significant barrier is a concern about increased maintenance and decreased reliability. Thus, we estimated no direct savings for this measure and recommend that further study be conducted on indirect energy and cost savings from process improvements. With respect to other measures, linear motion mixers could be a good target for incentives because the initial expense seems to be the main barrier to installation. Egg-shaped digesters involve much more intensive change in the design of the plant. To date, there has not been much research done on the efficacy of these latter two measures, and we were not able to estimate their savings potential.
Source: Ovivo Source: CBI
Confidential and Proprietary Page 24 Southern California Edison, Wastewater Treatment Facilities Market Segmentation and Characterization Study
4.4 VFD Pumps
4.4.1 Description of Technology
Several kinds of pumps are used within WWTPs to move water and sludge through the plant. For certain kinds, VFDs can be used to save energy by running the pump at the speed needed to move exactly the necessary amount of water or sludge. As the pump runs more slowly, the energy use decreases by a disproportionate amount, thus saving more energy than simply turning the pump on and off.
4.4.2 Baseline or ISP
A study conducted by ASWB in 2014 investigated ISP for VFDs on pumps in small WWTPs—defined within the study as plants that process 10 MGD or less. (The study noted that a previous 2006 California Public Utilities Commission [CPUC] study considered VFDs as ISP for influent, sludge, and effluent pumps at large WWTPs.) After market research and discussion with industry experts, the study authors determined that VFD pumps are ISP in small WWPTs in the following applications:
» Influent: Transfer incoming wastewater from storage tanks to processing
» Return-activated sludge: Transfer activated sludge from the secondary clarifier back to the aeration basin
» Waste-activated sludge: Discharge excess activated sludge into a sludge handling process
» Effluent: Transfer treated wastewater from the plant The study’s conclusions applied only to new construction.23 Several interviewees commented on this finding. One account manager mentioned that there is a wide variety of sophistication of their customers in terms of controls and the equipment vintage that they have, and there is still a lot of potential for VFDs on pumps. An SME in an organization representing WWTPs said that there are a lot of facilities without VFDs and that incentives previously helped. Although the ISP decision only applies to new construction, the baseline for energy savings calculations is the energy usage of standard equipment. Thus, treatment plants that upgrade to VFDs will see a lower incentive than before (or no incentive at all), and the added cost limits their ability to purchase those. A facility manager agreed that there are a lot of facilities that do not implement VFDs and there is more work to be done for widespread implementation.
23 Industry Standard Practice Study, New Load VFD Additions to Wastewater Treatment Pumps, ASWB (2014). Confidential and Proprietary Page 25 Southern California Edison, Wastewater Treatment Facilities Market Segmentation and Characterization Study

4.4.3 Market Trends, Drivers, and Barriers
Every WWTP we interviewed is implementing VFDs in some kind of pump application. Table 8 lists the applications in which the interviewed facilities are implementing VFD pumps.
Table 8. VFD Practices Reported by Facility Interviewees
Facility Applications in Which They Are Implementing VFD Pumps
1
Previous applications (since original install): 300 hp recycled water pumps 50 hp bioeffluent pumps Recent applications: Scum pump moving scum to the sludge thickener New primary sludge pump 10 hp return flow pumps (return backwash filtrate from recycled water and filter beds)
2 Did not specify, but said it is implementing VFD pumps 3 Any pumps that should be operating on VFDs 4 Every pump where it makes sense, except for very small 5 hp
5 Anything 50 hp and above Sometimes on smaller projects for process reasons
6 Sewage pumping Intermediate stream liquid pumping All recycled secondary treated water Some sludge pumping
7 VFDs go on anything new, plus a lot of retrofits
Several of the interviewees also said that VFD pumps are becoming more and more prevalent in the industry as a whole, with one saying that VFDs are almost universal in larger WWTPs. Some interviewees commented on specific pumping applications. A plant manager said that it was more difficult to convert centrifugal sludge pumps to VFD because a facility would have to buy a new sludge pump with a VFD to match the pump curve and could not retrofit a VFD on an existing centrifugal sludge pump. Another plant manager said that they are in the process of getting a new primary sludge pump that is VFD-driven (supporting the claim that you have to get a new pump); however, the new pump has the added benefit of evening out sludge flows. This plant expects to see the same benefit from installing return flow pumps that return backwash filtrate from recycled water and filter beds. Currently, intermittent pulses of return flow are upsetting the denitrifying filter beds and the purpose of the VFDs is to even the flow. This could be more significant for smaller plants with lower flows overall. Another untapped market for VFD pumps could be the smaller pumps. One plant manager said that VFDs are not used in small applications such as 5 hp, while another said that VFDs are used for anything 50 hp and above, but are put on smaller projects for process reasons. However, the small plant in the previous paragraph is using VFDs in pumps as small as 10 hp. This suggests that there is room to
Confidential and Proprietary Page 26 Southern California Edison, Wastewater Treatment Facilities Market Segmentation and Characterization Study

implement VFD pumps in smaller applications by focusing on processes that would benefit from VFDs, saving energy as a side benefit.
4.4.4 Energy Savings Potential
In summary, the interview responses suggest that considering VFDs to be ISP for large pumps is likely a reasonable assumption. However, there are some applications where there may be remaining potential for implementing VFDs that would not otherwise be implemented. First, smaller pumps (below 50 hp) are not automatically equipped with VFDs in either small or large WWTPs, although doing so could have process benefits in addition to energy savings. VFDs on sludge pumps may also be underutilized due to the difficulty of retrofits. Finally, although VFDs are ISP for new construction, there are many non-VFD pumps still in use in the industry, some of which may not be getting replaced (or replacement may be delayed) due to a lack of incentives beyond the new baseline. An early replacement or retrofit program for existing non-VFD pumps may address this issue, particularly in simpler applications like water pumping instead of sludge pumping. Table 9 shows the estimated energy savings potential for this measure.
Table 9. Energy Savings Potential for VFD Pumps
Measure Plant Size Electric Site Savings (%)*
Average Annual Site Savings (kWh)
Applicability (%)**
California Savings Potential (kWh)
VFD Pumps ≤ 10 MGD 1.7% 70,000 100% 13,860,000 >10 MGD 7.7% 2,800,000 100% 154,000,000
* Source: Evaluation of Energy Conservation Measures for Wastewater Treatment Facilities, EPA (2010). ** Interview findings suggest that most if not all plants have at least some non-VFD pumps that could be converted to VFD.
4.5 Reducing Energy Intensity of UV disinfection
4.5.1 Description of Technology
UV radiation can be used to kill bacteria and virus populations by destroying their ability to reproduce and is thus sometimes used for disinfection. Low-pressure lamps efficiently generate light at the necessary wavelength and draw less power than medium-pressure lamps—from about 70 W to 200 W, compared to 2 kW to 5 kW for medium-pressure lamps.24 An emerging technology is using LED blubs that emit light at UV wavelengths.2526
4.5.2 Baseline or ISP
There is currently no accepted ISP for UV disinfection measures in WWTPs.
24 Tchobanoglous (2003) 25 Ibid. 26 http://www.aquionics.com/main/pearl-brand2/. Confidential and Proprietary Page 27 Southern California Edison, Wastewater Treatment Facilities Market Segmentation and Characterization Study

4.5.3 Market Trends, Drivers, and Barriers
Interviewees reported that UV disinfection efficiency has improved over time. Three of the interviewees using UV disinfection reported that they had installed their systems many years ago and had made upgrades to the system since then, as better and more efficient components became available. One said that they had upgraded in 2006 to more efficient ballasts and lamps and made other improvements in 2013. They have low-pressure lamps. Another said that they replaced the sleeves on their lamps and implemented a UV intensity control along with a transmittance meter—when the meter detects that the water has less transmittance (i.e., it is more contaminated), then it increases the intensity of the UV light in order to kill more pathogens. The third said that they had achieved significant savings from new lamp designs and are now operating at 50 % of the original energy intensity of the UV installation. One program manager mentioned that using LED bulbs for UV disinfection is a new technology that has not yet reached the scale where it is viable in a WWTP, but the technology will make a big difference once it scales up. An account manager, however, said that many of their customers have expressed interest in UV LEDs, but few have implemented them. The account manager expressed doubts about the LED manufacturer’s claims. None of the interviewees are implementing UV LEDs. One facility manager discussed the challenges of implementing UV, saying that it is very energy- and maintenance-intensive. Also, the system has to be certified that no contaminated water is bypassing the process. This interviewee noted that the implementation of UV disinfection peaked 10 years ago, but is not as highly pursued as it used to be; furthermore, larger utilities are less likely to use UV disinfection because using chemicals like chlorine to disinfect is much cheaper and is perceived as more effective at killing pathogens. (This particular interviewee’s plant uses chlorine to disinfect its water.) On the other hand, an interviewee at one of the facilities that is currently implementing UV disinfection said that making lamp improvements reduced equipment maintenance needs and this was a larger selling point than the modest electrical savings.
4.5.4 Energy Savings Potential
Measures to reduce energy consumption of UV lighting systems are necessarily constrained to facilities that implement UV disinfection. This in turn is restricted to facilities that implement tertiary water treatment. Of the seven facilities we interviewed, only four use UV to disinfect, while another was considering the option for future water recycling. Of those four, two of them only used UV for a partial amount of their treated water for recycling. One said that they use UV disinfection on a side stream of 1 MGD, while one large facility treating hundreds of millions of gallons uses UV disinfection on two smaller reclamation plants treating less than 15 MGD. One interviewee estimated that 20% of wastewater treatment facilities use UV to treat water.
Confidential and Proprietary Page 28 Southern California Edison, Wastewater Treatment Facilities Market Segmentation and Characterization Study

Table 10 estimates the energy savings potential for low-pressure lamps. As UV LEDs are an emerging technology with little data on their efficacy, we were not able to estimate the savings potential for this measure.
Table 10. Energy Savings Potential for UV Disinfection Energy Reduction
Measure Plant Size Electric Site Savings (%)*
Average Annual Site Savings (kWh)
Applicability (%)*
California Savings Potential (kWh)
Low-pressure lamps
≤ 10 MGD 6.0% 243,000 20% 9,608,000 >10 MGD 6.0% 2,184,000 20% 24,020,000
* Source: Evaluation of Energy Conservation Measures for Wastewater Treatment Facilities, EPA (2010) ** Source: Ibid.; Interviews.
4.6 Other Measures or Energy Savings Opportunities Almost all interviewees suggested other energy savings opportunities beyond the ones described in the paragraph above, ranging from the simple to the complex.
4.6.1 New or Emerging Technologies
» Membrane bioreactor: One program manager mentioned membrane bioreactors as a new, efficient technology that can be used to treat water. A membrane bioreactor combines biological processes with filtration in a small footprint. These packaged systems use less energy and can produce more biogas than traditional anaerobic digesters. A facility manager also mentioned that a lot of plants have implemented membrane bioreactors, but that they do so for water quality reasons more than efficiency reasons (in fact, they thought the membrane bioreactor might use slightly more energy than the filtration it was replacing), as the technology allows plants to treat an equivalent amount of water with a smaller footprint.
» Technologies for salt removal: One program manager noted that facilities wishing to render the water reusable face tough challenges such as salt removal, and suggested that electrodialysis could be used to remove salts.
» Advanced sludge processing technologies: A facility manager said that they have investigated technologies such as thermophilic digestion (operation above 98 °F) and sonication to digest activated sludge using ultrasonic waves.
» Air pulse technology: One account manager mentioned a technology that would be useful for customers that have long channels moving water through the treatment plant. Typically plants use compressed air to keep particles suspended, but the pulse technology delivers pulses of air to achieve the same result and reduce reliance on compressed air.
» Advanced reacting tool: The account manager also mentioned a tool developed by Pace that is an advanced reacting tool within a SCADA system that adjusts aeration early to meet
Confidential and Proprietary Page 29 Southern California Edison, Wastewater Treatment Facilities Market Segmentation and Characterization Study

biochemical oxygen demand (BOD) load, rather than waiting for BOD to reach a certain point and over aerate.27
» More efficient air compressors: An engineer at one very large plant said that they were discussing installing more efficient air compressors. However, the challenge is that the air compressors are so large—three 1500 hp compressors—that changing them out would be “open-heart surgery on the plant.” The engineer said that they were planning to do this primarily to improve plant operations rather than to achieve EE.
4.6.2 Paradigm Shifts
» Onsite water treatment/recycled water: A program manager noted that some customers are investigating treating wastewater using constructed wetlands or other means at the site where it is produced, before it even gets to the wastewater facility. This reduces the amount of water processed by the treatment plant, and, therefore, its energy use. By the same token, the program manager noted that encouraging industrial facilities to recycle water would also reduce the amount of wastewater entering the treatment system. Another program manager mentioned that incentives should consider water-energy nexus issues: namely, the energy it takes to pump or desalinate water should be considered against the energy used to treat water for reuse.
» Ultra high-temperature sludge processing: One facility manager at a large facility mentioned that they may conduct a pilot study of the AquaCritox process, a sludge treatment process first piloted in Ireland. The primary purpose of the development of this process appears to be recovery of the phosphorus from wastewater. The AquaCritox process heats and pressurizes sludge to temperatures and pressures past the critical point of water, which oxidizes the organic components of the sludge and turns the sludge into an “ash-like product.”28 The facility manager said this would revolutionize the industry if widely adopted by eliminating the need for digesters or sludge hauling. Another facility manager is looking at a different heat treatment technology, similar to pyrolysis, that turns sludge into pelletized fertilizer.
» Biological filtration technologies: Instead of using biology that moves around with the fluid, the biology is fixed. One type is fixed-bed activated sludge treatment, in which primary, secondary, and tertiary treatments each have their own set of organisms—micro and macro—to mimic natural filtration systems (roots, plants, mollusks, etc.).
» Fully anaerobic treatment: Because air is removed from this process, energy savings would result from not having to aerate.
» Co-digestion of wastewater and other waste streams for added biogas production: One facility manager mentioned a technology for combining wastewater with another waste stream in a “dirty MRF” (materials recovery facility), which the facility manager described as significantly lower energy, but too much of a fringe technology for them to adopt.
27 http://pacewater.com/services/environmental-water/controls-instrumentation/burbank-water-reclamation-plant-control-system-3/. 28 http://www.scfi.eu/wp-content/uploads/2010/10/DG11_Water-Science-Technology-Paper.pdf. Confidential and Proprietary Page 30 Southern California Edison, Wastewater Treatment Facilities Market Segmentation and Characterization Study

» WWTP as distributed generation: One facility manager of a large plant with onsite generation mentioned that their plant does not use much energy from the grid in the first place, but has the ability to generate energy instantaneously to supply to the grid. Another facility manager said that they are applying for a microgrid to be able to smooth out their loads or handle a power outage.
» Other changes to process: One facility manager mentioned that large engineering firms are doing a lot of work rethinking the wastewater treatment process. In a huge step away from the current activated sludge process, the new process would remove solids early on in a digestion-type process.
4.6.3 Non-Water-Related Measures
» LED lighting: One treatment plant manager mentioned that they were looking at LED lighting, but their management wanted to take a conservative approach and not switch too quickly. An SME in an organization representing several treatment plants observed that although LEDs are cost-effective with incentives, customers consider them a risk because the LED fixtures are not yet standardized and they may be unable to replace bulbs in the future without replacing the entire system.
» Heating, ventilation, and air conditioning (HVAC) in non-process spaces: One facility manager said they were moving to variable volume HVAC in their switchgear and control rooms.
» Solar generation: Three plant managers mentioned solar, two of which were the two smallest plants we interviewed. One of the small plants said that it was looking at putting solar on the shade covering over the UV banks and tertiary filters, while the other said that it was in the queue for getting a solar farm through a utility power purchase agreement that would not require it to put up any capital. The largest of the three facilities said that it was advancing solar at all of its (multiple) plants. Planned for completion by the end of the year, the solar power installation would produce 1 MW of power that would be used to meet the demands of the plant and offset energy costs.
Confidential and Proprietary Page 31 Southern California Edison, Wastewater Treatment Facilities Market Segmentation and Characterization Study

5 Recommendations
Navigant has consolidated interview findings and developed recommendations for utilities to strengthen their relationships with WWTPs and further reduce energy usage within this sector.
5.1 Consider the Size of the Plant Small facilities and large facilities are vastly different in their energy intensities, budgeting processes, priorities, and needs; for these reasons, future studies should consider them as separate categories. Of the 250 plants in California, 80% treat less than 10 MGD on average, and these plants are far different from the larger plants that can treat up to hundreds of MGD. Large plants tend to be highly sophisticated and can operate on economies of scale that justify the implementation of expensive but advanced EE projects. Because many have already picked the low-hanging fruit of EE such as VFD pumps, advanced blowers, and methane or biogas recovery, they are looking for the next frontier of energy savings. Utilities can help by being a resource for information on the most advanced features, continuing to fund pilot studies of emerging technologies, and generally helping these plants come up with customized solutions for their needs. Small plants, on the other hand, are not as sophisticated and many, because of their size, do not have the revenues or budget to invest in advanced technologies. Some proven technologies such as VFD pumps have penetrated this market to some degree, but other more complex measures like biogas recovery are not highly utilized or not utilized at all for plants that do not have activated sludge. On the other hand, the interviewees at the two small plants that we spoke with were invested in saving energy. More study needs to be done on EE measures that would be appropriate for smaller plants, as well as the expected energy savings, keeping in mind that the savings would be aggregated across hundreds of plants.
5.2 Help Customers Handle Competing Regulations Utilities should try to help their customers save energy even in the presence of competing regulations from the AQMDs in California. AQMD rules restrict emissions from biogas-using equipment such as ICEs, so in a seemingly non-intuitive outcome, many plants are flaring the gas instead of using it beneficially. Utilities may not be able to affect the regulations, but should adapt their incentives to the fact that the barrier is no longer to the production of biogas but to making that biogas usable. For example, utilities could incentivize or rebate the cleaning technologies that would allow treatment plants to use the biogas. Utilities could potentially also incentivize process-enhancing technologies that enhance biogas production, thus making the treatment more cost-effective.
5.3 Focus on Process as well as Technology By the same token, utilities should look beyond specific technologies to consider how the treatment process itself can be made more efficient. Beyond the low-hanging fruit, the logical next step in EE for some plants could be redesigning the process altogether. This should also account for energy use beyond
Confidential and Proprietary Page 32 Southern California Edison, Wastewater Treatment Facilities Market Segmentation and Characterization Study

the treatment process itself. For example, advancements that reduce the amount of sludge produced also reduce the energy use of transporting the sludge. Likewise, water recycling at the source would reduce the total amount of water a treatment plant has to treat, thus lowering energy use.
5.4 Continue Long-Term Relationship Development through Account Managers California utilities should continue to be both proactive and responsive in their communications with WWTPs. Regardless of the facility managers’ sometimes critical opinions of the IOUs’ policies, they consistently saw their relationship with their utility account managers as positive. Account managers help treatment plant operators feel that they are in a partnership with the utility, and the utilities should continue to support this environment of trust to maintain credibility with customers. Additionally, every plant is different, and a single point of contact helps with custom projects.
5.5 Continue to Share Industry Knowledge Given the sophistication of many treatment plants and the deep level of knowledge among plant operators, utilities should stay educated and up-to-date on the latest information on advanced technologies and energy-saving measures. Since WWTPs generally do not compete with each other, they are willing to share their knowledge among themselves—several interviewees attended industry conferences and/or said they were members of industry organizations like SCAP. Utilities must be willing and able to both share knowledge with treatment plants and learn from them in order to continue to promote energy savings in the industry.
Confidential and Proprietary Page 33 Southern California Edison, Wastewater Treatment Facilities Market Segmentation and Characterization Study

Appendix A References
Southern California Edison Company. ASW Engineering Management Consultants. Industry Standard Practice Study, ISP-0023: Wastewater Aerator Blower VFD. N.p., July 2013. PDF.
Southern California Edison Company. ASWB Engineering. Industry Standard Practice Study, SCE-ISP-
14-003: New Load VFD Additions to Wastewater Treatment Pumps. N.p., July 2014. PDF. Tchobanoglous, George et al. Wastewater Engineering: Treatment and Reuse. 4th ed. Boston: McGraw-Hill,
2003. United States. California Energy Commission. Quarterly Fuel and Energy Report. N.p., 2013. XLS. United States. California Public Utilities Commission. Fact Sheet: Statewide Commercial Program (2013-
2014). N.p., Apr. 2013. Web. United States. U.S. Environmental Protection Agency. Energy Efficiency in Water and Wastewater
Facilities. N.p., 2013. PDF. http://www.epa.gov/statelocalclimate/documents/pdf/wastewater-guide.pdf.
United States. U.S. Environmental Protection Agency. Evaluation of Energy Conservation Measures for
Wastewater Treatment Facilities. N.p., September, 2010. PDF. http://www.epa.gov/statelocalclimate/documents/pdf/wastewater-guide.pdf.
Water-Energy Federation. U.S. Wastewater Treatment Plant Biogas Data. N.p., September 2012. XLS.
Confidential and Proprietary Page A-1 Southern California Edison, Wastewater Treatment Facilities Market Segmentation and Characterization Study
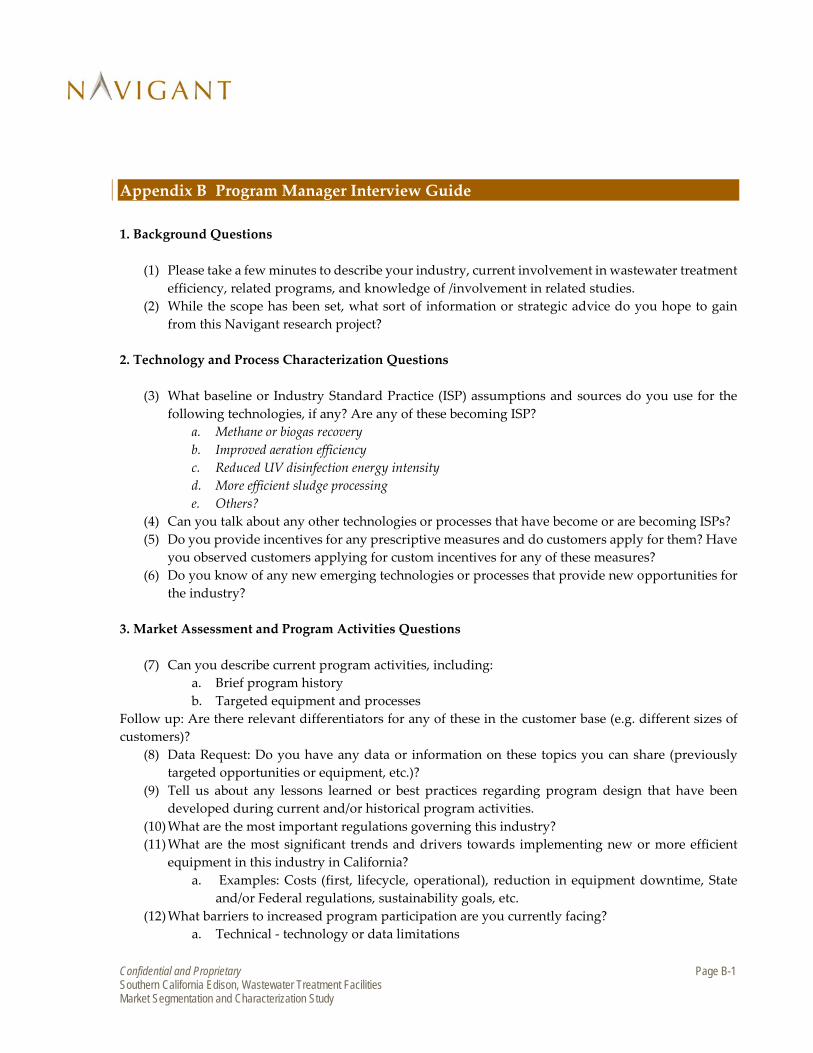
Appendix B Program Manager Interview Guide
1. Background Questions
(1) Please take a few minutes to describe your industry, current involvement in wastewater treatment efficiency, related programs, and knowledge of /involvement in related studies.
(2) While the scope has been set, what sort of information or strategic advice do you hope to gain from this Navigant research project?
2. Technology and Process Characterization Questions
(3) What baseline or Industry Standard Practice (ISP) assumptions and sources do you use for the following technologies, if any? Are any of these becoming ISP?
a. Methane or biogas recovery b. Improved aeration efficiency c. Reduced UV disinfection energy intensity d. More efficient sludge processing e. Others?
(4) Can you talk about any other technologies or processes that have become or are becoming ISPs? (5) Do you provide incentives for any prescriptive measures and do customers apply for them? Have
you observed customers applying for custom incentives for any of these measures? (6) Do you know of any new emerging technologies or processes that provide new opportunities for
the industry?
3. Market Assessment and Program Activities Questions
(7) Can you describe current program activities, including: a. Brief program history b. Targeted equipment and processes
Follow up: Are there relevant differentiators for any of these in the customer base (e.g. different sizes of customers)?
(8) Data Request: Do you have any data or information on these topics you can share (previously targeted opportunities or equipment, etc.)?
(9) Tell us about any lessons learned or best practices regarding program design that have been developed during current and/or historical program activities.
(10) What are the most important regulations governing this industry? (11) What are the most significant trends and drivers towards implementing new or more efficient
equipment in this industry in California? a. Examples: Costs (first, lifecycle, operational), reduction in equipment downtime, State
and/or Federal regulations, sustainability goals, etc. (12) What barriers to increased program participation are you currently facing?
a. Technical - technology or data limitations
Confidential and Proprietary Page B-1 Southern California Edison, Wastewater Treatment Facilities Market Segmentation and Characterization Study

b. Market - supplier limitations; or cost, education, or regulatory barriers 4. Identify New Opportunities Questions
(13) We’ve heard that many WWTPs may be undergoing new construction or expansion in the near future. Is this an accurate assessment from your perspective? How could the IOUs target opportunities towards new construction?
(14) Do you have any other programs you are planning or envision launching in the near future? (15) Do you have any ideas for other programs that would be applicable across California? (16) Besides energy savings, what drives customers to pursue new opportunities for equipment or
process changes? a. Examples: Non-energy benefits, Maintenance (cost & time) savings, environmental
concerns, regulation, etc. 5. Market Actors
(17) Data Request: Can you identify any program participants, subject matter experts, and/or trade allies that you would recommend we interview? (SMEs or trade allies may include suppliers and vendors, regulators, State and Federal organizations, trade organizations, etc.)
(18) Can you tell us about any other specific resources (market actors or other) you use to support your work in this area?
6. Concluding Questions
(19) Do you have any additional comments or concerns?
Confidential and Proprietary Page B-2 Southern California Edison, Wastewater Treatment Facilities Market Segmentation and Characterization Study
Appendix C Subject Matter Expert Interview Guide
1. Intro Questions
(1) Please take a few minutes to describe your organization and your role in your organization. (2) Can you briefly characterize your organization’s wastewater treatment related members in terms
of… a. Size/capacity b. Type of plant (primary, secondary, tertiary, advanced reclamation) c. Region/utility territory d. How many wastewater treatment members do you have? e. Would you say your members are representative of the industry as a whole?
(3) Do you know of any related programs or studies currently or recently performed?
2. Market Assessment and Program Activities Questions
(4) How many or what percentage of your members are participating in utility programs? (5) Can you describe these utility program activities, including targeted equipment and processes?
Follow up: Are there relevant differentiators for any of these in the customer base (e.g. different sizes of customers)?
(6) From your perspective, what can utilities do to increase participation in their programs?
3. Technology and Process Characterization Questions
(7) What are the most significant trends and drivers towards implementing new or more efficient equipment in the wastewater treatment industry in California?
a. Examples: Costs (first, lifecycle, operational), reduction in equipment downtime, State and/or Federal regulations, sustainability goals, etc.
(8) What barriers to implementing efficient equipment do you see among your member organizations?
a. Technical - technology or data limitations b. Market - supplier limitations; or cost, education, or regulatory barriers
(9) We would like to ask about some specific technologies and how their technical potential may be affected by regulations.
a. The first is measures for recovering methane or biogas: i. How common is this technology in the industry? among your members?
ii. What regulations affect how or whether plants implement this technology? (E.g. AQMD regulations) What is the nature of the effect and what is its magnitude?
iii. What percentage of plants do you think would otherwise implement this technology were it not for the regulations? Does this vary by customer size or customer characteristics?
Confidential and Proprietary Page C-1 Southern California Edison, Wastewater Treatment Facilities Market Segmentation and Characterization Study

(10) Other technologies: How familiar are you with… [If so, ask same questions as above] a. Measures to improve aeration efficiency: (For example: VFD blowers, fine bubble aerators,
turblex blowers, high speed turbo blowers) b. VFD pumps c. Measures to reduce energy intensity of UV disinfection (For example: low pressure lamps,
photocatalytic systems, UV LED bulbs) d. Measures for more efficient sludge processing (For example: thickening centrifuges before
digestion, dewatering centrifuges after digestion, linear motion mixers in digestion, new construction: egg-shaped digesters)
(11) Can you talk about technologies or processes that are becoming Industry Standard Practices?
4. Identify New Opportunities Questions
(12) Do you know of any new emerging technologies or processes not yet discussed that provide new opportunities for the industry?
(13) We’ve heard that many WWTPs may be undergoing new construction or expansion in the near future. Would you agree with this prediction? If so, how could the IOUs target opportunities towards new construction?
5. Market Actors
(14) Data Request: Can you identify any facility managers, subject matter experts and/or trade allies that you would recommend we interview?
b. Prompt as needed: Suppliers and vendors, regulators, State and Federal organizations, trade organizations, specific facilities – program participants and non-participants, etc.
(15) Can you tell us about any other specific resources (market actors or other) you use to support your work in this area?
6. Concluding Questions
(16) Do you have any additional comments or concerns?
Confidential and Proprietary Page C-2 Southern California Edison, Wastewater Treatment Facilities Market Segmentation and Characterization Study

Appendix D Facility Manager Interview Guide
1. Introduction Questions
(1) Please take a few minutes to provide us with some background information: a. What is your role at the facility? b. Is your wastewater treatment plant a primary, secondary, tertiary, or advanced water
reclamation facility? c. How many different plants do you operate within the overall facility? d. What is the size or capacity of the facility? (Ask for each plant if more than one.) e. What size geographic area does your facility serve? f. What types of customers do you primarily serve – residential, commercial, agricultural,
or industrial? g. What percentage of your water treatment is associated with each customer group? h. Are you planning any new construction such as an expansion or renovation in the near
future? [If yes, we would like to ask the interview questions in the context of both your existing facility and new construction.]
2. Technology and Process Characterization Questions
(2) First, we would like to understand the energy-related part of your business: a. Where do utility costs rank on your list of operational expenditures? b. How important are energy costs and energy savings to your overall business?
(3) Next, we would like to ask about any energy-saving design practices at your facility a. What energy-saving technologies or design practices are incorporated into your facility,
if anything? Please discuss technologies for saving both electricity and natural gas. (4) What is your plant’s energy intensity? (kWh/million gallons, therms/million gallons)
a. In your opinion, how efficient is your equipment compared to other wastewater treatment facilities in California operating under similar conditions (type and amount of effluent, treatment level, etc.)?
(5) How do you inform yourself about new energy efficient, new technologies and equipment, etc.? (6) What is your motivation for installing equipment that saves energy?
a. Do you experience any benefits from efficient technology or processes that are not related to energy or utility costs? (For example: Operations & maintenance benefits, regulatory compliance)
b. Do you select equipment primarily for non-energy benefits or energy savings? (7) What challenges or barriers do you face within your organization if/when you would like to install
energy-saving equipment or new technology in your facility? Confidential and Proprietary Page D-1 Southern California Edison, Wastewater Treatment Facilities Market Segmentation and Characterization Study

(8) What motivates you to overcome these barriers and implement energy efficient technologies or processes?
(9) Now we would like to hear your thoughts on some advanced technologies that can save energy at wastewater treatment plants. Please respond in terms of all plants under your control (if more than one).
a. The first is measures for recovering methane or biogas: i. In the last five years, have you implemented any measures to recover methane or
biogas at wastewater treatment plants? 1. If yes:
a. Can you describe the measures? (What treatment do you apply to the biogas before using it?)
b. What percent of your gas use does this represent? 2. If no:
a. How do you currently handle methane or biogas generated as part of the treatment process?
b. Would you consider implementing this measure in your facility? Why or why not?
c. In your opinion, how significant would you expect the energy savings to be if you installed this technology?
ii. In your experience, is this technology common practice in the industry? b. Next I’d like to talk about measures to improve aeration efficiency:
i. What type(s) of aeration do you use in your facility and what is the blower size? ii. In the last five years, have you implemented any measures to improve aeration
efficiency at wastewater treatment plants? (For example: VFD blowers, fine bubble aerators, turblex blowers, high speed turbo blowers)
1. If yes: a. Can you describe the measures? b. How significant would you estimate the savings to be for each
measure (either in kWh per year or in terms of a percent of your overall energy use)?
2. If no, or if there are some measures you have not implemented: a. Would you consider implementing this measure in your facility?
Why or why not? b. In your opinion, how significant would you expect the energy
savings to be if you installed this technology? 3. In your experience, are these technologies common practice in the
industry? c. Next I’d like to talk about VFD pumps:
Confidential and Proprietary Page D-2 Southern California Edison, Wastewater Treatment Facilities Market Segmentation and Characterization Study

i. In the last five years, have you implemented VFD pumps at your facility? 1. If yes:
a. In what applications have they been implemented? b. How significant would you estimate the savings to be for each
measure (either in kWh per year or in terms of a percent of your overall energy use)?
2. If no (or if not in certain applications): a. Would you consider implementing this measure in your facility?
Why or why not? b. In your opinion, how significant would you expect the energy
savings to be if you installed this technology? 3. In your experience, are these technologies common practice in the
industry? d. If you implement UV disinfection: Next I’d like to talk about measures to reduce energy
intensity of UV disinfection: i. In the last five years, have you implemented any measures to reduce energy
intensity of UV disinfection? (For example: low pressure lamps, photocatalytic systems, UV LED bulbs)
1. If yes: a. How significant would you estimate the savings to be for each
measure (either in kWh per year or in terms of a percent of your overall energy use)?
2. If no: a. Would you consider implementing this measure in your facility?
Why or why not? b. In your opinion, how significant would you expect the energy
savings to be if you installed this technology? 3. In your experience, are these technologies common practice in facilities
that use UV disinfection? e. Lastly, I’d like to talk about measures for more efficient sludge processing:
i. In the last five years, have you implemented any measures to improve efficiency of sludge processing? (For example: thickening centrifuges before digestion, dewatering centrifuges after digestion, linear motion mixers in digestion, new construction: egg-shaped digesters)
1. If yes: a. Can you describe the measures? b. How significant would you estimate the savings to be (either in
kWh per year or in terms of a percent of your overall energy use)?
Confidential and Proprietary Page D-3 Southern California Edison, Wastewater Treatment Facilities Market Segmentation and Characterization Study

2. If no: a. Would you consider implementing this measure in your facility?
Why or why not? b. In your opinion, how significant would you expect the energy
savings to be if you installed this technology? 3. In your experience, are these technologies common practice in the
industry? (10) Are there any other energy efficiency technologies you are considering or planning to pursue? (11) Do you know of any new emerging technologies or processes not yet discussed that provide new
energy saving opportunities for wastewater treatment plants? (12) Are you implementing measures that are not required by regulation or incentivized by a current
utility program? Why or why not? (13) How do you approach equipment replacements and/or upgrades? For example, do you have a
capital improvement strategy, replace-on-burnout versus early retirement, repair versus replace views, etc.?
(14) What factors into your decision to either repair a piece of equipment or replace it? (15) What is the normal upgrade cycle for equipment? Do you do early replacement of functioning
equipment? (16) Are there any recent or upcoming regulatory requirements that drive your design and operating
practices? a. Are there any energy efficiency measures that regulatory requirements would prevent
you from installing? b. Are there any energy efficiency measures that are required by regulation?
3. Utility Program Questions
(17) What is your relationship with your utility? Do you interact with the utility beyond simply paying the bill every month?
(18) Have you participated in your utility’s efficiency programs? a. If yes, which one(s)? b. What measures, if any, were installed as part of your participation in the program?
(19) Do you interact with other wastewater treatment plants about energy use and energy saving opportunities?
(20) In your opinion, what is the likelihood that other wastewater treatment facilities participate in utility efficiency programs?
(21) From your perspective, what can the utility do to increase your participation with their programs? (22) What would you like to see from your utility?
4. Market Actors Confidential and Proprietary Page D-4 Southern California Edison, Wastewater Treatment Facilities Market Segmentation and Characterization Study

(23) *Data Request: Are there any other facility managers, suppliers, vendors, subject matter experts, or other individuals that might be interested in sharing information with Navigant on this topic?
5. Concluding Questions
(24) Do you have any additional comments or concerns?
Confidential and Proprietary Page D-5 Southern California Edison, Wastewater Treatment Facilities Market Segmentation and Characterization Study