measurement and theory in legislative networks: the evolving
TRANSCRIPT

Measurement and Theory in LegislativeNetworks: The Evolving Topology of
Congressional Collaboration
February 17, 2012
Abstract
The examination of legislatures as social networks represents a growing area of
legislative scholarship. We examine existing treatments of cosponsorship data as con-
stituting legislative networks, with measures aggregated over entire legislative sessions.
We point out ways in which the adoption of models from the social networks literature
directly to legislative networks aggregated over entire sessions could potentially obscure
interesting variation at different levels of measurement. We then present an illustration
of an alternative approach, in which we analyze disaggregated, dynamic networks and
utilize multiple measures to guard against overly measure-dependent inferences. Our
results indicate that the cosponsorship network is a highly responsive network subject
to external institutional pressures that more aggregated analyses would overlook.
1 Introduction
Political science has been slow to embrace social network analysis (SNA). While
SNA is not completely absent from the pages of political science journals, over the
years since Moreno’s sociograms were famously introduced in 1934 (Freeman 2004),
only recently has there been a veritable explosion of interest in the discipline. Given the
1

importance of relational concepts such as power, influence, trust, conflict, collaboration,
alliance-formation and coalition-building, to name but a few, it is surprising only that it
has taken this long. As others have pointed out, few observations of interest to political
science may be convincingly construed as independent from one another (McClurg and
Young 2011).
Beyond the pragmatic use of network tools in addressing the interdependence of
cases, a number of political scientists have been making the leap to a genuine network
perspective in their work. In such investigations, the network becomes more than simply
the sum of its parts, more than just a collection of nodes and edges. Consideration of
global properties of networks opens up exciting possibilities for the study of political
behavior, as we begin to ask questions based not only in the extant theory of our own
sub-fields, but also tied to theories developed in the social networks literature and based
on broad research programs in human and even animal behavior (Guimera, et al. 2005,
Faust and Skvoretz 2002). And yet, as political scientists encountering a wide variety
of measures and theoretical assumptions accumulated over decades of contributions to
SNA, we face an embarrassment of riches. In sorting through different frameworks for
studying social networks, it is tempting to simply adopt approaches already applied by
our colleagues, without further reflection, or instead to reach reflexively for the novel,
especially when the metaphors suggested by new tools (e.g., centrality and popularity,
small worlds, structural holes) fit so nicely with the stories we are trying to tell.
In the current paper, we confine ourselves to an examination of one particular ap-
plication of SNA, namely to the study of legislative behavior and more specifically,
the use of cosponsorship data as a reflection of intra-chamber cooperation and collab-
oration. Nevertheless, the exercise of thinking carefully about the measurement and
operationalization process, and our discussion of the dangers of borrowing SNA the-
ories without considering their appropriateness to the task at hand, has implications
for any project involving the study of socio-political networks. We would be well ad-
vised to consider that even powerful network theories of political behavior ought to
2

be grounded in the decades of theory already developed about political processes. We
take the perspective that, while the implications of network theory may at times run
counter to some established traditions in political science or may even allow exploration
of previously inconceivable research questions, social network theory and analysis will
typically supplement our existing theories and knowledge rather than replace them.
In particular, we begin by reviewing the literature analyzing the U.S. Congress and
state legislatures as social networks. In section 3, we closely consider the nature of
the structural construct of interest (legislative collaboration), the choices that must
be made in the process of operationalizing this construct using cosponsorship data,
the importance of modeling assumptions on subsequent measurement options, and
the consequences of these decisions. In the context of this discussion, we critically
examine the particular choices made in the most prominent studies of Congressional
cosponsorship networks (Burkett 1997, Fowler 2006a, 2006b, Tam Cho and Fowler
2010, ). Next, in section 4, we offer our own contribution to the literature, a theory
linking Congressional collaborative patterns to institutional public approval trends. In
keeping with the overarching theme of the article, we discuss the reasoning behind
different possible measurement and modeling options in section 5, ascertaining the
robustness of results to alternative measurements. We discuss our empirical results in
section 6, before offering some concluding thoughts.
2 Literature on the Measurement of Legislative
Networks
Analyzing the social behavior of legislators implies the observation of contact or
interaction among them. Observations of true social interactions are often unavailable
or incomplete. Legislators guard their social relationships closely, and the social be-
haviors we do observe (co-attendance at fundraising dinners for example) are generally
3

strategic choices as well as social interactions. Occasionally, scholars are able to un-
earth clearer data regarding these social interactions. For example, Young (1966) and
Bogue and Marlaire (1975) examine the “boardinghouse effect,” the effect of shared
temporary lodging in Washington, on how legislators vote on the floor. Using data on
legislators from 1800-1828, Young uncovers a positive relationship between legislators’
cohabitation and their common co-voting on bills.1
Most work on explicitly social connections between legislators has focused on pre-
dicting social interactions rather than their implications for legislating. The earliest
studies predicting legislative relationships were conducted in the 1950s and 1960s as
single chamber analyses of U.S. state legislatures. Focusing on actual social contacts
such as advice seeking, trust, and friendship, these in-depth examinations relied upon
surveys and interviews to reconstruct legislative networks from self-identified relation-
ships between legislators. Patterson (1959)2, Monsma (1966), Caldeira and Patterson
(1987, 1988), and Clark, Caldeira, and Patterson (1993) all take this approach, pro-
viding both the tools for proper relational analysis and unexpected conclusions. For
example, Clark, Caldeira, and Patterson (1993) note that the predictors of mutual
respect between legislators are distinct from the predictors of friendship. These works
also uncovered the importance of cross-party friendships for the spread of information
and the diffusion of intra-chamber conflict. Such bridging relationships were consis-
tently important in limiting partisan conflicts and thus avoiding what we now call
legislative gridlock.
Recent efforts by scholars have taken up the question of how institutions might
influence these dynamics. Particularly, Sarbaugh-Thompson et al. (2006) have found
that term limits have amplified legislators’ reliance on similarity in the development
1Bogue and Marlaire uncover a much weaker relationship after controlling for geography.2Routt (1938), who wrote of Illinois assemblymen (and politicians more generally) as human relations
specialists, seems to have been the first scholar to think about how legislative relationships translate intolegislative politics. Patterson (1959) appears to have been the first to apply explicitly sociometric methodsand to the study of a legislature.
4
of many kinds of relationships and strengthened the influence of chamber leadership
relative to the rank-and-file. Term limits have also dramatically weakened the ten-
dency of legislators to form the meaningful cross-party ties that facilitate negotiation
and conflict resolution. Thus, using a longitudinal analysis of the Michigan House
of Representatives, the authors find that term limits may be having the unintended
consequence of exacerbating intra-chamber conflict.
Studying explicit social contact between elites offers a comforting level of measure-
ment validity, but is not without its shortcomings. Due to the great effort required to
observe these sorts of networks, such studies are difficult to replicate across chambers.
Additionally, self-reported relationships are known to suffer from misreporting, due to
cognitive constraints, biases, and strategic considerations. This may be of little concern
if one is interested in respondents’ perceptions and/or self-serving selective memories;
still, for objective accounting of interactions, they may be less than ideal (Bernard and
Kilworth 1977, Bernard, Kilworth, and Sailer 1980, 1981, 1982). Finally, the conven-
tional survey approach to the measurement of social networks only provides scholars
with a single snapshot of the social network of interest. In reality, social and legisla-
tive relationships are dynamic phenomena, frequently changing across and even within
sessions. Any attempts to generalize findings regarding the formation and evolution of
legislative networks over time will be particularly difficult within a survey framework.
In order to analyze networks that are at once easier to replicate and more compa-
rable over time, some scholars have turned to analysis of proxy measures for legislative
relationships. The most common of these approaches (and the one we will focus our
empirical efforts on) is the study of cosponsorship (Burkett 1997, Fowler 2006a, Fowler
2006b, Tam Cho and Fowler 2010, Gross 2010, Kirkland 2011).3 While legislators
make cosponsorship choices based to some extent on strategy, those choices are also
3Though this is not the only approach. Porter et al. (2005) use common committee assignments togenerate a network between legislators. Conover et al. (2011) and Sparks, King, and Orlando (2011) bothuse the social media network Twitter to construct social networks of legislators.
5

reflective of the broader relational tapestry of a chamber.4 In other words, the act of
cosponsorship contains elements of both strategic and interpersonal influences. While
these proxies of legislative interaction are necessarily less valid measures of social re-
lationships than direct observation (were it possible) or even survey-based measures,
unprecedented access to legislative archives provides scholars with the opportunity to
compile proxies such as cosponsorship into networks across many legislatures and many
points in time.
While these relational proxies have proven suggestive in uncovering the importance
of relationships for legislative outcomes, they have not been employed to test theories
of relational formation itself; simply put, cosponsorship has entered into analysis as
explanatory rather than response variable. Fowler (2006a) indicates that there is a
strong relationship between how “connected” a member of Congress is and the likeli-
hood that he or she will see the bills and amendments he or she sponsors pass. Kirkland
(2011) demonstrates that legislators who build the most diffuse network of cosponsors
are much more likely to have bills succeed at veto points across eight state legislative
chambers and fifteen years of Congressional activity. Waugh et al. (2009) also show
that the degree of polarization in the cosponsorship network is highly predictive of
large changes in the party control of Congress. Finally, Tam Cho and Fowler (2010)
have identified an association between what they term the “small world properties”
of the Congressional cosponsorship network and the amount of important legislation
that Congress passes. In other words, they argue, the very topology of the cospon-
sorship network may have something to do with how successful Congress is in passing
important legislation.
While operationalizing legislative cooperation or collaboration in terms of cospon-
sorship seems fairly natural, scholars who have done so have failed to convincingly
justify their measurement choices. It is not clear how exactly the cosponsorship re-
4Koger (2003) notes that legislators cosponsor for explicitly policy-motivated reasons. However, they alsocosponsor bills based on who has asked them for that cosponsorship.
6

lation should be measured; in contrast with structural variables that persist through
time (e.g., friendship, trust, admiration), cosponsorship occurs more or less in discrete
time, as the act of signing onto a bill. To be fair, this is a common issue in social
network analysis—structural variables are typically thought of as persisting through
continuous time (though potentially transitory, in the sense that friendships end or ad-
miration turns to disenchantment). Yet, these conceptual relations are operationalized
using discrete-time observations. In the case of a survey response, as when respon-
dents name their friends, the extrapolation from friendship at the moment of response
to friendship over an extended period of interest is defensible, given that the relation
is one that does not usually flicker on and off with great frequency. However, when
we use event data to operationalize a continuous-time construct, as in the case of
cosponsoring a bill together, the manner in which the activity serves as proxy for the
relationship of interest is far less obvious.5 Furthermore, the dynamic nature of collab-
orative choices has been lost. These scholars aggregate cosponsorship choices across
many bills introduced and cosponsored on many different days into a single network.
Thus, any dynamic shift in network topology that occurs within a legislative session
will be missed in the aggregate network. Legislatures are adaptive bodies, constantly
responding to new demands from the public and responding to varying internal and
inter-chamber pressures. By aggregating this within-session responsiveness into a single
network, scholars of legislatures may have overlooked many important elements of the
evolving network topology. In the next section, we take a closer look at measurement
and operationalization in action.
5This is actually related to the broader issue of how (or whether) to collapse a bipartite network onto asingle set of nodes; the bipartite network here consists of legislators connect to each other via the bills thatthey cosponsor.
7

3 Challenges and Limitations of a Network Ap-
proach to Legislative Behavior
As evident in our review of the literature, the researcher choosing to analyze
Congress from a social network perspective makes numerous choices, both explicit
and implicit, in how to approach the task. In a sense, this is no different from any
scholar approaching his or her subject. However, the relative novelty of network ana-
lytic approaches among political scientists, combined with the growing enthusiasm for
such tools, demands that we pause to consider more carefully the process of matching
theories to measures.
Ideally, we start with concepts of interest and a theory connecting these concepts,
then devise a clever research design to operationalize and measure the concepts and
their relationships. In the messy world of practical research, it is sometimes the case
that we encounter data that pique our interest and must then make the argument that
the measured variables would serve as a reasonable proxy for a particular concept,
unless of course the variable is precisely the phenomenon we wish to study. In the
case of legislative cosponsorship, it is noncontroversial to use records of cosponsorship
to study the phenomenon of cosponsorship itself; indeed, a small literature has done
just that (Campbell 1982, Kessler and Krehbiel 1996, Wilson and Young 1997, Koger
2003). Bolder has been the more recent reliance on cosponsorship data to measure
deeper social relationships (Fowler 2006a, 2006b). Contrast this with a study such
as Sarbaugh-Thompson, et al. (2006), in which legislators (in this case, Michigan
State Representatives) are asked explicitly to name colleagues as friends, influentials,
and sources of policy advice. The great advantage of such an approach is that the
actors themselves are being queried about specific types of relationship. Drawbacks
include reliability issues (if, e.g., answers vary according to the timing of questions),
questionable sincerity of responses (or outright self-deception by respondents), and
8

limited scope or completeness (e.g., the impossibility of collecting historical data, or
the inevitable nonresponse that can be particularly damaging to network studies).
Given the availability of comprehensive cosponsorship records, coupled with the
impracticality of direct, complete observation of social contact among legislators, it
is awfully tempting to treat cosponsorship as a catch-all relational variable, reflecting
whatever social tie the researcher wishes to see. Although the case has elsewhere
been argued convincingly that cosponsorship is not (necessarily) cheap talk devoid of
meaning (see, e.g., Koger 2003), this meaning is hardly unambiguous. Is it an indicator
of how “connected” two legislators are, of a cosponsor’s “trust” for the sponsor, of
favors owed, of “social support” for the sponsor, all of which have been suggested
by various entries in the existing literature? Is it a sign of shared policy preferences
among cosponsors, manifested at a level of granularity not necessarily captured within
the reduced space of roll call votes? Is it a mixture of meaningful collaborations and
hollow symbolism? The answer may in fact depend upon the precise operationalization.
As sensitive as any analysis might be to the accuracy of these initial assertions
about the social meaning of cosponsorship, this sensitivity is only magnified once we
move beyond dyadic measurements to compound measures, such as various sorts of cen-
trality scores. For example, whether one employs one of the many available centrality
measures (degree, betweenness, closeness, eigenvector, etc.) or the more specialized
connectedness of Fowler as an indication of a legislator’s prestige, the usefulness of the
result depends not only upon correct interpretation of cosponsorship, but also on the
rules for combining this information in order to infer something like social distance. If
we are at all skeptical about the meaning at the dyadic level, we should be ever more
so when stringing these measurements together to measure how “far” apart legislators
are. Any validity or reliability problems at the dyadic level will only accumulate and
propagate up to the global level as additional choices are then made on how to actually
combine this information into distances.
Fowler (2006a) uses a geodesic conceptualization of distance, common in graph the-
9

ory and network analysis, so that the distance between two members of Congress is
defined as the shortest path connecting them, either directly or by way of colleagues,
summing weighted edges along the way. So even if senators A and B almost never
cosponsor each other’s bills, they may be considered proximate to one another if A
frequently cosponsor’s C’s legislative proposals and C frequently cosponsor’s B’s (espe-
cially if there are few other cosponsors on these proposals). Is this reasonable? Perhaps,
but it depends on our understanding of the relational construct at hand, our satisfac-
tion that it has been measured appropriately, and whether it makes sense to think
of the construct as being relayed through behavior of multiple intermediaries. If we
interpret cosponsorship in terms of support, should such support accrue in this second-
hand manner? Suppose A frequently cosponsors B’s bills and B frequently cosponsors
C’s bills, but A never cosponsors C’s bills. Suppose further that A cosponsors D’s
bills at a moderate level. Should A really be deemed more supportive of C, who she
never directly supports than of D, who she sometimes supports, in essence taking im-
plicit transitive support as more meaningful than explicitly expressed support, as we
are likely to do using the geodesic distance? This metric seems suspect; at least, an
argument needs to be made to justify the choice in this context. If the problem is
how to pass information to a target in the most efficient way, the geodesic makes per-
fect sense, and there are other situations in which the metaphor is apt. However, not
simply among political scientists but throughout social network analysis, we (present
authors included) have a tendency to borrow tools, measures, and models as if they
were universally applicable to all social relations.
We cite James Fowler’s work not because he is particularly egregious in this—quite
the opposite!—but because his work is the most comprehensive and prominent on the
subject. Indeed Fowler is well aware of the dangers of borrowing models and assump-
tions without question; his very purpose in Fowler (2006a) is to devise a measure that
is more appropriate to the specific data generating process likely at work in cospon-
sorship, and he works admirably to incorporate applicable information that would not
10

be taken into account by conventional measures. Yet, even in as thoughtful a contri-
bution as this, the careful reader cannot help feeling that some choices are being made
based purely on standard practice in the wider SNA literature even when justification
in the legislative setting may be weak. Should any common cosponsorship count as
a connection between legislators? Do we care about the content of the bill? If the
cosponsorship occurs many days apart (which is not uncommon) does that represent a
weaker connection? All of these choices play a critical role in the subsequent structure
of the network and measures of that structure.
As if the myriad measurement options were not daunting enough, the political sci-
entist wishing to analyze a legislature (or any political institution or organization)
as a network faces an even more fundamental consideration when moving beyond de-
scription to statistical inference. Whereas the pros and cons of various measures are
relatively easy to ascertain in most cases, problems of modeling social networks and
conducting statistical analyses based on these models continue to puzzle the bright-
est minds in theoretical statistics, despite the considerable progress of the past three
decades (see Carrington et al. (2005) for an overview of work from within the social
network analysis community). Having complete records of cosponsorship mercifully
relieves us of having to address the special challenge of missing data, but it does
not alleviate the need to consider how suitable our modeling choice is for the data-
generating process at hand. For the most part, popular models of social networks are
descriptive rather than generative.6 Exponential random graph models (ERGMs), for
example, are able to capture a number of structures considered essential to the network
at hand, controlling for higher-order interdependence, but may be a poor representa-
tion of the process through which ties are actually generated. This is not necessarily a
bad thing—the ubiquitous linear model estimated via OLS regression is typically but
an extremely convenient description rather than a sincere effort to reflect the manner
in which responses are generated. Still, in evaluating the choice of even a descrip-
6But see Airoldi et al. (2005,2008) for exceptions.
11

tive modeling framework, we are obligated to ask whether the features captured via
the model are meaningful for the research questions being asked. If the suitability of
model to real-world process rests on a metaphor, is the metaphor apt for the problem
at hand?
To make this concrete, consider the recent contribution by Tam Cho and Fowler
(2010), who base their analysis of legislative dynamics on the premise that Congress
may be fruitfully thought of as a small world network. They note a “rush to identify
small-world networks” in the wake of an influential article by Watts and Strogatz (1998)
formalizing small-world properties that had been invoked somewhat whimsically over
the years since Milgram (1967) made the so-called “small-world problem” famous. In
an effort to fill a gap in the literature concerning the impact of this particular type
of network topology on system dynamics, the authors add the United States House
of Representative to the growing list of networks to be considered from a small-world
perspective. As others before them have done, they extend the small world concept
beyond its original formulation; for Watts and Strogatz (1998), “[t]he networks of
interest to us have many vertices with sparse connections, but not so sparse that
the graph is in danger of becoming disconnected.” Absent from some more recently
analyzed examples of small world networks, including Congress, is an adherence to this
sparseness criterion. Extending the notion of a small world beyond the “large, sparse
network[s]” (Watts 2004) on which they were first rigorously defined may represent the
loss of a property of small worlds that made them so captivating to Milgram and other
social scientists before him, but it reflects an appeal of the metaphor that transcends
the initial setting from which it emerged. It also offers, in the current context, one tool
for thinking about the actual network dynamics of legislative collaboration.
A limitation of the small world framework in studying the dynamics of cospon-
sorship through time is the loss of information associated with the aggregation of
individual acts of cosponsorship into a static network. This perspective, in which any
act of cosponsorship in a session is treated as a persistent tie, in fact exaggerates the
12

density of the network by failing to distinguish between frequently collaborating pairs
and those who only rarely cosponsor together. In order to provide a somewhat differ-
ent perspective, we analyze the dynamic collective behavior of the U.S. House using
multiple measures at a far less aggregated level. We believe that this overcomes several
of the problems inherent in the study of cosponsorship networks over time and deepens
the insight provided by Tam Cho and Fowler (2010) and others.
4 A Theory: Congressional Network Adapta-
tion to Public Approval
Instead of viewing the network of cosponsorships aggregated across an entire ses-
sion, we treat the cosponsorship network as an evolving series of collaborative choices
that can change and adapt within sessions. These choices are responsive to both stimuli
from outside Congress and interactions within the chamber. We focus our efforts on
examining the influences of external stimuli on collaborative networks between legisla-
tors. Specifically, we develop and test competing hypotheses regarding the influence of
Congressional approval on legislative network topology. It is possible that institutional
approval by the public will promote a more collaborative institution, as legislators
attempt to alter public perceptions of discord within the legislature. Alternatively,
legislators may see low institutional approval coupled with their own electoral secu-
rity as evidence that the public desires a more active and combative membership, for
example if their own constituents support them but have a poor opinion of other MCs.
The first of our competing hypotheses builds on two key insights regarding the be-
havior of the House of Representatives as an institution. First, the public’s approval
of Congress is a function of the amount of discord in the Congressional body (Durr,
Gilmour, and Wolbrecht 1997, Ramirez 2009). When partisan conflict is high, the
public has an increasingly negative view of Congress as an institution. When the two
13

parties are more cooperative, Congressional approval is less negative (though Congres-
sional approval is never positive, strictly speaking). In fact, Wolak (2007) provides
evidence that the Congressional approval plays a key role in the total retirements
from the U.S. House of Representatives. Incumbents look to easily discernible national
trends to gauge their likelihood of success in re-election. Challengers consider these
trends when deciding the timing of a challenge. When Congressional approval is low,
incumbents can expect to suffer. It is in the re-election interests of incumbent legisla-
tors to maintain a high level of institutional approval, both to ward off challengers and
to improve their own electoral margins.
Thus, institutional conflict influences public approval of Congress and public ap-
proval of Congress directly influences micro-level Congressional member decisions through
electoral motivations. A simple extension of this logic would then imply that, when
conflict is high, and re-election at higher risk, members of Congress would adapt their
behavior to decrease conflict and improve their electoral odds. The majority party will
have particular incentive to reduce conflict in order to prevent retirements of majority
party members and risk losing majority party status.7 However, because institutional
approval has an influence on micro-level electoral chances for all members (and, thus,
micro-level decisions about retirement for all members), members from both parties
should face incentives to collaborate or cooperate more often in times of low institu-
tional approval.
From this, a model emerges in which approval provides a sort of moving target for
levels of partisan conflict. When institutional approval is high, parties have a sort of
permission from the public to engage in conflict without electoral repercussions, and
7McDermott and Jones (2003, 2005) and Jones (2010) indicate that Congressional approval is muchmore damaging to the majority party than to the minority party’s electoral outcomes, which might suggesta differential response in bipartisanship between the majority and minority party. However, Volden andBergman (2006) point out that majority parties have been sigificantly more cohesive as a group than minorityparties. Even if minority parties gain little from improving Congressional approval, their lack of cohesionmakes it simpler for the majority party to find potential cooperative partners. The parties may have differentresponses to low Congressional approval, but the majority party can create an image of bipartisanship mucheasier than the minority party can resist it.
14

day-to-day conflict may vary around that target. When approval is low, the target
level of conflict around which daily fluctuations may vary will decrease. Because this
negativity influences individual members’ electoral odds and decision making at the
margins, it may be difficult to uncover associations in individual behavior. Instead,
aggregate institutional behavior will manifest a shift in levels of cooperation as indi-
vidual legislators alter their behavior slightly in response to public demands for more
cooperation and less conflict. It requires only small changes in individual choices to
aggregate into a large change in institutional behavior.
Alternatively, Harbridge and Malhotra (2011) suggest that a bipartisan image of
Congress is beneficial in the eyes of weak partisans and independents, but is actually
damaging in the eyes of strong partisans. Strong partisans support bipartisanship as
an abstract concept, but prefer their own copartisans to “fight the good fight” against
the opposition. Their evaluations of incumbents from their own party decline when
told those incumbents are engaging in bipartisan behavior.8 Incumbents who engage
in bipartisan activity during times of low Congressional approval may appease weak
partisans and independents, but do so while also risking the support of their strong
partisan base. Since these strong partisans are both the most likely primary and general
election voters, this can be a dangerous strategy. Thus, when Congressional approval
is low and incumbents face threatening electoral circumstances, conflict is likely to
increase as incumbents attempt to secure the support of their most likely participants.
In this way, position taking (Mayhew 1973) and bipartisanship in Congress are targeted
responses not meant for the general population, but for a subset of loyal partisans.
These strongest partisans see collaborative bipartisanship as a compromise of partisan
ideals. In order to avoid losing the support of loyal partisans when it is most critical
(when institutional approval is low), members of Congress faced with low levels of
8This differing response by partisanship may be an explanation for the results reported in Morris andWitting (2001). These authors report that while partisan conflict did damage Congressional approval,bipartisanship did not improve Congressional approval. This may be because bipartisanship has differingeffects for strong partisans than weak partisans.
15

institutional support will actually amplify the levels of conflict they project.
Thus, a competing model emerges in which institutional approval provides a mov-
ing target for internal conflict in Congress, but with a negative relationship between
institutional approval and institutional conflict. When approval of Congress is high,
members have little incentive to fight with one another. Increasing institutional ap-
proval allows partisan conflict to slowly reduce itself. However, when institutional
approval is low, members will attempt to appeal to strong partisans by increasing
levels of conflict in the chamber. This increasing conflict will take time to emerge,
creating long-run dynamic interplay between institutional approval and high-conflict
legislating.
Previous research on the dynamic interplay of conflict and institutional approval
(Ramirez 2009) has focused on the number of partisan votes occurring in a quarter.
While this is a reasonable place to start, use of floor votes presents challenges in measur-
ing the degree of conflict in a legislature. First, votes are a strategically chosen subset
of possible issues on which conflict might emerge. Indeed, examining only floor votes as
a summary of legislative behavior will obscure conflict that might occur over whether
a bill is to receive a vote at all. Additionally, both conflict and collaboration are nec-
essarily relational concepts. A legislator must have an alter with whom to collaborate
or conflict. Thus, an examination of the influences of public approval on legislative
collaboration and conflict is more suited towards relational/network measures of or-
ganizational behavior. A network approach to the measurement of collaboration and
conflict will provide us with the ability to consider all types of collaborative adaptation
rather than just partisan/bi-partisan schisms. While inter-party conflict is certainly
a prominent type of conflict that might influence evaluations of Congress, one need
only consider the conflict between Tea Party and mainstream Republicans to observe
that conflict and contentious lawmaking can be a result of both intra and inter-party
divides.
The connection between institutional approval and institutional behavior is in terms
16

that are more specific, a connection between the public’s demand for, or opposition
to, collaborative legislating and the network of micro-level choices about collaboration
in the institution. The connection between public demand and networked behavior
emerges because of the electoral influence of institutional approval. As institutional
approval changes and the demand for collaborative lawmaking changes (and potentially
changes differentially), the network of collaboration between legislators ought to adapt
to reflect that demand.
5 Measurement of the Legislative Network, Op-
erationalized through Cosponsorship Behavior
5.1 Measuring the Collaboration Network
Each act of legislative cosponsorship offers a tantalizing bit of information, both
because it represents a quintessentially relational act and because of its lack of mea-
surement error, and sensitivity to changes over time. Contrast the observation that two
members of Congress have cosponsored a bill during the past week with the response of
these same two individuals to a hypothetical survey, in which they are asked to identify
the colleagues with whom they tend to collaborate. That an act of cosponsorship has
occurred is beyond doubt, that it occurred during a particular timeframe is also clear,
and while its meaning might be debated, the event transcends individual participants’
desire to frame or spin their actions.
Unfortunately, there is no shortage of ways in which to code cosponsorship. There
are two levels to the operationalization; even if we make the convincing case that
collaboration may be operationalized as cosponsorship, how exactly should a dyadic
cosponsorship relation be measured? One possible course of action is to consider two
colleagues linked if they have cosponsored even a single bill together. In research on
17

scientific collaboration, coauthor relationships are often coded in this way. But while
this may be entirely appropriate for coauthorship, typically an intensive process shared
by a small number of individuals, with most pairs of scientists never collaborating on
a paper, the nature of legislative cosponsorship is quite different. One criticism of
research on cosponsorship is that this may be an example of cheap talk (Koger 2003,
p. 232). We are not going to rehash the arguments on both sides, but starting from
the assumption that cosponsorship is not an empty act, it is at least a relatively
effortless act, beyond the mental calculus of risk avoidance. As a consequence, treating
a single instance of cosponsorship within a year’s worth of activity as indicative of an
underlying stable relation (a weak tie) yields a complete or virtually complete network,
with every legislator connected directly to every other. It is also true that there is great
variation in how many cosponsors appear on a piece of proposed legislation and this has
implications for the degree to which we might consider cosponsors as something akin
to coauthors. After all, that a bill has been cosponsored by just two representatives
should give us more information about the latent relationship between them than if
they had been but two among 150 cosponsors.
It has been common to consider cosponsorship as a relation from cosponsor to
sponsor; the sponsor has taken the lead and by supporting his or her bill, one is im-
plicitly supporting the sponsor as well. For a number of reasons, we will instead think
of the relational nature of cosponsorship as occurring among all cosponsors. Careful
consideration of the cosponsorship decision by an individual reveals it to be potentially
a function of two types of object: people (other cosponsors) and the bill itself. It is
possible (albeit unlikely) that legislators might sign their names to a proposal based
entirely on its content, without consideration of other cosponsors. Also possible but
not plausible is that they might cosponsor a bill purely based on the cosignatories. In
practice, these choices will be based on some combination of both sources of informa-
tion, along with one’s own openness to using cosponsorship as a tool. Cosponsorship
is thought of by both scholars and members as a means to signal positions on bills. As
18

such, the other cosponsors on a bill matter in that they convey additional information
about the bill’s contents.
To construct a sequence of cosponsorship networks over many small discrete win-
dows of time, or snapshots, we code a connection between two legislators, i and j if
legislators i and j have cosponsored the same piece of legislation within some short,
predetermined period of time. If we were examining 1-day windows of activity, then
a connection between legislators i and j would exist if i and j cosponsored the same
bill on the same day. We examine the sequence of networks constructed this way using
5-day, 10-day, and 15-day windows. Thus, using a 5-day window to measure networks,
on Day t, the cosponsorship network consists of all the cosponsorship activity occur-
ing in the 5 days leading up to and including Day t. On Day t + 1 a new network
emerges, slightly different than the network of the day before with all of the connec-
tions between legislators who collaborated on Day t − 5 being removed. If legislator
i cosponsors a bill five days before legislator j no tie will be recorded between them,
even if they sponsored the same legislation. This temporally disaggregated approach
dramatically increases the probability of observing genuinely coordinated behavior, as
legislators who cosponsor bills in temporal proximity to one another are much more
likely to be doing so for shared/similar reasons than legislators who cosponsor the
same piece of legislation many days apart. This discrete window approach also allows
cosponsorship relationships in the legislature to flicker on and off, rather than having
a single cosponsorship at the beginning of a legislative session continue to represent a
legislative relationship through an entire session.
It may be a bit too strict to insist that cosponsorship must occur on the same day
to be counted as link, as cosponsoring bills is hardly a top priority on a busy schedule,
and legislators may be away from Washington on any given day. However, we have a
second reason for measuring collaboration over a longer time window than just a single
day. The construct we are attempting to capture is collaboration; more specifically,
how does the distribution of collaborative relationships vary over time, and in response
19

to level of public support for the institution? Individual instances of cosponsorship
occur on a single day, but may be viewed as reflecting an unobserved relationship
that persists beyond the momentary manifestation. In fact, in quite concrete terms,
cosponsorship of a bill persists through time as the bill awaits further action (or, more
commonly, death by natural causes once the session ends). For two legislators to be
considered as maintaining a collaborative relationship, it should not be necessary for
them to jointly cosponsor a bill each day, but rather that a not unusually long period
of time pass between instances. Just as a friendship ought not be declared dead if
friends do not talk on a given day, a professional collaborative relationship should not
be considered defunct if some time passes in which two colleagues do not participate
in some joint enterprise. And, as with friendship, there is rarely a precise, agreed-upon
moment in which such a relationship ends (or is suspended); once typical patterns of
interaction are disrupted for a long enough period, however, we may be more bold in
asserting a change in the nature of this relationship.
We make no claim that our approach to network operationalization is the “most”
correct. We do believe that disaggregating the network into finer discrete time intervals
can teach us things that a more aggregated approach obscures, in particular how a leg-
islative chamber evolves in response to external stimuli. With any proximate measure
of a concept of interest, a number of approaches could be employed to test hypotheses
and relationships. The appropriate way to deal with this lack of validity is through
multiple measures and operationalizations. We provide several global network mea-
sures for our particular approach to the network, but recognize that there are several
other plausible ways to build a cosponsorship network from legislative behavior.
5.2 A Model of Network Adaptation
In order to test our predictions regarding the adaptation of Congressional con-
flict to institutional approval, we make use of two data sources: the Congressional
20

approval time series from Gallup Polls9 and Congressional Cosponsorship networks
(Fowler 2006a, Fowler 2006b).10 Once we have constructed our series of networks,
allowing the window of cosponsorship to vary, we extract a number of summary mea-
sures from each of these daily networks. Increased conflict or collaboration may have
various consequences for the topology of cosponsorship networks as we have measured
them. Our analysis focuses on the average path length, clustering coefficient, and
party modularity of cosponsorship on each day of the smoothed network series.11 Av-
erage path length (APL) measures the average shortest path between any two nodes,
which should increase as conflict within the chamber increases. Fewer cooperative ties
bridging important ideological divisions in the network should generate a longer APL.
When institutional approval of Congress does temper or enflame conflict in the ways
we expect, then as institutional approval declines, path length should change. When
institutional approval is especially low, MCs recognize a need for differing levels of
collaboration and adapt the network accordingly.
We measure the clustering coefficient as the average proportion of actors’ neighbors
who are themselves connected to each other (Tam Cho and Fowler 2010, Watts and
Strogatz 1998). As conflict increases, we expect that clustering in the network will also
change. If decreasing approval increases conflict, then as approval declines and legisla-
tors become less likely to work together clustering should decrease. Neighbors become
less likely to work together as the general level of conflict in the chamber increases. Al-
ternatively, if decreasing approval decrease conflict, then as approval declines clustering
should increase. Neighbors become much more likely to collaborate as collaboration
becomes increasingly common throughout the chamber.
9Polls for 2001-2007 can be found here: http://www.gallup.com/poll/28456/congress-approval-rating-matches-historical-low.aspx. Polls for 2008 were also found onGallup’s website.
10Cosponsorship data can be retrieved from the THOMAS database at: http://thomas.loc.gov/home/LegislativeData.php?&n=BSS, or on Fowler’s website at http://jhfowler.ucsd.edu/cosponsorship.htm.
11Recall that average path length and clustering are the component parts of small world Q.
21

Our final reported measure of the evolving topology of Congressional cosponsorship
is modularity based on partisan divisions. Modularity (Newman 2006) measures the
probability of within group connections in a network relative to the probability of
connections between any two actors in the network. The formula for modularity is:
Mod =1
2m
�
ij
[Aij −kikj2m
] ∗ δ(ci, cj) (1)
where m is the number of total connections in the network, Aij is the connection
between actors i and j, ki is the total number of connections actor i has, and δ(ci, cj)
is the Kroeneker delta for actors i and j.12 For party-based modularity, ci represents the
party affiliation of actor i. Thus, party modularity measures within party connections
relative to the connections that an analyst might expect at random between two actors
given the density of the network and the degree of the two actors. Taken together, these
three statistics represent a useful summary of the degree of conflict in the cosponsorship
network, which we expect to respond to changes in institutional approval.
Our theoretical model makes very specific predictions about the nature of the link
between public opinion and network topology. Public opinion generates a sort of mov-
ing target, to which micro behavior adapts and which aggregate topology tracks over
time. This moving target represents an equilibrium force around which network topol-
ogy may vary in the short run, but will converge towards in the long run. Thus, we
require a model capable of separating short-term covariance from long-term equilibrium
forces. The error-correction model provides just such a specification.
Error-correction models (ECM) are based in the logic of co-integration in time series
analysis, but as DeBoef and Keele (2008) note, are perfectly appropriate for analysis of
stationary data. In fact, the general error-correction model is simply a re-interpretation
of the auto-regressive distributed lag model (ADL). Both the ADL model and the ECM
estimate the same information, while the ECM allows researchers to access long run
12The Kroeneker delta is a mathematical function yielding a one if the two numbers upon which it operatesare equal to each other, and a zero otherwise.
22
effects more easily.13 The general error-correction specification is as follows:
∆Yt = α0 + α1Yt−1 + β0∆Xt + β1Xt−1 + �t (2)
The model represents the short-term effects of X on Y through β0. We expect the
short-run effects of institutional approval on network topology to be indistinguishable
from zero; there is no reason to suppose cosponsorship patterns will be sensitive to
short-term fluctuations in opinion polls, which are themselves a noisy indicator of
support. The long-run multiplier for the effect of X on Y is:
k =β1−α1
(3)
The long-run multiplier represents the total effect of some X variable on Y. This total
effect is distributed over time with the long-run effects occurring at the error-correction
rate given by −α1. If a long-run multiplier is equal to one and has an error correction
rate of 0.5, then a unit change in X eventually produces a total of a one-unit change
in Y. In the first time period following the change in X, Y will change by 0.5. In the
second time period, Y will change by 0.25. In the third time period following change,
Y will change by 0.125 and so on until Y has taken on the full one unit change and
reaches its new equilibrium. Thus, X possesses some immediate or contemporaneous
effect on Y, but also possesses some effect on Y that occurs over time. As X changes,
it disturbs the equilibrium of Y, which then slowly adapts to a new equilibrium.
Error-correction models are gaining popularity in political science. Their ability to
estimate both short-term covariance and long-term equilibration make them a powerful
tool. Indeed, some of the most recent work on the relationships between public opinion
and the behavior of elite political actors features error-correction specifications (Ura
and Wohlfarth 2010, Ramirez 2009, DeBoef and Keele 2008, Jennings and John 2009).
13These long-run equilibrium effects are perfectly captured by ADL models, but require a bit more algebrato calculate, while the ECM specification allows for the direct estimation of a long-run effect.
23

Based on our outlined theory, we expect that Congressional approval will have no short-
run effect on the measured structure of Congressional cosponsorship networks, but will
have a statistically distinguishable long-run effect on these networks. Specifically, as
institutional approval declines and incumbents perceive a risk to their re-election goals,
they will slowly adapt the level of conflict in the chamber in an effort to improve their
electoral fortunes.
6 Results and Discussion
Before proceeding to our model results, we present the descriptive statistics from
our models in Table 1. We report the means of the variables of interest in our models
and the standard deviations (in parentheses). Not surprisingly, the variance in each
of the network measures decreases as the measurement window we utilize increases.
Lengthening the measurement window creates a smoother series in which the value on
any day t is more closely related to the network summary on day t−1. This smoothing
of the series decreases the variability in the network measures. Because the number
of bills introduced on a particular day and the approval of Congress on a day are not
network measures and can be assessed directly, we leave those values unsmoothed.
It is also worth noting that as the size of the measurement window increases, the
number of communities detectable in the cosponsorship network decreases quickly.
This seems to indicate that in any brief period of time, the low-dimensional structure
of legislative choices may be hard to detect, while aggregation of many choices makes
that phenomenon easier to spot (Crespin and Rohde 2010).
Below we present results from error-correction models predicting the average path
length of the evolving Congressional cosponsorship network from 2001-2008. As dis-
cussed in the previous section, we aggregate daily network activities into windows of
different lengths of time. Thus, we include cosponsorships from several consecutive
workdays in the same network. Our tables present results from windows of 5-, 10-, and
24

Table 1: Descriptive Statistics in Three Difference Measurement Windows
Variable Name 5-Day Model 10-Day Model 15-Day Model
Average Path Length 1.814 1.552 1.404(0.230) (0.167) (0.138)
Clustering Coefficient 0.639 0.686 0.738(0.076) (0.071) (0.069)
Partisan Modularity 0.146 0.125 0.100(0.058) (0.051) (0.045)
Number of Communities 37.901 16.126 12.292(31.857) (12.312) (5.118)
Congressional Approval 39.203 39.203 39.203(14.173) (14.173) (14.173)
Number of Bills Introduced 143.139 143.139 143.139(79.402) (79.402) (79.402)
Table reports the mean values of the variable in the measurement window with the stadard deviationof the variable in parantheses. Congressional approval and the number of bills introduced do notvary by measurement window because we recorded their values on the day in question. They arenot latent concepts in need of smoothing, but are instead measured directly.
15-day periods. For example, for 5-day windows, the cosponsorship network on Day
t represents the aggregation of cosponsorship activity from 5 days before Day t up to
Day t. We include the number of bills introduced during each window as a covariate,
along with Congressional approval as measured by Gallup. We include the former be-
cause it seems likely that the cosponsorship network is fundamentally affected by the
number of opportunities for cosponsorship between legislators that might exist. The
error-correction specification dictates that both the differenced and lagged values of
the independent variables be included to separate out short-run and long-run effects.
Table 1 presents the results of error-correction models predicting the average path
length of the cosponsorship network for three different time windows.14 As predicted,
14It is common in studies of average path length and clustering coefficients to normalize these quantities bymeasuring the same quantity on a randomly generated graph with the same number of nodes and edges withthe edges placed randomly across the network. We elect not to normalize these measures for two reasons.First, this sort of a normalization assumes that a random graph is an appropriately conservative null modelagainst which a researcher should compare a graph of interest. It seems unlikely to us that a cosponsorshipnetwork between strategic actors would ever appear completely random, and thus, a null model comparison
25

the coefficient on the difference in Congressional approval is insignificant, which indi-
cates that Congressional approval has no measurable short-run effects on the average
path length of the cosponsorship network. However, the coefficient on the lagged value
of Congressional approval is negative and statistically distinguishable from zero in each
of the models presented. Coupled with a significant lagged dependent variable, this
indicates that Congressional approval has a long-run, equilibrating effect on the av-
erage path length of the cosponsorship network. Additionally, the negative value on
the long-run multiplier for Congressional approval indicates that when Congressional
approval decreases, the average path length of the cosponsorship network increases.
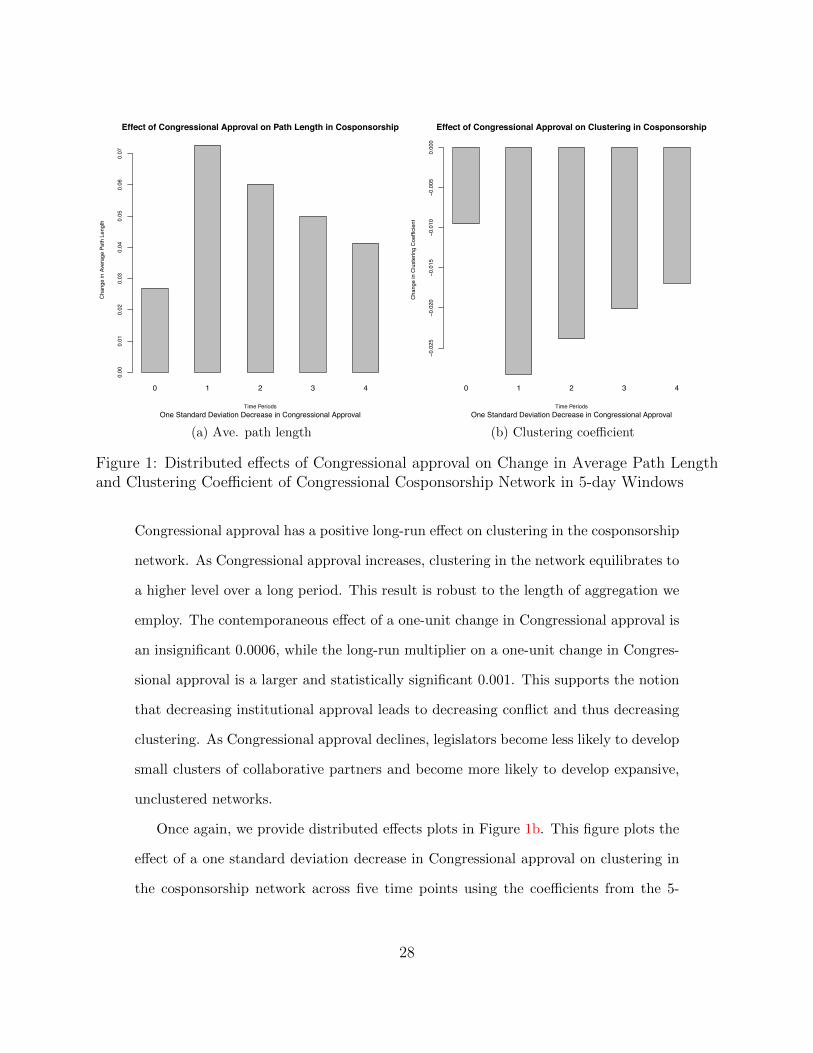
Error-correction specifications are capable of providing estimates of several types
of dynamic effects all within the same model.15 This can make the direct interpreta-
tion of coefficients somewhat difficult. As such, Figure 1a plots the effects of a one
standard deviation decrease in Congressional approval over 5 time points using the
coefficients from the 5-day model in Table 1. This figure helps demonstrate the pro-
nounced differences in the immediate and long-term effects of changes in Congressional
approval. The contemporaneous change in average path length due to a one standard
deviation decrease in Congressional approval is an indistinguishable increase in average
path length.16 The subsequent changes in average path length due to changes in Con-
gressional approval are large individually, and they are the result of an equilibrating
process that distributes the cumulative long run multiplier over many periods of time.
For this model, the long-run multiplier for a one-unit change in Congressional approval
of a cosponsorship network to a random graph does not seem overly especially. Instead, we use a dynamicmodel that compares today’s cosponsorship network to yesterday’s, effectively making the null model ofcomparison yesterday’s network. This is a much more stringent and realistic null comparison. Additionally,our empirical model is an error correction model, which utilizes the difference in Y as the dependent variable.If we were to normalize the path length or clustering coefficient and then use a model to predict the differencein these normalized quantities, it would be unclear whether the quantity of interest (path length for example)was changing, or whether the denominator of the normalized quantity was changing.
15See DeBoef and Keele (2008) for proper calculation of long-run multipliers, interpretation of effects fromerror-correction models, and the creation of distributed lag effects plots. Recall that long-run multipliers arethe ratio of the lagged independent variable of interest over the negative of the lagged dependent variable.
16For all of our subsequent interpretations we begin at the mean value of Congressional approval of 39.2and move one standard deviation down to an Approval level of 25.03.
26
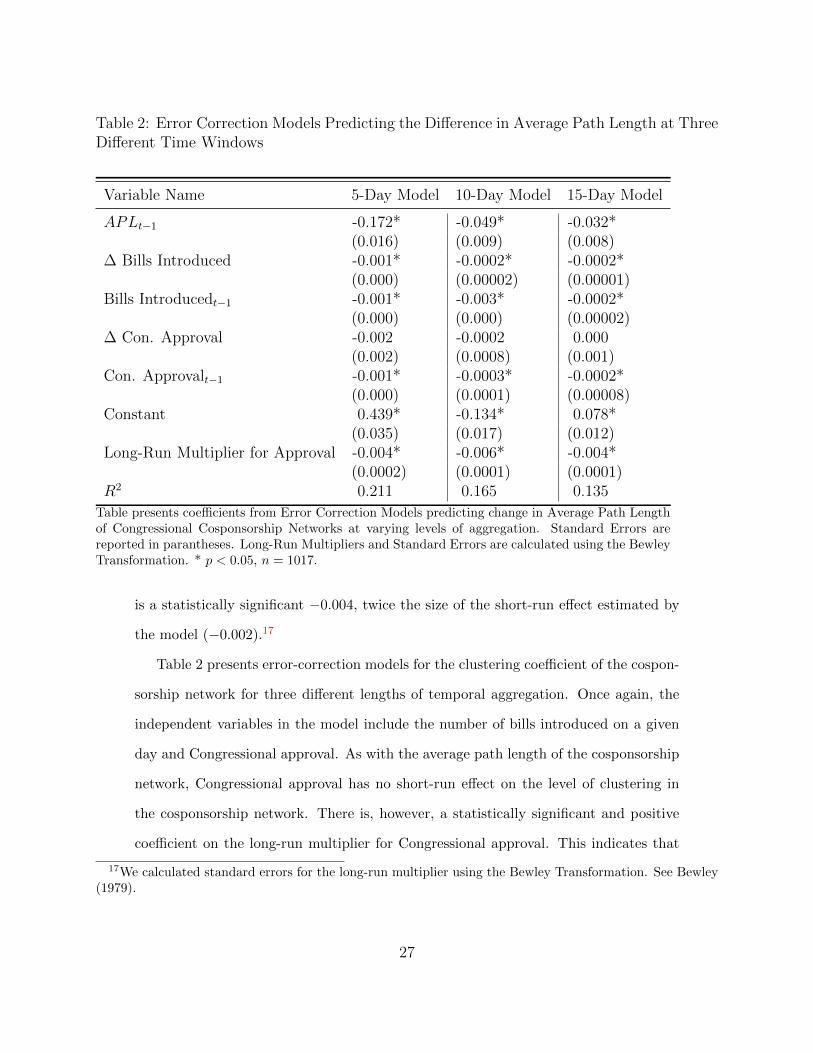
Table 2: Error Correction Models Predicting the Difference in Average Path Length at ThreeDifferent Time Windows
Variable Name 5-Day Model 10-Day Model 15-Day Model
APLt−1 -0.172* -0.049* -0.032*(0.016) (0.009) (0.008)
∆ Bills Introduced -0.001* -0.0002* -0.0002*(0.000) (0.00002) (0.00001)
Bills Introducedt−1 -0.001* -0.003* -0.0002*(0.000) (0.000) (0.00002)
∆ Con. Approval -0.002 -0.0002 0.000(0.002) (0.0008) (0.001)
Con. Approvalt−1 -0.001* -0.0003* -0.0002*(0.000) (0.0001) (0.00008)
Constant 0.439* -0.134* 0.078*(0.035) (0.017) (0.012)
Long-Run Multiplier for Approval -0.004* -0.006* -0.004*(0.0002) (0.0001) (0.0001)
R2 0.211 0.165 0.135Table presents coefficients from Error Correction Models predicting change in Average Path Lengthof Congressional Cosponsorship Networks at varying levels of aggregation. Standard Errors arereported in parantheses. Long-Run Multipliers and Standard Errors are calculated using the BewleyTransformation. * p < 0.05, n = 1017.
is a statistically significant −0.004, twice the size of the short-run effect estimated by
the model (−0.002).17
Table 2 presents error-correction models for the clustering coefficient of the cospon-
sorship network for three different lengths of temporal aggregation. Once again, the
independent variables in the model include the number of bills introduced on a given
day and Congressional approval. As with the average path length of the cosponsorship
network, Congressional approval has no short-run effect on the level of clustering in
the cosponsorship network. There is, however, a statistically significant and positive
coefficient on the long-run multiplier for Congressional approval. This indicates that
17We calculated standard errors for the long-run multiplier using the Bewley Transformation. See Bewley(1979).
27
0 1 2 3 4
Time Periods
Cha
nge
in A
vera
ge P
ath
Leng
th
0.00
0.01
0.02
0.03
0.04
0.05
0.06
0.07
Effect of Congressional Approval on Path Length in Cosponsorship
One Standard Deviation Decrease in Congressional Approval
(a) Ave. path length
0 1 2 3 4
Time PeriodsC
hang
e in
Clu
ster
ing
Coe
ffici
ent
−0.0
25−0
.020
−0.0
15−0
.010
−0.0
050.
000
Effect of Congressional Approval on Clustering in Cosponsorship
One Standard Deviation Decrease in Congressional Approval
(b) Clustering coefficient
Figure 1: Distributed effects of Congressional approval on Change in Average Path Lengthand Clustering Coefficient of Congressional Cosponsorship Network in 5-day Windows
Congressional approval has a positive long-run effect on clustering in the cosponsorship
network. As Congressional approval increases, clustering in the network equilibrates to
a higher level over a long period. This result is robust to the length of aggregation we
employ. The contemporaneous effect of a one-unit change in Congressional approval is
an insignificant 0.0006, while the long-run multiplier on a one-unit change in Congres-
sional approval is a larger and statistically significant 0.001. This supports the notion
that decreasing institutional approval leads to decreasing conflict and thus decreasing
clustering. As Congressional approval declines, legislators become less likely to develop
small clusters of collaborative partners and become more likely to develop expansive,
unclustered networks.
Once again, we provide distributed effects plots in Figure 1b. This figure plots the
effect of a one standard deviation decrease in Congressional approval on clustering in
the cosponsorship network across five time points using the coefficients from the 5-
28

day model in Table 2. When Congressional approval decreases, there is an immediate
decrease in the level of clustering in the network. This immediate decrease is statis-
tically indistinguishable from zero and precedes a series of decreases in clustering in
the periods following the change in Congressional approval. A one standard deviation
decrease in Congressional approval corresponds to an immediate 0.009 unit decrease in
clustering in the cosponsorship network at t = 0. The larger long-run change cumulates
over time with a decrease of 0.028 occurring at t = 1 and a decrease of 0.023 occurring
at t = 2. This will continue until the full long-run effect of a one standard deviation
decrease from the mean of Congressional approval is cumulated, and the equilibrium
level of clustering is reached. Notice that the estimated long-run multiplier is nearly
twice the size of the contemporaneous change in clustering. Also, given the slow rate
of equilibration, this process will take many days to manifest the total effect of the
equilibrium shift indicating a lengthy long-run effect.
Each of the models we report uses network summary statistics as dependent vari-
ables. As such the interpretation of the magnitude of effects is somewhat difficult. A
decrease of 0.028 in the clustering coefficient is a not a particularly intuitive quantity.
To aid in the interpretation of effects, we have generated networks of 435 actors which
take on certain network characteristics, and then describe the behavior change neces-
sary to produce the change in network statistics reported by the models. For example,
we report in Table 1 that the mean of the clustering coeffecient for the 5-day mea-
surement window is approximately 0.64. In a simulated network of 435 actors, with
a density equal to the mean density of the cosponsorship networks in our 5-day mea-
surement windows (0.6), this mean level of clustering is akin to saying that an actor’s
neighbors have a 78% chance of being connected to one another.18 A change of −0.028
in the clustering coefficient from its mean level (the decrease in clustering produced by
a one standard deviation decrease in Congressional approval), is equivalent to saying
18As stated earlier, clustering in a network is a measurement of how often one’s neighbors are connectedto one another.
29

Table 3: Error Correction Models Predicting the Difference in Clustering Coefficient at ThreeDifferent Time Windows
Variable Name 5-Day Model 10-Day Model 15-Day Model
Clusteringt−1 -0.157* -0.073* -0.046*(0.017) (0.012) (0.008)
∆ Bills Introduced 0.0001* 0.0001* 0.0001*(0.0000) (0.0000) (0.0000)
Bills Introducedt−1 0.0001 0.0001* 0.0001*(0.0000) (0.0000) (0.0000)
∆ Con. Approval 0.0006 -0.0002 0.0000(0.0007) (0.0004) (0.0000)
Con. Approvalt−1 0.0002* 0.0001* 0.0001*(0.0000) (0.0000) (0.0000)
Constant 0.075* 0.033* 0.020*(0.016) (0.008) (0.006)
Long-Run Multiplier for Approval 0.001* 0.002* 0.002*(0.0001) (0.0001) (0.0000)
R2 0.105 0.072 0.096Table presents coefficients from Error Correction Models predicting change in the Clustering Coef-ficient of Congressional Cosponsorship Networks at varying levels of aggregation. Standard Errorsare reported in parantheses. Long-Run Multipliers and Standard Errors are calculated using theBewley Transformation. * p < 0.05,n = 1017.
30

that an actor’s neighbors have only a 62% chance of being connected to one another.
This is still a high degree of clustering, but an sixteen percentage point decrease the
probability that neighbors are connected to one another seems substantial to us.19
Similarly, we can interpret the decrease in the average path length of a network as
the change in behaviors that would result in the change in the network characteristics
observed. A one standard deviation decrease in Congressional approval would increase
the average path length of the cosponsorship network by −14.17×0.004 = 0.057. Thus,
this would move the cosponsorship network from its mean average path length of 1.814
to an average path length of 1.871. We again start out with a network of 435 actors and
randomly distribute connections in the network until the density of the network reaches
the mean level of density in the Congressional cosponsorship networks. A increase in
the average path length of this network of 0.057 is equivalent to the creation of 140
new/unobserved dyadic connections in the network that had not previously existed.
These new connections shorten the path across the network.20
Coupled with the results from the clustering coefficient analyses, these results indi-
cate that when Congressional approval decreases, the cosponsorship network becomes
less clustered and longer. When approval is low, representatives are more likely to
cosponsor partners outside of their dense clusters of common collaborators and distance
between actors in the network grows. The distance in the network is likely growing be-
cause clustering is breaking down, making bridging connections across group divisions
less efficient ways of shortening the network. Seemingly, the cosponsorship network is
adapting to Congressional approval. We take these results as inital indications that
the cosponsorship network is becoming less contentious. Clusters are breaking down
and distance between actors in the network is increasing as a result. These results
are in keeping with our hypothesis that low Congressional approval creates an incen-
tive towards collaboration, but a more fine grained analysis focused specifically on
19Code to demonstrate these simulated networks can be provided upon request.20Of course, this can be accomplished with fewer than 140 actors because the same actor may generate
multiple new connections.
31

partisanship can be crafted.
Our next two analyses focus on the community structure of cosponsorship. Table
3 presents error-correction models predicting the difference in partisan modularity of
the Congressional cosponsorship network at three different levels of aggregation. Ta-
ble 4 presents error-correction specifications predicting the difference in the number of
communities detected in Congressional cosponsorship at three different levels of aggre-
gation. We calculate the number of communities in the cosponsorship network using
the “fastgreedy” algorithm of Clauset, Newman, and Moore (2004). We allow the
“fastgreedy” algorithm to search for the optimal partition of the network and count
the number of communities that emerge out of the network partition with the highest
modularity. We supplement partisan modularity scores with this count of communities
detected because the break down in clustering and cooperation may occur within par-
ties, across parties, or in groups orthogonal to parties. Thus, a modularity score that
is explicitly examining partisan conflict may miss other types of conflict that emerge
in the chamber.
While the contemporaneous coefficients for Congressional approval presented in
Table 3 are themselves insignificant, the long-run multiplier for the effect of a change
in Congressional approval (measured as the ratio of the coefficient on lagged Congres-
sional approval over the negative lagged dependent variable) is a statistically significant
0.0004. This, combined with the results of the error-correction model’s short-run ef-
fects indicates that a one standard deviation decrease in Congressional approval from
the mean is associated with a 0.0063 long-run decrease is partisan modularity. While
this effect is not substantively impressive (a drop of one-ninth of a standard deviation
in modularity for a one standard deviation decrease in approval), it is distinguishable
from zero and an indication of the role played by declining institutional approval in
creating a less contentious, more collaborative network.21
21This result also demonstrates the importance of the full interpretation of error-correction models. Thesemodels contain information on two short-run effects and a long-run effect that require some post-modelcalculations to properly interpret. The coefficients from lagged and differenced Congressional approval do
32

Table 4: Error Correction Models Predicting the Difference in Party Modularity at ThreeDifferent Time Windows
Variable Name 5-Day Model 10-Day Model 15-Day Model
Modularityt−1 -0.178* -0.056* -0.036*(0.018) (0.011) (0.008)
∆ Bills Introduced -0.00003* -0.00003* -0.00003*(0.00001) (0.00001) (0.00000)
Bills Introducedt−1 -0.00003 -0.00002* -0.00002*(0.00002) (0.00001) (0.00001)
∆ Con. Approval 0.0002 0.0003 -0.00004(0.0006) (0.0003) (0.0002)
Con. Approvalt−1 0.0001 0.00001 0.00000(0.0001) (0.00004) (0.00002)
Constant 0.027* 0.011* 0.007*(0.006) (0.002) (0.002)
Long-Run Multiplier for Approval 0.0004* 0.0001* 0.0001*(0.0001) (0.0000) (0.0000)
R2 0.091 0.048 0.051Table presents coefficients from Error Correction Models predicting change in the Party Modularityof Congressional Cosponsorship Networks at varying levels of aggregation. Standard Errors arereported in parantheses. Long-Run Multipliers and Standard Errors are calculated using the BewleyTransformation. * p < 0.05,n = 1017.
Figure 2 plots the distributed effects of a one standard deviation decrease in Con-
gressional approval on partisan modularity. Initially, the contemporaneous effect of
a decrease in approval is a small decrease in partisanship, but an insignificant one.
Over time, the cosponsorship network becomes less partisan in response to decreases
in Congressional approval. With the total change in partisanship over many time
points (0.0004) being twice the size of the contemporaneous effect (0.0002). Interpret-
ing the magnitude of effects in the modularity model can be difficult. Long-run and
short-run effects combine to produce changes in modularity, and modularity itself is a
balance of within versus across party connection density. As mentioned, a one stan-
not indicate any effects of Congressional approval on modularity, but error-correction models allow for morenuanced interpretations and effects. Much like interaction or conditional coefficients, the effects directlyreported by the model are insufficient statistical interpretations.
33

0 1 2 3 4
Time Periods
Cha
nge
in th
e Pa
rtisa
n M
odul
arity
in th
e C
ospo
nsor
ship
Net
work
−0.0
08−0
.006
−0.0
04−0
.002
0.00
0
Effect of Approval on Partisan Modularity in Cosponsorship
One Standard Deviation Decrease in Congressional Approval
Figure 2: Distributed effects of Congressional approval on Change in Partisan Modularityin the Congressional Cosponsorship Network in 5-day Windows
dard deviation decrease in Congressional approval corresponds to a decrease of 0.0063
in partisan modularity in the 5-day model. In a network of 435 actors with 50 within
party cosponsorships and 54 cross-party cosponsroships, this change in modularity is
roughly equivalent to two additional cross-party cosponsorships in a 5-day period or a
decrease of two within party cosponsorships in either party.
Finally, Table 4 indicates that Congressional approval consistently exhibits a long-
run relationship with the number of communities in the cosponsorship network. The
analysis of the number of communities discovered by “fastgreedy” in the cosponsorship
34

network indicates that Congressional approval lacks a discernible contemporaneous ef-
fect, but does have a long-run equilibrating effect on the community structure of the
cosponsorship network. In the 5-day model, the contemporaneous effect of a one-unit
change in Congressional approval is a statistically insignificant 0.05, while the long-run
multiplier is a statistically significant −0.739. This indicates that over time as Congres-
sional approval decreases, the number of detectable communities in the cosponsorship
network equilibrates to a larger number. However, notice that the relationship changes
signs as the level of aggregation changes. This would seem to indicate that the nature
of the relationship between the number of detectable communities in cosponsorship
networks and institutional approval is unstable and is sensitive to the kind of aggrega-
tion employed in the creation of the network. While this would seem to mean that this
result is not a particularly useful evaluation of our theory, it does demonstrate that the
choices in operationalizing the cosponsorship network are critical. Network constructs
are sensitive to these choices and different operationalizations can lead to dramatically
different results.22
Taken together, these results indicate that when Congressional approval decreases,
the cosponsorship network responds by becoming less clustered, becoming longer, and
becoming less partisan. When popular opinion of Congress declines, cosponsorship
clusters break down and representatives work outside of otherwise stable clusters, the
distance in the network grows, and most importantly, partisanship declines. We take
these as evidence that 1) the cosponsorship network is adapting to changes in popular
22The R2 from our models may seem low, but as mentioned earlier, the dependent variable in a error cor-rection model is the change in Y . Thus, the amount of variance explained by a a model is not an overly usefulmetric for evaluating error correction model fit. However, error-correction model is a re-operationalization ofthe auto-regressive distributed lag model (ADL), where the ADL model predicts outcome variables using alagged dependent variable and contemporaneous and lagged independent variables. The ADL and ECM areequivalent models with different algebraic manipulations (Deboef and Keele 2008). If we re-run our modelsas ADLs rather than ECMs, the R2 from our 5-day clustering coefficient model is 0.723, the R2 from our5-day path length model is 0.764, the R2 from our modularity model is 0.682, and finally the R2 from ourcommunities model is 0.846. The R2 values all increase as we move from the 5-day models to the 10-day and15-day models with 3 of the 4 15-day models having R2 values over 0.90. Thus, our models have strongerpredictive power than the R2 from the ECMs suggest.
35

Table 5: Error Correction Models Predicting the Difference in the Number of DetectableCommunities at Three Different Time Windows
Variable Name 5-Day Model 10-Day Model 15-Day Model
Communitiest−1 -0.106* 0.018* 0.018(0.013) (0.010) (0.011)
∆ Bills Introduced -0.077* -0.010* -0.003*(0.005) (0.002) (0.001)
Bills Introducedt−1 -0.084* -0.013* -0.004*(0.007) (0.002) (0.001)
∆ Con. Approval 0.050 0.058 -0.003(0.221) (0.064) (0.030)
Con. Approvalt−1 -0.078* -0.015* -0.004(0.029) (0.008) (0.004)
Constant 19.61* 2.354* 0.607*(1.976) (0.576) (0.307)
Long-Run Multiplier for Approval -0.739* 0.829* 0.193*(0.032) (0.012) (0.005)
R2 0.198 0.049 0.023Table presents coefficients from Error Correction Models predicting change in the Number of Com-munities detected by the “fastgreedy” algorithim for Congressional Cosponsorship Networks at vary-ing levels of aggregation. Standard Errors are reported in parantheses. Long-Run Multipliers andStandard Errors are calculated using the Bewley Transformation. * p < 0.05, n = 1017.
36
opinion of the institution and 2) when Congressional approval declines, legislators re-
spond by becoming less contentious and more willing cooperative partners. That the
partisan nature of the cosponsorship network in the U.S. House weakens in the face of
declining Congressional approval would seem to be strong evidence that as Congres-
sional approval declines, representatives adapt by working together across ideological
lines more often.
7 Conclusion
We set out to convince the reader that (1) legislative scholars would be wise to
use caution when borrowing network theories and tools from network science, and (2)
once this caution is exercised, cosponsorship can teach us interesting things about a
legislature. Compound global measures of social networks, like any measure or model,
carry assumptions that should not be ignored. For example the small world measure
Q may have limited appeal in especially dense networks in which variation in Q is
highly constrained and potentially less meaningful than in sparser networks. The U.S.
House of Representatives’ cosponsorship activity over an entire legislative session does
not represent such a sparse network, at least if any act of cosponsorship constitutes a
tie between Representatives. Thousands of bills are introduced each session, many of
which have hundreds of cosponsors on them.
As an alternative, rather than considering cosponsorship across an entire session, we
disaggregate the cosponsorship network into smaller discrete time intervals. By break-
ing the network down into weeks of activity, we overcome problems of density, and by
using multiple measures, we protect ourselves against measure-dependent inferences.
We then offer an examination of the dynamic nature of collaboration in the U.S. House
and uncover that collaborative legislative networks are highly responsive to external
stimuli in many ways. As institutional approval of Congress declines, the cosponsor-
ship network tends to become less conflictual indicated by a longer path length, lower
37

levels of clustering, and lower party modularity. This decreasing conflict is driven by
electoral incentives. Incumbents wish to alter the perception of their institution be-
cause that perception has important influences on electoral events like the emergence
of challengers and the retrospective choices of voters. Previous work on Congressional
approval has recognized that a link exists between the electoral fortunes of incumbents
and Congressional approval. We have simply taken the next step by examining how
legislators then respond to that changing environment. These responses occur over a
long period of time, but are certainly there. Thus, collaborative networks in the U.S.
House are dynamic phenomena, changing in time in predictable ways.
Moving forward, we hope to see the analysis of cosponsorship networks increase.
There is no doubt that both micro and macro patterns in cosponsorship contain valu-
able insights into legislative behavior and processes. Social network tools and theories
can provide extremely useful ways to examine an environment highly characterized
by interdependent behaviors. Nevertheless, legislative scholars must move with some
caution. As with any new methodological tool, the choices and assumptions we make
as analysts play a critical role in the results we observe.
38

References
Barabasi, A. (2003). Linked: How everything is connected to everything else and what
it means. Plume.
Bernard, H. and P. Killworth (1977). Informant accuracy in social network data ii.
Human Communication Research 4 (1), 3–18.
Bernard, H., P. Killworth, and L. Sailer (1980). Informant accuracy in social network
data iv: A comparison of clique-level structure in behavioral and cognitive network
data. Social Networks 2 (3), 191–218.
Bernard, H., P. Killworth, and L. Sailer (1982). Informant accuracy in social-network
data v. an experimental attempt to predict actual communication from recall data.
Social Science Research 11 (1), 30–66.
Bewley, R. (1979). The direct estimation of the equilibrium response in a linear dynamic
model. Economics Letters 3 (4), 357–361.
Bogue, A. and M. Marlaire (1975). Of mess and men: The boardinghouse and Con-
gressional voting, 1821-1842. American Journal of Political Science 19 (2), 207–230.
Burkett, T. (1997). Cosponsorship in the United States Senate: A network analysis
of Senate communication and leadership, 1973-1990. Ph. D. thesis, Department of
Sociology, University of South Carolina.
Caldeira, G. and S. Patterson (1988). Contours of friendship and respect in the legis-
lature. American Politics Research 16 (4), 466.
Caldeira, G. A., J. A. Clark, and S. C. Patterson (1993). Political respect in the
Legislature. Legislative Studies Quarterly 18 (1), 3–28.
Caldeira, G. A. and S. C. Patterson (1987). Political friendship in the Legislature. The
Journal of Politics 49, 953–975.
39

Campbell, J. E. (1982). Cosponsoring legislation in the U.S. Congress. Legislative
Studies Quarterly 7 (3), 415–422.
Carrington, P., J. Scott, and S. Wasserman (2005). Models and methods in social
network analysis. Cambridge Univ Press.
Clauset, A., M. Newman, and C. Moore (2004). Finding community structure in very
large networks. Physical Review E 70 (6), 066111.
Conover, M., J. Ratkiewicz, B. Gonclaves, A. Flammini, and F. Menczer (2011). Po-
litical polarization on Twitter. In Proceedings of the 5th International Conference
on Weblogs and Social Media, pp. 89–96.
Crespin, M. and D. Rohde (2010). Dimensions, issues, and bills: Appropriations voting
on the house floor. Journal of Politics 72 (4), 976–989.
De Boef, S. and L. Keele (2008). Taking time seriously. American Journal of Political
Science 52 (1), 184–200.
Durr, R., J. Gilmour, and C. Wolbrecht (1997). Explaining Congressional approval.
American Journal of Political Science 41 (1), 175–207.
Faust, K. and J. Skvoretz (2002). Comparing networks across space and time, size and
species. Sociological Methodology 32, 267–299.
Fowler, J. H. (2006a). Connecting the Congress: A study of cosponsorship networks.
Political Analysis 14 (4), 456–487.
Fowler, J. H. (2006b). Legislative cosponsorship networks in the U.S. House and Senate.
Social Networks 28 (4), 454–465.
Freeman, L. (2004). The development of social network analysis. Empirical Press.
40

Gross, J. H. (2010). Cues and Heuristics on Capital Hill: Relational Decision-Making
in the United States Senate. Ph. D. thesis, Carnegie Mellon University.
Guimera, R., B. Uzzi, J. Spiro, and L. Amaral (2005). Team assembly mechanisms de-
termine collaboration network structure and team performance. Science 308 (5722),
697.
Handcock, M., A. Raftery, and J. Tantrum (2007). Model-based clustering for social
networks. Journal of the Royal Statistical Society: Series A (Statistics in Soci-
ety) 170 (2), 301–354.
Harbridge, L. and N. Malhotra (2011). Electoral incentives and partisan conflict in
congress: Evidence from survey experiments. American Journal of Political Sci-
ence 55 (3), 494–510.
Hoff, P. D. (2004). Modeling dependencies in international relational networks. Political
Analysis 12 (2), 160–175.
Hoff, P. D., A. E. Raftery, and M. S. Handcock (2002). Latent space approaches to
social network analysis. Journal of the American Statistical Association 97 (460),
1090–1098.
Jennings, W. and P. John (2009). The dynamics of political attention: Public opinion
and the Queen’s speech in the United Kingdom. American Journal of Political
Science 53 (4), 838–854.
Jones, D. (2010). Partisan polarization and Congressional accountability in House
elections. American Journal of Political Science 54 (2), 323–337.
Kessler, D. and K. Krehbiel (1996). Dynamics of cosponsorship. The American Political
Science Review 90 (3), 555–566.
41

Killworth, P. and H. Bernard (1980). Informant accuracy in social network data iii:
A comparison of triadic structure in behavioral and cognitive data. Social Net-
works 2 (1), 19–46.
Kirkland, J. H. (2011). The relational determinants of legislative success: Strong and
weak ties between legislators. Journal of Politics 73 (3).
Koger, G. (2003). Position taking and cosponsorship in the U.S. House. Legislative
Studies Quarterly 28 (2), 225–246.
McClurg, S. and J. Young (2011). Political networks. PS: Political Science & Poli-
tics 44 (01), 39–43.
McDermott, M. and D. Jones (2003). Do public evaluations of Congress matter?
American Politics Research 31 (2), 155.
McDermott, M. and D. Jones (2005). Congressional performance, incumbent behavior,
and voting in Senate elections. Legislative Studies Quarterly 30 (2), 235–257.
Milgram, S. (1967). The small world problem. Psychology Today 2 (1), 60–67.
Monsma, S. V. (1966). Interpersonal relations in the legislative system: A study of the
1964 Michigan House of Representatives. Midwest Journal of Political Science 10 (3),
350–363.
Morris, J. and M. Witting (2001). Congressional partisanship, bipartisanship and
public opinion: An experimental analysis. Politics & Policy 29 (1), 47–67.
Patterson, S. C. (1959). Patterns of interpersonal relations in a state legislative group:
The Wisconsin Assembly. The Public Opinion Quarterly 23 (1), 101–109.
Porter, M. A., P. J. Mucha, M. E. J. Newman, and C. M. Warmbrand (2005). A
network analysis of committees in the U.S. House. PNAS: Proceedings of the National
Academy of Sciences of the United States of America 102 (20), 7057–7062.
42

Ramirez, M. (2009). The dynamics of partisan conflict on Congressional approval.
American Journal of Political Science 53 (3), 681–694.
Routt, G. (1938). Interpersonal relationships and the legislative process. The Annals
of the American Academy of Political and Social Science 195 (1), 129.
Sarbaugh-Thompson, M., L. Thompson, C. Elder, M. Comins, R. Elling, and J. Strate
(2006). Democracy among strangers: Term limits’ effects on relationships between
State Legislators in Michigan. State Politics & Policy Quarterly 6 (4), 384.
Sparks, D., A. King, and F. Orlando (2011). Ideological extremity and primary suc-
cess: A social network approach. Annual Meeting of the Midwest Political Science
Association.
Tam Cho, W. and J. Fowler (2010). Legislative success in a small world: Social
network analysis and the dynamics of Congressional legislation. The Journal of
Politics 72 (01), 124–135.
Ura, J. and P. Wohlfarth (2010). “An appeal to the people”: Public opinion and
Congressional support for the Supreme Court. The Journal of Politics 72 (04), 939–
956.
Volden, C. and E. Bergman (2006). How strong should our party be? Party member
preferences over party cohesion. Legislative Studies Quarterly 31 (1), 71–104.
Watts, D. (2003). Small worlds: the dynamics of networks between order and random-
ness. Princeton Univ Press.
Watts, D. and S. Strogatz (1998). Collective dynamics of ‘small-world’ networks. Na-
ture 393 (6684), 440–442.
Waugh, A., L. Pei, J. Fowler, P. Mucha, and M. Porter (2009). Party polarization in
Congress: A social networks approach. Arxiv preprint arXiv:0907.3509 .
43
Wilson, R. K. and C. D. Young (1997). Cosponsorship in the U.S. Congress. Legislative
Studies Quarterly 22 (1), 25–43.
Wolak, J. (2007). Strategic retirements: The influence of public preferences on volun-
tary departures from Congress. Legislative Studies Quarterly 32 (2), 285–308.
Young, J. (1986). The Washington Community, 1800-1828. Columbia University Press.
44