measurement measurement of the arctic utls composition in ... · et al., 2003). to overcome this,...
TRANSCRIPT

Atmos. Meas. Tech., 6, 2683–2701, 2013www.atmos-meas-tech.net/6/2683/2013/doi:10.5194/amt-6-2683-2013© Author(s) 2013. CC Attribution 3.0 License.
Atmospheric Measurement
TechniquesO
pen Access
Measurement of the Arctic UTLS composition in presence of cloudsusing millimetre-wave heterodyne spectroscopy
E. Castelli1, B. M. Dinelli 1, S. Del Bianco2, D. Gerber3, B. P. Moyna3, R. Siddans3, B. J. Kerridge3, and U. Cortesi2
1Istituto di Scienze dell’Atmosfera e del Clima, ISAC-CNR, Bologna, Italy2Istituto di Fisica Applicata “Nello Carrara”, IFAC-CNR, Sesto Fiorentino, Italy3RAL Space, Harwell Oxford, STFC.RAL, Chilton, UK
Correspondence to:E. Castelli ([email protected])
Received: 28 February 2013 – Published in Atmos. Meas. Tech. Discuss.: 28 March 2013Revised: 25 July 2013 – Accepted: 23 August 2013 – Published: 16 October 2013
Abstract. MARSCHALS (Millimetre-wave Airborne Re-ceivers for Spectroscopic CHaracterisation in AtmosphericLimb Sounding) is a limb viewing instrument working in themillimetre and sub-millimetre spectral regions (from 294 to349 GHz). The scientific rationale of MARSCHALS is thestudy of the Upper Troposphere and Lower Stratosphere re-gion. In March 2010 MARSCHALS was deployed on-boardthe M-55 Geophysica stratospheric aircraft during the PRE-MIER(PRocess Exploration through Measurements of In-frared and millimetre-wave Emitted Radiation)-Ex field cam-paign. From the campaign base at Kiruna, Sweden, a re-search flight to investigate the Arctic atmosphere was con-ducted. For the first time the instrument fully exploited thethree spectral bands. In this paper, we present results of theanalysis of MARSCHALS measurements acquired duringthe PREMIER-Ex flight as processed by the Millimetre-waveAtmospheric Retrieval Code. For the second time after theSCOUT-O3 flight in 2005, MARSCHALS measured verticaldistributions of temperature, water vapour, ozone and nitricacid over an altitude range of 4 to 24 km. In addition, verti-cal profiles of carbon monoxide and nitrous oxide were ob-tained for the first time. The measurements were performedin clear sky conditions and in presence of low and high alti-tude clouds (that were able to obscure measurements in themiddle infrared spectroscopic region) and some informationabout thick clouds were extracted from the data. The capabil-ities to derive information on upper tropospheric and lowerstratospheric vertical profiles of temperature and minor con-stituents from millimetre-wave limb sounding observationsin the northern polar region are presented and discussed foreach of the individual targets. The results of MARSCHALS
data analysis contributed to demonstrate the scientific rel-evance and technical feasibility of millimetre-wave limb-sounding of the UTLS proposed for the ESA Earth Explorer7 candidate Core Mission PREMIER. PREMIER was not se-lected at the end of the Earth Explorer 7 evaluation process,but it is still being considered for future launch opportunities.
1 Introduction
The Upper Troposphere and Lower Stratosphere (UTLS) isa pivotal region of the Earth’s atmosphere. In absolute num-bers the term UTLS is generally applied to altitude rangesbetween 4 and 25 km at polar latitudes and between 8 and30 km in the Tropics. Chemical, radiative and dynamical pro-cesses that take place at these altitudes have a substantialand mutual influence on surface climate (ESA, 2012and ref-erences therein). In fact, this atmospheric region – due tothe very low temperatures of the layers immediately aboveand below the tropopause height – is where Essential Cli-mate Variables (Mason, 2010) such as surface air tempera-ture and Earth radiation budget are most sensitive to changesin the distribution of radiatively active gases and clouds.Of primary importance in this respect are water vapour andozone, greenhouse gases which play a key role in the ra-diative balance of the planet (e.g.Solomon et al., 2010;Hurst et al., 2011; Lacis et al., 1990) and exhibit a large,global-scale, spatio-temporal variability in the UTLS. Thedistribution of these species, and of other atmospheric con-stituents in gas-phase and particulates, is ultimately deter-mined by complex interactions between the chemical and
Published by Copernicus Publications on behalf of the European Geosciences Union.

2684 E. Castelli et al.: Measurement of the Arctic UTLS composition in presence of clouds
radiative processes which represent their sources and sinks,as well as the dynamical mechanisms which are responsiblefor the exchange of air masses between the troposphere andthe stratosphere, ranging from planetary or synoptic scalesdown to the mesoscale (see, for instance,Gettelman et al.,2011and references therein). In the Arctic region, an accu-rate representation of the processes that occur in the UTLSis an important prerequisite in understanding the perturbedchemistry in the core of the northern polar vortex, as wellas transport and mixing at its boundary. Given that extraor-dinary events such as the severe ozone depletion observedin the 2011 Arctic winter (January–March 2011, seeArnoneet al., 2012andManney et al., 2011) are likely to reoccur inthe upcoming years, there is a clear need to acquire new ob-servations from space with enhanced vertical and horizontalresolution, which will allow for the investigation of chemicalcomposition, radiative forcing and dynamical transport pro-cesses occurring from the outer to innermost region of thevortex. Moreover, the high latitudes of the Northern Hemi-sphere show clear evidence of the dynamic coupling betweenthe stratosphere and the troposphere, with anomalies in thestrength of the polar vortex propagating downward acrossthe lower stratosphere, resulting in circulation anomalies anda perturbation of the Earth’s surface climate.
However, to date the UTLS region is not adequately cov-ered by satellite measurements, since the majority of space-borne sensors are blinded by clouds or – as is the case withthe Microwave Limb Sounder (MLS) instrument on-boardthe Upper Atmosphere Research Satellite (UARS) and Auraplatforms (Barath et al., 1993; Waters et al., 2006) or theSub-Millimetre Receiver (SMR) (Olberg et al., 2003) on-board the Odin satellite (Murtagh et al., 2002) – their in-struments are not fully optimised for UTLS measurementsin terms of their choice of microwindows (tropospheric pen-etration), their low vertical resolution and their poor sensi-tivity (Urban et al., 2005a, b; Sandor et al., 1998; Liveseyet al., 2003). To overcome this, as part of the seventh callfor Earth Explorer Core missions in the frame of the Eu-ropean Space Agency (ESA)’s Living Planet Programme,one of the three mission candidates that underwent Phase-A feasibility study was the mission “Process Explorationthrough Measurement of Infrared and Millimetre-wave Emit-ted Radiation” (PREMIER). PREMIER was not selected atthe end of the evaluation process. Nonetheless, the strongscientific case and the technical feasibility demonstrated byPhase-A preparatory studies laid the basis to seek for anew launch opportunity either through national initiativesor in response to ESA Earth Explorer 9 Call for Ideas.The primary scientific objective of the PREMIER missionwas to gain a better understanding of the interaction pro-cesses linking atmospheric chemistry and dynamics with cli-mate. This imply the investigation of distribution and trans-port of trace gases and of the radiative effects of watervapour and clouds in the mid- to upper troposphere and lowerstratosphere. This can be achieved through the combined
observations by two limb-sounders: one of which operatingin the thermal infrared (InfraRed Limb Sounder, IRLS), theother in the sub-millimetre-wave region (Millimetre-WaveLimb Sounder (MWLS) a.k.a. Stratosphere-Troposphere Ex-change and Climate Monitor Radiometer, STEAM-R). Todemonstrate the merits of the mission concept, an airbornedemonstrator for the MWLS instrument on PREMIER –a.k.a. MARSCHALS (Oldfield et al., 2001) – was built. Re-spective infra-red instruments to demonstrate the IRLS ca-pabilities are already existing, e.g. Michelson Interferome-ter for Passive Atmospheric Sounding – STRatospheric air-craft (MIPAS-STR,Piesch et al., 1996), Gimballed LimbObserver for Radiance Imaging of the Atmosphere, Air-Borne version (GLORIA-AB,Friedl-Vallon et al., 2006).MARSCHALS is designed to sample the atmosphere usinga limb-viewing geometry from a stratospheric balloon or air-craft. It has already been deployed from the M-55 Geophys-ica high altitude aircraft during the SCOUT-O3 campaign in2005 (Dinelli et al., 2009).
As part of the preparatory studies, demonstration and test-ing activities carried out in parallel to PREMIER Phase-A,a series of field campaigns (PREMIER-Ex) for the deploy-ment of airborne precursors of PREMIER instrumentationon-board the high altitude research platform M-55 Geophys-ica was performed in 2009–2010. The PREMIER-Ex activi-ties consisted of a test campaign, which took place at mid-latitude (Oberpfaffenhofen, Germany, Lat. 48.1◦ N, Lon.11.3◦ E) in November 2009 and in a scientific campaign, per-formed in the Arctic region (Kiruna, Sweden, Lat. 67.8◦ N,Lon. 20.4◦ E) in March 2010 in the frame of the RECON-CILE (Reconciliation of essential process parameters for anenhanced predictability of Arctic stratospheric ozone lossand its climate interactions) project. The MARSCHALS in-strument was present on-board the M-55 for both flights.While for the first science campaign (SCOUT-O3, 2005) onlyone of the three spectral bands of MARSCHALS was op-erational, all three bands have now been implemented forPREMIER-Ex. However, because of unfavourable flight con-ditions, which were inherent to the test campaign in 2009,only the data from the scientific campaign in Kiruna areworth investigating.
In this paper, we present the results of MARSCHALSmeasurements obtained during the PREMIER-Ex scientificcampaign as processed by MARC (Millimetre-wave Atmo-spheric Retrieval Code). Since all the three spectral bandswere operating properly, we could retrieve CO and N2Overtical profiles in addition to the temperature, HNO3, O3and H2O profiles that had already been measured usingthe single operating band in the SCOUT-O3 campaign. Thestructure of the paper is as follows: in Sect. 2 we de-scribe the MARSCHALS instrument and its new features;in Sect. 3 we present the PREMIER-Ex campaign and theflight of 10 March 2010; a description of MARSCHALSdata analysis is presented in Sect. 4; results, discussion
Atmos. Meas. Tech., 6, 2683–2701, 2013 www.atmos-meas-tech.net/6/2683/2013/
E. Castelli et al.: Measurement of the Arctic UTLS composition in presence of clouds 2685
and intercomparisons with other instruments are reported inSect. 5 and in Sect. 6 conclusions are given.
2 The MARSCHALS spectrometer
2.1 Instrument description
MARSCHALS uses a vertically scanning antenna of 235 mmdiameter to measure thermal emission from the atmosphere.The limb of the atmosphere is sampled through an open aper-ture in the starboard side of the Geophysica aircraft at an-gles equivalent to 1 km tangent point steps. A single scan of28 measurements starts just below ground level and reachesup to just above platform altitude and includes an additionalspace-view at 20◦ above horizontal. An active antenna con-trol loop with a gyro as its reference stabilises the antennato within fractions of a degree stability (±0.01◦ when theabsolute roll angle rate of change is contained within the±0.63◦ s−1 design range). Because of various biases in theantenna knowledge (i.e. non-reproducibility of the alignmentw.r.t. the airframe, temporal bias in the gyro record due as afunction of geographic latitude, etc.) the antenna system hasto be regularly reset to horizontal. If during these resets theaircraft is not flying level – which it quite often does not –then these updates can lead to the following scan can be off-set in angle range compared to the nominal scan angles. Thisis mostly compensated by the safety margin in the nominalscan angle range, and it is not a problem for the data analysisbecause the absolute value of the tangent point altitude can beaccurately reconstructed post-flight, but it implies that in re-ality tangent points of neighbouring scans will be at slightlydifferent altitudes.
The duration of a single scan is∼ 3 min. Integration timeat each view angle is 4 times 250 ms. Incoming radiationis coupled to each of three millimetre-wave heterodyne ra-diometers centred at 300, 325 and 345 GHz, where it isdown-converted to the range 12–24 GHz, amplified, and de-tected using a single channeliser spectrometer. Observationtime is shared between the three spectral bands by meansof alternating atmospheric scans. The total spectral band-width of the channeliser spectrometer is 12 GHz, split up in60 channels of 200 MHz channel bandwidth (the Intermedi-ate Frequency (IF) bandwidth of the receivers is less than12 GHz to a varying degree). The signal due to aliased radi-ances is filtered out by a high performance single sidebandfilter (one for each radiometer) which reduces these signalsby at least 30 dB.
The antenna scan system employs a dedicated InertialMeasurement Unit (IMU) to improve the control of the point-ing direction. The antenna control loop measures the instru-ment (aircraft) roll angle with high precision and correctsfor it in the loop. This makes the instrument line-of-sightextremely stable. To help in assessing the impact of cirrusclouds on the observations, MARSCHALS incorporates an
Optical Cloud Monitor (OCM). The spectroscopic character-isation of the three MARSCHALS bands are summarised inTable1 (the bands’ frequency range reported in the table fol-low the original instrument configuration). Additional infor-mation about the MARSCHALS instrument can be found inDinelli et al.(2009), where the configuration used during theSCOUT-O3 campaign is presented together with a renderingof the instrument and its subsystems.
2.2 UAMS instrument updates
The first scientific deployment of MARSCHALS duringthe SCOUT-O3 campaign took place before the instrumentwas operating according to its final specifications (only the300 GHz band was operating nominally during the remotesensing flight). In order to address this, a comprehensive in-strument upgrade and characterisation project “Upgrades toAirborne Millimetre-wave Sounder” (UAMS) took place be-tween SCOUT-O3 and PREMIER-Ex. Following is a list ofpoints addressed by the UAMS project.
2.2.1 Single Sideband Filter (SSBF)
New Single Sideband Filters were developed for the threeMARSCHALS bands by the Queen’s University of Belfast.All of them have both good image rejection (> 30 dB) andlow signal insertion loss (< 0.5 dB). The new filters for bandB and D are a free-standing 3-layer linear slot-array type Fre-quency Selective Surface (FSS). The band C filter is a free-standing 3-layer dual polarisation annular slot array typeFSS.
2.2.2 Band B receiver
The original band B receiver, supplied for MARSCHALSfrom a separate ESA technology development programme,had unsatisfactory noise performance (> 20000K in singlesideband (SSB)) and a pronounced gain slope in the IF pass-band. The entire receiver was replaced by a design devel-oped by RAL and EADS Astrium (UK). The new receiveremploys a simplified single-stage down-conversion schemewhich eliminates the IF gain slope. In addition, a new mixerhas been specifically designed for this channel. It has beendesigned to have inherently better performance in the sig-nal sideband and includes an integral IF preamplifier, therebyimproving IF match and IF noise temperature. The feedhornused on the new receiver is a scaled version of the designdeveloped for band C (and band D) by the University ofNavarra. A new doubler has also been developed for thischannel. The noise temperature of the new receiver, mea-sured with a broadband power metre, is listed in Table1. Thegain slope has also been measured and was shown to havedecreased from∼ 10 dB to less than 1 dB. Figure1 showsthe position of the band B receiver in the new layout after theUAMS update.
www.atmos-meas-tech.net/6/2683/2013/ Atmos. Meas. Tech., 6, 2683–2701, 2013

2686 E. Castelli et al.: Measurement of the Arctic UTLS composition in presence of clouds
Table 1. Frequency coverage and spectral performance of the three MARSCHALS spectral bands. The signal band dimensions reported inthe table refer to the original instrument configuration.
Band B Band C Band D
1st LO frequency [GHz] 317.46 337.48 360.80IF band [GHz] 12.0–23.6 12.0–21.0 12.0–18.6Signal band [GHz] 293.86–305.46 316.48–325.48 342.20–348.80Image band [GHz] 329.46–341.06 349.48–358.48 372.80–379.40Spectral bandwidth [GHz] 11.66 9.20 6.80Channel bandwidth [GHz] 0.2 0.2 0.2Channels used [No.] 44 40 32Main target species O3 H2O (325.2 GHz), CO (345.79 GHz),
O3 HNO3, O3T sys before upgrade [K] 19 000 18 000 19 000T sys after upgrade [K] 6000 10 000 9000Sideband filter linear slot FSS dual polarisation linear slot FSS
annular slot FSSSideband suppression > 30 dB > 30 dB > 30 dBSignal insertion loss < 0.5 dB < 1.3 dB < 1.2 dB
Fig. 1. Constellation of the MARSCHALS receivers and sideband filters after the UAMS instrumentupgrades. The atmospheric signal enters the quasioptical subsystem at the bottom of the picture. Theband D signal is separated by a polariser, the band B and C signals are separated by a beam splitter.
37
Fig. 1. Constellation of the MARSCHALS receivers and sidebandfilters after the UAMS instrument upgrades. The atmospheric signalenters the quasioptical subsystem at the bottom of the picture. Theband D signal is separated by a polariser, the band B and C signalsare separated by a beam splitter.
2.2.3 Band C receiver
The components in the band C receiver were unchanged(only the FSS single sideband filter was replaced). However,it was slightly repackaged to accommodate changes in thephysical layout of the band D receiver. After the FSS up-grades the receiver performance was improved, but the im-provements were less than expected. After several iterationsof components, the subharmonic mixer and doubler wereboth replaced, producing further improvements in the noisetemperature. The final value is listed in Table1. The positionof band C receiver is shown in Fig.1.
2.2.4 Band D receiver
Prior to the deployment of MARSCHALS in SCOUT-O3 inDarwin, the band D receiver exhibited a SSB noise temper-ature of approximately 19 000 K. During the deployment inDarwin the channel failed and no data was obtained; this wasascribed to a failed doubler in the local oscillator chain. Themixer originally installed in this band had a noise temper-ature of∼ 2000 K Double Side-Band (DSB). This has nowbeen replaced with a new mixer with a noise temperatureof approximately 1500 K DSB. The failed doubler has beensubstituted with a new RAL doubler incorporating a RALSchottky diode. The noise temperature of the new receiveris listed in Table1. The layout of the instrument after theUAMS project and the position of the receiver are shown inFig. 1.
2.2.5 Instrument Control Unit (ICU)
The ICU stack has been fitted with external console connec-tors to allow field diagnostics without stack disassembly (aswas necessary in the SCOUT-O3 campaign). A number ofsoftware modifications has also been performed. An errorin the reading of the aircraft roll-angle data has been cor-rected. The aircraft roll-angle data is used to periodicallycalibrate the inertial navigation system of MARSCHALS. Inthe SCOUT-O3 campaign incorrectly read aircraft data couldoffset the antenna pointing; this is now not the case anymore.Roll-angle updates were hardcoded to beginning of a full 3-band measurement cycle. However, to gain spectral perfor-mance the duration of a full set of atmospheric measurementshas now increased from∼ 1 min to∼ 10 min. To make up forthat, the option for a “commandable roll-angle update” has
Atmos. Meas. Tech., 6, 2683–2701, 2013 www.atmos-meas-tech.net/6/2683/2013/

E. Castelli et al.: Measurement of the Arctic UTLS composition in presence of clouds 2687
been implemented in the ICU software, which permits moreregular updates to the aircraft roll-angle to mitigate pointingangle drifts.
2.2.6 Antenna pointing system
The antenna pointing motor and electronics are exposed sys-tems in the open instrument bay of the aircraft, where temper-ature and humidity variations between the stratosphere andground conditions can be dramatic. There were some relia-bility issues with the inductosyn™ interface board during theSCOUT-O3 campaign, so this system has also been replacedby a completely rebuilt Antenna Pointing System module.This has so far operated with 100 % reliability both in labo-ratory tests and in flight conditions.
2.2.7 Thermal stability
Outside temperatures at 20 km flight altitude can be as low as−90◦C. This puts a lot of strain on the temperature stabilitycontrol system. This is addressed by increasing the wattageof the existing heaters on the radio frequency components, aswell as adding a 4th channel to the thermal stabilisation con-trol unit to allow the calibration hot load to be stabilised. Inaddition to that passive thermal insulation has been added tovarious subsystems. The cryostat bay and the calibration hotload have been enclosed to reduce convective cooling. Thereceiver modules, local oscillator modules, phase lock mod-ules and the channeliser have all been fitted with insulatingstyrofoam padding.
2.2.8 Instrument characterisation
The significant changes to the instrument performed un-der UAMS required a number of instrument characterisa-tion measurements to be repeated. Most importantly these in-cluded measurements of the antenna function (field of view),the spectral response functions (instrument line shape) andthe spectral performance of the receivers (standing waves,linearity, frequency calibration).
The Azimuthally Collapsed Antenna Patterns (ACAP) andpolarisation have been measured in an anechoic chamberat Queen Mary University in London. Analogous measure-ments have been performed in the past, but these repeatedtests are of higher quality because they are performed athigher angular resolution and because of the improved spec-tral performance of the instrument. The measurement setuphas also been better shielded from standing waves in the pathbetween the test signal source and the detector. The ACAPand the polarisation have been measured for all three spectralbands individually and are used in the data analysis process.We have also determined the marginal line-of-sight offsetsbetween the three bands and have corrected for them in thecalculation of the scan angles.
The spectral response functions have been measured inthe laboratory at RAL. As with the antenna characterisation,
a much improved setup compared to the previous measure-ments has been applied. A line is injected into the 12–24 GHzIF port using a coupler (and amplification to compensate forthe coupler loss) so that the spectral response of the instru-ment is measured against an input comprising a swept con-tinuous wave signal from the synthesiser superimposed ona broadband noise source (the receiver front end viewing anambient blackbody load).
The use of isolators at the input and output of the line in-jection system means that it can be removed from the sys-tem without significantly affecting the match between the re-ceivers and IF (and hence the spectral response of the systemunder test). A first set of spectral response measurements hadbeen performed before the PREMIER-Ex campaign.
Initial test results showed that most spectral channels werestable, however as was observed in previous spectral re-sponse tests a small proportion of channels were unstable.These channels showed noticeable fluctuations in spectral re-sponse between measurement runs. After initial tests, the lo-cation of the unstable channels relative to the spectral linesof interest was investigated. The conclusion was that a re-ordering of the channeliser units was advantageous, enablingthe unstable channels to be moved to spectral areas of lowerimportance. The re-ordering of the channeliser units wascompleted and additional spectral response tests were un-dertaken. More details about the channel re-ordering can befound inSpang et al.(2012).
The 200 MHz spectral resolution of the MARSHALSchanneliser does not allow the detection of high-frequencystanding waves in the system. To check for the presence ofstanding waves, the University of Bremen kindly lent RALan Observatoire de Paris-Meudon (ARPEGES-LED) wide-band Acousto-Optic Spectrometer (AOS). The unit was theresult of the ESA funded Wideband AOS WP2411 and hasa nominal bandwidth of 1.5 GHz and channel spacing of0.89 MHz. Within the limitations of the noise performanceof the receivers, no standing waves have been detected. Moredetailed results from the instrument characterisation, as wellas accounts on other minor system tests can be found inMoyna et al.(2010).
3 PREMIER-Ex scientific campaign
3.1 Campaign overview
The aim of the PREMIER mission was to quantify the pro-cesses that control the composition and structure of theUTLS. The PREMIER-Ex activities culminated in a scien-tific campaign in the northern polar region in March 2010.The scientific objectives addressed by the PREMIER-Excampaign were the quantification of horizontal mixing pro-cesses in the UTLS and of the cirrus formation processesin the Arctic atmosphere. The PREMIER-Ex scientific flight(hereafter denoted as PrEx 1) was performed on 10 March
www.atmos-meas-tech.net/6/2683/2013/ Atmos. Meas. Tech., 6, 2683–2701, 2013

2688 E. Castelli et al.: Measurement of the Arctic UTLS composition in presence of clouds
2010. During the first week of March the vortex was lo-cated above the Siberian Arctic and then moved backwardtowards the Scandinavian Peninsula. On 10 March the po-lar vortex was located above Scandinavia. The PrEx 1 flighttrack was planned so as to sound the vortex filamentation onthe vortex boundary, and thus to probe the horizontal mix-ing of vortex and mid-latitude air. An additional constraintwas to find a match with A-Train satellites (e.g. CALIPSO,Aura) and ENVISAT overpasses for validation purposes.Using European Centre for Medium-range Weather Fore-casts (ECMWF) assimilated forecast model data and re-sults from the Chemical Lagrangian Model of the Strato-sphere (CLaMS), the flight path was planned going to theWest, as shown in the flight path reported in Fig.2a andthen going back to Kiruna with a triangular flight pattern.The PrEx 1 flight started at∼ 07:20 UTC and finished at∼ 10:30 UTC, while the A-Train satellite overpasses wereperformed at about 10:20 (MODIS)/10:40 (MLS) and 12:20(MLS) UTC and the ENVISAT overpass was performed atabout 08:45 UTC. Precise temporal coincidence with correl-ative satellite data is therefore only available for the first twolegs of the flight. The second PREMIER-Ex flight, which wassupposed to study processes related to Arctic cirrus forma-tion and planned for the 13 March 2010, could not be per-formed due to a severe aircraft engine problem.
In Fig. 2a we report the values of the Potential Vortic-ity extracted from the ECMWF archive in Potential Vor-ticity Unit (PVU, 1 PVU = 10−6 Km2s−1kg−1) at 125 hPawith respect to latitude and longitude in the flight region. Inthe same plot we report the M-55 flight track (in black) to-gether with the position of the MARSCHALS tangent pointsfor each scan (in grey). The red line marks the region withPV equal to 14 PVU, that can be considered as the outerborder of the vortex at this pressure level (Mariotti et al.,1997; Christensen et al., 2005). Comparing the position ofMARSCHALS tangent points with PV values we can noticethat the flight was divided into three legs: the first two legsenabled MARSCHALS Lines-of-Sight (LOS) to look par-tially inside the vortex, while the third to look at air massesfrom mid-latitude and vortex filamentation.
3.2 MARSCHALS measurements duringPREMIER-Ex scientific flight of 10 March 2010
As seen in Sect.2.2, the UAMS upgrades produced an im-provement of the noise performances. Additionally the sys-tem reliability was improved, which meant that the scan se-quence could be speed up by removing redundant integrationcycles at each view. This has allowed to increase the num-ber of limb-scans per flight hour and to obtain a better hor-izontal sampling rate with respect to the SCOUT-O3 flight.During the PrEx 1 flight, MARSCHALS collected 56 limbscans in the time interval from 07:24 UTC to 10:27 UTC.Each band was acquired in a separate scan, and the threebands were acquired in CBD sequence. In total 19 scans were
Table 2. Frequency range and retrieval targets of the threeMARSCHALS bands. The frequency ranges of the MARSCHALSbands reported in the table, used for the PrEx1 data analysis, followthe updated instrument characterisation.
Band Frequency range Target retrieval quantities
B 296.760–305.360 O3, N2O, HNO3,external continuum
C 317.780–325.380 temperature, H2O, O3,HNO3, external continuum
D 341.900–348.100 O3, HNO3, CO,external continuum
recorded in band B, 19 in band C and 18 in band D. Duringthe flight MARSCHALS collected Level 1 data of good qual-ity for all the three bands. This is therefore the first time thatMARSCHALS band B and D measurements could be anal-ysed to produce Level 2 data. Table2 reports the frequencyrange where the three MARSCHALS bands have good per-formances and that were therefore used for the analysis re-ported in this paper.
Figure2b shows the altitude of the tangent points of eachscan given as a function of the acquisition time. The figureshows that there are two parts of the flight (from scans 6 to31 and from scans 35 to 53) where the aircraft altitude wasnearly constant. Figure2b also shows that there was an un-even altitude coverage of the three bands during the flight.This affects the quality of the retrieval products, because ofthe different vertical distribution of the information contentof each scan. The few scans that had a reduced altitude cov-erage or were acquired during changes of direction of theaircraft were not used in the analysis.
4 MARSCHALS data analysis
In this section, we briefly describe the MARC retrieval code,the new features introduced in the retrieval code with re-spect to the version previously used for the SCOUT-O3data analysis and we describe the results of the analysis ofMARSCHALS spectra.
4.1 Retrieval code
The PREMIER-Ex MARSCHALS data analysis was per-formed using the MARC code (Carli et al., 2007). TheMARC retrieval code was developed under an ESA contractfor the analysis of the calibrated and geolocated spectra mea-sured by MARSCHALS. It makes use of the global-fit (Car-lotti, 1988), multi target (Dinelli et al., 2004) techniques anduses Optimal Estimation (OE) or maximum a posteriori ap-proach (Rodgers, 2000) and the Levenberg-Marquardt algo-rithm (Levenberg, 1944; Marquardt, 1963) during the itera-tive retrieval procedure to reduce the step width and to speedup the convergence to the minimum of the cost function.
Atmos. Meas. Tech., 6, 2683–2701, 2013 www.atmos-meas-tech.net/6/2683/2013/

E. Castelli et al.: Measurement of the Arctic UTLS composition in presence of clouds 2689
Fig. 2. (a) PV in PVU obtained from the ECMWF archive at 125 hPa as a function of latitude andlongitude in the flight region. Black line marks the flight track during the PrEx 1 flight, the position ofMARSCHALS tangent points of each scan is shown in grey, while blue triangles represents the positionof MLS/Aura scans. (b) Position of MARSCHALS measurements for band B, band C and band D withrespect to altitude and time for the PrEx 1 flight.
38
Fig. 2. (a) PV in PVU obtained from the ECMWF archive at 125 hPa as a function of latitude and longitude in the flight region. Blackline marks the flight track during the PrEx 1 flight, the position of MARSCHALS tangent points of each scan is shown in grey, while bluetriangles represents the position of MLS/Aura scans.(b) Position of MARSCHALS measurements for band B, band C and band D withrespect to altitude and time for the PrEx 1 flight.
A detailed description of the main features of the code is pro-vided inCarli et al.(2007) and a description of its use for theanalysis of real data can be found inDinelli et al. (2009). Adescription of the parametrization of the atmosphere and ofthe atmospheric line shape used into the MARC code can befound inBianchini et al.(2008).
MARC retrieves vertically distributed quantities (such astemperature and Volume Mixing Ratios (VMRs) of gaseswhose emission lines are present in MARSCHALS bands)and scalar quantities, in the form of one value for each anal-ysed scan. The Forward Model (FM) internal to the retrievalcode uses a state of the art molecular continuum model devel-oped together with a specific spectroscopic database (Kuhnet al., 2003) and uses an additional (retrievable) continuumprofile to account for the continuum like contribution ofclouds opaque in the observed frequency region. Originallythe retrievable scalar quantities were: the pointing bias (a cor-rection term that enables to account for eventual instrumentalmispointings) and the gain and offset (used to correct possi-ble calibration errors).
For the PREMIER-Ex data analysis the possibility toretrieve a frequency shift has been implemented into theMARC code. The frequency shift is retrieved as a frequencyoffset applied to the Instrument Line Shape (ILS), and isa single scalar number for each scan, because it is assumed tobe due to instrumental characterisations only. The frequencyshift assumes positive values when the simulated spectrumhas to be shifted toward higher frequencies. We tested theretrieval of the frequency shift on simulated data obtainingsatisfactory results (Cortesi et al., 2012).
Along with the profiles of the target species and the in-strumental parameters, the MARC algorithm provides alsoretrieval diagnostics that can be divided into scan diagnos-tic and target diagnostic. The scan diagnostic quantities are:the reducedχ2, the information content (both defined as inRodgers, 2000) and the trace of the full Averaging Kernel(AK) matrix (which gives information on the total degrees
of freedom of the retrieval). The target diagnostic quantitiesare: the biased error, that is the combination of the retrievalerror due to the noise with the a priori error, the AKs ofeach target, and the individual information content quanti-fier. These quantifiers have already been discussed inDinelliet al.(2009), Carli et al.(2007). For this analysis we have alsocomputed the vertical resolution of the retrieval products inthe form of the Full Width at Half Maximum (FWHM) of theAK using the expression given byRidolfi and Sgheri(2009).
4.2 MARSCHALS retrieval strategy
The retrieval strategy used for the inverse processing ofMARSCHALS measurements during the PrEx 1 flight wasoptimised through a dedicated approach. As a starting pointwe applied the strategy used for the data analysis performedon the SCOUT-O3 data and described inDinelli et al.(2009).However, the different geographic location of the measure-ments, the upgrades of the instrument and the presence of allthree bands for the first time implied that most of the adoptedchoices had to be revised.
Because the noise characterisation of the new instrumentsetup was more reliable, in the current analysis we used thenoise level as reported in the Level 1B files, that providea measured value for every single spectral channel. In ad-dition the new FOV and ILS functions, measured with thestrategy described in Sect.2.2were used.
Each MARSCHALS scan was analysed individually, re-trieving four scalar instrumental parameters (gain, offset,pointing bias angle and frequency shift) along with verticaldistributions of temperature, water, ozone, nitric acid, nitrousoxide, carbon monoxide and extinction coefficient. Becauseof the different spectral coverage of the three bands, the ver-tically resolved targets are scan dependent. Table2 reportsthe list of the vertically resolved targets of each band. Theprofiles above and below the highest and lowest retrievedgrid points have been extrapolated following the shape of
www.atmos-meas-tech.net/6/2683/2013/ Atmos. Meas. Tech., 6, 2683–2701, 2013

2690 E. Castelli et al.: Measurement of the Arctic UTLS composition in presence of clouds
the initial profiles (scaled with the highest and the lowest re-trieved point, respectively), while negative VMR values arenot allowed into the MARC code.
As already mentioned in Sect.4.1, the MARC code usesthe OE method. Therefore, it is important to correctly defineboth the a priori information of the atmospheric status andits uncertainty. Temperature, pressure, O3 and H2O a pri-ori data (used also as initial guess profiles) were obtainedfrom ECMWF Meteorological Archival and Retrieval Sys-tem (MARS) archive, using the operational data on 91 modellevels. The a priori data for all the other gases like N2O,CO and HNO3 were taken from the IG2 database (Remedioset al., 2007) that contains climatological averaged profilesand 1-sigma variabilities for the four seasons and for 5 latitu-dinal bands. The IG2 1-sigma variability was used as a prioriuncertainty for all the targets. The lower limit of this uncer-tainty was set to a target dependent threshold, expressed aspercentage of the a priori profile. This threshold was 100 %for O3 and H2O while it was set to 50 % for N2O, HNO3 andCO. The a priori error used for temperature was a constantvalue of 3 K that is the estimated error of ECMWF data.The a priori error on the external continuum was set to aconstant value of 0.2× 1027 cm2. The profiles of the othergases, not retrieved during the analysis, are extracted fromthe IG2 polar winter atmosphere. During the revision of thispaper we realised that the IG2 data for CH3Cl were overes-timated. CH3Cl emission in band D is very close to that ofCO and a wrong profile may badly affect its retrieval. There-fore, the CH3Cl VMR profile below 20 km was inferred fromMLS/Aura data measured in polar regions on the same dateof the flight.
A series of preliminary tests were performed in order tofind the best retrieval strategy that could be used for the fit.These tests showed that temperature and H2O can be re-trieved from band C measurements only. However, becausethe initial guess profiles of H2O are very different from thereal atmospheric conditions and the profiles retrieved fromband C are sometimes unstable, H2O is still included intothe band B and D retrievals to account for the contributiongiven by the far wings of its lines to the analysed spectrum.The profiles obtained in the analysis of these bands are notincluded into the retrieval products. Therefore, the devisedretrieval strategy was to start the analysis from a band C scan(scanN ). For the two subsequent scans,N +1 in band B andN + 2 in band D, we used the temperature value retrievedfrom scanN and we retrieved H2O (with the other targets)using as a priori the profile retrieved from scanN . The mini-mum altitude of the used observations, as well as the optimaltarget dependent retrieval grids, were chosen after some dedi-cated tests, using the quantifiers described in Sect.4.1to findthe best retrieval set up. All observations with tangent alti-tudes above the ground level were retained in the analysis.The used retrieval altitude grids, common to all the scans ofPrEx 1 flight are listed (in km) below:
– temperature: 24, 20, 18, 17, 15, 13, 11, 9, 7, 5
– H2O: 24, 21, 18, 17, 16, 15, 14, 13, 12, 11, 10, 9, 8, 7,6, 4
– O3: 24, 21, 18, 17, 16, 15, 14, 13, 12, 11, 8, 5
– HNO3: 23, 20, 17, 16, 14, 12, 9, 6
– N2O: 20, 16, 14, 12, 10, 8
– CO: 21, 17, 13, 7
– external continuum: 18, 17, 16, 15, 14, 13, 12, 11, 10,9, 8, 7, 6
As for the SCOUT-O3 analysis, one or two retrieval gridpoints have been added above the highest flight altitude inorder to reduce the errors due to the assumed vertical distri-bution of the targets above the highest retrieval point.
4.3 MARSCHALS retrieval diagnostic
Table 3 shows the averaged Degrees Of Freedom (DOF)obtained in the analysis of the three MARSCHALS bandsfor all vertically resolved targets. We see that the threeMARSCHALS bands contain an evenly distributed infor-mation on O3 and on the external continuum, while forHNO3 the best information is contained in band C and D.The values reported in Table3 confirm that the highest in-formation on H2O is in band C, and show that for N2O andCO the number of retrieved DOF is close to the number ofaltitudes of their retrieval grid. A comparison of Table3 withFig. 7 ofDinelli et al. (2009) shows that the number of DOFobtained for band C in this flight for H2O, O3 and HNO3have increased. This is due to both the improvements of theMARSCHALS instrument and the lower tropopause altitudein the geographical region where the flight took place. In factthe SCOUT-O3 campaign was performed in Darwin, at trop-ical latitudes, and the tropopause altitude was always higherthan the flight altitude, while in this flight the tropopause wasalways below the aircraft.
The values of the reducedχ2 obtained in the analysis arereported in Fig.3a, where the blue, black and red symbols areused for the scans of band B, C and D, respectively. We seethat theχ2 value is on average around 1.4, apart from fewscans in the third leg of the flight. Band B always presentsslightly higherχ2 values than the other two bands. As anexample of the quality of the retrieval and of the instrumentperformances, the bottom panels of Fig.3 report the valuesof the AKs trace and of the information content for each scanusing the same colour code. As expected the three bands havedifferent information content due to both the different num-ber of targets and the covered spectral region. Band C alwayshas higher DOF and information content. The lower informa-tion content and AK trace value found for some scans is dueto their reduced altitude coverage (see Fig.2b).
Atmos. Meas. Tech., 6, 2683–2701, 2013 www.atmos-meas-tech.net/6/2683/2013/

E. Castelli et al.: Measurement of the Arctic UTLS composition in presence of clouds 2691
Fig. 3. (a) Retrieved reduced χ2 for PrEx 1 flight for each scan as a function of time. (b) Trace of AKmatrix for each scan as a function of time. The length of the state vectors is 59 elements in band B, 63 inband C and 57 in band D. (c) Information content for each scan as a function of time. Blue for band B,black for band C and red for band D.
39
Fig. 3. (a)Retrieved reducedχ2 for PrEx 1 flight for each scan as a function of time.(b) Trace of AK matrix for each scan as a functionof time. The length of the state vectors is 59 elements in band B, 63 in band C and 57 in band D.(c) Information content for each scan asa function of time. Blue for band B, black for band C and red for band D.
Table 3.Degrees of Freedom of the three MARSCHALS bands forthe vertically resolved targets.
Band Temperature H2O O3 HNO3 N2O CO Cont.
B – 2.8 10.8 3.2 5.2 – 6.5C 4.5 15.0 10.2 6.4 – – 5.6D – 3.6 10.0 6.7 – 3.2 5.9
In order to better evaluate the retrieval performances, inFig. 4 we show the average residuum together with cor-responding standard deviation and average noise level fortwo scans in each MARSCHALS band: For one scan weobtained goodχ2 values (scan 22 in band B, scan 12 inband C and scan 29 in band D, residuum plotted in blue)while for the other we had worse performances (scan 49 inband B, scan 51 in band C and scan 47 in band D, plottedin red). As can be noticed, worstχ2 values were obtainedwhen the residuum standard deviation was higher than thenoise level. In general no particular feature can be seen in theresiduum. The residuum behaviour highlights the quality ofthe MARSCHALS measurements and retrieval results.
5 Results and discussion
In this section we present and discuss the results obtainedfor the instrumental parameters and the vertically resolvedquantities from the analysis of MARSCHALS data duringthe PREMIER-Ex campaign on 10 March 2010.
The retrieved values of the instrumental parameters offset,gain, pointing and frequency shift stay constant along theflight indicating that the instrument did not show problems
Table 4. Average scalar quantities retrieved from the threeMARSCHALS bands.
Offset Pointing FrequencyBand [K] Gain bias [deg] shift [MHz]
B 0.42± 0.78 0.98± 0.01 −0.037± 0.071 10.1± 0.6C −0.71± 0.70 1.00± 0.01 −0.013± 0.032 13.0± 1.2D −1.47± 0.68 0.99± 0.01 −0.003± 0.024 11.1± 2.3
of degradation along the flight. The retrieved values of thescalar quantities, averaged over all the results of the differ-ent bands, are shown in Table4. Offset values are very closeto zero, and gain values are close to 1, indicating good ra-diometric performances of the instrument. The small valuesassumed by the pointing bias indicates that the a-posterioripointing knowledge is very good. Finally the values obtainedfor the frequency shift are of the order of few MHz, largelybelow the instrumental frequency step (200 MHz).
All the results obtained for vertically resolved quantitieswill be presented using colour maps where the examinedquantity is mapped as a function of altitude and of acqui-sition time. We report on separate panels the retrieved quan-tities, the retrieval error, the individual information contentand the vertical resolution (FWHM). We recall here that theindividual information content is not an absolute quantifier,but it represents a relative quantity that shows how much thea priori error has been reduced during the analysis. A valueof the information content of 0.5 represents a reduction ofthe a priori error of
√2 (Dinelli et al., 2009). Retrieved val-
ues with individual information content very low are stronglybiased towards the a priori.
www.atmos-meas-tech.net/6/2683/2013/ Atmos. Meas. Tech., 6, 2683–2701, 2013
2692 E. Castelli et al.: Measurement of the Arctic UTLS composition in presence of clouds
Fig. 4. Average noise level (green), average residuum (solid lines, blue for the best and red for the worsescan) and corresponding standard deviations (dashed lines) for :(a) scans 22 blue and 49 red in bandB,(b) scans 12 in blue and 51 in red in band C, (c) scans 29 in blue and 47 in red for band D.
40
Fig. 4. Average noise level (green), average residuum (solid lines, blue for the best and red for the worse scan) and corresponding standarddeviations (dashed lines) for:(a) scans 22 blue and 49 red in band B,(b) scans 12 in blue and 51 in red in band C,(c) scans 29 in blue and47 in red for band D.
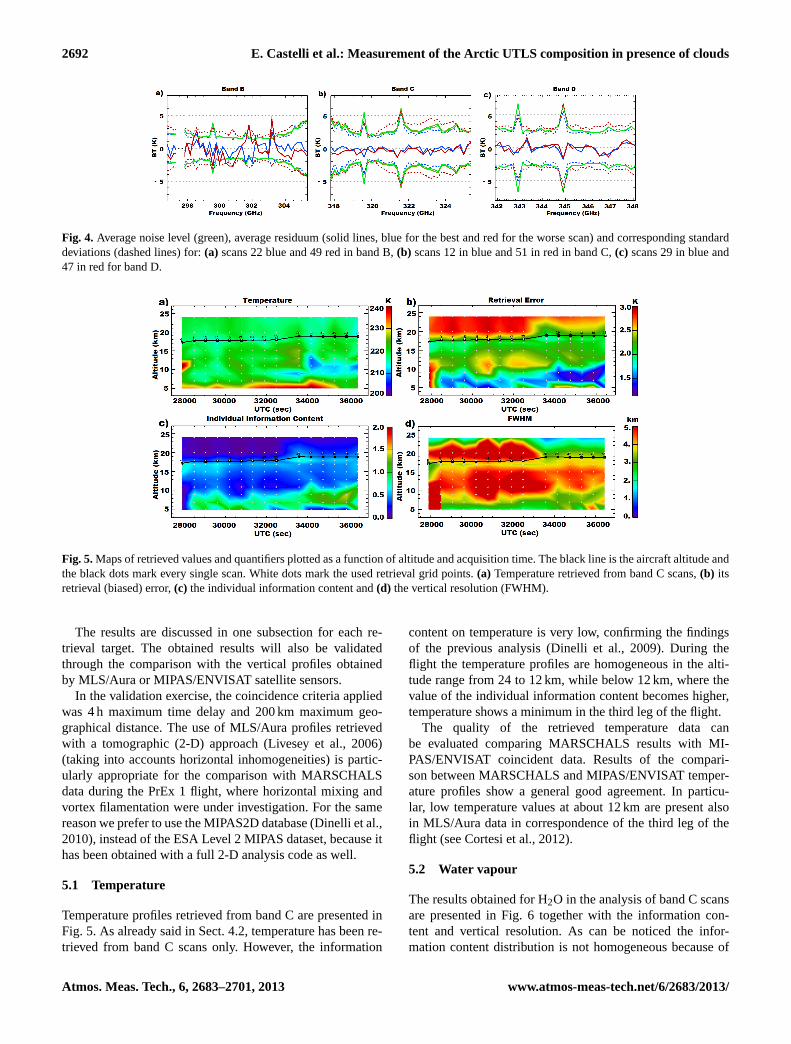
Fig. 5. Maps of retrieved values and quantifiers plotted as a function of altitude and acquisition time. Theblack line is the aircraft altitude and the black dots mark every single scan. White dots mark the usedretrieval grid points. (a) Temperature retrieved from band C scans, (b) its retrieval (biased) error, (c) theindividual information content and (d) the vertical resolution (FWHM).
41
Fig. 5.Maps of retrieved values and quantifiers plotted as a function of altitude and acquisition time. The black line is the aircraft altitude andthe black dots mark every single scan. White dots mark the used retrieval grid points.(a) Temperature retrieved from band C scans,(b) itsretrieval (biased) error,(c) the individual information content and(d) the vertical resolution (FWHM).
The results are discussed in one subsection for each re-trieval target. The obtained results will also be validatedthrough the comparison with the vertical profiles obtainedby MLS/Aura or MIPAS/ENVISAT satellite sensors.
In the validation exercise, the coincidence criteria appliedwas 4 h maximum time delay and 200 km maximum geo-graphical distance. The use of MLS/Aura profiles retrievedwith a tomographic (2-D) approach (Livesey et al., 2006)(taking into accounts horizontal inhomogeneities) is partic-ularly appropriate for the comparison with MARSCHALSdata during the PrEx 1 flight, where horizontal mixing andvortex filamentation were under investigation. For the samereason we prefer to use the MIPAS2D database (Dinelli et al.,2010), instead of the ESA Level 2 MIPAS dataset, because ithas been obtained with a full 2-D analysis code as well.
5.1 Temperature
Temperature profiles retrieved from band C are presented inFig. 5. As already said in Sect.4.2, temperature has been re-trieved from band C scans only. However, the information
content on temperature is very low, confirming the findingsof the previous analysis (Dinelli et al., 2009). During theflight the temperature profiles are homogeneous in the alti-tude range from 24 to 12 km, while below 12 km, where thevalue of the individual information content becomes higher,temperature shows a minimum in the third leg of the flight.
The quality of the retrieved temperature data canbe evaluated comparing MARSCHALS results with MI-PAS/ENVISAT coincident data. Results of the compari-son between MARSCHALS and MIPAS/ENVISAT temper-ature profiles show a general good agreement. In particu-lar, low temperature values at about 12 km are present alsoin MLS/Aura data in correspondence of the third leg of theflight (seeCortesi et al., 2012).
5.2 Water vapour
The results obtained for H2O in the analysis of band C scansare presented in Fig.6 together with the information con-tent and vertical resolution. As can be noticed the infor-mation content distribution is not homogeneous because of
Atmos. Meas. Tech., 6, 2683–2701, 2013 www.atmos-meas-tech.net/6/2683/2013/

E. Castelli et al.: Measurement of the Arctic UTLS composition in presence of clouds 2693
Fig. 6. As in Fig. 5 but for H2O retrieved from band C scans only.
42
Fig. 6.As in Fig.5 but for H2O retrieved from band C scans only.
Fig. 7. Comparison of H2O profiles retrieved from MARSCHALS scans 12 and 42 (grey) with MI-PAS/ENVISAT (blue) and MLS/Aura (red) H2O profiles. The horizontal dashed line represents the flightaltitude level.
43
Fig. 7. Comparison of H2O profiles retrieved from MARSCHALS scans 12 and 42 (grey) with MI-PAS/ENVISAT (blue) and MLS/Aura (red) H2O profiles. The horizontal dashed line represents the flightaltitude level.
43
Fig. 7. Comparison of H2O profiles retrieved from MARSCHALS scans 12 and 42 (grey) with MIPAS/ENVISAT (blue) and MLS/Aura(red) H2O profiles. The horizontal dashed line represents the flight altitude level.
the uneven altitude coverage of the MARSCHALS measure-ments (see Fig.2b). In particular, we have low informationbelow 8 km in the second half of the flight and in the altituderange from 14 to 16 km from scan 21 to 30. The retrievedVMR does not show particular features, apart from an en-hancement at low altitudes in the second half of the flightthat justifies the lower information content found (higherH2O VMRs imply more opaque spectra).
Comparison between water vapour retrieved profilesfor MARSCHALS scans with MLS/Aura and MI-PAS/ENVISAT coincident profiles show a very goodagreement with MLS data especially around the hygropauseas can be noticed in Fig.7, where we report an example forMARSCHALS scans 12 and 42.
5.3 Ozone
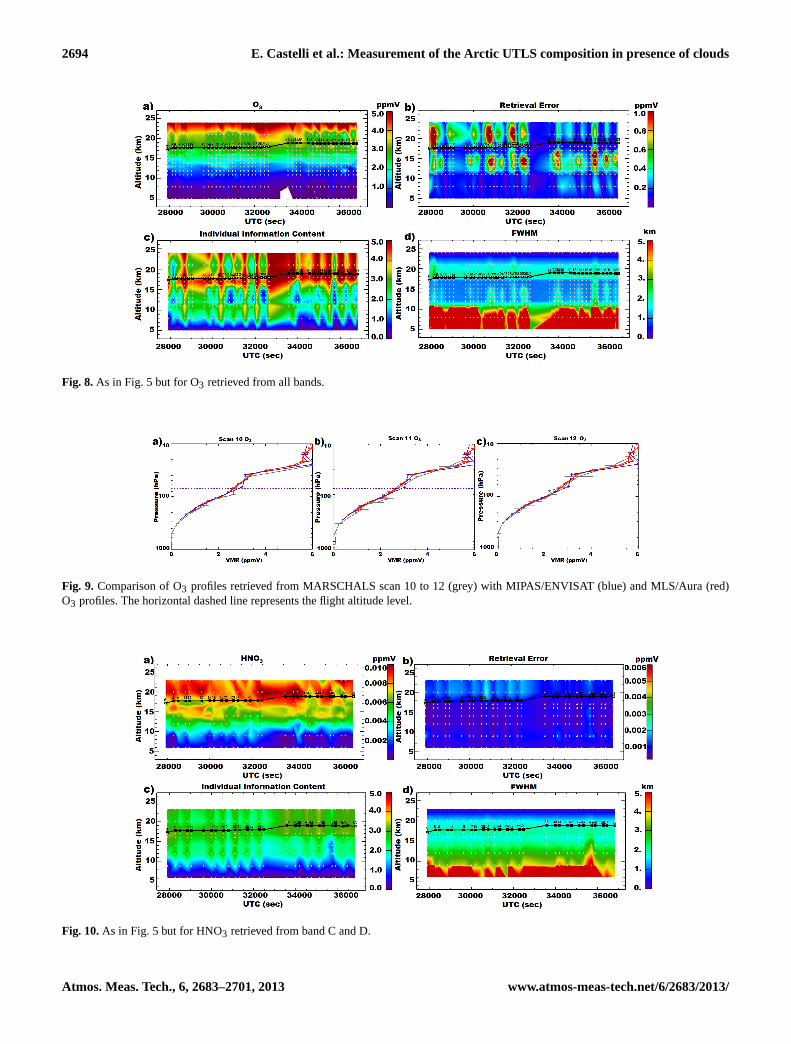
O3 can be retrieved from the measurements of all the threebands (band B, C and D). The obtained results for single scananalysis are reported in Fig.8. The individual information
content of the three bands is always high, although the bestperformances are obtained for band B measurements and theworst for band D. The lower values are always found in thealtitude region between 15 and 10 km. In any case, the indi-vidual information content of O3 during PrEx 1 is high overa wider altitude range with respect to what was found duringthe SCOUT-O3 data analysis. This is certainly due to the dif-ferent geolocation of the flight, but also due to the improve-ments of the instrument.
In Fig. 9, we compare O3 retrieved profiles for scans from10 to 12 with MLS/Aura and MIPAS/ENVISAT coincidentprofiles and we find a generally good agreement. In particu-lar, O3 profiles retrieved from band B and D (scan 10 and 11,respectively) show good agreement with satellite data. Noparticular features can be seen in MARSCHALS O3 profilesduring the flight.
www.atmos-meas-tech.net/6/2683/2013/ Atmos. Meas. Tech., 6, 2683–2701, 2013
2694 E. Castelli et al.: Measurement of the Arctic UTLS composition in presence of clouds
Fig. 8. As in Fig. 5 but for O3 retrieved from all bands.
44
Fig. 8.As in Fig.5 but for O3 retrieved from all bands.
Fig. 9. Comparison of O3 profiles retrieved from MARSCHALS scan 10 to 12 (grey) with MI-PAS/ENVISAT (blue) and MLS/Aura (red) O3 profiles. The horizontal dashed line represents the flightaltitude level.
45
Fig. 9. Comparison of O3 profiles retrieved from MARSCHALS scan 10 to 12 (grey) with MIPAS/ENVISAT (blue) and MLS/Aura (red)O3 profiles. The horizontal dashed line represents the flight altitude level.
Fig. 10. As in Fig. 5 but for HNO3 retrieved from band C and D.
46
Fig. 10.As in Fig.5 but for HNO3 retrieved from band C and D.
Atmos. Meas. Tech., 6, 2683–2701, 2013 www.atmos-meas-tech.net/6/2683/2013/

E. Castelli et al.: Measurement of the Arctic UTLS composition in presence of clouds 2695
Fig. 11. Comparison of HNO3 profiles retrieved from MARSCHALS scans 11 and 12 (grey) with MI-PAS/ENVISAT (blue) and MLS/Aura (red) HNO3 profiles. The horizontal dashed line represents theflight altitude level.
47
Fig. 11. Comparison of HNO3 profiles retrieved from MARSCHALS scans 11 and 12 (grey) with MI-PAS/ENVISAT (blue) and MLS/Aura (red) HNO3 profiles. The horizontal dashed line represents theflight altitude level.
47
Fig. 11.Comparison of HNO3 profiles retrieved from MARSCHALS scans 11 and 12 (grey) with MIPAS/ENVISAT (blue) and MLS/Aura(red) HNO3 profiles. The horizontal dashed line represents the flight altitude level.
Fig. 12. (a) HNO3 values retrieved from MARSCHALS as a function of pressure (from 90 to 200 hPa)and latitude and longitude of the instrument during the flight. The black line corresponds to the 125 hPalevel while grey points represent the MARSCHALS retrieval grid points. (b) HNO3 MLS/Aura valuesas a function of pressure and latitude, longitude for the scans marked with triangles in Fig. 2a.
48
Fig. 12. (a)HNO3 values retrieved from MARSCHALS as a function of pressure (from 90 to 200 hPa) and latitude and longitude of theinstrument during the flight. The black line corresponds to the 125 hPa level while grey points represent the MARSCHALS retrieval gridpoints.(b) HNO3 MLS/Aura values as a function of pressure and latitude, longitude for the scans marked with triangles in Fig.2a.
5.4 Nitric acid
In Fig. 10, we present the results obtained for the retrievalof HNO3 profiles from band C and band D data. The pro-files obtained from band B data are not reported since theinformation on HNO3 contained in this band was not suffi-cient to produce significant results. HNO3 values retrievedby MARSCHALS show the presence of a filament of polarair with higher HNO3 values, between 14 and 16 km.
An example of the comparison of HNO3 data retrievedfrom MARSCHALS for scan 11 in band D and scan 12 inband C and coincident HNO3 profiles from MLS/Aura, andMIPAS/ENVISAT is reported in Fig.11. In general we cannotice a very good agreement.
Looking at Fig. 2a, we can notice that MARSCHALSlimb scans from 11 to 20 approximately sounded the Arc-tic polar vortex, while scans from 36 to 47 explored a fila-ment of vortex air, and finally scans from 6 to 10 from 21to 35 and from 48 to 54 were performed outside the vor-tex. This behaviour is reflected in HNO3 values retrievedby MARSCHALS at about 125 hPa, reported in Fig.12awith respect to pressure and latitude, longitude of the in-strument during the flight (where the black line marks the
125 hPa level) with higher HNO3 values found in correspon-dence of vortex air and filament of vortex air. The coincidentMLS/Aura HNO3 values along the orbit track between 68◦ Nand 76◦ N latitude crossing the first two flight legs (Fig.12b)show a similar behaviour at 125 hPa (marked by the blackline), thus confirming MARSCHALS results. The capabilityof the MARSCHALS instrument to resolve the filament ofpolar vortex air is crucial for the investigation of horizontalmixing processes in the UTLS atmospheric region.
5.5 Nitrous oxide
N2O profiles can be retrieved only from band B data, wherefew N2O spectral lines are present near one of the ozonelines. The obtained results are reported in Fig.13. As can beseen in the figure, the information content of MARSCHALSband B is not particularly high, but it is sufficient to enablethe MARC code to retrieve the N2O VMR values. Due tothe choice we made to use relatively large a priori errors, inorder to impose a weak constrain on the measurements, theobtained N2O profiles are sometimes oscillating.
The comparison of N2O profiles retrieved fromMARSCHALS and MIPAS/ENVISAT profiles andMLS/Aura show a quite good agreement, especially
www.atmos-meas-tech.net/6/2683/2013/ Atmos. Meas. Tech., 6, 2683–2701, 2013

2696 E. Castelli et al.: Measurement of the Arctic UTLS composition in presence of clouds
Fig. 13. As in Fig. 5 but for N2O retrieved from band B.
49
Fig. 13.As in Fig.5 but for N2O retrieved from band B.
Fig. 14. Comparison of N2O profile retrieved from MARSCHALS scan 10 (grey) with MI-PAS/ENVISAT (blue) and MLS/Aura (red) N2O profiles. The horizontal dashed line represents the flightaltitude level.
50
Fig. 14.Comparison of N2O profile retrieved from MARSCHALSscan 10 (grey) with MIPAS/ENVISAT (blue) and MLS/Aura (red)N2O profiles. The horizontal dashed line represents the flight alti-tude level.
at low altitude (see Fig.14 for scan 10) even if theMARSCHALS N2O profiles show some oscillations withrespect to other instruments. Since few N2O spectral linesare present into MARSCHALS band B, the obtained resultscan be considered a proof of the robust analysis performedon MARSCHALS data of the PREMIER-Ex flight fromKiruna.
5.6 Carbon monoxide
CO has only one spectral feature in band D and therefore itcan be retrieved from the measurements of that band. Veryclose to its emission there are few CH3Cl spectral lines.These lines badly interfere with the CO emission at low al-titudes, where the pressure broadening is quite large. As al-ready said in Sect.4.2, the IG2 profile of CH3Cl at polar
latitudes resulted to be overestimated, producing unrealisticlow values of CO at low altitudes. Therefore, during the revi-sion process of this paper, we have repeated the analysis sub-stituting the IG2 profile with measurements taken by MLS.In Fig.15we present the retrieval obtained for CO from bandD scans. As can be seen in Fig.15c, the information contentof band D for CO is not particularly high and low CO valuesare found around 13 km along the whole flight. Low valuesare also found at lower altitudes for scans from 20 to 29.These values are in reasonably good agreement with the COdata predicted by the CLaMS model, even if the comparisonof MARSCHALS CO data with the MLS/Aura ones (an ex-ample is reported in Fig.16a for MARSCHALS scan 11),show that we still find slightly lower values around 150 hPa(13 km).
In order to further analyse the capability of theMARSCHALS instrument to measure CO profiles, we re-port here also some results obtained during the mid-latitudetest flight performed on 4 November 2009 (and then namedTC9 flight). Unfortunately the TC9 flight was performed overan irregular flight path that prevents the optimal use of themeasurements acquired in the limb-sounding geometry. Inaddition the analysis of the spectral response functions ofthe channeliser measured in the laboratory, performed afterthe TC9 flight, showed that one of the channels with vari-able spectral response function was located near the CO line(Spang et al., 2012), and for this reason a channeliser re-ordering was performed before the PREMIER-Ex Campaign(Sect.2.2). However in Fig.16b, we present the results ob-tained in the analysis of scan 8. The retrieved CO profile is inquite good agreement with MLS/Aura version 3.3 coincidentdata. The results obtained during the TC9 and the PREMIER-Ex Campaign highlight the MARSCHALS capability of re-trieving CO.
Atmos. Meas. Tech., 6, 2683–2701, 2013 www.atmos-meas-tech.net/6/2683/2013/

E. Castelli et al.: Measurement of the Arctic UTLS composition in presence of clouds 2697
Fig. 15. As in Fig. 5 but for CO retrieved from band D.
51
Fig. 15.As in Fig.5 but for CO retrieved from band D.
Fig. 16. (a) Comparison of CO profile retrieved from MARSCHALS scan 11 (grey) of PrEx 1 withMLS/Aura (red) CO profiles. (b) Comparison of CO profile retrieved from MARSCHALS scan 8 (grey)of TC9 with MLS/Aura (red) CO profiles. The horizontal dashed line represents the flight altitude level.
52
Fig. 16. (a) Comparison of CO profile retrieved from MARSCHALS scan 11 (grey) of PrEx 1 withMLS/Aura (red) CO profiles. (b) Comparison of CO profile retrieved from MARSCHALS scan 8 (grey)of TC9 with MLS/Aura (red) CO profiles. The horizontal dashed line represents the flight altitude level.
52
Fig. 16. (a)Comparison of CO profile retrieved from MARSCHALS scan 11 (grey) of PrEx 1 with MLS/Aura (red) CO profiles.(b) Com-parison of CO profile retrieved from MARSCHALS scan 8 (grey) of TC9 with MLS/Aura (red) CO profiles. The horizontal dashed linerepresents the flight altitude level.
5.7 Clouds
As already said in Sect.4.1 to account for possiblecontinuum-like cloud contamination of MARSCHALS spec-tra we retrieve external continuum profiles (Fig.17) in theform of a cross section contribution to the spectrum. Sinceits interpretation is not straightforward, in the following anal-ysis we provide the corresponding extinction coefficient inkm−1 obtained from the retrieved external continuum usingthe ideal gas law.
As can be seen in Fig.3a, the small values obtained forthe reducedχ2 during the flight suggest that the retrievedvalues of the external continuum were sufficient to modelthe effects of clouds for almost all the flight. In one caseonly, for scan number 51, the retrieved extinction coefficientreaches a value (1.4× 10⁻³ km−1, slightly higher than the1. × 10−3 km−1 threshold,Del Bianco et al., 2007) that sug-gests the presence of a cloud whose opacity is such to deserve
a proper simulation in the retrieval procedure. In this case,the inclusion of the MSSF (Mie Scattering Source Function)module, described inDel Bianco et al.(2007), for the calcu-lation of the scattering contribution given by the cloud shouldbe considered. This module computes the scattering, absorp-tion and extinction coefficients of the cloud and the scatter-ing source function to be included into the radiative trans-fer equation. This calculation is performed using as input themean radius (R) and the number density of the cloud parti-cles and some information about the cloud phase (ice/water).Since the retrieved external continuum cannot provide allthis information, external information about the cloud prop-erties has to be used. In particular, we used a constantR
value and phase taken from the MODIS (MODerate reso-lution Imaging Spectroradiometer) instrument on-board theTerra satellite, whose measurements are in close temporalcoincidence with MARSCHALS measurements (R = 25 mi-cron, ice particles), while the cloud vertical extension (from
www.atmos-meas-tech.net/6/2683/2013/ Atmos. Meas. Tech., 6, 2683–2701, 2013

2698 E. Castelli et al.: Measurement of the Arctic UTLS composition in presence of clouds
Fig. 17. (a) External continuum retrieved from all bands and (b) its retrieval (biased) error. Units1027 cm2.
53
Fig. 17. (a)External continuum retrieved from all bands and(b) its retrieval (biased) error. Units 1027cm2.
Fig. 18. Extinction coefficient retrieved from MARSCHALS scan 51 with the standard analysis (MSSFmodule off, in blue) and with MSSF module on (in red). The horizontal dashed line indicates the aircraftaltitude during scan acquisition.
54
Fig. 18.Extinction coefficient retrieved from MARSCHALS scan 51 with the standard analysis (MSSF module off, in blue) and with MSSFmodule on (in red). The horizontal dashed line indicates the aircraft altitude during scan acquisition.
12 to 10 km) was inferred from the retrieved profiles of theexternal continuum (see Fig.18) and the number density(N = 0.35 cm−3) was in the range of values observed by in-situ instruments on-board the Geophysica during the descent.By repeating the analysis for scan 51 with the MSSF moduleon and these inputs, we obtain the results displayed in red inFig. 19.
In Fig. 18, we report the profile of the retrieved extinc-tion coefficient for the standard analysis (blue) and for theanalysis performed with the MSSF module on (red). It canbe noticed that, when the cloud is simulated into the forwardmodel, the retrieved extinction profile approaches zero, con-firming the correct cloud modelling into the MARC FM. TheVMR profiles retrieved with the MSSF module on, presentedin Fig. 19 in red, show slightly less oscillations compared tothe ones retrieved with the MSSF module off (in blue). How-ever, the fact that the external continuum retrieval is sufficientto produce good results is highlighted by the almost identicalχ2 values obtained in the case of standard analysis and theanalysis with the inclusion of the MSSF module.
The presence of high clouds in the second part of the flightis confirmed by instruments on-board the M-55 Geophysicaand on-board the satellites. Information about cloud cover-age during the flight is given by the OCM module snapshots,
that captured the presence of low clouds during the first leg,no cloud during the second leg and a layer of high altitudeclouds on the third leg. This cloud scenario is also con-firmed by the MIPAS-STR Cloud Index values (CI,Spanget al., 2004), shown in Fig. 126 ofCortesi et al.(2012).The CI map showed low clouds during the first leg of theflight (Cloud Top Height (CTH) below 9–8 km), no cloudsup to 5 km in the second leg and high altitude clouds (CTHup to 12–11 km) in the third leg. Also MODIS and Cloud-Aerosol Lidar and Infrared Pathfinder Satellite Observations(CALIPSO) (Winker et al., 2009) coincident data confirm thepresence of high altitude clouds (CTH about 11–12 km) incoincidence with MARSCHALS tangent points during thethird flight leg. The fact that MIPAS-STR measurements per-formed in the infrared spectral range were not available be-low cloud CTH, while the MARSCHALS measurements per-formed in the millimetre-wave were not affected by cloudpresence apart from one scan highlights the importance ofthe millimetre-wave spectral region to explore the UTLS re-gion.
Atmos. Meas. Tech., 6, 2683–2701, 2013 www.atmos-meas-tech.net/6/2683/2013/

E. Castelli et al.: Measurement of the Arctic UTLS composition in presence of clouds 2699
Fig. 19. (a) Temperature, (b) H2O, (c) O3 and (d) HNO3 retrieved from MARSCHALS scan 51 using(red) or excluding (blue) the MSSF module.
55
Fig. 19. (a)Temperature,(b) H2O, (c) O3 and(d) HNO3 retrieved from MARSCHALS scan 51 using (red) or excluding (blue) the MSSFmodule.
6 Conclusions
In this paper, we presented the results from the data analy-sis of limb sounding observations of the Arctic UTLS, theMARSCHALS data analysis of the PREMIER-Ex flight per-formed on 10 March from Kiruna, Sweden.
For the first time the instrument was operating in itsfull configuration with all the three spectral bands work-ing. The availability of all the spectral bands allowed toretrieve the vertical profiles of temperature, water vapour,O3, HNO3, N2O and CO, as well as to extract informa-tion about the presence of thick clouds. The PREMIER-Exflight of 10 March 2010 was aimed at studying horizontalmixing processes in the UTLS. The MARSCHALS instru-ment revealed the presence of a filament of polar air withenhanced HNO3 values, as predicted by the PV values fromECMWF. The filament from 16 to 14 km was well traced bythe MARSCHALS instrument and the observation backed upby validation with MLS/Aura data. The presence of low andhigh altitude clouds during the flight did not have a signif-icant impact on MARSCHALS spectra apart from a singlescan for which a cloud modelling algorithm was applied forthe first time to real data with very good results. The pos-sibility to retrieve CO profile from millimetre-wave spectrawas thoroughly explored, since in the PREMIER mission themillimetre-wave sensor STEAM-R was the only instrumentable to provide CO measurements.
As an air-borne demonstrator for the STEAM-Rmillimetre-wave limb sounder, the MARSCHALS in-strument widely demonstrated its capability in this flight.The testing and demonstration of the inverse modellingof MARSCHALS measurements provided crucial in-formation in the perspective of future deployment ofmillimetre-wave radiometers from space, like the STEAM-Rinstrument. The quality of the retrieval products obtained
from MARSCHALS limb spectra in the Arctic region is,in fact, relevant both for the information content of theindividual measurements in the millimetre-wave region,as well as for their potential synergy with the informationretrieved from independent and collocated observations inthe infrared, like the ones from the InfraRed Limb Sounder(IRLS) of PREMIER.
The potential of combined retrieval of millimetre-waveand middle infrared limb measurements in the UTLS wassuccessfully tested using MARSCHALS measurements re-ported in this paper and MIPAS-STR data. Full details of thisactivity will be reported in a paper currently in preparationand are already published inCortesi et al.(2012).
Acknowledgements.The authors acknowledge ECMWF for accessto data. The MLS dataset used in this work were produced withthe Giovanni online data system, developed and maintained bythe NASA Goddard Earth Sciences (GES) Data and InformationServices Center (DISC). The MODIS data used in this studywere acquired as part of the NASA’s Earth-Sun System Divisionand archived and distributed by the MODIS Adaptive ProcessingSystem (MODAPS). The CALIOP data were obtained from theNASA Langley Research Center Atmospheric Science Data Center.We acknowledge J. Langen for useful comments. This activitywas performed as part of the project “PREMIER Analysis ofCampaign Data” under ESA contract N. 4000101374//10/NL/CT.The authors gratefully acknowledge all the PIs of the instrumentson-board the M-55 Geophysica during the PREMIER-Ex campaign.
Edited by: T. von Clarmann
www.atmos-meas-tech.net/6/2683/2013/ Atmos. Meas. Tech., 6, 2683–2701, 2013

2700 E. Castelli et al.: Measurement of the Arctic UTLS composition in presence of clouds
References
Arnone, E., Castelli, E., Papandrea, E., Carlotti, M., andDinelli, B. M.: Extreme ozone depletion in the 2010–2011 Arcticwinter stratosphere as observed by MIPAS/ENVISAT using a 2-D tomographic approach, Atmos. Chem. Phys., 12, 9149–9165,doi:10.5194/acp-12-9149-2012, 2012.
Barath, F. T., Chavez, M. C., Cofield, R. E., Flower, D. A., Fr-erking, M. A., Gram, M. B., Harris, W. M., Holden, J. R.,Jarnot, R. F., Kloezeman, W. G., Klose, G. J., Lau, G. K.,Loo, M. S., Maddison, B. J., Mattauch, R. J., McKin-ney, R. P., Peckham, G. E., Pickett, H. M., Siebes, G.,Soltis, F. S., Suttie, R. A., Tarsala, J. A., Waters, J. W., and Wil-son W. J.: The upper atmosphere research satellite microwavelimb sounder instrument, J. Geophys. Res., 98, 10751–10762,doi:10.1029/93JD00798, 1993.
Bianchini, G., Carli, B., Cortesi, U., Del Bianco, S., Gai,M., and Palchetti, L.: Test of far-infrared atmospheric spec-troscopy using wide-band balloon-borne measurements of theupwelling radiance, J. Quant. Spectrosc. Ra., 109, 1030–1042,doi:10.1016/j.jqsrt.2007.11.010, 2008.
Carli, B., Bazzini, G., Castelli, E., Cecchi-Pestellini, C., DelBianco, S., Dinelli, B. M., Gai, M., Magnani, L., Ridolfi, M.,and Santurri, L.: MARC: a code for the retrieval of atmosphericparameters from millimetre-wave limb measurements, J. Quant.Spectrosc. Ra., 105, 476–491, doi:10.1016/j.jqsrt.2006.11.011,2007.
Carlotti, M.: Global-fit approach to the analysis of limb-scanningatmospheric measurements, Appl. Optics, 27, 3250–3254,doi:10.1364/AO.27.003250, 1988.
Christensen, T., Knudsen, B. M., Streibel, M., Andersen, S. B., Be-nesova, A., Braathen, G., Claude, H., Davies, J., De Backer, H.,Dier, H., Dorokhov, V., Gerding, M., Gil, M., Henchoz, B.,Kelder, H., Kivi, R., Kyrö, E., Litynska, Z., Moore, D., Peters, G.,Skrivankova, P., Stübi, R., Turunen, T., Vaughan, G., Viatte, P.,Vik, A. F., von der Gathen, P., and Zaitcev, I.: Vortex-averagedArctic ozone depletion in the winter 2002/2003, Atmos. Chem.Phys., 5, 131–138, doi:10.5194/acp-5-131-2005, 2005.
Cortesi, U., Del Bianco, S., Gai, M., Dinelli, B. M., Castelli, E.,Gerber, D., Oelhaf, H., and Woiwode, W.: PREMIERAnalysis of Campaign Data – ESA-ESTEC Contract4000101374/NL/10/CT, TSRR Vol. 4, edited by: IFAC-CNR,available at:http://www.ifac.cnr.it/(last access: 23 March 2013),link Editorial Activities – TSRR Vol. 34, 2012.
Del Bianco, S., Carli, B., Cecchi-Pestellini, C., Dinelli, B. M.,Gai, M., and Santurri, L.: Retrieval of minor constituents ina cloudy atmosphere with remote-sensing millimetre-wave mea-surements, Q. J. Roy. Meteorol. Soc., 133, 163–170, 2007.
Dinelli, B. M., Alpaslan, D., Carlotti, M., Magnani, L., and Ri-dolfi, M.: Multi-target retrieval (MTR): the simultaneous re-trieval of pressure, temperature and volume mixing ratio profilesfrom limb-scanning atmospheric measurements, J. Quant. Spec-trosc. Ra., 84, 141–157, 2004.
Dinelli, B. M., Castelli, E., Carli, B., Del Bianco, S., Gai, M., San-turri, L., Moyna, B. P., Oldfield, M., Siddans, R., Gerber, D., Re-burn, W. J., Kerridge, B. J., and Keim, C.: Technical Note: Mea-surement of the tropical UTLS composition in presence of cloudsusing millimetre-wave heterodyne spectroscopy, Atmos. Chem.Phys., 9, 1191–1207, doi:10.5194/acp-9-1191-2009, 2009.
Dinelli, B. M., Arnone, E., Brizzi, G., Carlotti, M., Castelli, E.,Magnani, L., Papandrea, E., Prevedelli, M., and Ridolfi, M.:The MIPAS2D database of MIPAS/ENVISAT measurements re-trieved with a multi-target 2-dimensional tomographic approach,Atmos. Meas. Tech., 3, 355–374, doi:10.5194/amt-3-355-2010,2010.
ESA: Report for Mission Selection: PREMIER, ESA SP-1324/3 (3volume series), European Space Agency, Noordwijk, the Nether-lands, 2012.
Friedl-Vallon, F., Riese, M., Maucher, G., Lengel, A., Hase, F.,Preusse, P., and Spang, R.: Instrument concept and preliminaryperformance analysis of GLORIA, Adv. Space Res., 37, 2287–2291, doi:10.1016/j.asr.2005.07.075, 2006.
Gettelman, A., Hoor, P., Pan, L. L., Randel, W. J., Heg-glin, M. I., and Birner, T.: The extratropical upper tropo-sphere and lower stratosphere, Rev. Geophys., 49, RG3003,doi:10.1029/2011RG000355, 2011.
Hurst, D. F., Oltmans, S. J., Vömel, H., Rosenlof, K. H.,Davis, S. M., Ray, E. A., Hall, E. G., and Jordan, A. F.: Strato-spheric water vapor trends over Boulder, Colorado: analysisof the 30-yr Boulder records, J. Geophys. Res., 116, D02306,doi:10.1029/2010JD015065, 2011.
Kuhn, T., Tsujimaru, S., Buehler, S., and Verdes, C.: Character-ization of millimetre-wave spectroscopic signatures, TechnicalReport Contract No. 16377/02/NL/FF, European Space Agency(ESA), ESTEC, 2003.
Lacis, A. A., Wuebbles, D. J., and Logan, J. A.: Radiative forc-ing of climate by changes in the vertical distribution of ozone, J.Geophys. Res., 95, 9971–9981, doi:10.1029/JD095iD07p09971,1990.
Levenberg, K.: A method for the solution of certain problems inleast squares, Q. Appl. Math., 2, 164–168, 1944.
Livesey, N. J., Read, W. G., Froidevaux, L., Waters, J. W., San-tee, M. L., Pumphrey, H. C., Wu, D. L., Shippony, Z., andJarnot, R. F.: The UARS Microwave Limb Sounder version 5dataset: theory, characterization and validation, J. Geophys. Res.,108, 4378, doi:10.1029/2002JD002273, 2003.
Livesey, N. J., Van Snyder, W., Read, W. G., and Wagner P. A.: Re-trieval algorithms for the EOS Microwave Limb Sounder (MLS)instrument, IEEE T. Geosci. Remote, 44, 1144–1155, 2006.
Manney, G. L., Santee, M. L., Rex, M., Livesey, N. J., Pitts, M. C.,Veefkind, P., Nash, E. R., Wohltmann, I., Lehmann, R., Froide-vaux, L., Poole, L. R., Schoeberl, M. R., Haffner, D. P.,Davies, J., Dorokhov, V., Gernandt, H., Johnson, B., Kivi, R.,Kyrö, E., Larsen, N., Levelt, P. F., Makshtas, A., McEl-roy, C. T., Nakajima, H., Parrondo, M. C., Tarasick, D. W.,von der Gathen, P., Walker, K. A., and Zinoviev, N. S.: Un-precedented Arctic ozone loss in 2011, Nature, 478, 469–475,doi:10.1038/nature10556, 2011.
Mariotti, A., Moustaoui, M., Legras, B., and Teitelbaum, H.: Com-parison between vertical ozone soundings and reconstructed po-tential vorticity maps by contour advection with surgery, J. Geo-phys. Res., 102, 6131–6142, doi:10.1029/96JD03509, 1997.
Marquardt, D. W.: An algorithm for the least-squares estimation ofnonlinear parameters, SIAM, J. Appl. Math., 11, 431–441, 1963.
Mason, P.: A Review of the 2010 update of the Implementation Planfor the Global Observing System for Climate in Support of theUNFCCC, GCOS SC-XVIII, Doc. 13, 31 July, 2010.
Atmos. Meas. Tech., 6, 2683–2701, 2013 www.atmos-meas-tech.net/6/2683/2013/

E. Castelli et al.: Measurement of the Arctic UTLS composition in presence of clouds 2701
Moyna, B., Oldfield, M., Gerber, D., Rea, S., Siddans, R.,and Kerridge, B.: Technical Report: UAMS Upgrades ofMARSCHALS – Technical Data Pack, Final Report of ESAContract 21990/08/NL/EL “Upgrades to the MARSCHALSAirborne Millimetre/Submillimetre Wave Limb Sounder”, 23November, 2010.
Murtagh, D., Frisk, U., Merino, F., Ridal, M., Jonsson, A.,Stegman, J., Witt, G., Eriksson, P., Jiménez, C., Megie, G.,de la Noë, J., Ricaud, P., Baron, P., Pardo, J. R., Hauch-corne, A., Llewellyn, E. J., Degenstein, D. A., Gattinger, R. L.,Lloyd, N. D., Evans, W. F. J., McDade, I. C., Haley, C. S.,Sioris, C., von Savigny, C., Solheim, B. H., McConnell, J. C.,Strong, K., Richardson, E. H., Leppelmeier, G. W., Kyröla, E.,Auvinen, H., and Oikarinen, L.: An overview of the Odin atmo-spheric mission, Can. J. Phys., 80, 309–319, 2002.
Olberg, M., Frisk, U., Lecacheux, A., Olofsson, A. O. H.,Baron, P., Bergman, P., Florin, G., Hjalmarson, A., Lars-son, B., Murtagh, D. P., Olofsson, G., Pagani, L., Sandqvist, A.,Teyssier, D., Torchinsky, S. A., and Volk, K.: The Odin satellite:II. Radiometer data processing and calibration, Astron. Astro-phys., 402, 35–38, doi:10.1051/0004-6361:20030336, 2003.
Oldfield, M., Moyna, B., Allouis, E., Brunt, R., Cortesi, U., Elli-son, B., Eskell, J., Forward, T., Jones, T., Lamarre, D., Langen, J.,de Maagt, P., Matheson, D., Morgan, I., Reburn, J., and Sid-dans, R.: MARSCHALS: development of an airborne millimetrewave limb sounder, SPIE, 4540, 221–228, 2001.
Piesch, C., Gulde, T., Sartorius, C., Friedl-Vallon, F., Seefeld-ner, M., Wölfel, M., Blom, C. E., and Fischer, H.: Design ofa MIPAS instrument for high-altitude aircraft, Proc. of the 2ndInternat. Airborne Remote Sensing Conference and Exhibition,ERIM, Ann Arbor, MI, Vol. II, 199–208, 1996.
Remedios, J. J., Leigh, R. J., Waterfall, A. M., Moore, D. P.,Sembhi, H., Parkes, I., Greenhough, J., Chipperfield, M.P., andHauglustaine, D.: MIPAS reference atmospheres and compar-isons to V4.61/V4.62 MIPAS level 2 geophysical data sets, At-mos. Chem. Phys. Discuss., 7, 9973–10017, doi:10.5194/acpd-7-9973-2007, 2007.
Ridolfi, M. and Sgheri, L.: A self-adapting and altitude-dependentregularization method for atmospheric profile retrievals, At-mos. Chem. Phys., 9, 1883–1897, doi:10.5194/acp-9-1883-2009,2009.
Rodgers, C. D.: Inverse Methods for Atmospheric Sounding: The-ory and Practice, Series on Atmospheric, Oceanic and PlanetaryPhysics, Vol. 2, World Scientific Publishing Co., Singapore, 65–100, 2000.
Sandor, B. J., Read, W. G., Waters, J. W., and Rosenlof, K. H.:Seasonal behavior of tropical to midlatitude upper troposphericwater vapor from UARS MLS, J. Geophys. Res., 103, 25935–25947, doi:10.1029/98JD02272, 1998.
Solomon, S., Rosenlof, K. H., Portmann, R. W., Daniel, J. S.,Davis, S. M., Sanford, T. J., and Plattner, G.-K.: Contributions ofstratospheric water vapor to decadal changes in the rate of globalwarming, Science, 327, 1219–1223, 2010.
Spang, R., Remedios, J. J., and Barkley, M. P.: Colour indices forthe detection and differentiation of cloud types in infra-red limbemission spectra, Adv. Space Res., 33, 1041–1047, 2004.
Spang, R., Stroh, F., von Hobe, M., Gerber, D., Moyna, B., Old-field, M., Rea, S., Reburn, J., Siddans, R., Kerridge, B., Oel-haf, H., and Woiwode, W.: Data Acquisition Report of the Pre-mierEX Scientific Flights, Final Report for ESTEC Contract No.22670/09/NL/CT “PREMIER Experiment”, 25 May, 2012.
Urban, J., Lautié, N., Le Flochmoën, E., Jiménez, C., Eriksson, P.,de La Nöe, J., Dupuy, E., El Amraoui, L., Frisk, U., Jégou, F.,Murtagh, D., Olberg, M., Ricaud, P., Camy-Peyret, C., Du-four, G., Payan, S., Huret, N., Pirre, M., Robinson, A. D., Har-ris, N. R. P., Bremer, H., Kleinböl, A., Küllmann, K., Künzi, K.,Kuttippurath, J., Ejiri, M. K., Nakajima, H., Sasano, Y.,Sugita, T., Yokota, T., Piccolo, C., Raspollini, P., and Ri-dolfi, M.: Odin/SMR limb observations of stratospheric tracegases: validation of N2O, J. Geophys. Res., 110, D09301,doi:10.1029/2004JD005394, 2005a.
Urban, J., Lautié, N., Le Flochemoën, E., Jiménez, C., Eriksson, P.,de la Noë, J., Dupuy, E., Ekström, M., El Amraoui, L., Frisk, U.,Murtagh, D., Olberg, M., and Ricaud, P.: Odin/SMR limb ob-servations of stratospheric trace gases: level 2 processing ofClO, N2O, HNO3, and O3, J. Geophys. Res., 110, D14307,doi:10.1029/2004JD005741, 2005b.
Waters, J. W., Froidevaux, L., Harwood, R. S., Jarnot, R. F.,Pickett, H. M., Read, W. G., Siegel, P. H., Cofield, R. E.,Filipiak, M. J., Flower, D. A., Holden, J. R., Lau, G. K.,Livesey, N. J., Manney, G. L., Pumphrey, H. C., Santee, M. L.,Wu, D. L., Cuddy, D. T., Lay, R. R., Loo, M. S., Perun, V. S.,Schwartz, M. J., Stek, P. C., Thurstans, R. P., Boyles, M. A.,Chandra, K. M., Chavez, M. C., Chen, G. S., Chudasama, B. V.,Dodge, R., Fuller, R. A., Girard, M. A., Jiang, J. H., Jiang, Y.,Knosp, B. W., LaBelle, R. C., Lam, J. C., Lee, K. A., Miller, D.,Oswald, J. E., Patel, N. C., Pukala, D. M., Quintero, O.,Scaff, D. M., Van Snyder, W., Tope, M. C., Wagner, P. A., andWalch, M. J.: The Earth Observing System Microwave LimbSounder (EOS MLS) on the Aura satellite, IEEE T. Geosci. Re-mote, 44, 1075–1092, 2006.
Winker, D. M., Vaughan, M. A., Omar, A., Hu, Y., Pow-ell, K. A., Liu, Z., Hunt, W. H., and Young, S. A.:Overview of the CALIPSO mission and CALIOP data pro-cessing algorithms, J. Atmos. Ocean. Tech., 26, 2310–2323,doi:10.1175/2009JTECHA1281.1, 2009.
www.atmos-meas-tech.net/6/2683/2013/ Atmos. Meas. Tech., 6, 2683–2701, 2013