measuring congestion: learning from its data
TRANSCRIPT

Measuring Congestion: Learning From Operational Data
by
Daniela Bremmer Director of Strategic Assessment Washington State Department of Transportation PO Box 47374 Olympia, WA 98504-7374 Voice: 360-705-7953 Fax: 360-705-6813 Email: [email protected] Keith C. Cotton Information and Performance Analyst Washington State Department of Transportation PO Box 47374 Olympia, WA 98504-7374 Voice: 360-705-7936 Fax: 360-705-6813 Email: [email protected] Dan Cotey Systems Analysis Support and Reporting Washington State Department of Transportation PO Box 47325 Olympia, WA 98504-7325 Voice: 360-705-7990 Email: [email protected] Charles E. Prestrud Senior Transportation Planner Washington State Department of Transportation 410 Second Ave S. #300 Seattle, WA 98104-2887 Voice: 206-464-1271 Email: [email protected] Gary Westby Systems Improvement and Programming Manager (retired) Washington State Department of Transportation Publication (second revised) version submitted March 29, 2004 First revised version submitted November 14, 2003 Originally submitted August 1, 2003 Word count: 5,231 (excluding tables and figures) Tables and figures: 8 (equivalent of 2,000 words) Total, words and tables: 7,231

Bremmer, Cotton, Cotey, Prestrud & Westby 1
ABSTRACT
As transportation agencies develop operations-based approaches to congestion management and carefully weigh system investments in operations as well as capital improvements, new types of performance information and communication are clearly needed. Citizens expect action on traffic congestion and demand performance information that relates to their concerns and is easy to understand. Traditional congestion measurements are based on modeled speed estimates generated from volume and capacity information. They are difficult to communicate, fail to capture subtle changes in real-world system performance, and are inadequate for many aspects of evaluating specific impacts of projects on congestion.
The Washington State Department of Transportation (WSDOT), like other transportation agencies, has been grappling with new approaches to using operational data to monitor and measure system performance. This paper describes progress that the agency has made to date, and how this work ties into national efforts. Speed and travel time data derived from the loop detector network on Puget Sound urban freeways are used by WSDOT to measure and communicate real-time travel times on 12 major commute routes. Continued work toward analyzing different types of congestion distinguishes between recurrent congestion caused by inadequate capacity and non-recurrent congestion caused by incidents, inclement weather, and other factors such as travel to and from major sporting events. The agency has also made progress in measuring what is of most concern to commuters and haulers: travel time reliability.

Bremmer, Cotton, Cotey, Prestrud & Westby 2
INTRODUCTION
The freeway system in the central Puget Sound region was largely planned and built in the 1960s and 1970s. Since that time the region’s population has increased by more than a million people to over three million. Regional employment has grown during this time at an even more rapid rate. As a result of this rapid growth, peak period travel demand now exceeds highway capacity on much of the regional highway system. In addition to slowdowns that result from high traffic volumes, the high rate of utilization makes the system more vulnerable to severe congestion from incidents and other disrupting events.
These circumstances have heightened public concern about congestion, and influenced the way the Washington State Department of Transportation (WSDOT) addresses highway performance. Like many other state transportation agencies, WSDOT is faced with addressing public need while coping with stagnant or diminishing levels of funding. In response, WSDOT has developed three distinct strategies:
• Manage traffic breakdowns more aggressively and significantly expand incident response programs. • Encourage more efficient travel behavior by providing system users with enhanced traffic information. • Plan system investments with measurable benefits for congestion.
WSDOT is concentrating on reporting the effectiveness of congestion action strategies in support of travel time reliability and system efficiency. The use and application of real-time, operational data is an integral part of measuring these strategies. In recognition of the importance of measuring operational performance, WSDOT has focused close attention on collecting and analyzing data gained from its Intelligent Transportation System (ITS) loop detector network. This data can be integrated with other information to draw larger conclusions about regional traffic performance factors. This paper summarizes how WSDOT uses operational data to assist in measuring congestion, evaluating capital and operational improvements, and communicating traveler information and system performance to the public. It is not intended as the definitive work on congestion measurement; rather, it describes WSDOT’s experience in learning more about congestion measurement.
NEW DIRECTIONS IN CONGESTION MEASUREMENT
Citizens, businesses and public officials in Washington want to know that the state is doing everything it can to alleviate congestion on freeways and highways. WSDOT therefore seeks congestion measures that can communicate with the public as well as assist the department in developing capital and operational strategies that address congestion.
State of the Practice in Congestion Measurement
Many widely used congestion measures, including travel time index and delay per person, rely on the data provided by the Federal Highway Administration’s (FHWA) Highway Performance Monitoring System (HPMS). The Texas Transportation Institute’s (TTI) annual Urban Mobility Report, for example, relies on average annual daily traffic (AADT) volumes and lane data. The data is used in mathematical models of highway performance in order to estimate traffic speeds. These estimated speeds are then compared to “free flow” speeds and the differences are used to compute measures of delay.
The model assumes that as volumes increase on highways, traffic will slow. The amount of delay is calculated using standard speed estimates that are applied nationwide. HPMS-based measures allow for general comparisons of urbanized areas nationwide, but the data limitations have presented obstacles to derivation of detailed information about several important operational strategies, such as signal timing coordination, incident response, or Washington state's significant investment in High-Occupancy-Vehicle (HOV) lanes. Acknowledging the need to measure the effects of key operational improvements, TTI’s 2003 Urban Mobility Report estimated the congestion reduction effects of public transportation, HOV lanes, traffic signal coordination, freeway incident management, and ramp metering in the 75 cities studied (1).
Practitioners are well aware of the limitations of traditional information sources, which can’t capture subtle changes in system performance (2). As estimates based on traffic models, their accuracy and usefulness are limited

Bremmer, Cotton, Cotey, Prestrud & Westby 3
(3). Further, macro-level models do not analyze systems in enough detail to evaluate impacts on congestion patterns and conditions from specific operational or capital investments.
It now seems to be broadly agreed that the problem of congestion must be addressed both through new construction and operational improvements in existing facilities (4). Measurements are needed that can capture the effectiveness of these strategies. There appears to be gathering consensus that congestion measures, to be useful in informing policy responses, must distinguish between congestion caused by incidents (“non-recurrent” congestion) and congestion caused by inadequate capacity (“recurrent” congestion). Some believe that even finer gradations must be developed for congestion measures to be useful for investment choices.
One way to improve congestion measures is to incorporate data collected from ITS programs implemented in many urban areas around the country (3). Existing ITS data collection can be leveraged to provide a resource for a variety of applications, including performance monitoring (2). Real-time traffic flow data has the potential to provide very accurate measurements of average speeds and both recurring and nonrecurring delays, which can then be used to directly measure congestion (3).
The Mobility Monitoring Program (mobility.tamu.edu/mmp), a joint research effort of TTI and Cambridge Systematics for FHWA, relies on archived operational data that contains detailed information about traffic volumes and speeds to report mobility and reliability trends. Over the next few years, the number of cities participating in the program is expected to increase (5).
Recent work has emphasized the importance of travel time reliability (variability in travel), which requires detailed performance monitoring (3, 6). One application in this area has found that the largest benefit to users of Advanced Traveler Information Systems (ATIS) in urban areas is improved on-time reliability. Using Mitretek Systems’ Heuristic On-line Web-Linked Arrival Time Estimation (HOWLATE) method, a three-month study concluded that ATIS users realize time savings not from reductions of in-vehicle travel times, but by budgeting less time for travel and still arriving on-time, and arriving early and late less frequently (7).
WSDOT’s Congestion Measurement Approach: Learning from ITS Data
Recognition of the need for new types of information led WSDOT to begin a major initiative in developing new congestion measures. In December 2001 WSDOT implemented new congestion measurement principles. These principles are: • Use real-time measurements (rather than computer models) whenever possible. • Measure congestion due to incidents as distinct from congestion due to inadequate capacity. • Show how reducing congestion caused by incidents improves travel time reliability. • Demonstrate both long-term trends and short-to-intermediate term results. • Communicate possible congestion fixes using an "apples-to-apples" comparison with the current situation (for
example, if the trip takes twenty minutes today, how many minutes shorter will it be if we add a freeway lane or improve the interchanges?)
• Use plain English to describe measurements.
WSDOT’s approach focuses on measuring system efficiency and travel time reliability, and communicating progress that the public can see and experience in the short and intermediate term. The point is to report the effectiveness of all the congestion management and relief programs the agency is undertaking. Operational data is the only data source with the level of real-time detail required for developing measurements and assessing investments.
The rest of this paper describes WSDOT’s collection, analysis, and application of ITS data for measuring congestion and the strategies designed to address it.
COLLECTING AND ANALYZING OPERATIONAL DATA
In the Puget Sound region, operational data are collected from more than 4,000 induction loops embedded in the pavement of the state highway system. These loops are arrayed to gather data for each lane at roughly 360 highway

Bremmer, Cotton, Cotey, Prestrud & Westby 4
locations. The loop system has been in place for decades and is the mainstay of the region’s operation of traffic signals and the freeway management system.
Loop technology is based on running an electric current though a wire embedded in the pavement, which creates a magnetic field. When a vehicle passes over the loop, the magnetic field is disrupted. An electronic device measures the change and logs the presence of a vehicle.
Loops provide two measurements: vehicle count and the length of time each vehicle occupies the loop. This data is then used to estimate traffic volumes and speeds. Speed estimation using single loops is accurate to 5 or 10 mph (8 to 16.1 kph) in free-flow steady speed conditions. Error in the measurement can be introduced when gaps between vehicles are extremely small, where there is excessive lane changing over the loops, or when traffic remains stopped over the loop for a long duration of time. To compensate for this variability, WSDOT has also installed “speed stations” (double loops) at about 100 locations in the freeway system. These stations provide accuracy to within 1 or 2 mph (1.6 to 3.2 kph) at ordinary driving speeds. WSDOT also performs periodic accuracy checks by comparing loop data with direct observation and measurement of actual driving speeds in the corridor.
Data from the loop detectors are relayed to a centralized Transportation System Management Center (TSMC), where they are automatically converted into a color-coded map depicting traffic flow, as shown in Figure 1. This digital traffic flow map is updated approximately once per minute, twenty-four hours per day. The map can be accessed on the Internet at www.wsdot.wa.gov/pugetsoundtraffic/cameras/. In addition, the measurements from the speed stations and single loop detectors are used to adjust freeway ramp meter timing and inform traffic managers about conditions on the freeway system. Travel times are calculated using speed and volume data from multiple loops in a series along the freeway.
The TSMC also monitors 295 closed circuit video cameras placed at strategic locations around the region. These cameras allow TSMC personnel to observe traffic conditions, identify causes of congestion, and regulate traffic entering the highway system on any of 203 metered ramps. Direct video observations of blocking incidents are logged by TSMC staff for potential use with other incident data.
At any given time, approximately eight percent of the freeway loops are flagged as out of reliable operation. The University of Washington’s Transportation Center (TRAC) developed detailed quality control procedures (8) that WSDOT uses to detect loop failures, exclude bad data, and support the level of accuracy that is needed for traffic management and for reporting traffic conditions to the public. From years of loop detector operation, WSDOT has amassed a large archive of speed and volume data. This data is continuous in time, 24 hours per day 365 days per year, broad in geographic coverage, available for individual lanes or sets of lanes, and available in increments of time as short as five minutes. These qualities make the data a potentially useful resource for tasks such as analyzing the onset of congestion in the shoulders of peak periods, tracking trends, and comparing of peak and off-peak conditions. The size, completeness, and detail of the data archive generally allow statistical inferences to be drawn with reasonable confidence levels.
WSDOT’S APPLICATION OF OPERATIONAL DATA FOR CONGESTION MEASUREMENT
The use of operational data allowed WSDOT to develop several important tools to measure congestion, evaluate capital and operational improvements and communicate enhanced traveler information to the public.
Measuring and Communicating Real-TimeTravel Times
The collection and analysis of real-time travel time information was the critical element in WSDOT’s congestion measurement development. As a first step, WSDOT developed real travel time measurements and baseline data for 11 of the most congested routes in the Puget Sound area. It was also important to develop measurements that were easy to communicate to the public. Measures such as the Travel Rate Index, as well as measures generated from WSDOT’s own Travel Delay model, have proven lacking in this respect. On the other hand, system performance information in terms of travel times (time to travel from Point A to Point B) is a tool the public and every traveler can relate to and understand. The implementation of real-time travel measurement and public reporting began in May of 2002, when WSDOT launched a dynamic, real-time, website displaying average and current travel times for 11 common commutes (including reversible lanes) at www.wsdot.wa.gov/pugetsoundtraffic/traveltimes (see Figure 2). Another route was added in 2003 for a total of 12.
Bremmer, Cotton, Cotey, Prestrud & Westby 5
For example, looking at the table in Figure 2, the current travel time at 1:30 p.m., Wednesday, July 30, 2003, on I-405 northbound, Tukwila to Bellevue was 17 minutes, a minute more than the average travel time of 16 minutes for that segment. The average travel time is the average time for a trip starting at this time during the past few months, derived from WSDOT’s archived loop detector data. The current travel time is refreshed at five-minute increments to reflect current conditions. Travelers and haulers can use this information to make trip decisions based on both current and typical conditions, and to compare travel times on alternative routes.
The popular service is now widely used by commuters, either directly from WSDOT’s websites or indirectly through media that link to WSDOT’s information. WSDOT’s Travel Times website had 254,676 page views in June 2003. Television and radio stations use the information daily in their own traffic reports — television news programs scroll the travel times along the bottom of the screen. Newspaper, radio, and television websites publish the information as well, taking a live feed direct from WSDOT’s servers.
WSDOT also publishes annual travel time comparisons as part of its widely distributed quarterly performance report Measures, Markers and Mileposts, also referred to as the Gray Notebook. A comprehensive web based archive and index of the Gray Notebook allows easy public access to all current and previously published congestion related performance measures (www.wsdot.wa.gov/accountability/graybookindex.htm).
Distinguishing Between Recurrent and Non-Recurrent Congestion
The ability to identify and measure different types of congestion is key to developing appropriate responses. WSDOT’s immediate need to measure the effectiveness of its newly expanded incident response program led to an effort to develop distinct measures of incident-related (non-recurring) and non-incident-related (recurring) congestion. Recurring congestion is defined as relatively predictable congestion caused by routine traffic volumes operating in a typical environment. Non-recurring congestion is defined as unexpected or unusual congestion caused by unpredictable or transient events such as accidents, inclement weather, or construction. WSDOT’s goal was to develop an analytical procedure that could define the effect of incidents on traffic flow.
The lack of incident data sets that could be correlated with the archived travel time data required an interim measurement solution. As a first step, WSDOT, in coordination with TRAC, developed baseline statistics for travel times on the 11 commute corridors described above for incident and non-incident conditions and analyzed travel time distributions for all monitored trips. The study concluded that it was not possible to accurately decide which travel times have been affected by incidents simply by examining individual travel times and their distribution.
Based on the examination of the real-time travel data for 2001 and sample incident data, the study recommended that, until complete incident data could be compiled and correlated, “incident-affected trips” could be defined as any trip that takes twice as long as a free-flow trip for that route. These trips have a Trip Time Factor of greater than 2.0 (Trip Time Factor = Actual Trip Time / Free Flow Trip Time).
This temporary approach seemed to provide a close enough approximation of recurrent and non-recurrent measures to allow WSDOT to conduct a preliminary analysis. WSDOT examined archived data for 2001 and 2002 for the 11 routes and compared changes in travel time performance for both recurrent and non-recurrent congestion (as defined by the two times free flow threshold) during peak times. Table 1 is an excerpt of this analysis. Although several routes show slightly different travel times from 2001 to 2002, the number of days when travel times exceeded the two times free flow threshold declined significantly for all routes. More information is available at www.wsdot.wa.gov/accountability/peaktime/default.htm.
After development of the Washington Incident Tracking System (WITS), a database that logs every incident response, WSDOT and TRAC entered the second phase of development and correlated travel time data with actual incident data. The focus was to identify the causes of congestion on individual highway segments and during particular time periods. Data on incidents that resulted in congestion were drawn from the WITS database and the TSMC incident log.
TRAC’s review of September and October 2002 incident and performance data for the mainlines of the central Puget Sound freeway system under surveillance found that non-recurring delay generally ranges between 30

Bremmer, Cotton, Cotey, Prestrud & Westby 6
and 50 percent of all peak period, peak direction delay and that lane blocking incidents generally account for 10 to 35 percent of all non-recurring delay (9). The study shows that the causes of congestion vary considerably from one location to another, and with respect to peak and off-peak periods. Correlating incidents with real travel time data also revealed that some occurrences of extreme congestion were not related to recorded incidents, even though traffic flows behaved as if under incident conditions. This congestion relationship and measurement is complex and requires further analysis. Interpreting this rich ITS travel time and incident data source will continue to be an important effort for TRAC and for WSDOT.
Measuring and Communicating Travel Time Reliability
Travel time reliability and predictability is of utmost importance to the public and is often of even greater concern than the travel time itself. Variability in travel times leads to uncertainty that commuters and haulers find frustrating and costly.
Using archived loop data of all travel times, WSDOT can calculate a reasonable approximation of the “worst case” travel time scenario using the travel time at the 95th percentile (95 percent of the travel times are equal to or less than this marker) for a particular route. WSDOT uses this measure to track changes and measure performance. The measurement can be calculated using archived loop data at 5-minute increments for any day of the week or combination of days. Table 2 provides an example of improvements in reliability from 2001 to 2002. On I-405 northbound from Tukwila to Bellevue, for example, the 95 percent reliable travel time during the morning peak period improved by two minutes.
A second application of this measurement tool aims to enhance web-based traveler information. In June 2003 WSDOT launched a new web page called “Calculate Your Commute” that provides a 95 percent reliable travel time for web users at www.wsdot.wa.gov/pugetsoundtraffic/traveltimes/reliability. Travelers using the service can choose one of 12 Puget Sound commute routes, the direction of travel and the time they plan to leave in 5-minute intervals from 6 a.m. to 7 p.m. Entering a route at the selected time, commuters can expect to be on time for work 19 out of 20 working days a month (95 percent of trips), if they allow for the calculated travel time. The 95 percent reliable times presented on the web page are based on archived weekday travel time data for 2002.
At the time of this paper’s submittal, marketing of this product is just beginning and public response has yet to be assessed. This tool will be further refined and possibly expanded for other than commute purposes, such as special event or destination trips where travelers cannot risk being late.
USING CONGESTION MEASURES TO EVALUATE INVESTMENT RETURNS
Using the measures described above, WSDOT expects to track changes in average travel times, recurrent and non-recurrent congestion travel times, and 95 percent reliable travel times. Ultimately, the agency will be able to evaluate investment return as a function of congestion impacts from capital and operational projects targeted at specific congestion problems. WSDOT can also use the operational data with other data sets to draw stronger conclusions about congestion factors and trends.
Evaluating Incident Response
A significant percentage of all congestion results from traffic incidents; WSDOT therefore has placed increasing emphasis on incident response to expedite the clearance of freeway accidents and other disruptions to traffic flow. The extensive surveillance and monitoring capability in place on Puget Sound highways allows WSDOT to respond swiftly to incidents that interfere with traffic flow. On February 13, 2002, WSDOT signed a Joint Operations Policy Statement (JOPS) with the Washington State Patrol (WSP) to integrate resources for responding to incidents and increasing security. JOPS established a target for the Incident Response Team (IRT) that all incidents on highways be cleared within 90 minutes.
The 2002 Washington Legislature funded an additional 19 incident response vehicles. Today, the IRT has 44 units that rove on 35 highway segments statewide during peak periods, with most of the units concentrated in the

Bremmer, Cotton, Cotey, Prestrud & Westby 7
central Puget Sound region. Tracking changes in non-recurrent congestion and reliability will help the agency evaluate its investment in IRT. More work is needed in this area.
Initial deployment of IRT was based on geographic coverage and limited information about frequent accident locations. Operational data about congestion provides a more data-driven means for deployment, and will be used to deploy IRT units at the most frequent trouble spots at key times, where they can have the greatest benefit.
The use of ITS data in combination with other data sources aids in assessing the economic benefits of WSDOT’s IRT strategies. WSDOT conducted a disabled vehicle case study on a section of I-405 where incident response vehicles were recently deployed, in order to calculate the delay savings gained from Incident Response. Comparison with and without IR shows an average seven-minute reduction in clearance time.
Using a disabled vehicle incident that occurred on I-405 at milepost 13.5 (21.7 km), WSDOT calculated the savings to other motorists in fuel and other operating costs at $5,800 per incident. Cost of time savings is even greater, at more than $7,000 per incident. In order to calculate the savings, WSDOT applied volume information provided by loop detector data, and the volume of commercial truck traffic to other types of traffic, provided by HPMS data (for more information visit www.wsdot.wa.gov/accountability/archives/GrayNotebookJun-03.pdf#page=48).
The information capabilities of ITS can also support direct intervention and facilitation of incident management and clearance. Traffic system management can benefit from emulation and adaptation of Supervisory Control And Data Acquisition (SCADA) systems in process flow management and similar industrial applications. These opportunities can leverage and expand the use of ITS from applications focused solely on traveler information. The issue is to unclog obstructions and restore flow, not simply to inform incoming flow of the circumstance, “Congestion Ahead.” Development of techniques and measures in this realm largely lie ahead. Harbingers of future endeavors include some of the features that have emerged from the JOPS agreement, such as rapid deployment of WSP accident investigation teams armed with photogrammetric assessment technology, to support meeting the performance goal of 90-minute maximum incident clearance times on state freeways.
Integrating ITS Data With Other Data to Compare Trends and Identify Congestion Factors
Integrating ITS data into the datasets routinely used by transportation professionals has provided compelling reasons to expand ITS data collection and usability. The correlation of reported accidents along a corridor with speed, travel times and reliability is a recent example of WSDOT data integration. Table 3 provides a side-by-side comparison of changes in travel times for conditions with and without accidents during the morning and evening peak periods as well as throughout the day on I-405. This comparison covers January through November of 2001 and 2002 and shows an overall improvement in travel conditions. All travel time categories decreased across the board. These improvements may be attributed to the decrease in accidents. However, the number of accidents during the morning peak period remained unchanged while travel conditions improved. Since accident and congestion trends are mutually reinforcing, it is entirely possible that both expanded incident response and lower traffic volumes have contributed to the significant decline in accidents and improved traffic flow.
Measuring Investment Returns
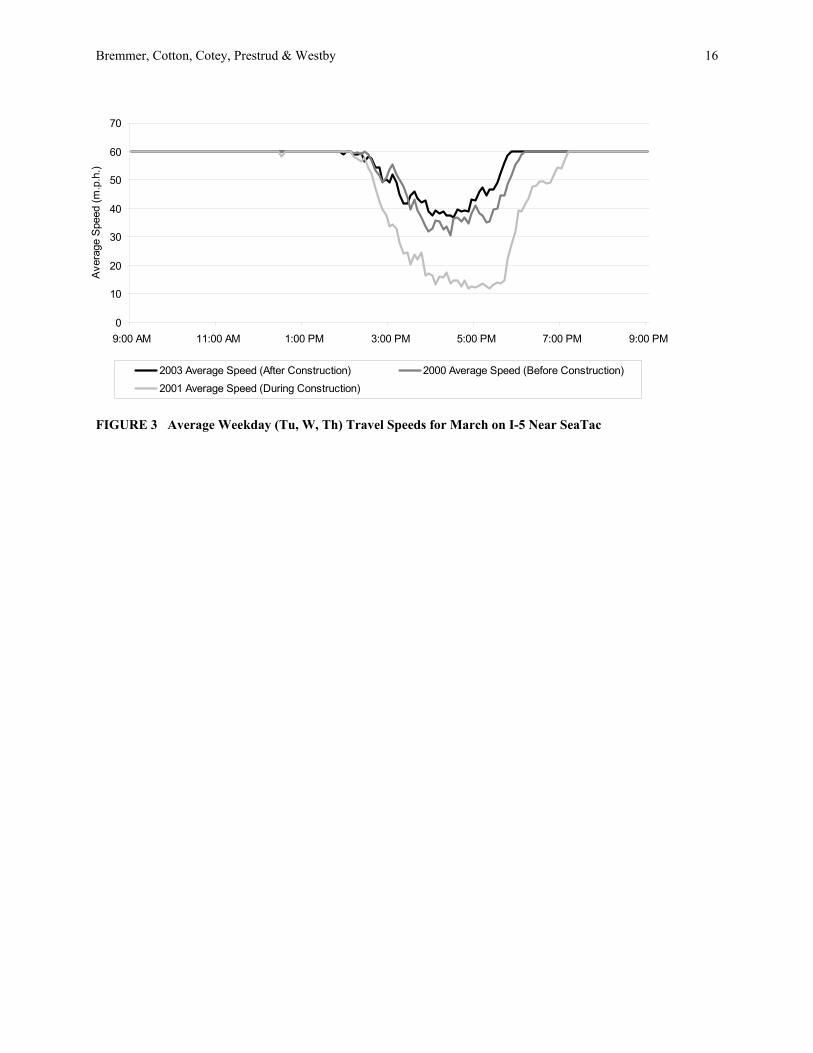
Data collection for assessing current highway deficiencies is common practice in planning capital improvements. Using models to estimate increased throughput is also a common practice. The availability of ITS data enables WSDOT to measure the speed and volume through a corridor before, during, and after a capital improvement is made. For example, a recent improvement to I-5, from near Southcenter to the City of Federal Way, added an HOV lane in the southbound direction. In Figure 3, the graph shows that prior to construction in year 2001, the average speed at 4 p.m. was 33 mph (53.1 kph). During construction in 2001 speeds fell to an average of 17 mph (27.4 kph). But following completion of the project speeds improved to approximately 38 mph (61.2 kph) despite an increase in volume. This analysis of operational data confirms the project has improved peak period travel speeds and increased throughput in this congested corridor.

Bremmer, Cotton, Cotey, Prestrud & Westby 8
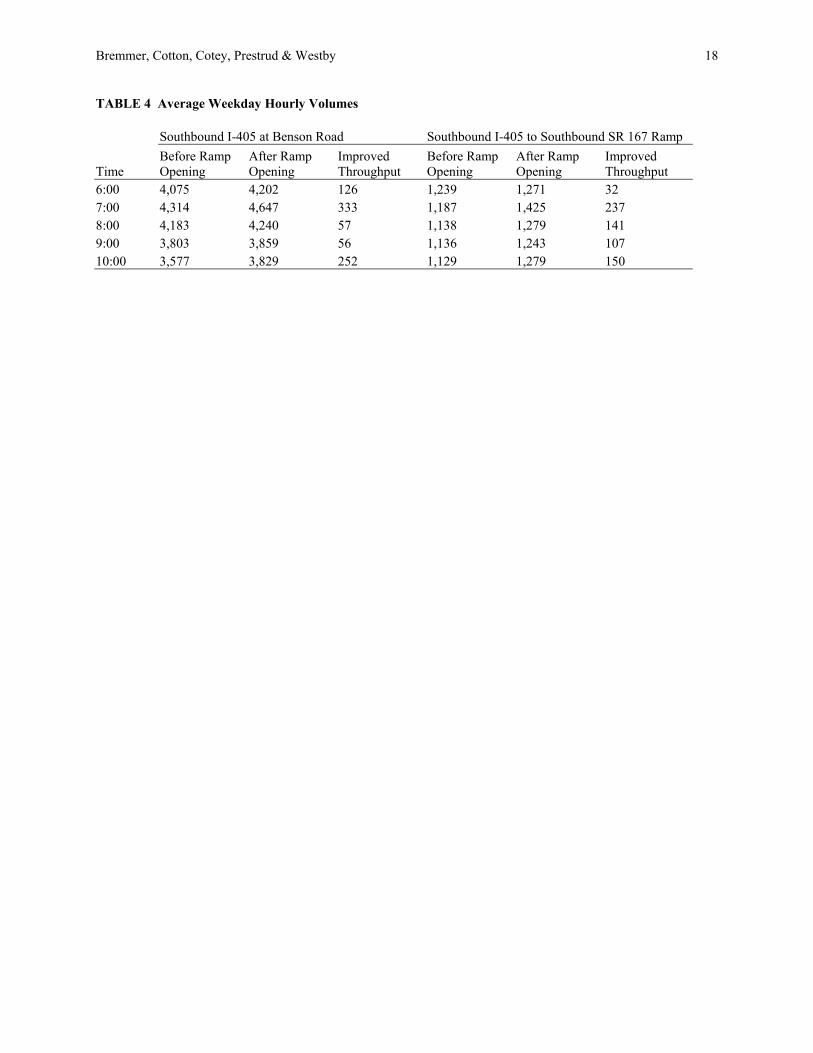
A second example is the new off ramp from southbound I-405 to southbound SR 167, which opened to traffic on Sunday, April 6, 2003. In the three weeks after opening to traffic, the conditions on southbound I-405 had generally improved during the morning peak. The graphic depiction in Figure 4 shows that highway speeds on I-405 increased and back-ups decreased. Table 4 shows that vehicle throughput during the morning commute on the ramp has increased by about 8 percent and on the mainline by about 13 percent.
Linking of strategies for measurement of investment returns with other performance measurement applications related to congestion will serve important goals of rationalizing and supporting capital investments in system facilities. Use of operational data to link these measurement areas will help build the credibility and usefulness of the measurement products. Much work remains to be done in this area.
EXPANSION OF DATA COLLECTION OPPORTUNITIES
WSDOT is exploring other ways to gather travel time information in areas where it is not feasible to expand loop infrastructure. As the regional traffic monitoring system has expanded WSDOT has begun use of optical scanners to measure traffic speed and volume. This data collection method has been implemented on state highways in Pierce County, south of Seattle. The data is processed in essentially the same way as loop data, and displayed in the same format on a digital flow map of highways in the Tacoma area (similar to Figure 1).
Additional research is under way to use existing traffic video equipment to produce speed estimates. Another project focuses on using automatic vehicle locators (AVL) equipped in vehicles as speed probes and aims to incorporate these “virtual” sensors into the existing Transportation Management System real-time database so they can be used by traffic management staff in the same way that loop data is used. The system will be updated to use Global Positioning System (GPS) technology.
Another congestion measure and ITS data project focuses on correlating weather elements and congestion data and to apply such knowledge to predict weather-related congestion and incidents. The impact of weather on traffic may be one of the only non-recurring congestion phenomena that can be accurately predicted.
OTHER RESEARCH NEEDS
Practitioners using ITS data would benefit from further research in the mining, application and interpretation of ITS data. Suggested research topics include:
• Applying travel times and reliability measures to planning and decision making; • Forecasting travel times, delay, and reliability; • Developing travel time measures for highway segments without ITS data; and • Cost-benefit analysis of operational and capital strategies that improve reliability and travel times.
CONCLUSION
The strategies used to manage congestion are evolving, and the measurements used to describe congestion must evolve as well. Recognizing the need for new types of information to meet public expectations and evaluate investments, WSDOT established principles to guide measure development. This led to an expanded use of operational data provided by an existing ITS, which allows detailed, real-time analysis of system conditions and effective communication to the public. Congestion measurement remains a complex task but detailed information from ITS data sheds light on patterns and conditions that traditional congestion measures fail to do.
Like other practitioners, WSDOT has learned a great deal in the past several years through the application of operational data. WSDOT’s measurement efforts are a work in progress. As this work continues, the agency is keen to build upon this and the experiences of other practitioners. The findings to date reflect the opportunities, as well as the complexities, of contemporary congestion analysis and the challenges ahead in further analyzing and applying ITS data.
Bremmer, Cotton, Cotey, Prestrud & Westby 9
REFERENCES
1. Schrank, D., and T. Lomax. The 2003 Urban Mobility Report. Texas Transportation Institute, 2003. 2. Orski, C. K. Major Surface Transportation Issues in the 180th Congress. Innovation Briefs, Vol. 14, No. 2,
Mar/Apr 2003. 3. Thompson, D. Performance Measurement. Presented at the 28th Annual Summer Ports, Waterways, Freight &
International Trade Conference, Portland, Ore., 2003. 4. Bureau of Transportation Statistics. Better Road Congestion Measures Are Needed. BTS Issue Brief, No. 4, May
2003. 5. Turner, S., T. Lomax, R. Margiotta, and V. Pearce. FHWA’s Mobility Monitoring Program: Transforming
Gigabytes of Archived Operations Data Into Mobility and Reliability Performance Measures. Presented at the 2002 Institute of Transportation Engineers Annual Meeting, Philadelphia, 2002.
6. Shaw, T. NCHRP Synthesis 311: Performance Measures of Operational Effectiveness for Highway Segments and Systems. Transportation Research Board, National Research Council, Washington, D.C., 2003.
7. Wunderlich, K., M. Hardy, J. Larkin, and V. Shah. On-Time Reliability Impacts of Advanced Traveler Information Services (ATIS): Washington, DC Case Study. U.S. Department of Transportation, ITS Joint Program Office, 2001.
8. Ishimaru, J. CDR User’s Guide, Washington State Transportation Center, 1998. 9. Hallenbeck, M.E., J. Ishimaru, and J. Nee. Measurement of Recurring Versus Non-Recurring Congestion,
Washington State Transportation Center, 2003.
Bremmer, Cotton, Cotey, Prestrud & Westby 10
TABLES AND FIGURES
Figure 1 Puget Sound Flow Map
Figure 2 Central Puget Sound Travel Times
Table 1 2001 and 2002 Peak Recurrent and Non-Recurrent Travel Times – Highlighted Improvements
Table 2 2001 and 2002 Peak Travel Time Reliability – Highlighted Improvements
Table 3 General Purpose Lane Performance, I-405 Northbound, Tukwila to Bellevue, January through November 2001 and 2002
Figure 3 Average Weekday (Tu, W, Th) Travel Speeds for March on I-5 Near SeaTac
Figure 4 Average Weekday Congestion, I-405 Southbound at SR 167 Interchange
Table 4 Average Weekday Hourly Volumes

Bremmer, Cotton, Cotey, Prestrud & Westby 11
FIGURE 1 Puget Sound Flow Map

Bremmer, Cotton, Cotey, Prestrud & Westby 12
FIGURE 2 Central Puget Sound Travel Times

Bremmer, Cotton, Cotey, Prestrud & Westby 13
TABLE 1 2001 and 2002 Peak Recurrent and Non-Recurrent Travel Times – Highlighted Improvements
Average Travel Time For Travel Times Less Than 2 X Freeflow
Average Travel Time For Travel Times Greater Than 2 X Freeflow
Number of Days When Travel Times Exceeded 2 X Freeflow
Route Route Description Distance 2001 2002 Change 2001 2002 Change 2001 2002 ChangeI-5 SeaTac to Seattle (a.m.) 13.0 mi (20.9 km) 22 min. 22 min. 0 min. 29 min. 28 min. -1 min. 84 44 -40 I-405 Tukwila to Bellevue (a.m.) 13.5 mi (21.7 km) 22 min. 22 min. 0 min. 34 min. 34 min. 0 min. 198 178 -20 I-405 Bothell to Bellevue (a.m.) 9.7 mi (15.6 km) 17 min. 16 min. -1 min. 23 min. 23 min. 0 min. 142 125 -17 SR 167 Renton to Auburn (p.m.) 9.8 mi (15.8 km) 15 min. 14 min. -1 min. 28 min. 29 min. 1 min. 133 92 -41

Bremmer, Cotton, Cotey, Prestrud & Westby 14
TABLE 2 2001 and 2002 Peak Travel Time Reliability – Highlighted Improvements
Average Peak Travel Time
Change in Travel Time Buffer a.k.a. 95th Percentile*
Route Route Description Distance 2001 2002 Change 2001 2002 ChangeI-5 SeaTac to Seattle (a.m.) 13.0 mi (20.9 km) 24 min. 23 min. -1 min. 31 min. 28 min. -3 min. I-405 Tukwila to Bellevue (a.m.) 13.5 mi (21.7 km) 31 min. 30 min. -1 min. 43 min. 41 min. -2 min. I-405 Bothell to Bellevue (a.m.) 9.7 mi (15.6 km) 20 min. 19 min. -1 min. 27 min. 26 min. -1 min. SR 167 Renton to Auburn (p.m.) 9.8 mi (15.8 km) 22 min. 19 min. -3 min. 39 min. 37 min. -2 min. *95% Reliable Travel Times: You can expect to be on time for work 19 out of 20 working days a month (or 95% of your trips,) if you allow for the 95% Reliable Travel Time.
Note: The travel times in the above table are the highest recorded travel times measured during the a.m. or p.m. peak period. These travel times represent the worst-case congested condition.

Bremmer, Cotton, Cotey, Prestrud & Westby 15
TABLE 3 General Purpose Lane Performance, I-405 Northbound, Tukwila to Bellevue, January through November 2001 and 2002 6-10 a.m. Peak Period (Tu,W,Th) 3-7 p.m. Peak Period (Tu,W,Th) All Day (Tu,W,Th) 2001 2002 % Change 2001 2002 % Change 2001 2002 % ChangeNumber of Accidents 90 90 0.0% 73 49 -32.9% 278 203 -27.0%
Average Travel Time with and without Accidents 27.1 minutes 25.5 minutes -6.1% 19.4 minutes 18.6 minutes -4.2% 17.9 minutes 17.3 minutes -3.5%
Average Travel Time without Accidents 26.8 minutes 23.5 minutes -12.2% 18.6 minutes 18.1 minutes -2.5% 17.5 minutes 16.7 minutes -4.2%
Average Travel Time with Accidents 32.0 minutes 28.8 minutes -9.9% 21.8 minutes 20.4 minutes -6.5% 19.9 minutes 19.3 minutes -2.8%
Bremmer, Cotton, Cotey, Prestrud & Westby 16
0
10
20
30
40
50
60
70
9:00 AM 11:00 AM 1:00 PM 3:00 PM 5:00 PM 7:00 PM 9:00 PM
Aver
age
Spee
d (m
.p.h
.)
2003 Average Speed (After Construction) 2000 Average Speed (Before Construction)2001 Average Speed (During Construction)
FIGURE 3 Average Weekday (Tu, W, Th) Travel Speeds for March on I-5 Near SeaTac

Bremmer, Cotton, Cotey, Prestrud & Westby 17
FIGURE 4 Average Weekday Congestion, I-405 Southbound at SR 167 Interchange
Bremmer, Cotton, Cotey, Prestrud & Westby 18
TABLE 4 Average Weekday Hourly Volumes Southbound I-405 at Benson Road Southbound I-405 to Southbound SR 167 Ramp
Time Before Ramp Opening
After Ramp Opening
Improved Throughput
Before Ramp Opening
After Ramp Opening
Improved Throughput
6:00 4,075 4,202 126 1,239 1,271 32 7:00 4,314 4,647 333 1,187 1,425 237 8:00 4,183 4,240 57 1,138 1,279 141 9:00 3,803 3,859 56 1,136 1,243 107 10:00 3,577 3,829 252 1,129 1,279 150