measuring the distribution and costs of congestion
TRANSCRIPT

Measuring the Measuring the Distribution and Costs of Distribution and Costs of CongestionCongestion
Tim LomaxTim LomaxTexas Transportation InstituteTexas Transportation Institutehttp://mobility.tamu.eduhttp://mobility.tamu.edu

The Congestion The Congestion Measurement StoryMeasurement Story
WHAT?WHAT? Travel time, variations, Travel time, variations, compare to goalscompare to goals
WHY?WHY? Is it a problem? Causes?Is it a problem? Causes?
WHERE?WHERE? Areawide, SubAreawide, Sub--Region, Region, Corridor, Facility, ServiceCorridor, Facility, Service
WHEN?WHEN? Day, Week, Season, EventsDay, Week, Season, Events
HOW?HOW? Fix it? Define Success?Fix it? Define Success?

Performance Performance Measure NeedsMeasure Needs
Start with Goals and VisionStart with Goals and VisionCongestion and ReliabilityCongestion and ReliabilityLocation, Time & CostsLocation, Time & CostsEffect of Solutions and TrendsEffect of Solutions and TrendsConnect to ExpectationsConnect to ExpectationsConnect to Individual ActionsConnect to Individual Actions–– TravelersTravelers–– BusinessesBusinesses–– AgenciesAgencies

What?What?Urban Mobility MeasuresUrban Mobility Measures
Delay/Person Delay/Person –– Hours per yearHours per year
Buffer Time Buffer Time IndexIndex
Travel Time Peak Period Travel TimeIndex Free Flow Travel Time
95th %Travel Time
Average Travel Time
Average Travel Time
__

1.00
1.10
1.20
1.30
1.40
1.50
Small Medium Large VeryLarge
19822000
Travel Time IndexTravel Time IndexTr
avel
Tim
e In
dex
Population Group

Annual Delay per PersonAnnual Delay per Person
020406080
100
Small Medium Large VeryLarge
19822000
Hou
rs
Population Group

Growth of Congested TravelGrowth of Congested Travel1982 to 20001982 to 2000
Uncongested69%
Extreme5%Severe
8%
Moderate10%
Heavy8%
1982 2000
Moderate13%Heavy
14%
Severe20%
Extreme19%
Uncongested34%

1.00
1.20
1.40
1.60
1.80
2.00Tr
avel
Tim
e In
dex
Small Medium Large Very LargePopulation
Congestion levels in each of the 75 urban
areas studied.
Where? Where? Congestion and PopulationCongestion and Population
Inde
x V
alu
e
1.00
1.50
2.00
2.50
3.00
3.50
1 2 :00 A M 2 :00 A M 4 :00 A M 6 :00 A M 8 :00 A M 1 0:00 A M 1 2 :00 P M 2 :00 P M 4 :00 P M 6 :00 P M 8 :00 P M 1 0:00 P M 1 2 :00 A M
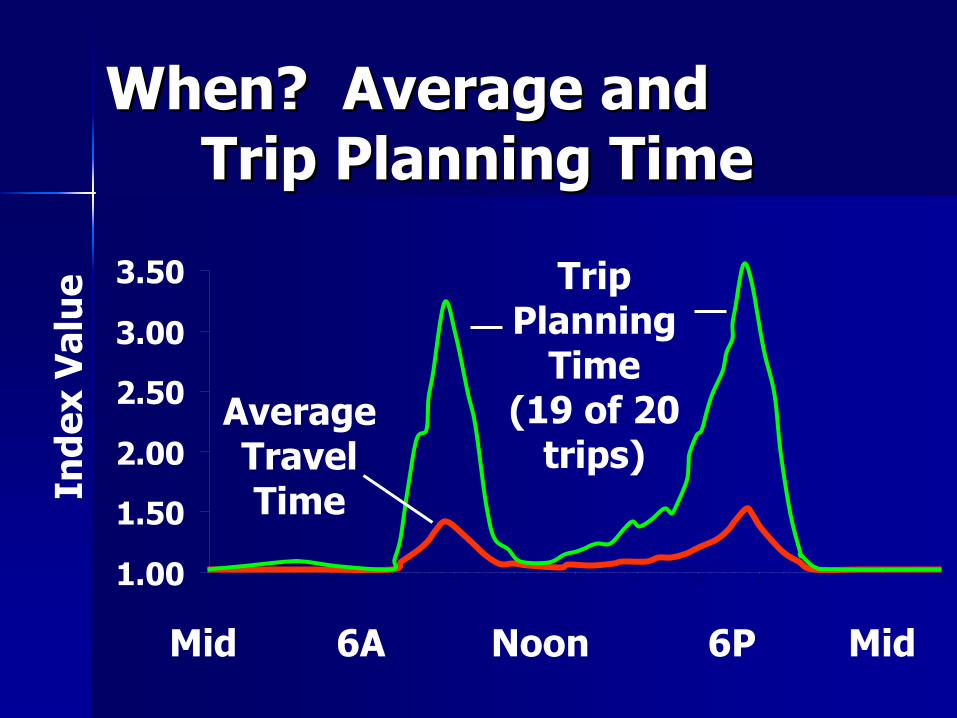
When? Average and When? Average and Trip Planning TimeTrip Planning Time
Mid 6A Noon 6P Mid
Trip Planning
Time(19 of 20
trips)AverageTravelTime
0%
5%
10%
15%
20%
25%
1.00 1.20 1.40 1.60 1.80 2.00Travel Time Index
Per
cen
t of
Day
s in
20
01
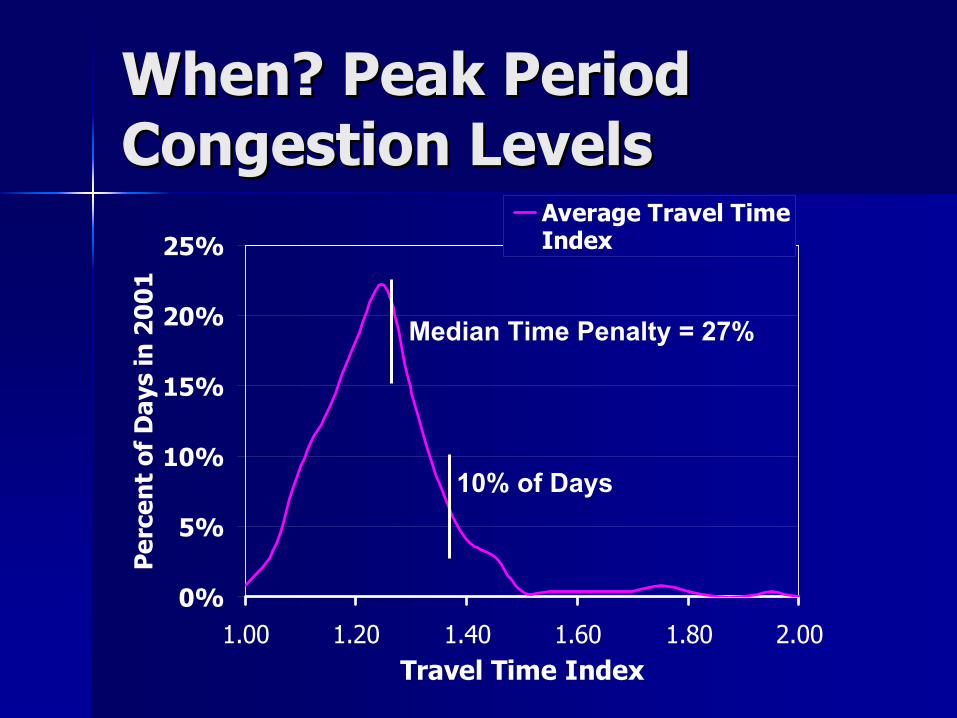
Average Travel TimeIndex
Median Time Penalty = 27%
10% of Days
When? Peak Period When? Peak Period Congestion LevelsCongestion Levels
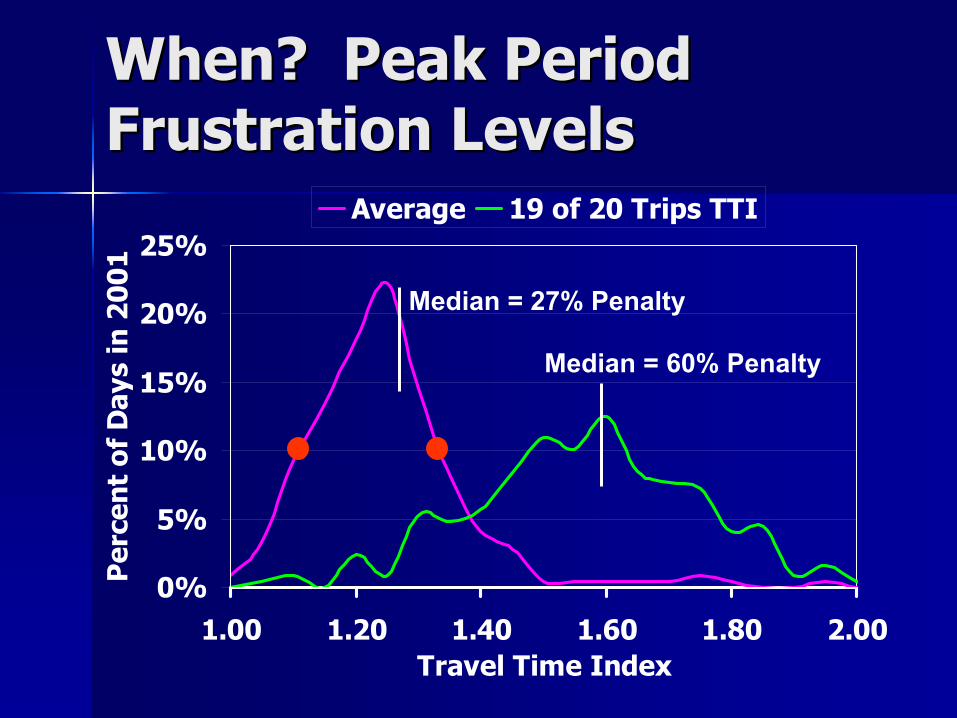
When? Peak Period When? Peak Period Frustration LevelsFrustration Levels
0%
5%
10%
15%
20%
25%
1.00 1.20 1.40 1.60 1.80 2.00Travel Time Index
Per
cent
of
Day
s in
200
1
Average 19 of 20 Trips TTI
Median = 60% Penalty
Median = 27% Penalty

0%
10%
20%
30%
40%
50%
1.00 1.10 1.20 1.30 1.40 1.50Travel Time Index
Buf
fer T
ime
Inde
xCongestion and Reliability Congestion and Reliability Are RelatedAre Related
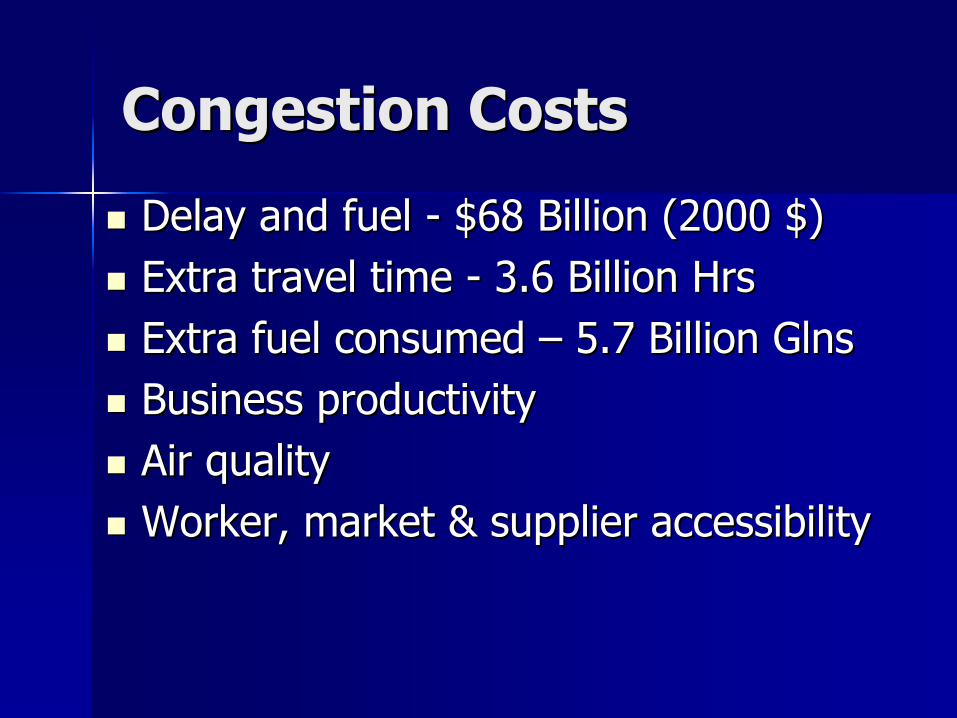
Congestion CostsCongestion Costs
Delay and fuel Delay and fuel -- $68 Billion (2000 $)$68 Billion (2000 $)Extra travel time Extra travel time -- 3.6 Billion Hrs3.6 Billion HrsExtra fuel consumed Extra fuel consumed –– 5.7 Billion 5.7 Billion GlnsGlnsBusiness productivityBusiness productivityAir qualityAir qualityWorker, market & supplier accessibilityWorker, market & supplier accessibility

Congestion Successes Congestion Successes ––How are They Measured?How are They Measured?
Lower travel timeLower travel timeMore optionsMore optionsCheaper travelCheaper travelPredictable travel timesPredictable travel timesShorter tripsShorter tripsLess congested time and spaceLess congested time and space

Toolbox:Toolbox:No Lack of Solutions No Lack of Solutions
Alternate Hours of TravelAlternate Hours of TravelVariable Pricing StrategiesVariable Pricing StrategiesFlow SignalsFlow SignalsTraffic Signal ImprovementsTraffic Signal ImprovementsIncident ManagementIncident ManagementEvent ManagementEvent ManagementLocal Bus ServiceLocal Bus ServiceNeighborhood Circulator BusNeighborhood Circulator BusActivity Center Circulator BusActivity Center Circulator BusExpress and Park & Ride ServiceExpress and Park & Ride ServiceDemandDemand--Response & Hybrid Bus ServiceResponse & Hybrid Bus ServiceVanpoolsVanpoolsTelecommutingTelecommutingUrban Development PatternsUrban Development PatternsParking StrategiesParking StrategiesBicycle and PedestrianBicycle and PedestrianLight RailLight RailBus Rapid TransitBus Rapid TransitCommuter / Light RailCommuter / Light RailManaged Lanes/Truck LanesManaged Lanes/Truck Lanes
Electronic Toll Collection SystemsElectronic Toll Collection SystemsIntersection ImprovementsIntersection ImprovementsOneOne--Way StreetsWay StreetsChangeable Lane AssignmentsChangeable Lane AssignmentsArterial Access ManagementArterial Access ManagementTechnologyTechnology--Based Transit ImprovementsBased Transit ImprovementsRidesharingRidesharingTelecommutingTelecommutingAssessing the Transportation ImpactsAssessing the Transportation ImpactsParking StrategiesParking StrategiesBicycle and Pedestrian ElementsBicycle and Pedestrian ElementsFare StrategiesFare StrategiesStreet ContinuityStreet ContinuityNew Lanes New Lanes New Toll RoadsNew Toll RoadsGrade SeparationGrade SeparationGeometric DesignGeometric DesignHOV LanesHOV LanesMultimodal CorridorsMultimodal CorridorsFreight Rail ImprovementsFreight Rail Improvements
Why not more “Success”?
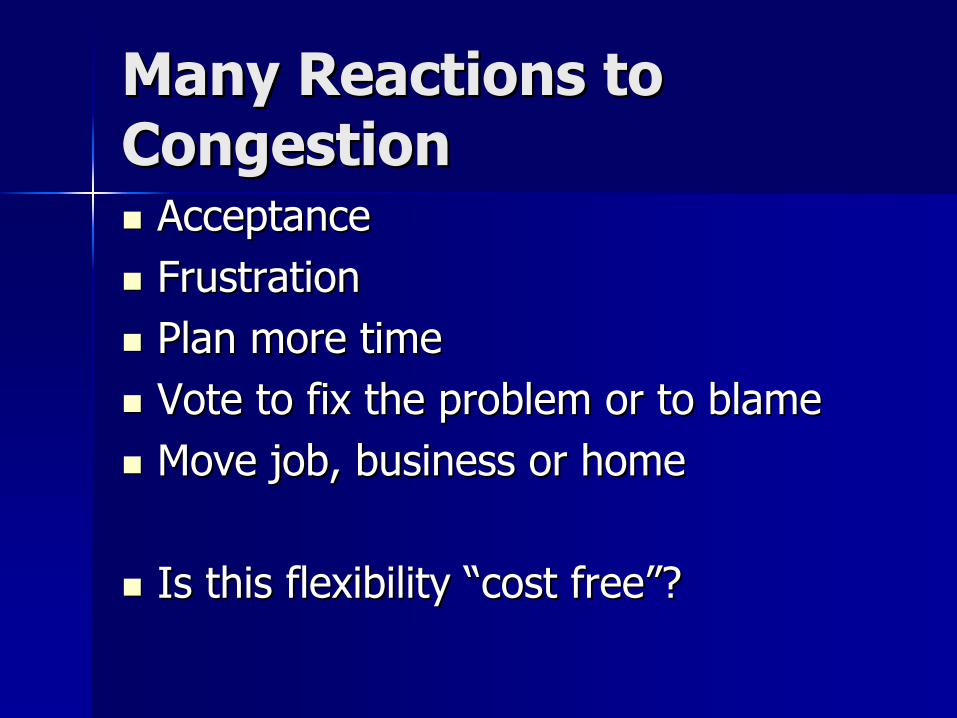
Many Reactions to Many Reactions to CongestionCongestion
AcceptanceAcceptanceFrustrationFrustrationPlan more timePlan more timeVote to fix the problem or to blameVote to fix the problem or to blameMove job, business or homeMove job, business or home
Is this flexibility “cost free”?Is this flexibility “cost free”?

Manage the Construction Process
Increase System Efficiency
Build More Capacity
Manage the Demand
Diversify Development Patterns
Variety of Solution TypesVariety of Solution Types100%
0%
% V
arie
s fo
r Eac
h C
ity
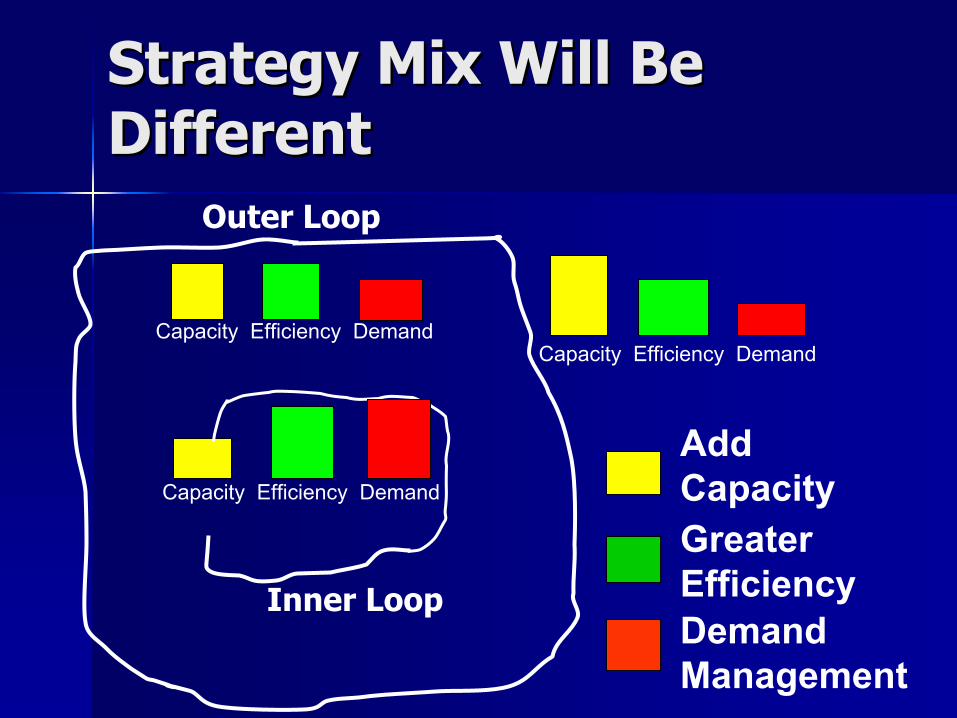
Strategy Mix Will Be Strategy Mix Will Be DifferentDifferent
Capacity Efficiency Demand
Add CapacityGreater EfficiencyDemand Management
Capacity Efficiency DemandCapacity Efficiency Demand
Inner Loop
Outer Loop

Adding Adding RoadsRoads Helps…Helps…
40 Areas – Demand 30% faster
6 Areas—Demand = Roads
29 Areas –Demand 10% to 30% faster
Year
Con
gest
ion
Incr
ease
(%)
250
200
150
100
50
0 1.0
1.5
2.0
2.5
3.0
3.5
1980 1985 1990 1995 2000

0
30
60
90
120
150
Small Medium Large VeryLarge
Lane-MilesNeededLane-MilesAdded
. . . But, Difficult to Add . . . But, Difficult to Add Enough Roadway.Enough Roadway.
Lan
e M
iles
Population Group
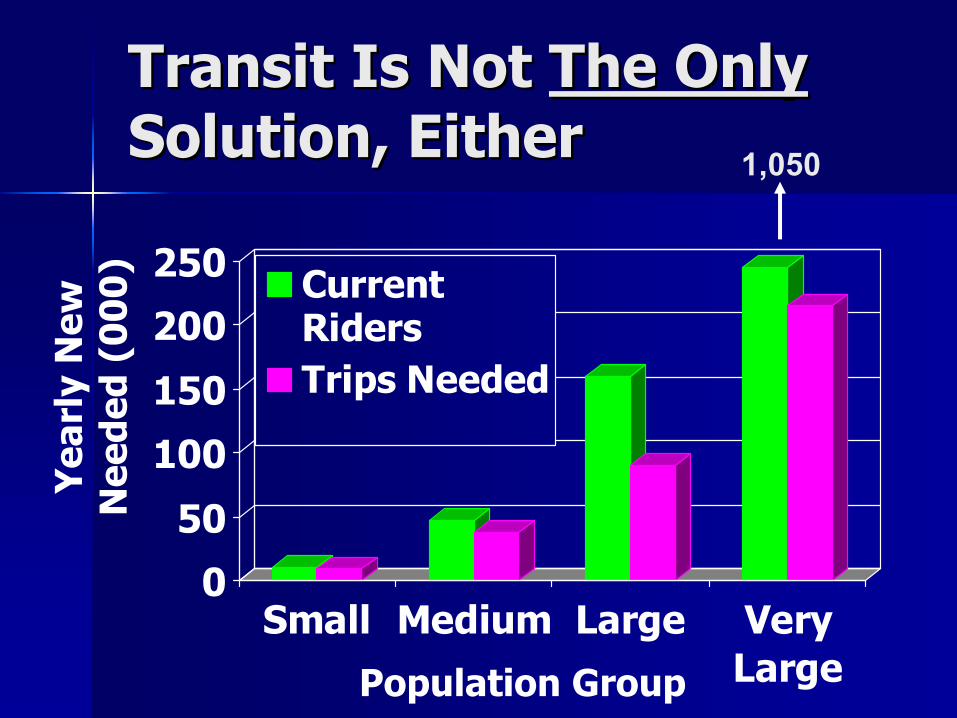
0
50
100
150
200
250
Small Medium Large VeryLarge
CurrentRidersTrips Needed
Transit Is Not Transit Is Not The OnlyThe OnlySolution, EitherSolution, Either
Yea
rly
New
Nee
ded
(00
0)
Population Group
1,050
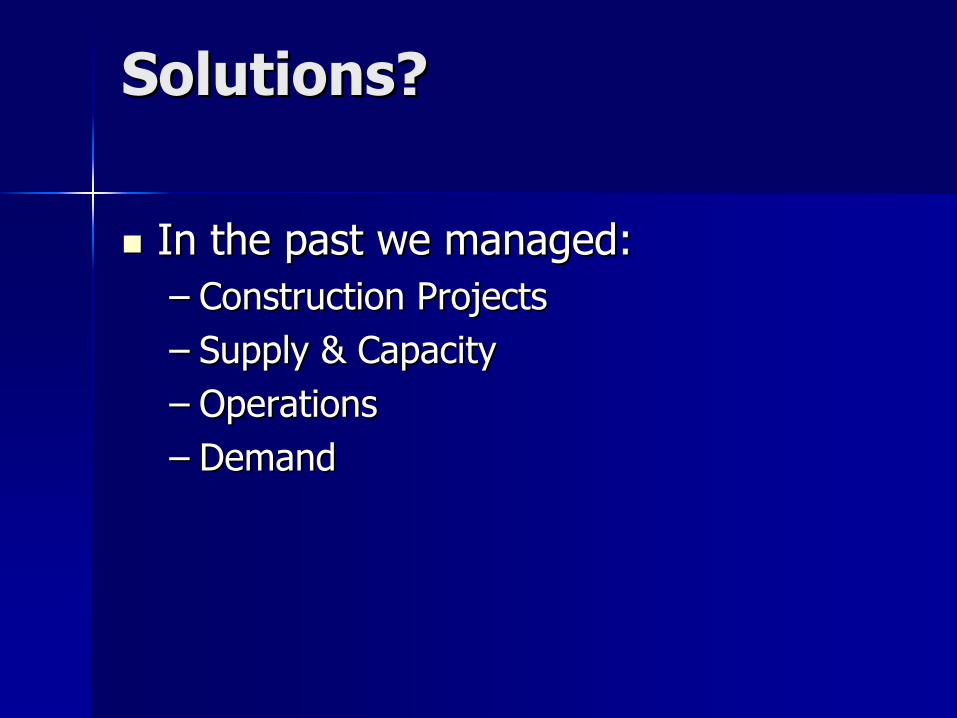
Solutions? Solutions?
In the past we managed:In the past we managed:–– Construction ProjectsConstruction Projects–– Supply & CapacitySupply & Capacity–– OperationsOperations–– DemandDemand

Solutions? Need for Solutions? Need for Expanded ManagementExpanded Management
In the past we managed:In the past we managed:–– Construction ProjectsConstruction Projects–– Supply & CapacitySupply & Capacity–– OperationsOperations–– DemandDemandShould we add?Should we add?–– Pricing?Pricing?–– Expectations?Expectations?Consensus and Effort = SuccessConsensus and Effort = Success

SummarySummary
Congestion is growingCongestion is growingSolutions are multimodal policies, programs Solutions are multimodal policies, programs and projectsand projectsMore aggressive operation and deploymentMore aggressive operation and deploymentAchievable goalsAchievable goals–– Stop the growth of congestionStop the growth of congestion–– Improve reliabilityImprove reliability–– Provide more travel optionsProvide more travel options
“…what I found in practice was that the tool that made the most difference in my community was transportation. Nothing else had as great an impact on our economic development, on the pattern of growth, or on the quality of life."
-Norman Y. Mineta, former Mayor San Jose, CACurrent Secretary of Transportation