measuring emotions in students learning and performance the achievement emotions questionnaire (aeq)...
TRANSCRIPT
Contemporary Educational Psychology 36 (2011) 36–48
Contents lists available at ScienceDirect
Contemporary Educational Psychology
journal homepage: www.elsevier .com/locate /cedpsych
Measuring emotions in students’ learning and performance: The AchievementEmotions Questionnaire (AEQ)
Reinhard Pekrun a,⇑, Thomas Goetz b,c, Anne C. Frenzel d, Petra Barchfeld a, Raymond P. Perry e
a Department of Psychology, University of Munich, Munich, Germanyb Department of Education, University of Konstanz, Konstanz, Germanyc Department of Education, Thurgau University of Teacher Education, Thurgau, Switzerlandd Department of Psychology, University of Augsburg, Augsburg, Germanye Department of Psychology, University of Manitoba, Winnipeg, Manitoba, Canada
a r t i c l e i n f o
Article history:Available online 30 October 2010
Keywords:Achievement emotionPrideAngerBoredomTest anxietySelf-regulated learningControl-value theory
0361-476X/$ - see front matter � 2010 Elsevier Inc. Adoi:10.1016/j.cedpsych.2010.10.002
⇑ Corresponding author. Address: Department oMunich, Leopoldstrasse 13, 80802 Munich, Germany.
E-mail address: [email protected] (R. Pekrun).
a b s t r a c t
Aside from test anxiety scales, measurement instruments assessing students’ achievement emotions arelargely lacking. This article reports on the construction, reliability, internal validity, and external validityof the Achievement Emotions Questionnaire (AEQ) which is designed to assess various achievement emo-tions experienced by students in academic settings. The instrument contains 24 scales measuring enjoy-ment, hope, pride, relief, anger, anxiety, shame, hopelessness, and boredom during class, while studying,and when taking tests and exams. Scale construction used a rational–empirical strategy based on Pek-run’s (2006) control-value theory of achievement emotions and prior exploratory research. The instru-ment was tested in a study using a sample of university students (N = 389). Findings indicate that thescales are reliable, internally valid as demonstrated by confirmatory factor analysis, and externally validin terms of relationships with students’ control-value appraisals, learning, and academic performance.The results provide further support for the control-value theory and help to elucidate the structureand role of emotions in educational settings. Directions for future research and implications for educa-tional practice are discussed.
� 2010 Elsevier Inc. All rights reserved.
1. Introduction
Academic settings abound with achievement emotions such asenjoyment of learning, hope, pride, anger, anxiety, shame, hope-lessness, or boredom. These emotions are critically important forstudents’ motivation, learning, performance, identity development,and health (Schutz & Pekrun, 2007). Accordingly, theoretically-grounded measurement instruments are needed to analyze theirfunctions and origins, and to assess these emotions in educationalpractice. To date, there is a lack of such instruments, with the sin-gle exception of test anxiety questionnaires. In response to thisdeficit, we developed a self-report instrument measuring variousachievement emotions that students commonly experience in aca-demic settings (Achievement Emotions Questionnaire, AEQ). Previ-ous publications referring to this instrument have reported datausing preliminary versions or selected scales only (Acee et al.,2010; Daniels et al., 2009; Mouratidis, Vansteenkiste, Lens, &Auweele, 2009; Pekrun, Elliot, & Maier, 2006, 2009; Pekrun, Goetz,Daniels, Stupnisky, & Perry, 2010; Pekrun, Goetz, Perry, Kramer, &
ll rights reserved.
f Psychology, University of
Hochstadt, 2004). The present research involves the first compre-hensive investigation of the AEQ, including all scales of the instru-ment within one analysis. This investigation makes it possible toexamine the psychometric quality of the instrument, to analyzethe overall structure and role of achievement emotions as experi-enced by students in academic settings, and to further test hypoth-eses of the control-value theory of achievement emotions (Pekrun,2006; Pekrun, Frenzel, Goetz, & Perry, 2007).
Construction of the AEQ was informed by the models for assess-ing achievement emotions that are provided by the measurementof test anxiety. Specifically, whereas early instruments such asthe Test Anxiety Questionnaiore (TAQ; Mandler & Sarason, 1952)deemed test anxiety to be a unidimensional construct, conceptionsdeveloped since then make it possible to differentiate various com-ponents of the construct, with affective, cognitive, and physiologi-cal components being central to contemporary measures (Zeidner,2007). The advances in the measurement of test anxiety enabledresearchers to successfully uncover the structures, functions, andorigins of this emotion (for overviews, see Hembree, 1988; Zeidner,1998, 2007).
In line with current test anxiety measurement and conceptionsof emotion more generally, the AEQ is based on a multi-componentdefinition of achievement emotion. In contrast to test anxiety

Emotion
A1 A2 A3 P1 P2 P3C1 C2 C3 M1 M2 M3
MotivationalCognitive PhysiologicalAffective
A1 A2 A3 P1 P2 P3C1 C2 C3 M1 M2 M3
Motivational
Emotion
Cognitive PhysiologicalAffective
A1 A2 A3 P1 P2 P3C1 C2 C3 M1 M2 M3
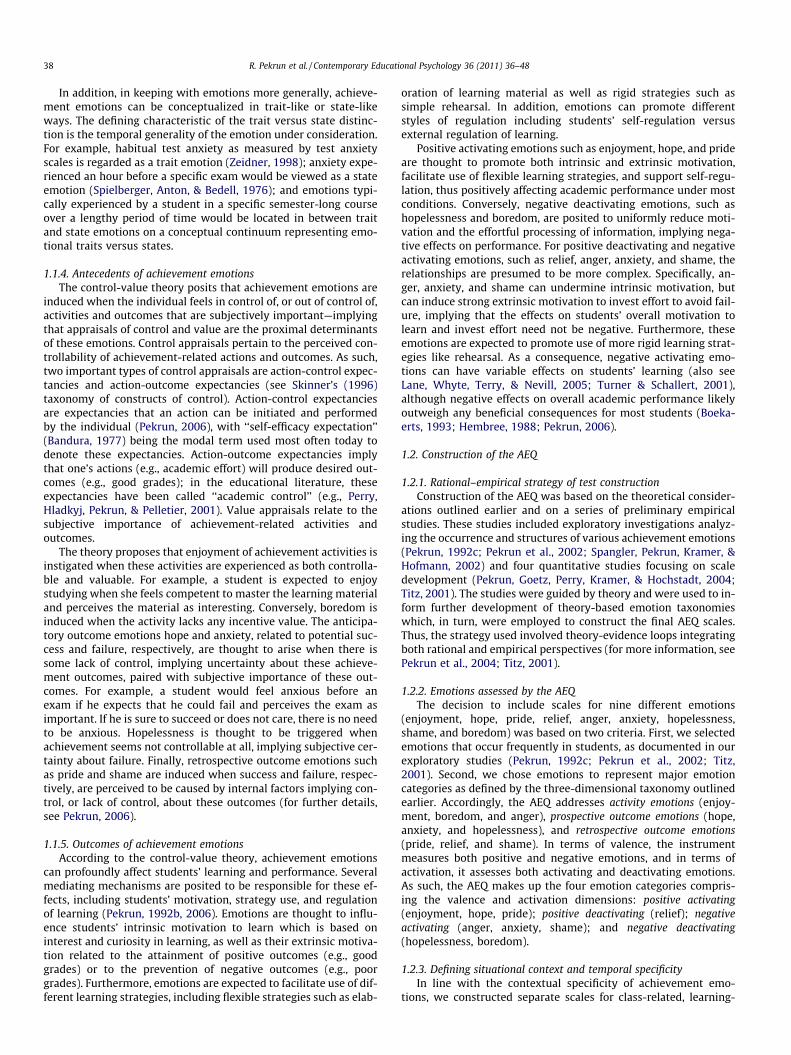
Fig. 1. Models for component structures of achievement emotions. Upper part:Model 1A (one-factor model). Middle part: Model 1B (four component factorsmodel). Lower part: Model 1C (hierarchical model). A1–A3, C1–C3, M1–M3, P1–P3denote affective, cognitive, motivational, and physiological items, respectively.
R. Pekrun et al. / Contemporary Educational Psychology 36 (2011) 36–48 37
measures, however, the AEQ assesses a broader range of majorachievement emotions. The 24 scales of the instrument tap intonine different emotions occurring in three different academicachievement settings. In the following sections, we first outlinethe theoretical conception underlying the AEQ and its validation.Next, we describe the construction of the instrument. We thenreport an empirical analysis targeting item and scale statistics,reliability, internal validity, and external validity of the instrument.
1.1. Conceptual framework: the control-value theory of achievementemotions
As a framework for defining emotions, constructing scales, andvalidating the instrument, the control-value theory of achievementemotions was used (Pekrun, 2006; Pekrun et al., 2007). The con-trol-value theory provides an integrative approach for analyzingvarious emotions experienced in achievement contexts, includingacademic settings as well as achievement situations in other lifedomains (e.g., sports, professional activities). The theory buildson assumptions from expectancy-value theories of emotions (Pek-run, 1992a; Turner & Schallert, 2001), transactional approaches(Lazarus & Folkman, 1984), attributional theories (Weiner, 1985),and models of the performance effects of emotions (Fredrickson,2001; Pekrun, 1992b; Pekrun, Goetz, Titz, & Perry, 2002; Zeidner,1998, 2007). It expands these views by integrating propositionsfrom different theories and by focusing on both outcome-relatedand activity-related achievement emotions.
1.1.1. Definition and component structures of emotionIn line with contemporary component process models of emo-
tions (Scherer, 2009), the control-value theory views emotions assets of interrelated psychological processes, whereby affective,cognitive, motivational, and physiological components are of pri-mary importance. For example, anxiety can comprise uneasy andtense feelings (affective), worries (cognitive), impulses to escapefrom the situation (motivational), and peripheral activation (phys-iological). This view is consistent with leading-edge conceptions oftest anxiety, but extends these conceptions in an important way.Although most current test anxiety instruments assess affective,physiological, and cognitive components of anxiety, they neglectthe motivational component. Items pertaining to this componentwere originally part of Mandler and Sarason’s (1952) TAQ, but latermotivational components were omitted. These components are in-cluded in the current conception.
From a measurement perspective, the multi-component concep-tion of emotions adopted in the control-value theory implies thatemotions are best modeled as hierarchically organized structures,with the components comprising an emotion being first-orderfactors and the emotion itself being represented by a second-orderfactor. For example, test anxiety would be conceived as being repre-sented by one second-order factor for the emotion test anxiety, andfour primary factors for the affective, cognitive, motivational, andphysiological components of test anxiety that are nested withinthe second-order factor (Fig. 1; see Hodapp & Benson (1997) for asimilar approach). Empirically, such hierarchical factor modelsshould prove superior to single-factor models postulating just onefactor representing the emotion.
1.1.2. Definition of achievement emotionAchievement emotions are defined as emotions that are directly
linked to achievement activities or achievement outcomes. In pastresearch, studies on achievement emotions focused on emotionsrelated to achievement outcomes, including both prospective out-come emotions, such as hope and anxiety linked to possible successand failure, respectively, and retrospective outcome emotions likepride and shame linked to prior success and failure, respectively
(Weiner, 1985; Zeidner, 1998). The definition proposed by the con-trol-value theory implies that activity emotions pertaining to cur-rent achievement-related activities are also considered asachievement emotions. Examples are students’ enjoyment oflearning, boredom experienced during classroom instruction, oranger at the task demands of academic learning (Pekrun, 2006;Pekrun et al., 2010).
In Pekrun’s (2006; Pekrun et al., 2002) three-dimensional tax-onomy of achievement emotions, the differentiation of activityversus outcome emotions pertains to the object focus of theseemotions. In addition, as with emotions more generally, achieve-ment emotions can be grouped according to their valence and tothe degree of activation implied. In terms of valence, positiveemotions can be distinguished from negative emotions, such aspleasant enjoyment versus unpleasant anxiety. In terms of activa-tion, physiologically activating emotions can be differentiatedfrom deactivating emotions, such as activating hope versus deac-tivating hopelessness. By using the dimensions valence and acti-vation, the taxonomy is consistent with circumplex models ofaffect that arrange affective states in a two-dimensional(valence � activation) space (Feldman Barrett & Russell, 1998;Linnenbrink, 2007).
1.1.3. Situational context and temporal specificityAchievement emotions occur in different academic settings,
such as attending class, studying, and taking tests and exams.These settings differ in relation to their functions and social struc-tures. By implication, emotions can vary across these settings aswell. For example, enjoyment of classroom instruction may be dif-ferent from enjoying the challenge of an exam—some students maybe excited when going to class, others when writing exams. There-fore, measures of achievement emotions should distinguish be-tween emotions experienced in these different settings.
38 R. Pekrun et al. / Contemporary Educational Psychology 36 (2011) 36–48
In addition, in keeping with emotions more generally, achieve-ment emotions can be conceptualized in trait-like or state-likeways. The defining characteristic of the trait versus state distinc-tion is the temporal generality of the emotion under consideration.For example, habitual test anxiety as measured by test anxietyscales is regarded as a trait emotion (Zeidner, 1998); anxiety expe-rienced an hour before a specific exam would be viewed as a stateemotion (Spielberger, Anton, & Bedell, 1976); and emotions typi-cally experienced by a student in a specific semester-long courseover a lengthy period of time would be located in between traitand state emotions on a conceptual continuum representing emo-tional traits versus states.
1.1.4. Antecedents of achievement emotionsThe control-value theory posits that achievement emotions are
induced when the individual feels in control of, or out of control of,activities and outcomes that are subjectively important—implyingthat appraisals of control and value are the proximal determinantsof these emotions. Control appraisals pertain to the perceived con-trollability of achievement-related actions and outcomes. As such,two important types of control appraisals are action-control expec-tancies and action-outcome expectancies (see Skinner’s (1996)taxonomy of constructs of control). Action-control expectanciesare expectancies that an action can be initiated and performedby the individual (Pekrun, 2006), with ‘‘self-efficacy expectation’’(Bandura, 1977) being the modal term used most often today todenote these expectancies. Action-outcome expectancies implythat one’s actions (e.g., academic effort) will produce desired out-comes (e.g., good grades); in the educational literature, theseexpectancies have been called ‘‘academic control’’ (e.g., Perry,Hladkyj, Pekrun, & Pelletier, 2001). Value appraisals relate to thesubjective importance of achievement-related activities andoutcomes.
The theory proposes that enjoyment of achievement activities isinstigated when these activities are experienced as both controlla-ble and valuable. For example, a student is expected to enjoystudying when she feels competent to master the learning materialand perceives the material as interesting. Conversely, boredom isinduced when the activity lacks any incentive value. The anticipa-tory outcome emotions hope and anxiety, related to potential suc-cess and failure, respectively, are thought to arise when there issome lack of control, implying uncertainty about these achieve-ment outcomes, paired with subjective importance of these out-comes. For example, a student would feel anxious before anexam if he expects that he could fail and perceives the exam asimportant. If he is sure to succeed or does not care, there is no needto be anxious. Hopelessness is thought to be triggered whenachievement seems not controllable at all, implying subjective cer-tainty about failure. Finally, retrospective outcome emotions suchas pride and shame are induced when success and failure, respec-tively, are perceived to be caused by internal factors implying con-trol, or lack of control, about these outcomes (for further details,see Pekrun, 2006).
1.1.5. Outcomes of achievement emotionsAccording to the control-value theory, achievement emotions
can profoundly affect students’ learning and performance. Severalmediating mechanisms are posited to be responsible for these ef-fects, including students’ motivation, strategy use, and regulationof learning (Pekrun, 1992b, 2006). Emotions are thought to influ-ence students’ intrinsic motivation to learn which is based oninterest and curiosity in learning, as well as their extrinsic motiva-tion related to the attainment of positive outcomes (e.g., goodgrades) or to the prevention of negative outcomes (e.g., poorgrades). Furthermore, emotions are expected to facilitate use of dif-ferent learning strategies, including flexible strategies such as elab-
oration of learning material as well as rigid strategies such assimple rehearsal. In addition, emotions can promote differentstyles of regulation including students’ self-regulation versusexternal regulation of learning.
Positive activating emotions such as enjoyment, hope, and prideare thought to promote both intrinsic and extrinsic motivation,facilitate use of flexible learning strategies, and support self-regu-lation, thus positively affecting academic performance under mostconditions. Conversely, negative deactivating emotions, such ashopelessness and boredom, are posited to uniformly reduce moti-vation and the effortful processing of information, implying nega-tive effects on performance. For positive deactivating and negativeactivating emotions, such as relief, anger, anxiety, and shame, therelationships are presumed to be more complex. Specifically, an-ger, anxiety, and shame can undermine intrinsic motivation, butcan induce strong extrinsic motivation to invest effort to avoid fail-ure, implying that the effects on students’ overall motivation tolearn and invest effort need not be negative. Furthermore, theseemotions are expected to promote use of more rigid learning strat-egies like rehearsal. As a consequence, negative activating emo-tions can have variable effects on students’ learning (also seeLane, Whyte, Terry, & Nevill, 2005; Turner & Schallert, 2001),although negative effects on overall academic performance likelyoutweigh any beneficial consequences for most students (Boeka-erts, 1993; Hembree, 1988; Pekrun, 2006).
1.2. Construction of the AEQ
1.2.1. Rational–empirical strategy of test constructionConstruction of the AEQ was based on the theoretical consider-
ations outlined earlier and on a series of preliminary empiricalstudies. These studies included exploratory investigations analyz-ing the occurrence and structures of various achievement emotions(Pekrun, 1992c; Pekrun et al., 2002; Spangler, Pekrun, Kramer, &Hofmann, 2002) and four quantitative studies focusing on scaledevelopment (Pekrun, Goetz, Perry, Kramer, & Hochstadt, 2004;Titz, 2001). The studies were guided by theory and were used to in-form further development of theory-based emotion taxonomieswhich, in turn, were employed to construct the final AEQ scales.Thus, the strategy used involved theory-evidence loops integratingboth rational and empirical perspectives (for more information, seePekrun et al., 2004; Titz, 2001).
1.2.2. Emotions assessed by the AEQThe decision to include scales for nine different emotions
(enjoyment, hope, pride, relief, anger, anxiety, hopelessness,shame, and boredom) was based on two criteria. First, we selectedemotions that occur frequently in students, as documented in ourexploratory studies (Pekrun, 1992c; Pekrun et al., 2002; Titz,2001). Second, we chose emotions to represent major emotioncategories as defined by the three-dimensional taxonomy outlinedearlier. Accordingly, the AEQ addresses activity emotions (enjoy-ment, boredom, and anger), prospective outcome emotions (hope,anxiety, and hopelessness), and retrospective outcome emotions(pride, relief, and shame). In terms of valence, the instrumentmeasures both positive and negative emotions, and in terms ofactivation, it assesses both activating and deactivating emotions.As such, the AEQ makes up the four emotion categories compris-ing the valence and activation dimensions: positive activating(enjoyment, hope, pride); positive deactivating (relief); negativeactivating (anger, anxiety, shame); and negative deactivating(hopelessness, boredom).
1.2.3. Defining situational context and temporal specificityIn line with the contextual specificity of achievement emo-
tions, we constructed separate scales for class-related, learning-

R. Pekrun et al. / Contemporary Educational Psychology 36 (2011) 36–48 39
related, and test-related emotions. Regarding temporal specific-ity, the original version of the AEQ is intended to measure stu-dents’ habitual, trait-like achievement emotions. However, theinstrument can be used to assess all three types of emotionsmentioned earlier (trait, course-specific, state) by adapting theinstructions accordingly (see Pekrun, Goetz, Frenzel, & Perry,2011).
1.2.4. Item and scale developmentInitial item development for the AEQ was based on student re-
ports obtained from our exploratory studies (Pekrun, 1992c; Titz,2001). Concerning test-related anxiety, scale construction also in-cluded items adapted from Sarason’s (1984) Reactions-to-TestsQuestionnaire and Hodapp and Benson’s (1997) integrative testanxiety questionnaire. Conceptual considerations and the explor-atory data were used to construct taxonomies for components ofachievement emotions, and items assessing these componentswere formulated. The components considered in these taxonomies,and in the scales, pertain to affective, cognitive, motivational, andphysiological facets for each of the emotions measured. An effortwas made to construct items that ensure discriminant validity ofscales measuring different emotions, including neighboring emo-tions (i.e., like-valenced emotions having similar antecedents andcomponents; Kuppens, van Mechelen, Smits, & de Boeck, 2004)that are difficult to separate empirically, such as anxiety andhopelessness.
The initial item pool consisted of more than 1500 items (Titz,2001). From this pool, items were selected for preliminary ver-sions of the scales by using expert judgment and criteria ofsemantic redundancy. Selection of items for the final scales wasbased on item and scale statistics for the preliminary versions(Pekrun et al., 2004; Titz, 2001). Again, in selecting items, wemade an effort to attend to both convergent and divergent scalevalidity. Items were selected according to convergent item valid-ity (i.e., high factor loadings on the relevant scale) as well asdivergent item validity (i.e., low factor loadings on other emotionscales). The original German AEQ scales were translated into theEnglish language by a team of three experts, two of them bilin-gual. A backtranslation procedure was used to ensure content-re-lated item equivalence.
The final instrument consists of 24 scales that are organizedin three sections assessing class-related, learning-related, andtest-related emotions (see Appendix for sample items and Pek-run et al. (2011), for the complete instrument). Each of thesescales contains items measuring the affective, cognitive, motiva-tional, and physiological components of the respective emotion.A 5-point Likert scale (1 = completely disagree, 5 = completelyagree) is used to record item responses. The class-related emo-tion scales include 80 items and instruct students to reporthow they feel with regard to class-related enjoyment, pride, an-ger, anxiety, shame, hopelessness, and boredom. The learning-re-lated emotion scales include 75 items and instruct students toreport how they feel with regard to studying in terms of thesame eight emotions. Finally, the test emotion scales include77 items and instruct students to indicate how they feel with re-gard to test-related enjoyment, hope, pride, relief, anger, anxiety,shame, and hopelessness. Within each section, the items are or-dered in three blocks assessing emotional experiences before,during, and after an encounter with the specified academic con-text. These blocks focus on activity emotions (during), prospec-tive outcome emotions (before), and retrospective outcomeemotions (after) related to the setting addressed. Sequencingitems this way is in line with principles of situation-reactioninventories and is intended to help respondents access theiremotional memories (Endler & Okada, 1975).
1.3. Prior research using the AEQ
Selected scales of the AEQ have successfully been used to assessrelationships between achievement emotions and students’ learn-ing and academic performance. Scales of the AEQ served to exam-ine the linkages between students’ achievement goals and theirclass-related and learning-related emotions (Daniels et al., 2009;Mouratidis et al., 2009; Pekrun, Elliot, & Maier, 2006, 2009). In linewith the control-value approach to goals and emotions proposedby Pekrun et al. (2006, 2009), mastery goals predicted activityemotions, and performance-approach goals and performance-avoidance goals predicted positive and negative outcome emo-tions, respectively. Furthermore, these emotions were documentedas mediators of the effects of achievement goals on students’ aca-demic performance (Daniels et al., 2009; Pekrun et al., 2009). In re-search on test emotions (Pekrun et al., 2004), the test-relatedemotion scales were also found to relate to students’ learningand performance, with enjoyment, hope, and pride showing posi-tive relations with most indicators of learning, and anger, anxiety,shame, and hopelessness showing negative relations. In addition,students’ boredom has been analyzed using the learning-relatedboredom scale of the AEQ (Acee et al., 2010; Pekrun et al., 2010).The findings suggest that boredom relates negatively to students’academic control, motivation to learn, use of flexible learning strat-egies, self-regulation of learning, and academic performance. Final-ly, a domain-specific variant of the instrument measuring students’emotions in mathematics (Achievement Emotions Questionnaire-Mathematics, AEQ-M) was employed to analyze differences in stu-dents’ mathematics emotions across genders, classrooms, and cul-tures (e.g., Frenzel, Pekrun, & Goetz, 2007; Frenzel, Thrash, Pekrun,& Goetz, 2007).
The findings of these studies suggest that the AEQ scales can beused to analyze various achievement emotions. However, sincenone of studies included more than a subset of scales, they didnot provide a systematic account of the psychometric quality ofthe instrument and of the full range of emotions addressed bythe AEQ. Therefore, we lack knowledge about the overall reliabilityand validity of the instrument. In particular, there is a research def-icit regarding the internal component structures and interrelationsof diverse achievement emotions as assessed by the AEQ, andabout the relationships of the full set of emotions with importantantecedents and outcomes such as students’ control-value apprais-als, learning, and academic performance.
1.4. Aims of the present study
Because a comprehensive analysis of the AEQ is lacking to date,the present research sought to analyze item and scale statistics,reliability, internal test validity, and external test validity for thecomplete instrument (see Slaney and Maraun (2008) for the dis-tinction of internal versus external test validity). In doing so, weaimed to analyze the internal structures and external linkages ofthe various achievement emotions measured by the AEQ. Regard-ing external linkages, the study examined the relationships be-tween achievement emotions and their presumed antecedentsand outcomes, as addressed by Pekrun’s (2006) control-value the-ory of achievement emotions. We used a dataset involving a NorthAmerican student sample previously employed by Pekrun et al.(2004) to analyze select aspects of the AEQ test emotions scales,but made use of the entire dataset in analyzing all 24 scales ofthe instrument. The original version of the AEQ measuring stu-dents’ habitual achievement emotions experienced across aca-demic achievement situations was used, implying that theseemotions were measured as domain-general, trait-like variables.By assessing habitual, trait-like achievement emotions, the presentresearch analyzed emotions at the same level of generality as test

ig. 2. SEM models for relationships between emotions. Upper left part: Model 2A (one emotion-factor model). Upper right part: Model 2B (eight emotion-factors mo Lower left part: Model 2C (three setting-factors model).ower right part. Model 2C (emotion x setting-factors model). C, L, and T denote class-related, learning-related, and test-related emotions, respectively. Jo = enjoyme o = hope, Pr = pride, Re = relief, An = anger, Ax = anxiety,l = hopelessness, Bo = boredom.
40R
.Pekrunet
al./Contemporary
EducationalPsychology
36(2011)
36–48
FLH
del).nt, H

R. Pekrun et al. / Contemporary Educational Psychology 36 (2011) 36–48 41
anxiety scales (Zeidner, 1998). Specifically, we focused on the fol-lowing issues: (1) item and scale statistics, including reliabilities;(2) gender differences; (3) internal test validity of the scales withregard to the internal component structures of emotions; (4) inter-nal test validity in terms of the relationships between emotions;and (5) external test validity in terms of relationships with stu-dents’ appraisals, learning, and performance.
With regard to gender, we sought to document the validity ofthe instrument in terms of replicating the gender differences instudents’ test anxiety that have consistently been found in prior re-search (Hembree, 1988; Zeidner, 1998). With regard to the internalcomponent structures of scales, we used confirmatory factor anal-ysis (CFA) to examine if these structures are best captured by hier-archical component factor models as described earlier, andcompared these models to one-factor models as well as componentfactor models involving independent components (Fig. 1).
Concerning the relations between emotions, correlational anal-ysis and CFA were used to document the distinctness of the emo-tion constructs assessed by the AEQ. We expected that a CFAmodel representing the two-facet structure of the instrument(i.e., nine different emotions nested within three different achieve-ment settings) would best fit the data, as compared with alterna-tive models. The alternative models included a one-factor modelrepresenting positive versus negative emotions as one bipolar fac-tor, as well as two models differentiating between emotions only,or between different settings only (Fig. 2).
With respect to relations with learning and achievement, weexamined the linkages of emotions with all of the primary anteced-ents and outcome variables addressed by the control-value theoryas described earlier, including control-value appraisals (self-effi-cacy, academic control, academic value), intrinsic and extrinsicmotivation, overall academic effort, use of flexible and rigid learn-ing strategies (elaboration and rehearsal), self- and external regu-lation of learning, and academic performance.
2. Method
2.1. Participants and procedure
The sample consisted of 389 students (234 female; age:M = 20.63 years; SD = 3.48) in several undergraduate psychologycourses at a large, Midwestern Canadian university who partici-pated in return for extra course credit. Students were enrolled instudy programs at different faculties including the faculties of arts(42.7%), management (15.4%), science (12.6%), and nursing (8.1%).The distribution of students across genders and faculties is typicalfor students participating in undergraduate psychology courses atCanadian universities (Perry, Stupnisky, Hall, Chipperfield, & Wei-ner, 2010). Participants completed the measures in one session.
2.2. Measures
2.2.1. Achievement emotionsTo assess students’ achievement emotions, the complete AEQ as
described earlier was used (see Appendix for sample items). Stu-dents were instructed to report how they felt, typically, whenattending class, studying, or taking test and exams in their univer-sity courses.
2.2.2. Perceived control and valueA 10-item version of Perry’s (Perry et al., 2001) Perceived Aca-
demic Control Scale and the Self-Efficacy for Learning and Perfor-mance Scale of the Motivated Strategies for LearningQuestionnaire (MSLQ; Pintrich, Smith, Garcia, & McKeachie,1991) were used to measure achievement-related subjective con-
trol. The items of the Perceived Academic Control Scale relate toinfluencing academic performance (e.g., ‘‘I have a great deal of con-trol over my academic performance in my courses’’; ‘‘The more ef-fort I put in my courses, the better I do in them’’). The Self-Efficacyfor Learning and Performance Scale consists of five items assessingstudents’ confidence about being able to master academic tasksand get good grades (e.g., ‘‘I’m confident I can do an excellent jobon the assignments and tests in courses at university’’). Partici-pants responded by using 1 (strongly disagree) to 5 (strongly agree)scales, and the scores were summed to form the two control in-dexes (a = .83 and .82 for academic control and self-efficacy,respectively). Perceived academic value was assessed with a shortfour-item version of the Task Value Scale of the MSLQ (Pintrichet al., 1991; e.g., ‘‘Understanding the subject matter of courses atuniversity is very important to me’’; ‘‘I am very interested in thecontent areas of courses at university’’; 1 = strongly disagree,5 = strongly agree; a = .69).
2.2.3. MotivationThe Intrinsic Goal Orientation, Extrinsic Goal Orientation, and
Effort Regulation scales of the MSLQ (Pintrich et al., 1991) were in-cluded in the study. The Intrinsic Goal Orientation and ExtrinsicGoal Orientation scales are measures of intrinsic motivation basedon interest and curiosity and of extrinsic motivation related to get-ting good grades, respectively, with each scale comprised of fouritems (e.g., ‘‘In classes at university, I prefer course material thatarouses my curiosity, even if it is difficult to learn’’; ‘‘Getting goodgrades in classes at university is the most satisfying thing for meright now’’). The Effort Regulation scale is a measure of students’overall effort and motivation to learn (four items; e.g., ‘‘I work hardto do well in my classes even if I don’t like what we are doing’’).Participants responded by using 1 (strongly disagree) to 5 (stronglyagree) scales, and the scores were summed to form the intrinsicmotivation, extrinsic motivation, and effort indexes (as = .51, .68,and .61 for intrinsic motivation, extrinsic motivation, and effort,respectively).
2.2.4. Learning strategiesAs indicators of flexible versus rigid learning strategies, stu-
dents’ use of elaboration and rehearsal strategies was assessed.Both strategies were measured with the respective scales of theMSLQ (Pintrich et al., 1991). The elaboration and rehearsal scalesconsisted of six and four items, respectively (e.g., ‘‘When readingfor my classes, I try to relate the material to what I already know’’;‘‘When studying for my classes, I practice saying the material tomyself over and over’’). Participants responded by using 1 (stronglydisagree) to 5 (strongly agree) scales, and the scores were summedto form the elaboration and rehearsal indexes (as = .73 and .59 forelaboration and rehearsal, respectively).
2.2.5. Self-regulation versus external regulation of learningA four-item version of Goetz’ (2004) Perceived Self-regulation of
Learning Scale was used to measure students’ self-regulation oflearning goals, use of strategies, and monitoring of learning out-comes (e.g., ‘‘When studying, I set my own goals that I want to at-tain’’; ‘‘When studying difficult material, I decide for myself whichstrategy to use’’; ‘‘I am able to evaluate for myself how I make pro-gress at learning’’). A four-item version of Goetz’ (2004) PerceivedExternal Regulation of Learning Scale was used to measure exter-nal regulation (e.g., ‘‘The way I study largely depends on the pro-fessor’s recommendations’’; ‘‘When studying, I entirely rely onthe readings I am given’’). Participants responded by using 1(strongly disagree) to 5 (strongly agree) scales, and the scores weresummed to form the self-regulation and external regulation in-dexes (as = .72 and .57, respectively).

42 R. Pekrun et al. / Contemporary Educational Psychology 36 (2011) 36–48
2.2.6. Academic performanceStudents’ performance was measured by assessing their grade
point average attained over the academic year prior to the study.
3. Results and discussion
3.1. Item and scale statistics
Table 1 shows response distributions, item-total correlations,and reliabilities of the AEQ scales. The findings indicate that therewas sufficient variation of scores on all scales. Most of the distribu-tions were relatively symmetrical, the exception being the hope-lessness scales which were positively skewed. Given the extremenature and relatively rare occurrence of this emotion in achieve-ment settings (Pekrun, 1992c; Titz, 2001), such skewness seemsadequate and should not be reduced by normalizing distributions.Furthermore, the findings show that scale items had excellent part-whole corrected item-total correlations for all scales, with none ofthe correlations falling short of the .30 threshold. In line with itemcharacteristics, reliabilities were above a = .75 for all scales andabove a = 0.85 for 15 of the 24 scales. In sum, these findings indi-cate that the AEQ scales show sufficient variation, and that reliabil-ities range from good to excellent.
3.2. Gender differences
In analyzing the scale statistics separately by gender, we foundthat means were significantly different for five emotions. As com-pared with male students, female students reported more class-re-lated enjoyment (Ms = 32.76 and 30.95, SDs = 6.49 and 6.35, forfemale and male students, respectively; t[387] = 2.68, p < .01) andless class-related anger (Ms = 16.67 and 18.34, SDs = 6.00 and6.39; t[387] = �2.58, p < .05). Furthermore, female students re-ported more learning-related anxiety (Ms = 31.57 and 29.28,SDs = 7.90 and 7.48; t[387] = 2.82, p < .01), more test anxiety
Table 1Item and scale statistics.
No. of items Possible range Observed range
Class-related emotionsEnjoyment 10 10–50 15–49Hope 8 8–40 13–40Pride 9 9–45 11–45Anger 9 9–45 9–42Anxiety 12 12–60 12–56Shame 11 11–55 11–52Hopelessness 10 10–50 10–42Boredom 11 11–55 11–54
Learning-related emotionsEnjoyment 10 10–50 14–49Hope 6 6–30 10–30Pride 6 6–30 9–30Anger 9 9–45 9–42Anxiety 11 11–55 11–47Shame 11 11–55 11–51Hopelessness 11 11–55 11–48Boredom 11 11–55 11–50
Test EmotionsEnjoyment 10 10–50 10–46Hope 8 8–40 13–39Pride 10 10–50 14–48Relief 6 6–30 6–30Anger 10 10–50 10–43Anxiety 12 12–60 14–60Shame 10 10–50 10–44Hopelessness 11 11–55 11–47
a Median of part-whole corrected item-total correlations.
(Ms = 37.60 and 34.08, SDs = 10.09 and 9.53; t[387] = 3.39,p < .01), and less test-related hope (Ms = 25.50 and 26.59,SDs = 4.74 and 5.15; t[387] = �2.12, p < .05). There were no signif-icant mean differences for any of the other emotions.
In interpreting these gender differences, it should be noted thatthe effect sizes of the differences were relatively small (all ds < .40),and that none of the differences generalized across settings, withthe single exception of anxiety which differed significantly for set-tings of both learning and taking tests. The differences in self-re-ported anxiety are consistent with a vast literature showing that,on an average, female students report higher achievement anxietythan male students (Hembree, 1988; Zeidner, 1998). Given theconsistency of this finding reported in the literature, the presentfindings attest to the convergent validity of the AEQ anxiety scalesin terms of replicating these differences.
3.3. Internal validity: component structures of emotions
As noted, the AEQ scales were designed to represent the affec-tive, cognitive, motivational, and physiological components ofemotion within each scale. Following our earlier reasoning, weadopted the approach proposed by Hodapp and Benson (1997) toexamine the validity of the scales in terms of their presumed inter-nal structures. Three different structural models were competi-tively tested for each scale (Fig. 1). Model 1A was a generalfactor model assuming one latent emotion factor, with all scaleitems being manifest indicators of this factor. Model 1B was a fourcomponent factors model consisting of four separate latent factorsrepresenting the four emotion components, with the scale itemsbeing indicators for these factors. Model 1C was constructed as ahierarchical model that integrated the perspectives of the firsttwo models by consisting of four latent primary component factorsand one latent secondary emotion factor.
Given our component structuring of achievement emotions, weexpected the component factors and hierarchical models to show
M SD Skewness Mean ri(t�i)a Alpha
31.99 6.47 �.10 .55 .8527.39 4.67 �.20 .51 .7931.20 5.50 �.30 .52 .8217.39 6.24 .75 .58 .8627.68 8.30 .28 .55 .8625.22 8.80 .38 .63 .8917.56 6.68 1.04 .67 .9030.84 9.88 .06 .74 .93
33.09 5.78 �.24 .44 .7820.27 3.70 �.11 .52 .7721.59 4.00 �.38 .45 .7522.00 7.04 .18 .56 .8630.69 7.76 �.24 .53 .8427.00 8.32 .29 .57 .8623.06 8.09 .58 .62 .9030.69 9.29 �.09 .70 .92
28.33 6.00 .01 .45 .7825.91 4.93 .09 .52 .8031.32 6.48 �.16 .58 .8621.51 4.26 �.39 .52 .7723.36 7.28 .26 .57 .8636.19 9.97 �.01 .62 .9021.92 7.52 .43 .60 .8722.12 8.42 .65 .69 .92

Table 2Emotion component structures of AEQ scales: confirmatory factor analysis.
Class-related emotions Learning-related emotions Test emotions
Emotion Model v2 df GFI CFI RMSEA v2 df GFI CFI RMSEA v2 df GFI CFI RMSEA
Enjoyment 1 117 32 .94 .97 .083 164 33 .92 .91 .102 119 34 .94 .89 .0812 80 27 .96 .98 .072 83 27 .96 .96 .073 64 28 .97 .95 .0583 89 29 .96 .98 .073 85 29 .96 .96 .071 71 30 .96 .94 .060
Hope 1 43 20 .97 .98 .045 46 9 .96 .95 .103 75 20 .95 .94 .0852 32 17 .98 .99 .048 18 6 .98 .98 .073 43 17 .97 .97 .0633 32 17 .98 .99 .048 18 6 .98 .98 .073 43 17 .97 .97 .063
Pride 1 61 27 .97 .98 .057 93 8 .93 .88 .166 113 32 .94 .94 .0822 45 23 .97 .99 .049 5 4 1.00 1.00 .022 64 26 .97 .97 .0623 60 25 .97 .98 .061 18 6 .98 .98 .074 86 28 .96 .96 .074
Relief 1 39 13 .97 .96 .0722 26 12 .98 .98 .0563 26 12 .98 .98 .056
Anger 1 128 27 .93 .97 .099 196 27 .90 .94 .127 97 33 .95 .95 .0712 43 21 .98 .99 .053 57 18 .97 .99 .075 45 27 .98 .98 .0423 46 23 .97 .99 .052 72 20 .96 .98 .082 52 29 .97 .98 .046
Anxiety 1 475 51 .83 .91 .147 172 44 .93 .95 .087 228 53 .91 .92 .0932 138 45 .94 .97 .073 133 38 .94 .96 .080 95 47 .96 .98 .0523 144 47 .94 .97 .073 134 40 .94 .96 .078 110 49 .95 .97 .057
Shame 1 363 38 .94 .98 .080 123 44 .95 .97 .068 107 33 .95 .95 .0762 301 32 .95 .98 .079 98 39 .96 .98 .063 100 27 .95 .95 .0843 304 34 .95 .98 .078 105 41 .95 .98 .064 104 29 .95 .95 .082
Hopelessness 1 97 34 .95 .98 .069 92 44 .96 .99 .053 92 44 .96 .98 .0542 80 28 .95 .98 .069 56 38 .97 1.00 .035 82 38 .96 .98 .0553 89 30 .96 .99 .071 56 40 .97 1.00 .033 83 40 .96 .98 .053
Boredom 1 141 44 .94 .99 .075 238 44 .90 .97 .1072 114 38 .95 .99 .072 127 37 .94 .98 .0803 127 40 .94 .99 .075 130 39 .94 .98 .078
R. Pekrun et al. / Contemporary Educational Psychology 36 (2011) 36–48 43
superior fit, as compared with the one-factor models. We expectedthe fit of the hierarchical models to be similar to the fit of the com-ponent factors models, indicating that combining the four factorsunder the umbrella of one second-order emotion factor is sup-ported empirically. Although the hierarchical models representedour theoretical conception, we did not expect them to show betterfit than the component factors models, since they involved estima-tion of one more latent factor.
Structural equation modeling (LISREL 8.80; Jöreskog & Sörbom,2006) was used to test the fit of the three models for each of the 24scales (Table 2). Following Hoyle and Panter’s (1995) recommen-dations, we used both absolute and incremental fit indexes to eval-uate the models, including the v2/df ratio, the goodness-of-fitindex (GFI), the comparative fit Index (CFI), and the root meansquare error of approximation (RMSEA). CFIs above .95 and RMSEAsbelow .05 are thought to indicate good fit, RMSEAs between .05 and.08 reasonable fit, and RMSEAs between .08 and .10 mediocre fit.We adopted Cheung and Rensvold’s (2002) cut-off criteria for eval-uating differences of fit between models, with a loss of fit ofDCFI > .01 being regarded as substantial.
Using these criteria, model fit of the component factors andhierarchical models was at least reasonable for all of the scalesand good for the vast majority of the scales (Table 2). In contrast,the one-factor models showed a poor fit for 10 of the scales interms of CFI being below .95, and for 14 scales in terms of RMSEAbeing above .08. Furthermore, a direct comparison shows thatthe fit for the component factors and hierarchical models wasclearly superior for most of the scales, as compared with the fitfor the one-factor models.
These findings indicate that scale construction was successful interms of internal, structural validity. As such, the findings showthat test anxiety is not the only emotion for which internal compo-nent structures should be taken into account. For most of the
scales, the component factors and hierarchical models which dif-ferentiated between emotion components fit better than one-fac-tor models, thus corroborating our propositions on the internalstructures of achievement emotions.
3.4. Internal validity: relationships between emotions
3.4.1. Correlational analysisOur theoretical conception posits that it is useful to distin-
guish (a) between the different discrete emotions that occurwithin a given achievement setting (class-related, learning-re-lated, test-related), and (b) between the emotions experiencedin different achievement settings. Pearson product-moment cor-relations were computed to test these propositions. As may beseen from Table 3, the positive emotions enjoyment, hope, andpride correlated positively in all three settings. Similarly, therewere positive correlations between the negative emotions anger,anxiety, shame, hopelessness, and boredom. The correlations be-tween these positive emotions, on the one hand, and negativeemotions, on the other hand, were moderately negative. However,diverging from the pattern of positive relationships between like-valenced emotions, test-related relief correlated positively withtest-related pride and anxiety, thus showing connections to onepositive and one negative emotion. The relationship with anxietyis likely due to relief occurring when anxiety-inducing threat isreduced, suggesting that relief is often preceded by anxiety, andthat students who habitually experience relief during or after testsituations also habitually experience anxiety in these samesituations.
Overall, these findings show that the emotion constructs mea-sured by the AEQ are clearly separable. This also is true for emo-tions that might be presumed to constitute opposite ends of abipolar continuum, such as enjoyment and boredom, or hope and
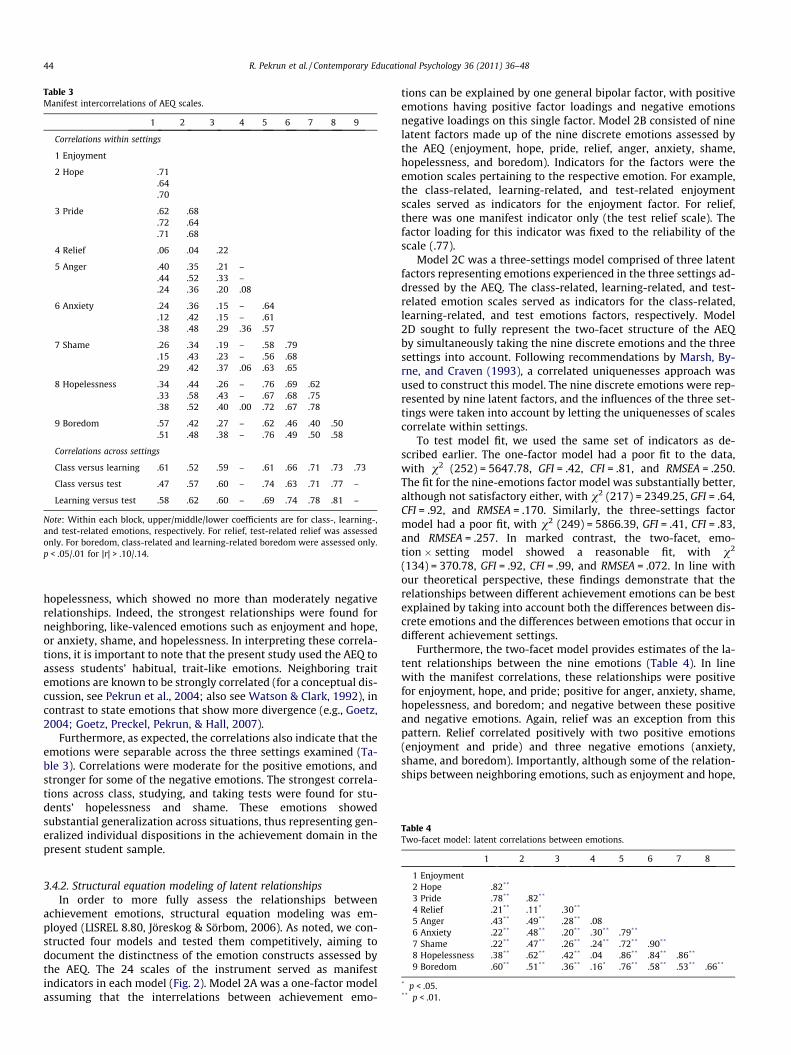
Table 3Manifest intercorrelations of AEQ scales.
1 2 3 4 5 6 7 8 9
Correlations within settings
1 Enjoyment
2 Hope .71.64.70
3 Pride .62 .68.72 .64.71 .68
4 Relief .06 �.04 .22
5 Anger �.40 �.35 �.21 –�.44 �.52 �.33 –�.24 �.36 �.20 .08
6 Anxiety �.24 �.36 �.15 – .64�.12 �.42 �.15 – .61�.38 �.48 �.29 .36 .57
7 Shame �.26 �.34 �.19 – .58 .79�.15 �.43 �.23 – .56 .68�.29 �.42 �.37 .06 .63 .65
8 Hopelessness �.34 �.44 �.26 – .76 .69 .62�.33 �.58 �.43 – .67 .68 .75�.38 �.52 �.40 .00 .72 .67 .78
9 Boredom �.57 �.42 �.27 – .62 .46 .40 .50�.51 �.48 �.38 – .76 .49 .50 .58
Correlations across settings
Class versus learning .61 .52 .59 – .61 .66 .71 .73 .73
Class versus test .47 .57 .60 – .74 .63 .71 .77 –
Learning versus test .58 .62 .60 – .69 .74 .78 .81 –
Note: Within each block, upper/middle/lower coefficients are for class-, learning-,and test-related emotions, respectively. For relief, test-related relief was assessedonly. For boredom, class-related and learning-related boredom were assessed only.p < .05/.01 for |r| > .10/.14.
Table 4Two-facet model: latent correlations between emotions.
44 R. Pekrun et al. / Contemporary Educational Psychology 36 (2011) 36–48
hopelessness, which showed no more than moderately negativerelationships. Indeed, the strongest relationships were found forneighboring, like-valenced emotions such as enjoyment and hope,or anxiety, shame, and hopelessness. In interpreting these correla-tions, it is important to note that the present study used the AEQ toassess students’ habitual, trait-like emotions. Neighboring traitemotions are known to be strongly correlated (for a conceptual dis-cussion, see Pekrun et al., 2004; also see Watson & Clark, 1992), incontrast to state emotions that show more divergence (e.g., Goetz,2004; Goetz, Preckel, Pekrun, & Hall, 2007).
Furthermore, as expected, the correlations also indicate that theemotions were separable across the three settings examined (Ta-ble 3). Correlations were moderate for the positive emotions, andstronger for some of the negative emotions. The strongest correla-tions across class, studying, and taking tests were found for stu-dents’ hopelessness and shame. These emotions showedsubstantial generalization across situations, thus representing gen-eralized individual dispositions in the achievement domain in thepresent student sample.
1 2 3 4 5 6 7 8
1 Enjoyment2 Hope .82**
3 Pride .78** .82**
4 Relief .21** .11* .30**
5 Anger �.43** �.49** �.28** .086 Anxiety �.22** �.48** �.20** .30** .79**
7 Shame �.22** �.47** �.26** .24** .72** .90**
8 Hopelessness �.38** �.62** �.42** .04 .86** .84** .86**
9 Boredom �.60** �.51** �.36** .16* .76** .58** .53** .66**
* p < .05.** p < .01.
3.4.2. Structural equation modeling of latent relationshipsIn order to more fully assess the relationships between
achievement emotions, structural equation modeling was em-ployed (LISREL 8.80, Jöreskog & Sörbom, 2006). As noted, we con-structed four models and tested them competitively, aiming todocument the distinctness of the emotion constructs assessed bythe AEQ. The 24 scales of the instrument served as manifestindicators in each model (Fig. 2). Model 2A was a one-factor modelassuming that the interrelations between achievement emo-
tions can be explained by one general bipolar factor, with positiveemotions having positive factor loadings and negative emotionsnegative loadings on this single factor. Model 2B consisted of ninelatent factors made up of the nine discrete emotions assessed bythe AEQ (enjoyment, hope, pride, relief, anger, anxiety, shame,hopelessness, and boredom). Indicators for the factors were theemotion scales pertaining to the respective emotion. For example,the class-related, learning-related, and test-related enjoymentscales served as indicators for the enjoyment factor. For relief,there was one manifest indicator only (the test relief scale). Thefactor loading for this indicator was fixed to the reliability of thescale (.77).
Model 2C was a three-settings model comprised of three latentfactors representing emotions experienced in the three settings ad-dressed by the AEQ. The class-related, learning-related, and test-related emotion scales served as indicators for the class-related,learning-related, and test emotions factors, respectively. Model2D sought to fully represent the two-facet structure of the AEQby simultaneously taking the nine discrete emotions and the threesettings into account. Following recommendations by Marsh, By-rne, and Craven (1993), a correlated uniquenesses approach wasused to construct this model. The nine discrete emotions were rep-resented by nine latent factors, and the influences of the three set-tings were taken into account by letting the uniquenesses of scalescorrelate within settings.
To test model fit, we used the same set of indicators as de-scribed earlier. The one-factor model had a poor fit to the data,with v2 (252) = 5647.78, GFI = .42, CFI = .81, and RMSEA = .250.The fit for the nine-emotions factor model was substantially better,although not satisfactory either, with v2 (217) = 2349.25, GFI = .64,CFI = .92, and RMSEA = .170. Similarly, the three-settings factormodel had a poor fit, with v2 (249) = 5866.39, GFI = .41, CFI = .83,and RMSEA = .257. In marked contrast, the two-facet, emo-tion � setting model showed a reasonable fit, with v2
(134) = 370.78, GFI = .92, CFI = .99, and RMSEA = .072. In line withour theoretical perspective, these findings demonstrate that therelationships between different achievement emotions can be bestexplained by taking into account both the differences between dis-crete emotions and the differences between emotions that occur indifferent achievement settings.
Furthermore, the two-facet model provides estimates of the la-tent relationships between the nine emotions (Table 4). In linewith the manifest correlations, these relationships were positivefor enjoyment, hope, and pride; positive for anger, anxiety, shame,hopelessness, and boredom; and negative between these positiveand negative emotions. Again, relief was an exception from thispattern. Relief correlated positively with two positive emotions(enjoyment and pride) and three negative emotions (anxiety,shame, and boredom). Importantly, although some of the relation-ships between neighboring emotions, such as enjoyment and hope,

Table 5Correlations of achievement emotions with appraisals, learning, and performance.
Appraisals Motivation Strategies Performance
EmotionAcademiccontrol
Self-efficacy
Taskvalue Intrinsic Extrinsic Effort Elaboration Rehearsal
Self-regulation
Externalregulation
GPA atUniversity
Enjoyment .32 .37 .55 .45 .14 .29 .40 .21 .26 �.07 .15.32 .44 .51 .49 .22 .37 .42 .19 .34 �.01 .22.20 .50 .35 .37 .12 .37 .38 .23 .38 �.02 .26
Hope .40 .53 .47 .41 .16 .38 .44 .25 .45 �.03 .19.43 .56 .41 .43 .07 .47 .40 .09 .51 �.14 .33.35 .60 .37 .40 .04 .44 .40 .18 .51 �.05 .25
Pride .37 .51 .44 .35 .34 .36 .42 .32 .43 .12 .15.44 .49 .44 .40 .26 .42 .42 .28 .46 .03 .29.33 .56 .32 .34 .17 .42 .44 .31 .49 .06 .34
Relief .17 .07 .15 .05 .25 .04 .21 .20 .14 .23 .14
Anger �.60 �.35 �.44 �.22 �.05 �.38 �.30 �.11 �.25 .28 �.27�.41 �.39 �.33 �.27 .02 �.43 �.29 �.02 �.31 .29 �.25�.54 �.40 �.32 �.20 .08 �.37 �.29 �.03 �.30 .34 �.32
Anxiety �.47 �.39 �.18 �.10 .16 �.33 �.18 .02 �.29 .32 �.18�.30 �.35 �.08 �.11 .20 �.30 �.13 .08 �.30 .35 �.14�.30 �.38 �.13 �.16 .27 �.28 �.11 .12 �.28 .33 �.14
Shame �.48 �.34 �.21 �.10 .14 �.31 �.18 .02 �.26 .23 �.18�.41 �.35 �.15 �.08 .17 �.41 �.19 .03 �.35 .30 �.27�.47 �.43 �.19 �.08 .18 �.38 �.25 �.01 �.37 .23 �.37
Hopelessness �.67 �.45 �.40 �.26 �.02 �.41 �.39 �.11 �.34 .23 �.31�.62 �.51 �.29 �.26 .11 �.45 �.36 �.03 �.46 .33 �.32�.60 �.51 �.33 �.23 .09 �.45 �.35 �.04 �.41 .25 �.34
Boredom �.29 �.27 �.38 �.23 .00 �.42 �.19 �.04 �.16 .25 �.15�.32 �.34 �.38 �.26 �.02 �.48 �.26 �.05 �.28 .24 �.24
Note: Within each block, upper/middle/lower coefficients are for class-, learning-, and test-related emotions, respectively. For relief, test-related relief was assessed only. Forboredom, class-related and learning-related boredom were assessed only.p < .05/.01 for |r| > .10/.14.
R. Pekrun et al. / Contemporary Educational Psychology 36 (2011) 36–48 45
were high, they clearly indicate that all of the emotion constructsare separable, given that the latent coefficients were correctedfor unreliability and represent the hightest possible estimates forthese relationships.
3.5. External validity: linkages with students’ appraisals, learning, andperformance
3.5.1. Relationships with control and value appraisalsTable 5 shows the correlations of students’ control-value
appraisals and the AEQ achievement emotions. As predicted byPekrun’s (2006) control-value theory described earlier, there wereclear linkages between appraisals and emotions. Academic control,self-efficacy, and task value correlated generally positively withthe positive emotions and negatively with the negative emotions.Regarding value, it should be noted that this variable was opera-tionalized as positive task value in the present study. The con-trol-value theory proposes that the negative value of failurecontributes to students’ negative outcome emotions such as anxi-ety, shame, and hopelessness, but this proposition was not testedin the present study.
3.5.2. Relationships with learning and performanceAs expected, there also were clear linkages between the emo-
tions and variables of learning and performance, with differentpatterns of relations for different groups of emotions (Table 5).Specifically, the positive activating emotions enjoyment, hopeand pride related positively to intrinsic motivation, effort, elabo-ration of learning material, and self-regulation of learning. Incontrast, most of the correlations with external regulation werezero for these emotions. In line with the positive relationshipswith variables of learning, the correlations with students’ GPA
were positive as well. Relationships with GPA were strongerfor learning-related and test-related positive activating emotions,as compared with the class-related emotions within thiscategory.
The negative deactivating emotions hopelessness and boredomshowed the opposite pattern of linkages in terms of uniformly neg-ative correlations with intrinsic motivation, effort, elaboration,self-regulation, and academic performance. Furthermore, theseemotions correlated positively with students’ perceived externalregulation of learning. Overall, the pattern of relationships corrob-orates that positive activating emotions are likely beneficial forstudents’ engagement and learning, whereas negative deactivatingemotions are likely detrimental, as posited by the control-valuetheory.
As expected, relationships were more complex for the negativeactivating emotions anger, anxiety, and shame. On the one hand,all three emotions correlated negatively with intrinsic motivation,elaboration, and self-regulation. On the other hand, anxiety andshame correlated positively with students’ extrinsic motivationtargeting achievement outcomes, and test anxiety correlated posi-tively with rehearsal of learning material. These findings are in linewith the control-value theory’s proposition that negative activat-ing emotions can exert variable effects on students’ learning. De-spite these variable effects, however, anger, anxiety, and shamerelated negatively to students’ overall self-reported effort at learn-ing and to their academic performance.
These findings demonstrate the external validity of the AEQscales and show that students’ emotions have substantial linkageswith their engagement and performance. Many of these relation-ships proved to be rather strong, with correlations in the .30–.50range. Interestingly, these relationships were relatively weak fortest anxiety, as compared with other achievement emotions. For

46 R. Pekrun et al. / Contemporary Educational Psychology 36 (2011) 36–48
example, whereas the correlation between the AEQ test hopeless-ness scale and students’ GPA was r = �.34, the correlation for testanxiety was r = �.14 in the present research—a low correlationwhich is quite typical for the range of correlations produced by testanxiety studies (Hembree, 1988). The findings of the present studythus reinforce the premise that research on students’ affect is welladvised to move on from test anxiety to include a broader range ofemotions experienced in academic settings.
4. Conclusions
From a measurement perspective, the findings of the presentresearch corroborate the reliability and validity of the AEQ. Fromthe perspective of substantive research, they underscore theimportance of distinguishing between discrete achievement emo-tions and show that these emotions relate meaningfully to stu-dents’ learning and performance. Specifically, the findingsindicate that the item statistics and reliabilities of the AEQ scalesare good to excellent, and that the scales are well-suited to de-scribe the internal structures of achievement emotions in termsof their affective, cognitive, motivational, and physiological com-ponents. Furthermore, the results of structural equation modelingconfirmed that students’ emotional experiences, and the AEQscales assessing these experiences, can be organized by distin-guishing between various discrete emotions, and between differ-ent academic settings in which these emotions are experienced.Generally, these results suggest that measures of students’achievement emotions should consider the component structuresof these emotions, the differences between discrete emotions, andthe differences between emotional experiences across differentacademic settings.
Finally, the findings show that students’ achievement emotionsare linked to their control and value appraisals, motivation, use oflearning strategies, self-regulation of learning, and academic per-formance. In so doing, they corroborate the external validity ofthe scales as well as propositions of Pekrun’s (2006) control-valuetheory. Whereas the positive activating emotions enjoyment, hope,and pride related positively to most of the variables measured,these relationships were negative for the deactivating emotionshopelessness and boredom. As expected, the pattern of linkageswas more complex for the activating negative emotions anger, anx-iety, and shame; however, the relationships with students’ overallself-reported effort, and with their academic performance, werenegative as well.
Although these findings substantiate the psychometric qualityof the AEQ and our study hypotheses, there also are clear limita-tions in the present research. First, the sample consisted of NorthAmerican undergraduate students only. While studies with Ger-man and Chinese student samples using variants of the AEQ haveproduced similar findings and attest to the cross-cultural useabilityof the instrument (Frenzel, Thrash, et al., 2007; Pekrun et al., 2010;Titz, 2001), it is open to question whether the findings generalizecross-culturally to other populations as well. Similarly, while firstattempts to use variants of the instrument with younger studentsproved successful (Frenzel, Pekrun, et al., 2007; Frenzel, Thrash,et al., 2007; Lichtenfeld, Pekrun, Stupnisky, Reiss, & Murayama,2010), more research is needed testing the psychometric qualityof the instrument with K-12 students and older adult populations.To make appropriate use of the scales with these populations, cog-nitive validation of the content validity of items would be useful(Karabenick et al., 2007).
Second, the present research used the original version of theAEQ that assesses students’ achievement emotions as domain-general, trait-like constructs, similar to the construct of testanxiety. Recent research has shown that students’ emotions are
partially organized in domain-specific ways (Goetz, Frenzel, Pek-run, Hall, & Lüdtke, 2007). Research using domain-specific vari-ants of the AEQ, such as the Achievement EmotionsQuestionnaire-Mathematics (AEQ-M), corroborates the psycho-metric quality of these variants. However, instruments such asthe AEQ-M do not assess the full range of emotions and settingsaddressed by the original AEQ. Using the full instrument forassessing domain-specific achievement emotions, and analyzingthe generalizability of the current study findings to domain-spe-cific emotions, remains a task for future research. Similarly, fu-ture research should more fully examine the utility of the AEQfor measuring state achievement emotions. Similar to trait mea-sures of emotions more generally, some of the intercorrelationsbetween emotions were relatively high in the present research.As noted, it is to be expected that these correlations are lowerfor state emotions (Goetz, 2004; Goetz et al., 2007), which wouldfurther underscore the need to distinguish between discreteachievement emotions.
Furthermore, the findings regarding external validity are lim-ited by the correlational nature of the study design which doesnot allow to interpret linkages between emotions, appraisals,and learning in causal ways. There are a few studies that in-cluded selected scales of the AEQ and used predictive designs.These studies suggest that the AEQ scales have predictive powerin explaining students’ achievement outcomes, and that theemotions assessed by the AEQ scales are explained by students’goals and appraisals (Daniels et al., 2009; Pekrun et al., 2009,2010). However, more research is clearly needed to disentanglethe causal relationships of achievement emotions with theirantecedents and outcomes. Beyond unidirectional, predictive de-signs, such research should also attend to the reciprocal natureof these linkages. For example, appraisals can induce achieve-ment emotions, but these emotions can reciprocally influencestudents’ appraisals and adoption of achievement goals (Danielset al., 2009; Linnenbrink & Pintrich, 2002). Similarly, achieve-ment emotions can impact students’ success at learning, but suc-cess and failure can reciprocally shape students’ emotions(Pekrun, 2006).
Finally, the present findings have a number of importantimplications for educational practice. First, they suggest thatthe AEQ can be used to assess students’ achievement emotions.To date, the instrument has mainly been employed for researchpurposes, but it also may be well-suited to serve practical pur-poses for assessment in counseling and evaluation. Given theoverall length of the instrument, this may require further re-search to tailor the scales to the specific purposes within givendiagnostic settings. Also, research would be needed to norm thescales for practical application. Second, although caution shouldbe given to not interpreting the findings in causal ways, theyare clearly in line with the assumption that a number of differentemotions are of critical importance to students’ engagement andlearning. By implication, educators are well advised to heed stu-dents’ emotions—including the well-researched emotion test anx-iety, but also including a broad variety of emotions beyondanxiety.
Acknowledgments
This research was supported by a TransCoop grant entitled‘‘Academic Risk Factors in College Students’’ from the GermanAmerican Academic Council to Reinhard Pekrun and Raymond P.Perry, and by a grant from the German Research Foundation (Deut-sche Forschungsgemeinschaft, DFG) entitled ‘‘Lern- und Prüfung-semotionen’’ [Learning-related and test-related emotions] toReinhard Pekrun.

R. Pekrun et al. / Contemporary Educational Psychology 36 (2011) 36–48 47
Appendix A
Achievement Emotions Questionnaire (AEQ): scales and sampleitems.
Class-related emotions
1 Enjoyment I enjoy being in class (d) 2 Hope I am confident when I go to class (b) 3 Pride I am proud of myself (a) 4 Anger I am angry (a) 5 Anxiety T hinking about class makes me feel uneasy (b) 6 Shame I get embarrassed (d) 7 Hopelessness I feel hopeless (b) 8 Boredom I get bored (d)Learning-related emotions
1 Enjoyment I enjoy acquiring new knowledge (d) 2 Hope I have an optimistic view toward studying (b) 3 Pride I ’m proud of my capacity (d) 4 Anger S tudying makes me irritated (d) 5 Anxiety I get tense and nervous while studying (d) 6 Shame I feel ashamed that I can’t absorb the simplestof details (d)
7 Hopelessness I feel hopeless when I think about studying (b) 8 Boredom T he material bores me to death (d)Test emotions
1 Enjoyment F or me the test is a challenge that is enjoyable (d) 2 Hope I have great hope that my abilities will be suffi-cient (b)
3 Pride I ’m proud of how well I mastered the exam (a) 4 Relief I feel very relieved (a) 5 Anger I am fairly annoyed (a) 6 Anxiety I feel panicky when writing an exam (d) 7 Shame I feel ashamed (a) 8 Hopelessness I have lost all hope that I have the ability to dowell on the exam (d)
Note: b/d/a = before/during/after the situation of attending class,studying, or taking tests and exams, respectively.
References
Acee, T. W., Kim, H., Kim, H. J., Kim, J., Hsiang-Ning, R. C., Kim, M., et al. (2010).Academic boredom in under- and overchallenging situations. ContemporaryEducational Psychology, 35, 17–27.
Bandura, A. (1977). Self-efficacy: Toward a unifying theory of behavioral change.Psychological Review, 84, 191–215.
Boekaerts, M. (1993). Anger in relation to school learning. Learning and Instruction,3, 269–280.
Daniels, L. M., Stupnisky, R. H., Pekrun, R., Haynes, T. L., Perry, R. P., & Newall, N. E.(2009). A longitudinal analysis of achievement goals: From affectiveantecedents to emotional effects and achievement outcomes. Journal ofEducational Psychology, 101, 948–963.
Endler, N., & Okada, M. (1975). A multidimensional measure of trait anxiety: The S-R Inventory of General Trait Anxiousness. Journal of Consulting and ClinicalPsychology, 43, 319–329.
Feldman Barrett, L., & Russell, J. A. (1998). Independence and bipolarity in thestructure of current affect. Journal of Personality and Social Psychology, 74,967–984.
Fredrickson, B. L. (2001). The role of positive emotions in positive psychology: Thebroaden-and-build theory of positive emotions. American Psychologist, 56,218–226.
Frenzel, A. C., Pekrun, R., & Goetz, T. (2007). Girls and mathematics – a ‘‘hopeless’’issue? A control-value approach to gender differences in emotions towardsmathematics. European Journal of Psychology of Education, 22, 497–514.
Frenzel, A. C., Thrash, T. M., Pekrun, R., & Goetz, T. (2007). Achievement emotions inGermany and China: A cross-cultural validation of the Academic EmotionsQuestionnaire-Mathematics (AEQ-M). Journal of Cross-Cultural Psychology, 38,302–309.
Goetz, T. (2004). Emotionales Erleben und selbsreguliertes Lernen bei Schülern im FachMathematik [Students’ emotions and self-regulated learning in mathematics].München, Germany: Utz.
Goetz, T., Frenzel, A. C., Pekrun, R., Hall, N. C., & Lüdtke, O. (2007). Between- andwithin-domain relations of students’ academic emotions. Journal of EducationalPsychology, 99, 715–733.
Goetz, T., Preckel, F., Pekrun, R., & Hall, N. C. (2007). Emotional experiences duringtest taking: Does cognitive ability make a difference? Learning and IndividualDifferences, 17, 3–16.
Hembree, R. (1988). Correlates, causes, effects, and treatment of test anxiety. Reviewof Educational Research, 58, 47–77.
Hodapp, V., & Benson, J. (1997). The multidimensionality of test anxiety: A test ofdifferent models. Anxiety, Stress and Coping, 10, 219–244.
Hoyle, R., & Panter, A. (1995). Writing about structural equation models. In R. Hoyle(Ed.), Structural equation modeling: Concepts, issues, and applications(pp. 100–119). Thousand Oaks, CA: Sage.
Jöreskog, K. G., & Sörbom, D. (2006). LISREL 8.80 for Windows [Computer Software].Lincolnwood, IL: Scientific Software International, Inc..
Karabenick, S. A., Woolley, M. E., Friedel, J. M., Ammon, B. V., Blazevski, J., ReeBonney, C., et al. (2007). Cognitive processing of self-report items in educationalresearch: Do they think what we mean? Educational Psychologist, 42, 139–151.
Kuppens, P., van Mechelen, I., Smits, D. J. M., & de Boeck, P. (2004). Associationbetween emotions: Correspondence across different types of data andcomponential basis. European Journal of Personality, 18, 159–176.
Lane, A. M., Whyte, G. P., Terry, P. C., & Nevill, A. M. (2005). Mood, self-set goals andexamination performance: The moderating effect of depressed mood.Personality and Individual Differences, 39, 143–153.
Lazarus, R. S., & Folkman, S. (1984). Stress, appraisal, and coping. New York: Springer.Lichtenfeld, S., Pekrun, R., Stupnisky, R. H., Reiss, K., & Murayama, K. (2010).
Measuring students’ emotions in the early years: The Achievement EmotionsQuestionnaire-Elementary School (AEQ-E), submitted for publication.
Linnenbrink, E. A. (2007). The role of affect in student learning: A multi-dimensionalapproach to considering the interaction of affect, motivation, and engagement.In P. A. Schutz & R. Pekrun (Eds.), Emotion in education (pp. 107–124). San Diego,CA: Academic Press.
Linnenbrink, E. A., & Pintrich, P. R. (2002). Achievement goal theory and affect: Anasymmetrical bidirectional model. Educational Psychologist, 37, 69–78.
Mandler, G., & Sarason, S. B. (1952). A study of anxiety and learning. Journal ofAbnormal and Social Psychology, 47, 166–173.
Marsh, H. W., Byrne, B. W., & Craven, R. (1993). Overcoming problems inconfirmatory factor analyses of MTMM data: The correlated uniquenessmodel and factorial invariance. Multivariate Behavioral Research, 27, 489–507.
Mouratidis, A., Vansteenkiste, M., Lens, W., & Auweele, Y. V. (2009). Beyond positiveand negative affect: Achievement goals and discrete emotions in theelementary physical education classroom. Psychology of Sport and Exercise, 10,336–343.
Pekrun, R. (1992a). Expectancy-value theory of anxiety: Overview and implications.In D. G. Forgays, T. Sosnowski, & K. Wrzesniewski (Eds.), Anxiety: Recentdevelopments in self-appraisal, psychophysiological and health research(pp. 23–41). Washington, DC: Hemisphere.
Pekrun, R. (1992b). The impact of emotions on learning and achievement: Towardsa theory of cognitive/motivational mediators. Applied Psychology, 41, 359–376.
Pekrun, R. (1992c). Kognition und Emotion in studienbezogenen Lern- undLeistungssituationen: Explorative Analysen [Cognition and emotion inacademic situations of learning and achievement: An exploratory analysis].Unterrichtswissenschaft, 20, 308–324.
Pekrun, R. (2006). The control-value theory of achievement emotions: Assumptions,corollaries, and implications for educational research and practice. EducationalPsychology Review, 18, 315–341.
Pekrun, R., Elliot, A. J., & Maier, M. A. (2006). Achievement goals and discreteachievement emotions: A theoretical model and prospective test. Journal ofEducational Psychology, 98, 583–597.
Pekrun, R., Elliot, A. J., & Maier, M. A. (2009). Achievement goals and achievementemotions: Testing a model of their joint relations with academic performance.Journal of Educational Psychology, 101, 115–135.
Pekrun, R., Goetz, T., Frenzel, A. C., & Perry, R. P. (2011). Academic EmotionsQuestionnaire (AEQ). User’s manual (2nd ed.). Munich, Germany: Department ofPsychology, University of Munich.
Pekrun, R., Frenzel, A., Goetz, T., & Perry, R. P. (2007). The control-value theory ofachievement emotions: An integrative approach to emotions in education. In P.A. Schutz & R. Pekrun (Eds.), Emotions in education (pp. 13–36). San Diego:Academic Press.
Pekrun, R., Goetz, T., Daniels, L. M., Stupnisky, R. H., & Perry, R. P. (2010). Boredom inachievement settings: Exploring control-value antecedents and performanceoutcomes of a neglected emotion. Journal of Educational Psychology, 102,531–549.
Pekrun, R., Goetz, T., Perry, R. P., Kramer, K., & Hochstadt, M. (2004). Beyond testanxiety: Development and validation of the Test Emotions Questionnaire (TEQ).Anxiety, Stress and Coping, 17, 287–316.
Pekrun, R., Goetz, T., Titz, W., & Perry, R. P. (2002). Academic emotions in students’self-regulated learning and achievement: A program of quantitative andqualitative research. Educational Psychologist, 37, 91–106.
Perry, R. P., Hladkyj, S., Pekrun, R., & Pelletier, S. T. (2001). Academic control andaction control in the achievement of college students: A longitudinal field study.Journal of Educational Psychology, 93, 776–789.

48 R. Pekrun et al. / Contemporary Educational Psychology 36 (2011) 36–48
Perry, R. P., Stupnisky, R. H., Hall, N. C., Chipperfield, J. G., & Weiner, B. (2010). Badstarts and better finishes: Attributional retraining and initial performance incompetitive achievement settings. Journal of Social and Clinical Psychology, 29,668–700.
Pintrich, P. R., Smith, D. A. F., Garcia, T., & McKeachie, W. J. (1991). A manual for theuse of the Motivated Strategies for Learning Questionnaire (MSLQ) (Tech. ReportNo. 91-B-004). Board of Regents, University of Michigan, Ann Arbor, MI.
Sarason, I. G. (1984). Stress, anxiety, and cognitive interference: Reactions to tests.Journal of Personality and Social Psychology, 44, 929–938.
Schutz, P. A., & Pekrun, R. (Eds.). (2007). Emotion in education. San Diego, CA:Academic Press.
Scherer, K. R. (2009). The dynamic architecture of emotion: Evidence for thecomponent process model. Cognition and Emotion, 23, 1307–1351.
Skinner, E. A. (1996). A guide to constructs of control. Journal of Personality andSocial Psychology, 71, 549–570.
Slaney, K. L., & Maraun, M. D. (2008). A proposed framework for conducting data-based test analysis. Psychological Methods, 13, 376–390.
Spangler, G., Pekrun, R., Kramer, K., & Hofmann, H. (2002). Students’ emotions,physiological reactions, and coping in academic exams. Anxiety, Stress andCoping, 15, 383–400.
Spielberger, C. D., Anton, W. D., & Bedell, J. (1976). The nature and treatment of testanxiety. In M. Zuckerman & C. D. Spielberger (Eds.), Emotions and anxiety: Newconcepts, methods, and applications (pp. 317–344). Hillsdale, NJ: Erlbaum.
Titz, W. (2001). Emotionen von Studierenden in Lernsituationen [Students’ emotions insituations of learning]. Münster, Germany: Waxmann.
Turner, J. E., & Schallert, D. L. (2001). Expectancy–value relationships of shamereactions and shame resiliency. Journal of Educational Psychology, 93, 320–329.
Watson, D., & Clark, L. A. (1992). Affects separable and inseparable: On thehierarchical arrangement of the negative affects. Journal of Personality and SocialPsychology, 62, 489–505.
Weiner, B. (1985). An attributional theory of achievement motivation and emotion.Psychological Review, 92, 548–573.
Zeidner, M. (1998). Test anxiety: The state of the art. New York: Plenum.Zeidner, M. (2007). Test anxiety in educational contexts: What I have learned so far.
In P. A. Schutz & R. Pekrun (Eds.), Emotion in education (pp. 165–184). San Diego,CA: Academic Press.