measuring enterprise systems success: the importance...
TRANSCRIPT

MEASURING ENTERPRISE SYSTEMS SUCCESS: THE IMPORTANCE OF A MULTIPLE STAKEHOLDER
PERSPECTIVE
Sedera, Darshana, Queensland University of Technology, George Street, Brisbane, Australia, [email protected]
Gable, Guy, Queensland University of Technology, George Street, Brisbane, Australia, [email protected]
Chan, Taizan, Queensland University of Technology, George Street, Brisbane, Australia, [email protected]
Abstract:
Organisations invest enormous amount of resources in acquiring Enterprise Systems (ES), presumably expecting positive impacts to the organisation and its functions. Despite the optimistic motives, some ES projects have reported nil or detrimental impacts. This paper studies the proposition that the perspective of the stakeholders of an organisation may have contributed to the differences in receiving benefits reported in prior studies in this domain. An Enterprise System, unlike a traditional Information System (IS), entails many stakeholders ranging from top executives to data entry operators. These stakeholders (a.k.a employment cohorts) typically have multiple and often conflicting objectives and priorities and rarely agree on a set of common aims. The importance of gathering perceptions of success at multiple levels in organizations has been discussed among academics for several decades. However, there is no universal agreement on what employment cohorts should be canvassed (i.e. which are the distinctive employment cohorts?). This paper seeks to illustrate the importance of multiple stakeholder perspective in assessing ES success by analysing 456 responses gathered from 27 public sector organizations. The alleged differences in perceptions of organisational performance are empirically measured using a prior validated model, employing four constructs and thirty-seven measures. The paper identifies three key stakeholder groups in the context of ES and highlights the importance of measuring ES success from a multiple stakeholder view point.
Key words: Enterprise System, Enterprise System Success, Performance Measurement, Success Measurement, Multiple Stakeholder, Employment cohort, Survey
1 INTRODUCTION
An Enterprise System (ES1) is an off-the-shelf package that provides an integrated suite of applications which provide transaction processing and management information systems for the common core of business processes. Enterprise Systems (ES) provide comprehensive administrative systems and help to automate and streamline business processes. ES have been widely implemented worldwide, particularly in larger organizations. ES spending is expected to reach USD$78 billion in 2004 (Management and Distribution Report, 2000) and should continue to be one of the largest, fastest-growing approaches in the application software industry for the next decade (Yen, Chou and Chang, 2002). Despite the substantial investments made by organizations around the world, evidence of ES success has been mixed, with some studies showing positive impacts of ES in organizations (e.g. O’ Leary, 2000; White, Clerk and Ascarely, 1997), while others have shown nil or detrimental impacts (e.g. Kalakota and Robinson, 1999; Caldas and Wood, 2000). Researchers have emphasized the importance of systematically measuring ES success to guide Enterprise Systems investments. Markus and Tanis (2000) state, ‘the key questions about Enterprise Systems from the perspective of an adopting organization’s executive leadership are questions about the success’. The impacts resulting from ES are arguably difficult to measure (e.g. Baer, 1999; Davis, 1989; Deloitte Consulting, 2000; Knowles, Fotos, Henry, 2000; Sedera, Rosemann, Gable, 2001; Shang and Seddon, 2000). The importance of assessing the value of ES (and large Information Systems generally), underpins key issues reported by organizational executives around the world (Ball and Harris, 1982; Brancheau and Wetherbe, 1987; Dickson, Leitheiser, Nechis and Wetherbe, 1984).
An Enterprise System, unlike a traditional Information System (IS), entails many ‘users’ ranging from top executives to data entry operators. These stakeholders (employment cohorts) typically have multiple and often conflicting objectives and priorities and rarely agree on a set of common aims (e.g. Cameron and Whetton, 1983; Leider and Elam, 1994; Tallon, Kraemer, Gurbaxani, 2000; Quinn and Rohrbaugh, 1983; Yoon and Guimares, 1995). The importance of gathering perceptions of success at multiple levels in organizations has been discussed among academics for several decades (e.g. Cameron and Whetton, 1983; Leider and Elam, 1994; Tallon et al., 2000; Thong and Yap, 1996; Quinn and Rohrbaugh, 1983; Yoon and Guimares, 1995; Sedera, Gable, Chan, 2003a). However, there is no universal agreement on what employment cohorts should be canvassed (i.e. which are the distinctive employment cohorts?). ES related studies have used various employment cohorts making it difficult to generalize the findings and impossible to make comparisons. Moreover, there is very little empirical evidence on: (1) whether the employment cohorts have different views on ES success, (2) on which ES success dimensions they differ?, (3) The importance of gathering perceptions from multiple cohorts?, (4) the additivity of the employment cohorts to yield a meaningful overall view/score? or (5) whether all ES employment cohorts are sufficiently informed to gauge all aspects of ES success.
This paper seeks to address aforementioned questions by analysing 456 responses gathered in two surveys across 27 public sector organizations. Detailed discussion on the validity of the ES success model and instrument appeared in Gable, Sedera, Chan 2003 and Sedera, Gable, Chan 2003(d). This paper focuses on the validity and relevance of the four respondent perspectives sought in that study. The paper begins with a historical perspective on the relevance of employment cohorts in prior research with insights from studies of management science, information systems and enterprise systems. Next, the research context is discussed, followed by the research methodology. A brief introduction to the survey instrument is then provided, describing the constructs and the measures of ES success. Finally, the data analysis is presented with a conclusion of the summary of findings and a discussion on future research directions.
1 In this paper, the terms ERP, Enterprise Resource Planning and the more contemporary, Enterprise Systems (ES), are used interchangeably. See (Klaus, Rosemann, Gable, 2000) for in depth discussion on ‘What is ERP?’

2 LITERATURE REVIEW
Anthony (1965) provided the foundations for employment cohort classification. He referred to three levels of employment in an organization; (1) Strategic level, (2) Management level and (3) Operational level. The Strategic level focuses on deciding organizational-wide objectives and allocates necessary resources to achieve the objectives. The Strategic level is involved in complex, irregular decision making and focuses on providing policies to govern the entire organization. At the Strategic level, information requirements are ad-hoc in nature and there is reliance on predictive information for long term organizational goals. At the management level, information requirements are focused on assuring that the resources, both human and financial, are used effectively and efficiently to accomplish goals stated at the Strategic level. The characteristics of information required by the management level are different to those required at the Strategic level. The management level deals with rhythmic (but not repetitive) and prescribed procedures. Managers tend to prefer integrated, procedural information that is for a precise task. Furthermore, managers tend to prefer ‘goal congruent’ information systems. At the Operational level, employees are involved in highly structured and specific tasks that are routine and transactional. Tasks carried out at the Operational level are precise and are governed by the organizational rules and procedures. The Operational level tends to deal with real time data focused on individual events with little or no emphasis on key organisational performance indicators.
The three levels of employment introduced by Anthony (1965) tend to be hierarchical on several dimensions: (1) time span of decisions (i.e. long, medium and short term), (2) importance of a single action (i.e. critical, important and common) and (3) the level of judgement (i.e. strong, moderate and modest). Table 1 adopted from Anthony (1965) summarizes the key characteristics of these employment cohorts.
Activity Strategic Management OperationalFocus of Plans Futuristic, One aspect at a
timeWhole organization Single task / transaction
Complexity Many variables Less complex Simple, rule basedDegree of Structure Unstructured, irregular Rhythmic, procedural Structured
Nature of Information Tailor made, more external and predictive
Integrated, internal but holistic
Task specific, real time
Table 1: Examples of Employment Cohorts
Singleton, McLean and Altman (1988) used the employment classification of Anthony (1965) and concluded that contemporary organizations need a ‘shared vision’ across the ranks of employment. They emphasized the importance of gathering information from all employment levels to evaluate a portfolio of Information Systems. Alloway and Quillard (1983) reported that 79% of frequently used management support systems relied heavily on underlying transaction processing systems. It was also identified that a majority of systems (in the 1980s) primarily supported the Operational needs of organizations. Cheney and Dickson (1982) found differences in levels of satisfaction across the employment cohorts. Vlahos and Farrett (1995) studied perceived value, use of information systems and satisfaction levels across employment cohorts. They found that the ‘line employees’ (similar to Operational level of Anthony, 1965) have a higher satisfaction levels compared to the management and Strategic levels. Furthermore, the Vlahos and Farret (1995) study found higher satisfaction levels among Technical support staff.

Cameron and Whetten (1983) identified seven questions that need to be answered when evaluating organizational effectiveness and emphasized the perspective of measurement2. Based on Cameron and Whetton (1983), Seddon, Staples and Patnayakuni (1999) proposed a framework to classify IS success measures and the perspectives of success. The Seddon et al., (1999) framework suggested five (5) perspectives and six (6) classifications of success measures. The perspectives identified are: (1) independent observer, (2) individual, (3) work group, (4) management and (5) country. Seddon, Graeser and Willcocks (2002) combined the classification of Seddon et al. (1999) and proposed a simplified stakeholder perspective for IS evaluations. Seddon et al. (2002) reported that a majority of past studies on success measures conducted were on a ‘single type of application’, gathering data from ‘user’ (similar to the Operational level of Anthony 1965).
In the ES implementation success literature, Bancroft, Seip and Sprengel (1998) identified, (1) effective communication across the employees of the organization, (2) selecting a balanced implementation team, and (3) providing adequate training for employees at all level of the organization as important success factors, emphasizing the importance of full representativeness across the employment cohorts. Wu, Wang, Chang-Chien and Tai (2002) examined satisfaction levels of Enterprise System users in Taiwan. They identified two main classes of stakeholders in ES implementations: an internal project team and an external contractor. Their research was conducted within the internal implementation team focusing on top managers, key users, end users and the MIS staff. Wu et al. (2002) found that in several areas key users and end users have relatively low levels of satisfaction. Singletary, Pawlowski and Watson (2003) analysed qualitative data to illustrate the importance of gathering views on ES success at different levels in organizations. The three ES employment cohorts they established were (1) managers, (2) IT professionals and (3) end users. Shang and Seddon (2000; 2002) introduced one of few existing ES benefits frameworks after completing in-depth case studies of four Australian utility companies. The Shang and Seddon framework classifies potential ES benefits into 21 lower level measures organized around 5 main categories: Operational benefits, managerial benefits, strategic benefits, IT infrastructure benefits and organizational benefits. The strategic benefits in the Shang and Seddon (2000) ERP benefits framework relate to the Strategic level of Anthony’s (1965) classification, while the operational and managerial benefits are related to the Operational and Management levels. The delineation of the IT infrastructure benefits is an important contribution of the Shang and Seddon ERP benefits framework, highlighting the IT benefits that ES generate in an organization. Shang and Seddon (2000; 2002) identify Technical staff as a separate and an important employment cohort in ES evaluation. Furthermore, they suggest that the management level employees are the most appropriate single cohort from which to gather perceptions of ES benefits. To the contrary, Tallon, Kraemer, Gurbaxani (2000) highlighted the importance of capturing intangible benefits of ES, proposing Strategic managers as the most appropriate single employment cohort.
In summary, prior research has identified several stakeholder groups in organizations. This prior work suggests the importance of gathering views across stakeholders when assessing the performance of an Information System. Though there is little agreement on the classification of employment cohorts, the most common stakeholder groups canvassed in Information Systems assessment studies are: (1) Strategic (2) Management (3) End user and (4) Technical staff. On this basis our data analysis commenced with the classification of respondents into four employment cohorts namely: (1) Strategic, (2) Management, (3) Operational and (4) Technical.
2 Questions of Cameron and Whetten (1983) are (1) what is the perspective? (2) What is the domain of activity? (3) What is the level of analysis? (4) What is the purpose of evaluation? (5) What is the time frame employed? (6) What types of data are to be used? (7) Against what referent is effectiveness to be judged?

3 THE RESEARCH CONTEXT
The ES success study was conducted across 27 Queensland Government agencies running live SAP systems. Queensland is the first Australian state to implement common financial management software state-wide namely; The Queensland Government Financial Management System (QGFMS). In 1995 the state Government of Queensland commenced implementation of SAP Financials across all state Government agencies (later followed by Controlling, Materials Management and in some agencies Human Resources) and Queensland Government is one of the largest SAP installations in Australia. The Queensland Government approach was very much focused on using the Enterprise System as a common reporting and financial management tool (Queensland Treasury, 1998, 2000a). The objectives of the new QGFMS were to provide a financial management system to Queensland Government agencies that would: (1) support the ‘Managing for Outcomes’ (MFO) framework and financial management improvement activities, (2) encourage best practice resource management across Queensland Government, (3) facilitate the consolidation of Queensland Government financial information, (4) meet the business needs of agencies and (5) achieve economies of scale in main operations (Queensland Treasury, 1998, 2000a, 2000b, 2000c).
4 THE METHODOLOGY
The study adopted a dual survey approach similar to that proposed by Mackenzie and House (1979) consisting of an exploratory ‘inventory’ survey to identify the salient success dimension and measures (model building), which are subsequently the focus of a second confirmatory ‘weights’ survey, for evaluating model validity (model testing). In addition to the main data collection survey rounds, a series of expert workshops with industry and academic experts was conducted. Figure 1 depicts the study design, with spheres representing main phases of activity and rectangles key inputs and outputs.
Inventory Survey Mapping Opera
-tionalize
Impacts
A PrioriModel
Round 2Survey
Instrument
WeightsSurvey
Weights
DescriptiveStatistics
Cleaned &Described
Data
ModelTesting
ValidatedModel
LiteratureReview
Models &Frame-works
Model Building(the exploratory survey)
Model Testing(the confirmatory survey)
Round 1Survey
Instrument
Figure 1Study Design
Figure 1: Study Design
5 THE SURVEY
A survey instrument was designed to operationalize 37 starting measures of Enterprise Systems success (See Table 2 for details). Where possible, corresponding instrument items were drawn from previously validated instruments, and adapted to the current study context and the respondent cohorts. Items were scored on a seven-point likert scale with the end values (1) ‘Strongly disagree’ and (7) ‘Strongly Agree’, and the middle value (4) ‘Neutral’. The draft survey instrument was pilot tested with a selected sample of staff of the Queensland Government Treasury Department. Feedback from the pilot round respondents resulted in minor modifications to survey items. The survey collected additional demographic details on respondents’ employment title (e.g. Director, Business Analyst, ABAP consultant) and respondents were asked to provide a brief description of their involvement with the SAP system. The demographic data collected was used in classification of respondents into the four employment cohorts. Supplementary information on the organizational structure, characteristics of the SAP system and the number of users was gathered from more objective sources.

SQ1 Data accuracy IQ1 Importance II1 Learning OI1 Organisational costsSQ2 Data currency IQ2 Availability II2 Awareness / Recall OI2 Staff requirementsSQ3 Database contents IQ3 Usability II3 Decision effectiveness OI3 Cost reductionSQ4 Ease of use IQ4 Understandability II4 Individual productivity OI4 Overall productivitySQ5 Ease of learning IQ5 Relevance OI5 Improved outcomes/outputsSQ6 Access IQ6 Format OI6 Increased capacitySQ7 User requirements IQ7 Content Accuracy OI7 e-governmentSQ8 System features IQ8 Conciseness OI8 Process ChangeSQ9 System accuracy IQ9 Timeliness
SQ10 Flexibility IQ10 UniquenessSQ11 ReliabilitySQ12 EfficiencySQ13 SophisticationSQ14 IntegrationSQ15 Customisation
System Quality(SQ)
Information Quality(IQ)
Individual Impact(II)
Organisational Impact(OI)
Table 2: Enterprise Systems Success Measures
Figure 2: Enterprise System Success Model
In addition to the 37 items of table 2, the questionnaire included two criterion items aimed at gauging the respondent’s perception of overall ES success: (1) ‘overall…the impact of SAP on the agency has been positive’ and (2) ‘overall… the impact of SAP on me has been positive’. Dissemination of the survey instrument was through a (i) Web survey facility, and (ii) MS Word email attachment.
Figure 2 depicts the ES success model used in this research (Gable, Sedera, Chan, 2003). The model was tested using responses to the ‘weights survey’3. The validated model has four quadrants: (1) Individual Impact, (2) Organizational Impact, (3) Information Quality, and (4) System Quality, representing four distinct but related dimensions of the multidimensional phenomenon – Enterprise Systems Success. When evaluating an Enterprise System, measures of these dimensions represent a ‘snapshot’ of the organization’s experience of the Enterprise System at a point in time. The ‘impact’ dimensions are an assessment of benefits that have followed (or not) from the system. The ‘quality’ dimensions reflect future potential. Together, these four dimensions reflect an ostensibly ‘complete’ view on the Enterprise System – an over-arching measure of Enterprise Systems Success.
6 RESPONDENT CLASSIFICATION
A total of three hundred and nineteen (319) responses from twenty-seven public sector agencies were received in the second round survey. Nine responses were removed from the analysis due to perceived frivolity. Respondents were classified into the four employment cohorts (i.e. Strategic, Management, Operational and Technical) based on their employment title and the survey information provided pertaining to their involvement with the SAP system. In order to minimize individual errors of
3 The model yielded a KMO sampling adequacy of 0.94 and the exploratory factor analysis explained 69% of the variance. The reliability of constructs using Cronbach Alpha is SQ=0.90, IQ=0.91, OI=0.92, II=0.93. The
criterion items reported high (all above 0.80) correlations with the success dimensions and were significant at 0.001 levels.

judgment, three academics and two senior business analysts from surveyed organizations, participated in the classification of respondents into cohorts. Participants individually mapped a sample of respondents into the four employment cohorts and compared results. Guidelines were designed to increase the systemisation, repeatability and the validity of the process4. Comparison of the individual classifications revealed an average inter-coder agreement of 80%5.
# % Strategic 35 11% Management 122 39% Operational 108 35% Technical 45 15%
310 100%
Table 3: Employment Cohorts
The classification exercise revealed (See table 3) 11% of respondents were from the Strategic level, 39% from Management level, 35% were from the Operational levels and 15% represented Technical staff. All indications suggest that this distribution is representative of users of the SAP system in Queensland Government (Sedera, Gable, Palmer, 2002).
7 EMPLOYMENT COHORTS AND PERCEPTIONS OF SUCCESS
As stated earlier, the main emphasis of this paper is to validate the four employment cohorts to the ES context and to explore the relevance of ES success dimensions to each of the employment cohorts. The preceding section includes a detail discussion of the views held by the four employment cohorts of this study. Each analysis begins with a brief introduction to the success dimensions followed by the empirical evidence on views of the four employment cohorts6. Analysis of Variance indicates significant differences (at 0.05) among the employment cohorts in their overall assessment of success (criterion 1 and criterion 2) and for all success dimensions except in Information Quality7. Paired t tests were conducted to further explore the differences in employment cohorts and subsequently to identify the relevance of the success measures to each of the employment cohorts.
7.1 System Quality (SQ)8
The quality of a system under investigation is a multifaceted phenomenon. The System Quality construct is designed to capture how the system performs from a technical and design perspective. Measures employed in prior research to gauge System Quality have included: (1) System Efficiency, (2) Reliability, (3) Response time, (4) Ease of use, (5) Content of database, and (6) System accuracy. Hong and Kim (2001) suggest that in the context of ES the fit between organisational requirements and system features, is an important System Quality measure.
4 Classification guidelines and samples are available upon request
5 Krippendorf (1980) recommends inter-coder reliability of at least 70% and suggests that any significant discrepancies should be discussed until consensus on the mappings is reached.
6 For details of the operationalization of the items and the survey instrument, please refer to Gable, Sedera, Chan, 2003; Sedera, Gable, Chan 2003c; Sedera, Gable, Chan, 2003d. 7 System Quality = 0.015; Information Quality = 0.113; Individual Impact = 0.000; Organizational Impact = 0.003; Criterion 1 = 0.002; Criterion 2 = 0.000 8
The reliability of
System Quality is 0.90

Mean StDev t value df Sig (2-tailed)
Measuresof ES Success
Mgmt-Ope Mgmt-St Mgmt-Tec^ Ope-St Ope-Tec^ Tec-St^
St 3.53 0.99 SQ1 0.04 0.01 0.03Mgmt 3.89 1.15 SQ2 0.02
St 3.53 0.99 SQ3 0.048Ope 3.81 1.29 SQ4
St 3.53 0.99 SQ5Tec 4.34 1.15 SQ6
Mgmt 3.89 1.15 SQ7 0.02 0.001 0.034 0.01 0Ope 3.81 1.29 SQ8 0.02 0.003 0.006
Mgmt 3.89 1.15 SQ9 0.006Tec 4.34 1.15 SQ10 0 0 0Ope 3.81 1.29 SQ11 0 0.03 0 0.001Tec 4.34 1.15 SQ12 0 0.04 0
SQ13 0.04SQ14 0 0 0.001SQ15 0.01 0.03
A
-2.771 107.50 0.007
0.470 228.00 0.639
-2.363 165.00 0.019
1.332 74.00 0.187
-3.645 78.00 0.000
1.653 155.00 0.100
T-Test of Employment CohortsB
Employment Cohorts
^ significant at 0.05 level
Table 4(A): T-test of System Quality for employment cohorts | (B) System Quality measures and
employment cohorts
Paired t-tests conducted illustrates that Technical respondent scores of System Quality differed significantly from all three other cohorts, with Technical cohort scoring System Quality higher than all three (See T-Test in table 4 A)9.
The analysis shown in table 4(B) was completed to understand the perceived differences between the employment cohorts on System Quality measures and the following observations were made.
The most commonly used measures of System Quality – Ease of Use (SQ4) and Ease of Learning (SQ5) – did NOT report significant differences with the four employment cohorts. It indicates that the amount of system usage (believed to be higher with Operational Staff and lower with Strategic,) does not change the level of success. The findings further support the argument on the inappropriateness of ‘Usage’ as a dimension of success (See discussion in Gable, Sedera, Chan 2003; Seddon, 1997). The accessibility of the system (SQ6) is the only other measure that did not show any significant differences across the employment cohorts. If only these measures had been used in this study, we would have observed no significant differences across the cohorts on System Quality. Significant differences were observed in; accuracy of data in the system (SQ1), meeting user requirements (SQ7), system features (SQ8), system flexibility (SQ10), system reliability (SQ11), system efficiency (SQ12) and the integration of the system (SQ14). These results indicate the perceived differences of the four employment cohorts on ES System Quality, thus support the initial proposition of gathering views from multiple stakeholders to evaluate ES success. Further, it indicates the importance of the completeness of the success measures and dimensions in gauging ES success.
7.2 Information Quality (IQ)10
Measures of Information Quality focus on the output (on-screen and reports) produced by the system, and the value, usefulness or relative importance attributed to the output by the users. In an early leading study of IS success, Bailey and Pearson (1983) identified nine characteristics of Information
9 St = Strategic, Mgmt = Management, Ope = Operational, Tec = Technical 10
The reliability of
Information Quality is 0.9
1

Quality: accuracy, precision, currency, timeliness, reliability, completeness, conciseness, format and relevance. Sirinivasan (1985) added ‘understandability’ of information as another important sub-construct; while Saaksjavi and Talvinen (1993) employed content, availability, accuracy as sub-construct measures of Information Quality in their study of marketing information systems. Rainer and Watson (1995) found accuracy, timeliness, conciseness, convenience and relevance as being key aspects of Executive Information Systems’ Information Quality.
Mean StDev t value df Sig (2-tailed)
Measuresof ES
SuccessMgmt-Ope Mgmt-St Mgmt-Tec Ope-St Ope-Tec Tec-St
St 3.63 1.26 IQ1Mgmt 4.03 1.36 IQ2
St 3.63 1.26 IQ3 0.02^ 0.001^Ope 3.89 1.45 IQ4 0.004^ 0.01^
St 3.63 1.26 IQ5 0.01^Tec 4.32 0.97 IQ6 0.04^
Mgmt 4.03 1.36 IQ7 0.05^Ope 3.89 1.45 IQ8 0.005^
Mgmt 4.03 1.36 IQ9 0^ 0.024^ 0.0001^Tec 4.32 0.97 IQ10Ope 3.89 1.45Tec 4.32 0.97
BEmployment Cohorts
^: significant at 0.05 level^^: significant at 0.1 level
0.922 141 0.358
-2.770 78 0.007
0.784 228 0.434
-1.312 165 0.191
-2.171 121.32 0.032
AT-Test of Employment Cohorts
1.548 155 0.124
Table 5 (A): T-test of Information Quality for employment cohorts | (B) Information Quality measures and employment cohorts
Similar to the System Quality dimension discussed above, the Technical staff scores of Information Quality differed significantly from Strategic and Operational cohorts (See t test in Table 5 A). However, the scores of Strategic, Management, Operational employment cohorts did not illustrate significant differences in this success dimension.
In the measures of Information Quality depicted in table 5(B), only one measure (timeliness of information (IQ9)) reported significant differences across the employment cohorts. It indicates that the employment cohorts do not have differentiating views on the quality of information received from the SAP system.
7.3 Individual Impact (II)11
Individual Impact is concerned with how the ES has influenced the performance of individual users. Individual Impact tends to encompass a broad range of measures such as: confidence in decisions made, improvements in decision-making, and the time to reach a decision (Kim and Lee, 1986; Sirinivasan, 1985; Ein-Dor, Segev, Steinfeld, 1981). Dickson, Senn, Chervany, (1977) provided early insights into Individual Impact citing decision quality, decision time, decision confidence, and estimated outcomes. This study employs four measures to comprehensively gauge the ES success.
11 The reliability of Individual Impact is 0.92

Mean StDev t value df Sig (2-tailed)
Measuresof ES
SuccessMgmt-Ope Mgmt-St Mgmt-Tec Ope-St Ope-Tec Tec-St
St 3.89 1.31 II1 0^ 0.009^ 0.002^ 0^Mgmt 4.47 1.29 II2 0.01^ 0.03^ 0.004^ 0^
St 3.89 1.31 II3 0.004^ 0.009^ 0^Ope 4.75 1.50 II4 0.01^ 0.001^ 0^ 0^
St 3.89 1.31Tec 5.26 1.34
Mgmt 4.47 1.29Ope 4.75 1.50
Mgmt 4.47 1.29Tec 5.26 1.34Ope 4.75 1.50Tec 5.26 1.34
BEmployment Cohorts
^: significant at 0.05 level^^: significant at 0.1 level
AT-Test of Employment Cohorts
2.33 155 0.021
3.04 141 0.003
-4.59 78 0.000
-2.00 151 0.048
-1.52 228 0.130
-3.49 165 0.001
Table 6(A): T-test of Individual Impacts for employment cohorts | (B) Individual Impact measures
and employment cohorts
It is intuitive that the cohorts would display different views on Individual Impact. This being their perception of how they have personally been impacted by the system, the expectation being that the various cohorts will have been impacted differently. All employment cohort pairs, except Management and Operational, exhibit differences in perceptions on Individual Impacts (See ANOVA results and t-test in Table 6A). The measures of Individual Impacts displayed significant differences across all employment cohorts (see t-test results displayed in Table 6B).
7.4 Organizational Impacts (OI)12
The impact of an ES on organisational performance is difficult to isolate. Consideration was given to the overall objectives of the organization, and there should be a clear separation from Individual Impacts. Eight measures were utilized to evaluate ES impacts at the organisational level.
Analysis of the exploratory survey data and interviews of participating agencies provided insights into overall objectives of these organisations and are used in the data analysis herein. It can be seen in the results shown in Table 7(A), the Strategic employment cohort scores of Organizational Impacts differ significantly from other employment cohorts. The Strategic cohort’s scores of Organizational Impacts are lower than the ones of all the other cohorts. At the measurement level (See Table 7B), no significant differences were observed in the following measures: Staff requirements (OI2), positioning the e-government (OI7), Business process change (OI8).
12
The reliability of
Organizational Impact is 0.9
3

Mean StDev t value df Sig (2-tailed)
Measuresof ES
SuccessMgmt-Ope Mgmt-St Mgmt-Tec Ope-St Ope-Tec Tec-St
St 3.36 1.30 OI1 0.007^ 0^ 0.02^Mgmt 4.02 1.15 OI2 0.008^ 0.001^
St 3.36 1.30 OI3 0.01^ 0.001^ 0.007^Ope 4.06 1.10 OI4 0.008^ 0.001^ 0.007^
St 3.36 1.30 OI5 0^ 0.03^ 0^ 0.01^ 0^Tec 4.27 0.99 OI6 0.02^ 0.04^ 0.04^ 0.004^ 0.0004^
Mgmt 4.02 1.15 OI7Ope 4.06 1.10 OI8 0.01^
Mgmt 4.02 1.15Tec 4.27 0.99Ope 4.06 1.10Tec 4.27 0.99
BEmployment Cohorts
^: significant at 0.05 level^^: significant at 0.1 level
AT-Test of Employment Cohorts
2.91 155.00 0.004
3.11 141.00 0.002
-3.42 61.78 0.001
-0.26 228.00 0.796
-1.30 165.00 0.197
-1.11 151.00 0.267
Table 7(A): T-test of Organizational Impacts for employment cohorts | (B) Organizational Impact
measures and employment cohorts
7.5 Summary
The section above attempted to answer the following research questions: what are the distinctive employment cohorts in ES context?, whether the employment cohorts have different views on ES success, and in what ES success dimensions they differ?. Four employment cohorts were used at the outset of the study to classify the respondents. Several comparative statistical tests were then conducted to identify the prominent employment cohorts. Results indicate that the Management and Operational employment cohorts do not show significant differences in views of ES success across. The other employment cohort pairs do illustrate significance differences across the four success dimensions. These results encouraged the creation of a new cohort, by merging the Management and Operational employment cohorts (named ‘users’). In relation to the ES success dimensions, Technical and Strategic employment cohorts displayed significant differences in System Quality, Individual Impact and Organizational Impact. The Information Quality success dimension did not demonstrate significant differences across any employment cohorts.
8 EXTENDED ANALYSIS OF EMPLOYMENT COHORTS
Drawing on the results reported in prior sections of this paper, the section below addresses the three remaining research aspects related employment cohorts: (1) the importance of gathering responses from multiple employment cohorts, (2) the adequacy of knowledge possessed by the respondents in assessing ES success and (3) the additivity of all measures and respondents to yield an overall evaluation for success.
SQ IQ OI IITechnical 0.83 0.74 0.69 0.49Strategic 0.75 0.78 0.80 0.64
USER 0.84 0.73 0.78 0.77 Table 8: Correlation analysis
As illustrated in the analysis above (See Tables 4 – 7), each cohort has different and valuable views on ES success. These views must be combined in a systematic way to arrive at a complete assessment of
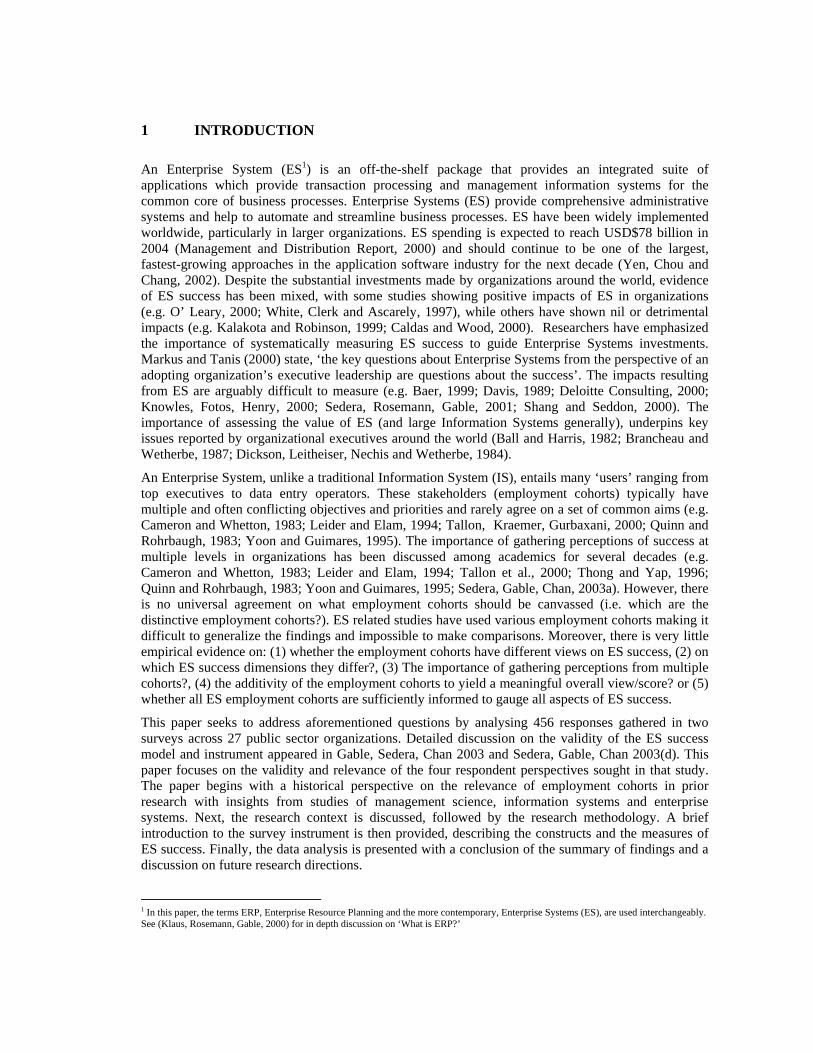
ES success. Furthermore, the completeness of employment cohorts is an essential aspect in validating measurement models (Gable et al., 2003). Table 8 depicts the correlations of the success dimensions with the combined criterion items13 arranged according to the employment cohorts (the new employment category USER is the combination of Operational and Management responses).
SQ IQ II OI(a)St 3.53 3.63 3.89 3.36
(b)Tec 4.34 4.32 5.26 4.27(c)User 3.85 3.96 4.61 4.04
(a+b) 3.94 3.98 4.57 3.82 Table 9: Mean Values
It can be seen that all the employment cohorts have displayed reasonable correlations between the dimensions of success and the criterion items. This ensures that all employment cohorts have placed reasonable emphasis on every success dimension in evaluating ES success. However, some employment cohorts have displayed stronger correlations with certain dimensions (e.g. Technical with System Quality and Strategic with Organizational Impacts). The results of the stronger correlations by the Technical and Strategic cohorts, combined with the results of the t-tests demonstrate the relative importance/knowledge that those respective cohorts place on System Quality and Organizational Impacts respectively. In other words, Technical staff places greater emphasis on ‘System Quality’ in evaluating ES success. Similarly, the Strategic level employees place greater emphasis on holistic Organizational Impacts.
The newly created USER cohort has a strong and consistent correlation across all the ES success dimensions. Furthermore, the USER cohort demonstrates comparable mean values to the aggregate means of Strategic and Technical levels (See Table 9). These findings illustrate the ability of middle managers’ to foresee ES success in all dimensions. These findings support claims by Shang and Seddon (2002) about the appropriateness of gathering perceptions from middle managers in ES evaluations. Given the constraints of an ES evaluation research, one could gather perceptions only at the USER level (Management + Operational) and make useful contributions. Gable et al. (2003) adequately discussed the importance of additivity of measures and respondents in assessing ES comprehensively. Though far from conclusive from the evidence presented in this paper, combining the views and respondents to gauge ES success would be beneficial to both academia and to the practice.
9 SUMMARY FINDINGS, CONCLUSIONS AND THE OUTLOOK
Following observations were made on ES employment cohorts based on a comprehensive literature review and results from a thorough statistical analysis ranging from descriptive statistics, analysis of variance, and paired t-test. Results indicate the following: - Employment cohorts possess different views on ES success. These differences in views on success
are clearly evident in (1) Management – Strategic, (2) Management – Technical, (3) Operational – Strategic, (4) Operational – Technical and (5) Technical – Strategic employment cohort pairs.
- Out of the four cohorts, Technical staff displayed significant differences with all other employment cohorts.
- Negligible differences were observed between Management and Operational cohorts. - These similar views held by the Management and Operational cohorts led to the creation of a new
employment cohort (named ‘User’) for analysis purposes.
13 See discussions in Gable, Sedera, Chan (2003) on the appropriateness of the combined criterion items

- The Strategic and Technical cohorts showed significant differences in three of the four Enterprise Systems success dimensions (Individual Impacts, Organizational Impacts and System Quality).
- Negligible differences were observed in Information Quality dimension. - Paired T-tests conducted at the measurement level of the success dimensions pointed out
important differences across the employment cohorts. The extended analysis on employment cohorts revealed the following: - All employment cohorts (Strategic, User and Technical) are sufficiently informed to respond to
questions on all success dimensions. - These views on ES success held by the employment cohorts can be aggregated to gain further
useful insights into ES success. - Some employment cohorts are in a position to provide better insights due to their proximity to
certain ES success dimensions. - The newly created ‘User’ cohort (Management + Operational) has the best overall knowledge on
ES success in all dimensions. Therefore, user cohort is the best surrogate employment cohort to gather perceptions, if the organization decides to collect views from only one employment cohort.
- A carefully crafted survey instrument can be used to serve multiple stakeholders. - Finally, this study identified procedures and guidelines to recognize relevant employment cohorts
in the context of Enterprise Systems.
Several areas can be further researched to enhance the knowledge in ES employment cohorts and ES success. Explanatory research should be carried out in order to further our understanding on the multiple stakeholder perspective. The study guidelines used for classifications and the analysis should be replicated to extend the validity of the study findings. This study was conducted in the public sector ES context and replication of the study is strongly encouraged in other contexts.
Reference Available upon request from the contact author