measuring neural entrainment to beat and meter in infants ... · entrainment to beat and meter in...
TRANSCRIPT

ORIGINAL RESEARCHpublished: 24 May 2016
doi: 10.3389/fnins.2016.00229
Frontiers in Neuroscience | www.frontiersin.org 1 May 2016 | Volume 10 | Article 229
Edited by:
Andrea Ravignani,
Vrije Universiteit Brussel, Belgium
Reviewed by:
István Winkler,
University of Szeged, Hungary
Erin E. Hannon,
University of Nevada, Las Vegas, USA
*Correspondence:
Laurel J. Trainor
Specialty section:
This article was submitted to
Auditory Cognitive Neuroscience,
a section of the journal
Frontiers in Neuroscience
Received: 15 February 2016
Accepted: 09 May 2016
Published: 24 May 2016
Citation:
Cirelli LK, Spinelli C, Nozaradan S and
Trainor LJ (2016) Measuring Neural
Entrainment to Beat and Meter in
Infants: Effects of Music Background.
Front. Neurosci. 10:229.
doi: 10.3389/fnins.2016.00229
Measuring Neural Entrainment toBeat and Meter in Infants: Effects ofMusic BackgroundLaura K. Cirelli 1, Christina Spinelli 1, Sylvie Nozaradan2, 3, 4 and Laurel J. Trainor 1, 5, 6*
1 Department of Psychology, Neuroscience and Behaviour, McMaster University, Hamilton, ON, Canada, 2 MARCS Institute,
Western Sydney University, Milperra, NSW, Australia, 3 Institute of Neuroscience, Université Catholique de Louvain,
Louvain-la-Neuve, Belgium, 4 BRAMS, Université de Montréal, Outremont, QC, Canada, 5 McMaster Institute for Music and
the Mind, McMaster University, Hamilton, ON, Canada, 6 Rotman Research Institute, Baycrest Hospital, Toronto, ON, Canada
Caregivers often engage in musical interactions with their infants. For example, parents
across cultures sing lullabies and playsongs to their infants from birth. Behavioral studies
indicate that infants not only extract beat information, but also group these beats
into metrical hierarchies by as early as 6 months of age. However, it is not known
how this is accomplished in the infant brain. An EEG frequency-tagging approach has
been used successfully with adults to measure neural entrainment to auditory rhythms.
The current study is the first to use this technique with infants in order to investigate
how infants’ brains encode rhythms. Furthermore, we examine how infant and parent
music background is associated with individual differences in rhythm encoding. In
Experiment 1, EEG was recorded while 7-month-old infants listened to an ambiguous
rhythmic pattern that could be perceived to be in two different meters. In Experiment
2, EEG was recorded while 15-month-old infants listened to a rhythmic pattern with an
unambiguous meter. In both age groups, information about music background (parent
music training, infant music classes, hours of music listening) was collected. Both age
groups showed clear EEG responses frequency-locked to the rhythms, at frequencies
corresponding to both beat and meter. For the younger infants (Experiment 1), the
amplitudes at duple meter frequencies were selectively enhanced for infants enrolled
in music classes compared to those who had not engaged in such classes. For the older
infants (Experiment 2), amplitudes at beat and meter frequencies were larger for infants
with musically-trained compared to musically-untrained parents. These results suggest
that the frequency-tagging method is sensitive to individual differences in beat and meter
processing in infancy and could be used to track developmental changes.
Keywords: neural entrainment, rhythm, meter, electroencephalography, infancy, steady-state evoked potentials,
music, frequency-tagging
INTRODUCTION
Mothers across cultures interact with their infants in musical ways, frequently singingthem lullabies and playsongs (Trehub and Schellenberg, 1995; de l’Etoile, 2006; Trehub andGudmundsdottir, 2015). In turn, infants respond positively to this input (Trainor, 1996).Furthermore, caregivers rock infants to the rhythms of music, and such synchronous interpersonalmovement appears to increase infant social affiliative behaviors (Cirelli et al., 2014a,b; 2016;Tunçgenç et al., 2015). Yet little is known about how infants’ brains encode musical
Cirelli et al. Infant SS-EPs to Rhythms
rhythms. The present paper reports the results of twoexperiments using an original electroencephalographic (EEG)frequency-tagging approach to investigate the neural encodingof rhythms in 7- and 15-month-old infants. The results suggestthat the frequency-tagging approach can be successfully usedwith infants, and also revealed individual differences in musicalrhythm processing related to differences in infant and parentmusic training.
Humans are very good at organizing timing structures inmusic (for a review, see Repp and Su, 2013). From the rhythm(i.e., pattern of tone onsets and offsets), people can easilyextract the underlying pulse, or beat. These beats are thenperceptually organized into hierarchical groups to create aninternal metrical structure representation through which themusical input is interpreted as alternating patterns of strongand weak beats. Some examples of common Western musicmeters include grouping isochronous beats into a duple metricalstructure (groups of 2), a triple metrical structure (groups of3), or a quadruple metrical structure (groups of 4). Whilenon-musicians easily perceive meter (especially when low-levelcomponents of the rhythm make meter salient), musiciansoften display advantages on tasks involving meter perceptionand production (for example, Drake et al., 2000; Brochardet al., 2003). Perception of beat and meter are not only drivenby auditory cues in the stimulus, but also shaped by top-down processes such as attention, expectation and previousexperience (see for example Large and Jones, 1999; Brochardet al., 2003; Phillips-Silver and Trainor, 2007, 2008; Nozaradanet al., 2011; Schaefer et al., 2011; Manning and and Schutz,2013; Chemin et al., 2014; Butler and Trainor, 2015; Celma-Miralles et al., 2016). For example, when listening to unaccentedisochronous tones, both musician and non-musician adultsshowed larger event-related potentials (ERPs) to every secondtone, suggesting that a duple metrical structure was automaticallyapplied (Brochard et al., 2003). Thus, meter perception canbe automatic, especially when low-level information in therhythmic stimulus increases the salience of strong over weakmetrical beats, but it can also be shaped by attention and musictraining.
While many questions remain about the developmental time-course of beat and meter perception, there is evidence that younginfants are sensitive to this timing information. Newborns candiscriminate between spoken languages that fall into differentrhythmic categories (for example, English compared to Japanese)(Nazzi et al., 1998). By as early as 2 months of age, infants candetect tempo changes (Baruch andDrake, 1997) and discriminatebetween different musical rhythm patterns (Chang and Trehub,1977; Demany et al., 1977). In terms of meter processing,Winkleret al. (2009) argue that such processing occurs even in newborninfants. Using electroencephalography (EEG) and a mismatch-negativity paradigm, they showed that newborns were better ableto detect the omission of a metrically important than metricallyunimportant beats in a rhythm pattern. Behaviorally, by as earlyas 7 months of age infants can categorize melodies and rhythmsbased on metrical structure (Hannon and Johnson, 2005), anduse movement to guide meter perception (Phillips-Silver andTrainor, 2005).
Infants are also learning about metrical structure throughexposure to music during the first year after birth. Hannonand Trehub (2005a,b) revealed this effect of exposure by takingadvantage of the fact that musical systems in different culturesuse predominantly different meter styles. For instance, Westernmeters tend to be simple, with metrical groupings of beats by2 or 3, whereas music from many other places in the worldcontains complex meters with metrical groupings of 5 or 7beats (for example, Bulgarian music). Hence, Western adultsare much better at detecting violations in patterns with simplemeters compared to patterns with complex meters, whereasadults exposed to musical systems containing complex meters(such as Bulgarian music) are equally good at detecting violationsin patterns with both simple and complex meters (Hannon andTrehub, 2005a). Interestingly, at 6months of age,Western infantsare apt at detecting metrical violations in both culturally familiarand unfamiliar rhythmic patterns. However, by the time thesebabies are 12-months-old, they perform like adults, and are onlyable to detect violations in patterns with simple meters (Hannonand Trehub, 2005b). This perceptual narrowing indicates thatmusical exposure during the first year after birth shapes howmusical timing structures are processed and perceived by infants.
The influence of controlled musical exposure during infancyon music processing has not been extensively studied, but oneseries of experiments did find evidence for such effects (Gerryet al., 2012; Trainor et al., 2012). In this investigation, 6-month-old infants and their parents were randomly assigned to attend6-months of one of two types of caregiver/infant classes: (1)active music classes or (2) control classes focusing on play whilemusic was presented passively. After (but not before) the trainingperiod, infants in the active music classes displayed larger andearlier brain responses to musical sounds as measured usingEEG. Interesting correlations between preferences for expressiveover mechanical music performances and socio-economic status(SES) were also found, independent of class assignment. Infantsfrom families with a higher compared to lower SES were morelikely to prefer expressive music to synthesized non-expressivemusic (Trainor et al., 2012). While this correlation is difficultto interpret, it is possible that parents from a higher SES havethe means to receive music training themselves and expose theirinfants to a wider variety of musical stimuli. While these resultshave important implications on howmusical exposure in infancyshapes music perception, they do not address how experiencemight affect the encoding of beat and meter in infancy.
One promising method for exploring infant rhythmprocessing is the EEG frequency-tagging approach (seeNozaradan, 2014 for a review). This original method was initiallyused to investigate the neural mechanisms underlying rhythmprocessing in adults. Neural entrainment to the incomingrhythm is measured in the form of peaks emerging from the EEGspectrum at frequencies corresponding to the rhythm envelope(Nozaradan et al., 2012b). In an initial study, participants wereasked to listen to an isochronous auditory stimulus with a2.4Hz beat frequency and to imagine either that beats weremetrically grouped in twos (a duple meter frequency at 1.2Hz)or threes (a triple meter frequency at 0.8Hz) (Nozaradan et al.,2011). The sound stimulus itself did not contain any energy
Frontiers in Neuroscience | www.frontiersin.org 2 May 2016 | Volume 10 | Article 229

Cirelli et al. Infant SS-EPs to Rhythms
at either of these metric frequencies. Interestingly, comparedto when they were not asked to imagine a metrical structure,participants displayed a peak of brain activity (i.e., steady-stateevoked potentials, or SS-EPs) specifically located at the imaginedmetrical frequencies. Importantly, this result suggests that theSS-EPs elicited in response to the sound do not merely constitutea faithful encoding of the stimulus rhythm. Rather, the braintransforms the rhythmic input by amplifying frequencies thatcoincide with perceived beat and meter frequencies. This findingwas corroborated by subsequent frequency-tagging studiesshowing that SS-EPs elicited at frequencies corresponding to theperceived beat and meter were influenced not only by bottom-upstimulus properties, but also by top-down processes such asmovement or predictive timing (Chemin et al., 2014; Nozaradanet al., 2012b, 2015, 2016).
The purpose of the present investigation was to use thefrequency-tagging approach with infants to test whether musictraining shapes the neural encoding of rhythms early in infancy.EEG was recorded while infants listened to rhythmic patterns.There were two main goals of the research. First and foremost,we aimed to investigate the neural entrainment to rhythmicpatterns in infants by measuring SS-EPs at beat- and meter-related frequencies in the EEG spectrum. Second, we investigatedhow individual differences in music background correlatedwith individual differences in these SS-EP measurements.We expected to find enhanced neural entrainment at beatand/or meter frequencies in the infants with stronger musicbackgrounds. Information was collected about parents’ musictraining, enrolment in caregiver/infant music classes, and weeklyhours of music listening. Experiment 1 presents results from alarge sample of 7-month-old infants. These babies listened toan ambiguous rhythmic stimulus (that could be interpreted asin either duple or triple meter) used previously in behavioralstudies with infants and adults (Phillips-Silver and Trainor, 2005,2007), as well as EEG studies with adults (Chemin et al., 2014).By this age, infants are not yet encultured to their musicalenvironment, but do perceive beat and meter (Hannon andTrehub, 2005a). Experiment 2 presents results from 15-month-old infants, some whom had been recently randomly assigned toattend caregiver-infant music classes. These older infants listenedto an unambiguous rhythmic stimulus with a typical Westernquadruple meter that had been previously used in behavioral andEEG studies with adults (Nozaradan et al., 2012a, 2016). By thisage, infants should be encultured to their musical environment,and should show more adult-like responses. Having two agegroups and two different rhythm patterns provides a test of thegeneralizability of the frequency tagging method.
EXPERIMENT 1
Materials and MethodsParticipantsSixty 7-month-old (28 males; M age = 7.56 mo, SD = 0.29mo) normal hearing infants participated in this experiment.An additional 14 infants participated, but were too fussy tocomplete the procedure. These infants were recruited from theDevelopmental Studies Database at McMaster University. The
McMaster Research Ethics Board approved all procedures andinformed consent was obtained from parents.
StimulusThe stimulus consisted of a six-beat rhythm pattern, lasting 2 s,based on the stimulus used by Phillips-Silver and Trainor (2005)(Figure 1B). The rhythm pattern consisted of the following: tone-silence-tone-tone-tone-silence. Each beat had an inter-onset-interval of 333 ms (180 beats per minute), which translated toa beat frequency of 3Hz. The tones were 990Hz pure toneslasting 333 ms with 10 ms rise and fall times synthesized usingthe programAudacity 2.0.5 (www.audacity.sourceforge.net). One34-s long trial consisted of 17 repetitions of this stimulus. Thesetrials were repeated 32 times, with no pauses between trials, sothat the entire procedure lasted just over 18min with a break atthe halfway point. The stimulus was presented at a comfortableintensity level [∼60 dB SPL at the location of the infants’ headover a noise floor of <30 dB(A)] using Eprime software throughan AudioVideo Methods speaker (P73) located approximately1m in front of the infant.
To determine frequencies of interest for the SS-EP analysis,the temporal envelope of the rhythm pattern was extracted usinga Hilbert function implemented in MATLAB, yielding a time-varying estimate of the instantaneous amplitude of the soundenvelope. The obtained envelope was then transformed in thefrequency domain using a discrete Fourier transform, yielding afrequency spectrum of acoustic energy (Figure 1A).
ProcedureAfter the nature of the study was described, the infant’sparent(s) gave written consent to participate and also filled outa questionnaire about their child’s and their own hearing andmusical history.
The parent sat on a chair ∼1m in front of the speaker,and held their infant on their lap. Infants’ EEG signals wererecorded while they passively listened to the stimulus for 18min,with one break at the halfway point. During the procedure, anexperimenter stayed in the room and silently entertained theinfant with puppets, bubbles and toys to keep them still andcontent. A silent video played on a monitor below the speaker.Parents were asked to not speak during the recording session andto minimize their movements.
Data Acquisition and AnalysisEEG signals were collected using a 124-channel HydroCel GSNnet with an Electrical Geodesic NetAmps 200 amplifier passing adigitized signal to Electrical Geodesics NETSTATION software(v.4.3.1). Signals were recorded online with at a sampling rateof 1000Hz and with a Cz reference. Electrode impedance duringrecording was maintained below 50 k!.
The data were filtered offline using EEProbe Software withhigh-pass and low-pass filters set at 0.5 and 20Hz respectively.The data were resampled at 200Hz in order to be processedusing the Artifact Blocking algorithm inMATLAB (Mourad et al.,2007). This algorithm is especially useful for improving signal tonoise ratios in continuous infant data (Fujioka et al., 2011). UsingEEProbe Software, recordings were then digitally re-referenced
Frontiers in Neuroscience | www.frontiersin.org 3 May 2016 | Volume 10 | Article 229

Cirelli et al. Infant SS-EPs to Rhythms
FIGURE 1 | (A) The frequency spectrum of the stimulus sound envelope. (B) The rhythmic pattern, which consisted of 333 ms long tones and rests. Each tone
consisted of 990Hz pure tones with 10 ms rise and fall times. (C) Average SS-EPs with noise subtracted amplitudes averaged across all channels. Peaks can be
visualized at the triple meter frequency (1Hz), duple meter frequency (1.5Hz), and beat frequency (3Hz). (D) Average topographical map of the SS-EPs elicited at the
triple meter frequency (1Hz), duple meter frequency (1.5Hz), and beat frequency (3Hz), averaged across all participants.
to a common average. The 32 trials were averaged from 1000to 34,000 ms, with baseline defined between 900 and 1000 ms.The first second of each epoch was removed (i) to discard thetransient auditory evoked potentials related to stimulus onset and(ii) because SS-EPs require several cycles of stimulation to beentrained (Regan, 1989; Nozaradan et al., 2011, 2012b).
A Fourier transform was applied to the averaged EEGwaveforms at each electrode using Letswave5 (Mouraux andIannetti, 2008). This yielded a frequency spectrum where thesignal amplitude (µV) ranged from 0 to 500 with a frequencyresolution of 0.031Hz. To obtain valid estimates of SS-EPs,the contribution of unrelated residual background noise wasremoved. This was accomplished by subtracting the averagedamplitude measured at neighboring frequency bins from eachfrequency bin (Mouraux et al., 2011; Nozaradan et al., 2012a).The two neighboring bins ranged from −0.15 to −0.09Hzand +0.09 to +0.15Hz relative to each frequency bin, thuscorresponding to −3 to −5 and +3 to +5 bins around eachfrequency bin of the spectrum. Then, SS-EP magnitudes wereaveraged across all scalp electrodes for each participant, to allowSS-EP amplitudes to be compared across groups while avoidingelectrode selection bias (Nozaradan et al., 2011, 2012b, 2016).
Event related potential (ERP) analyses were also performedon the filtered (0.5Hz high pass, 20Hz low pass), resampled,artifact corrected and re-referenced data. Epochs from −100 to300 ms relative to the onset of the first tone in each 6-beatsequence were averaged (total trials= 544), with baseline definedas −100 to 0 ms. Waveforms from eight right frontal channelswere averaged and waveforms from the corresponding eight leftfrontal channels were averaged to examine the response fromauditory cortex. Because of the orientation of auditory cortexaround the Sylvian Fissure, activity from auditory areas typically
shows up at frontal electrode sites on the surface of the scalp(Trainor, 2012). We defined the time-point at which the largestmagnitude peak occurred in the grand average at each electrodegrouping. Area under the curve was then calculated for eachindividual infant for each hemisphere as the area±50 ms aroundthis time point.
ResultsTo check for outliers, an average SS-EP amplitude score wascalculated for each infant across the 5 peaks frequency-taggedfrom the sound stimulus (1, 1.5, 2, 2.5, and 3Hz). The z-scores across these averages were calculated, and one infant wasexcluded from further analyses using a z-score cutoff of ±3.For ANOVAs using repeated measures, Greenhouse-Geissercorrections are reported where applicable.
SS-EP ResponsesSS-EPs averaged across all channels and scalp topographies arevisualized in Figures 1C,D. The expected beat frequency is at3Hz (i.e., 333 ms long tones and rests in the rhythmic pattern).Based on previous work with this rhythm pattern (Phillips-Silverand Trainor, 2005, 2007; Chemin et al., 2014), this ambiguousstimulus pattern can be interpreted as in either duple or triplemeter, although there is a bias in Western adults for the dupleinterpretation (Chemin et al., 2014). 1.5Hz represents the relatedmetrical frequency where beats are grouped in two (duple) and1Hz represents the metrical frequency where beats are groupedin three (triple).
To determine if the peaks in the frequency-transformed EEGoccurred as expected above the noise floor, peaks of interestwere first determined from the FFT of the sound stimulus(See Figure 1A). Amplitudes in the frequency-transformed EEG
Frontiers in Neuroscience | www.frontiersin.org 4 May 2016 | Volume 10 | Article 229
Cirelli et al. Infant SS-EPs to Rhythms
were calculated at frequencies where peaks were present in thesound stimulus (1, 1.5, 2, 2.5, and 3Hz; 0.5Hz was excludeddue to our use of a 0.5Hz high pass filter). These werealso calculated at frequencies where no peaks were presentin the sound stimulus (0.75, 1.25, 1.75, 2.25, and 2.75Hz).These amplitudes were calculated by selecting the maximumamplitude within a 3-bin band centered on the frequency ofinterest.
Average noise floor amplitude was calculated as the averageacross 0.75, 1.25, 1.75, 2.25, and 2.75Hz. Using paired-samples t-tests corrected for multiple comparisons using theBonferroni correction, EEG amplitudes at each of the frequenciescontained in the sound stimulus were significantly above thisaverage noise floor (all p’s < 0.010). In addition, the averageamplitude of beat and meter-related frequencies (1, 1.5, 3Hz)was significantly greater than the average amplitude of beat-and meter-unrelated frequencies present in the sound (2Hz,2.5Hz), t(58) = 9.54, p < 0.001. The significant presence ofpeaks at both 1.0 and 1.5Hz in the grand average likely reflectsthat some infants perceived the rhythm in duple meter andsome in triple meter, or that individual infants may haveswitched back and forth in their interpretation, but we are notable to distinguish these possibilities. In general, these resultssuggest that the frequency tagging SS-EP method can resultin significant signal to noise ratios when used with this agegroup.
Effects of Music BackgroundEffect of infant music classesThirteen infants in this sample were reported to have participatedin infant music classes with their caregiver. Most (11 of the13) reported attending the classes for 45–60 minutes hour perweek. Classes were varied (e.g., Kindermusik, Music Together)and started at various ages (starting age ranged from 1- to6-months-old).
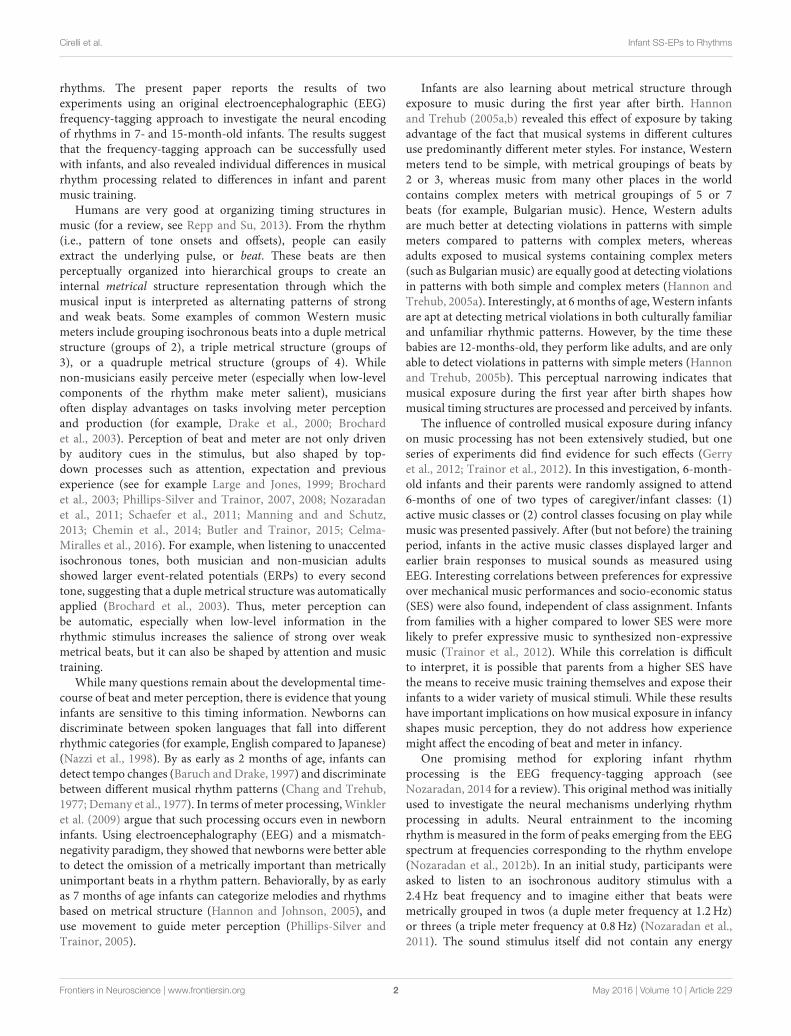
An ANOVA with participation in music classes as abetween subjects variable and frequency (five levels: beat,3Hz; duple meter, 1.5Hz; triple meter, 1Hz; unrelated, 2and 2.5Hz) as a within subjects variable was used toinvestigate SS-EP amplitudes. A main effect of infant musicclasses [F(1, 57) = 5.692, p = 0.02] was qualified by asignificant interaction between class participation and frequency,F(2.83, 161.17) = 2.95, p = 0.037. We explored this interactionusing post-hoc t-tests (using a Bonferroni correction and family-wise alpha of p = 0.10) to investigate how infants with musicclasses compared to those without at each frequency level.While infants with music classes did not have larger SS-EPsat the beat frequency (p = 0.656), triple meter frequency (p= 0.183), or either of the unrelated frequencies (p = 0.082for 2Hz; p = 0.216 for 2.5Hz), infants with music classesdid have larger amplitudes at duple meter frequency (1.5Hz)than those without training, t(57) = 2.58, p = 0.012 (SeeFigure 2).
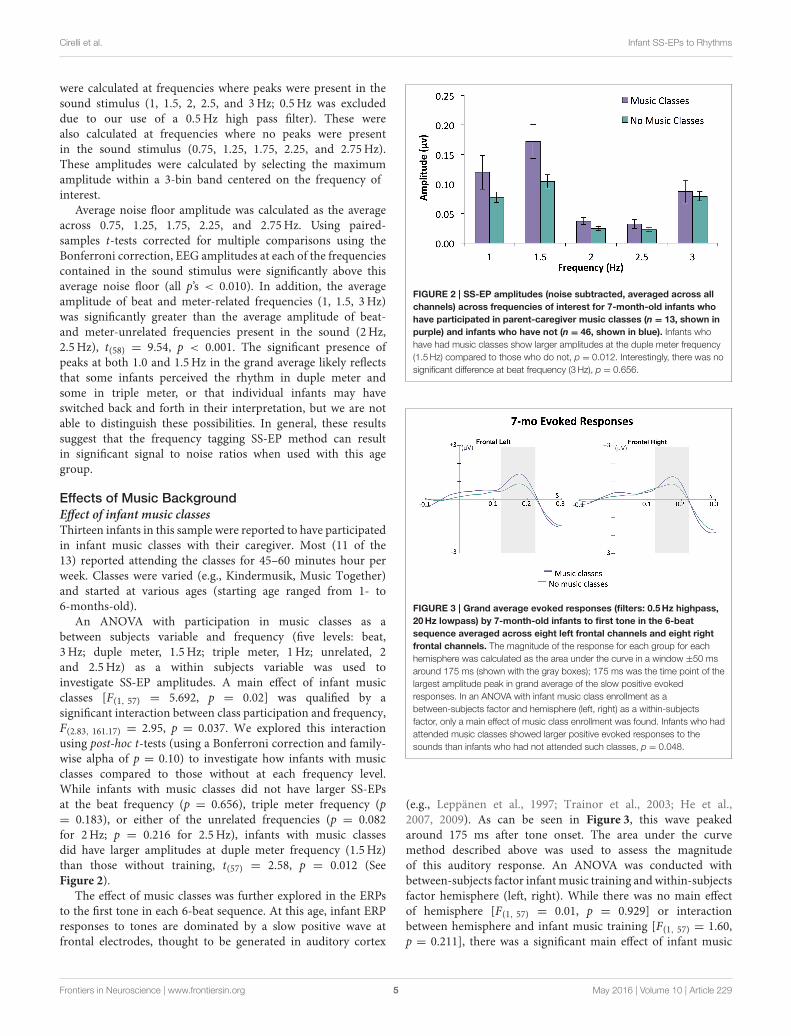
The effect of music classes was further explored in the ERPsto the first tone in each 6-beat sequence. At this age, infant ERPresponses to tones are dominated by a slow positive wave atfrontal electrodes, thought to be generated in auditory cortex
FIGURE 2 | SS-EP amplitudes (noise subtracted, averaged across all
channels) across frequencies of interest for 7-month-old infants who
have participated in parent-caregiver music classes (n = 13, shown in
purple) and infants who have not (n = 46, shown in blue). Infants who
have had music classes show larger amplitudes at the duple meter frequency
(1.5Hz) compared to those who do not, p = 0.012. Interestingly, there was no
significant difference at beat frequency (3Hz), p = 0.656.
FIGURE 3 | Grand average evoked responses (filters: 0.5Hz highpass,
20Hz lowpass) by 7-month-old infants to first tone in the 6-beat
sequence averaged across eight left frontal channels and eight right
frontal channels. The magnitude of the response for each group for each
hemisphere was calculated as the area under the curve in a window ±50 ms
around 175 ms (shown with the gray boxes); 175 ms was the time point of the
largest amplitude peak in grand average of the slow positive evoked
responses. In an ANOVA with infant music class enrollment as a
between-subjects factor and hemisphere (left, right) as a within-subjects
factor, only a main effect of music class enrollment was found. Infants who had
attended music classes showed larger positive evoked responses to the
sounds than infants who had not attended such classes, p = 0.048.
(e.g., Leppänen et al., 1997; Trainor et al., 2003; He et al.,2007, 2009). As can be seen in Figure 3, this wave peakedaround 175 ms after tone onset. The area under the curvemethod described above was used to assess the magnitudeof this auditory response. An ANOVA was conducted withbetween-subjects factor infantmusic training andwithin-subjectsfactor hemisphere (left, right). While there was no main effectof hemisphere [F(1, 57) = 0.01, p = 0.929] or interactionbetween hemisphere and infant music training [F(1, 57) = 1.60,p = 0.211], there was a significant main effect of infant music
Frontiers in Neuroscience | www.frontiersin.org 5 May 2016 | Volume 10 | Article 229

Cirelli et al. Infant SS-EPs to Rhythms
training, F(1, 57) = 4.09, p = 0.048. Infants who had beenenrolled in music classes had larger evoked responses to thesetones compared to those who had not been enrolled in suchclasses.
Effects of parent music trainingYears of parent music training were calculated as a combinationof mother- and father-reported levels. Infants were divided intotwo groups based on this information: infants with parentswho had ≥5 years of combined music training (n = 24),and infants with parents who had <5 years of music training(n= 35)
An ANOVA with parent music training groups as a betweensubjects variable and frequency (five levels: beat, 3Hz; duplemeter, 1.5Hz; triple meter, 1Hz; unrelated, 2 and 2.5Hz) as awithin subjects variable was used to investigate SS-EP amplitudes.There was no main effect of parent music classes [F(1, 57) =
1.523, p = 0.222] and no interaction between music classesand frequency [F(2.73, 155.56) = 0.41, p = 0.802]. There wasalso no correlation between reported years of parent musictraining and amplitudes at beat and meter frequencies (allp’s > 0.102).
Reported hours of infant music listeningParents were asked to report howmany hours a week their infantsheard music (either passive or active, but while awake). Thesereported rates did not correlate with amplitudes at beat andmeter frequencies (all p’s > 0.255). Interestingly, reported hoursof music listening also did not correlate with years of combinedparent music training, p = 0.579, and did not differ across infantmusic class groups, p= 0.968
EXPERIMENT 2
Materials and methodsParticipantsThirty-three infants between the ages of 14- and 16-months(17 males; M age = 15.45 mo, SD = 0.79 mo) participated inthis experiment. An additional 2 infants participated, but weretoo fussy to complete the experiment and were not includedin the analyses. The results reported here for Experiment 2 aresubsets of results from a larger study on the effect of infantmusic training. Here, we only report on the EEG portion ofthe experiment. These infants were recruited when they werebetween 9- and 10-months-old, and were randomly assignedto either a music training condition or a control condition.Infants in the music training condition (n = 14) received 20weeks (1 h a week) of caregiver-infant music classes, providedby the Royal Conservatory of Music in Hamilton, ON. Infantsin the control condition (n = 19) received this training afterall experimental testing procedures were complete, so they hadnot received music training at the time of testing. EEG datacollection took place within 2 weeks following the 20-weekmusic training period. These infants were recruited from theDevelopmental Studies Database at McMaster University. TheMcMaster Research Ethics Board approved all procedures andinformed consent was obtained from parents.
StimulusThe stimulus consisted of a rhythmic pattern lasting 3.996 s,made up of a rhythmic combination of 12 sounds and silentintervals (Figure 4B). This stimulus was based on the one usedby Nozaradan et al. (2012b, 2016). Each beat had an inter-onset-interval of 333 ms (180 beats per minute), which translated toa beat frequency of 3Hz. The tones were 990Hz pure toneslasting 333 ms with a 10 ms rise and fall time synthesized usingthe programAudacity 2.0.5 (www.audacity.sourceforge.net). One36-s long trial consisted of 9 repetitions of this stimulus. Thesetrials were repeated 14 times, with no pauses between trials, sothat the entire procedure lasted about 9min with no break. Thestimulus was presented at a comfortable intensity level [∼60 dBSPL over a noise floor of <30 dB(A)] using Eprime softwarethrough an AudioVideo Methods speaker (P73) located ∼1m infront of the infant.
The envelope spectrum of this sequence was analyzed usingthe same procedure as in Experiment 1, in order to comparestimulus and SS-EPs frequency spectra.
ProcedureThe procedure matched Experiment 1, except that a table wasplaced in front of the infant so that they understood that theycould not get down and play on the floor. It takes some effort toget infants of this age to sit still, so they were given toys to playwith on the table if necessary.
Data Acquisition and AnalysesData acquisition and analysis matched Experiment 1 in allrespects except in epoch length, due to the different stimuluslengths (14 trials of 35,000ms). The ERPs to the first tone ineach of the 12-beat sequences were also analyzed using the sameprocedure as in Experiment 1 (total trials= 146).
ResultsThe z-score cutoff method described in Experiment 1 wasemployed here, using the average SS-EP amplitude across allfrequencies tagged from the stimulus. No infants met the ±3z-score cutoff criteria, and so all were included in the followinganalyses.
SS-EP ResponsesSS-EPs averaged across all channels and scalp topographies arevisualized in Figures 4C,D. The expected beat frequency is at3Hz (as tones and rests in the rhythm pattern are 333 ms long).Based on previous work with this rhythm pattern (Nozaradanet al., 2012b, 2016), these beats are most naturally grouped in4’s, representing the quadruple meter at 0.75Hz. Grouping thesebeats in 2’s (1.5Hz) is also fairly common. To determine if thepeaks in the frequency-transformed EEG occur as expected abovethe noise floor, peaks of interest were first determined from theFFT of the sound stimulus (See Figure 4A). Amplitudes in thefrequency-transformed EEGwere calculated at frequencies wherepeaks were present in the sound stimulus (0.75, 1, 1.25, 1.5, 1.75,2, 2.25, 2.5, 2.75, and 3Hz; 0.5Hz was excluded due to our use ofa 0.5Hz high pass filter) and at frequencies between these, whereno peaks were present in the sound stimulus (0.625, 0.875, 1.125,
Frontiers in Neuroscience | www.frontiersin.org 6 May 2016 | Volume 10 | Article 229

Cirelli et al. Infant SS-EPs to Rhythms
FIGURE 4 | (A) The frequency spectrum of the stimulus sound envelope. (B) The rhythmic pattern, which consisted of 333 ms long tones and rests. Each tone
consisted of 990Hz pure tones with 10 ms rise and fall times. (C) Average SS-EPs with noise subtracted amplitudes averaged across all channels. Peaks can be
visualized at the quadruple meter frequency (0.75Hz) and beat frequency (3Hz). (D) Average topographical map of the SS-EPs elicited at the quadruple meter
frequency (0.75Hz) and beat frequency (3Hz), averaged across all participants.
1.375, 1.625, 1.875, 2.125, 2.375, 2.625, and 2.875Hz). Theseamplitudes were calculated by selecting the maximum amplitudewithin a 3-bin band centered on each frequency of interest.
Noise floor amplitude was calculated as the average acrossthe frequencies not present in the sound. Using paired-samplest-tests corrected for multiple comparisons with the Bonferronicorrection, EEG amplitudes at each of the frequencies containedin the sound stimulus were compared to this noise floor value.Amplitudes at 0.75Hz [t(32) = 6.54, p < 0.001] and 3Hz[t(32) = 4.49, p < 0.001] were significantly greater than thenoise floor value. Amplitudes at 1.5Hz were also significantlygreater than the noise floor [t(32) = 2.80, p = 0.009], butthis was not significant using the Bonferroni corrected alphavalue of p < 0.005 for each comparison. No other amplitudesat frequencies present in the stimulus were significantly largerthan the noise floor value. In addition, the average amplitudeof beat and meter-related frequencies (0.75, 1.5, 3Hz) wassignificantly greater than the average amplitude of beat- andmeter-unrelated frequencies present in the sound (1, 1.25, 1.75,2, 2.25, 2.75Hz), t(32) = 7.806, p < 0.001. Together, theseresults suggest that the frequency tagging SS-EP method canresult in good signal to noise ratios when used with this agegroup.
Effects of Music BackgroundEffects of infant music classesAn ANOVA with participation in music classes as a betweensubjects variable and frequency (only those that were abovethe noise floor, i.e., 0.75, 1.5, and 3Hz) as a within subjectsvariable was used to investigate SS-EP amplitudes. Surprisingly,there was no main effect of infant music classes [F(1, 31) = 0.09,p = 0.761] and no interaction between music classes and
frequency [F(1.48, 45.76) = 0.17, p = 0.778]. This suggests that the20 weeks of music training provided to the experimental groupmay not have influenced this measure.
Effects of parent music trainingYears of parent music training were calculated as a combinationof mother and father reported levels, as in Experiment 1. Infantswere divided into two groups based on this information: infantswith parents who had ≥5 years of music training (n = 16), andinfants with parents who had<5 years of music training (n= 17)
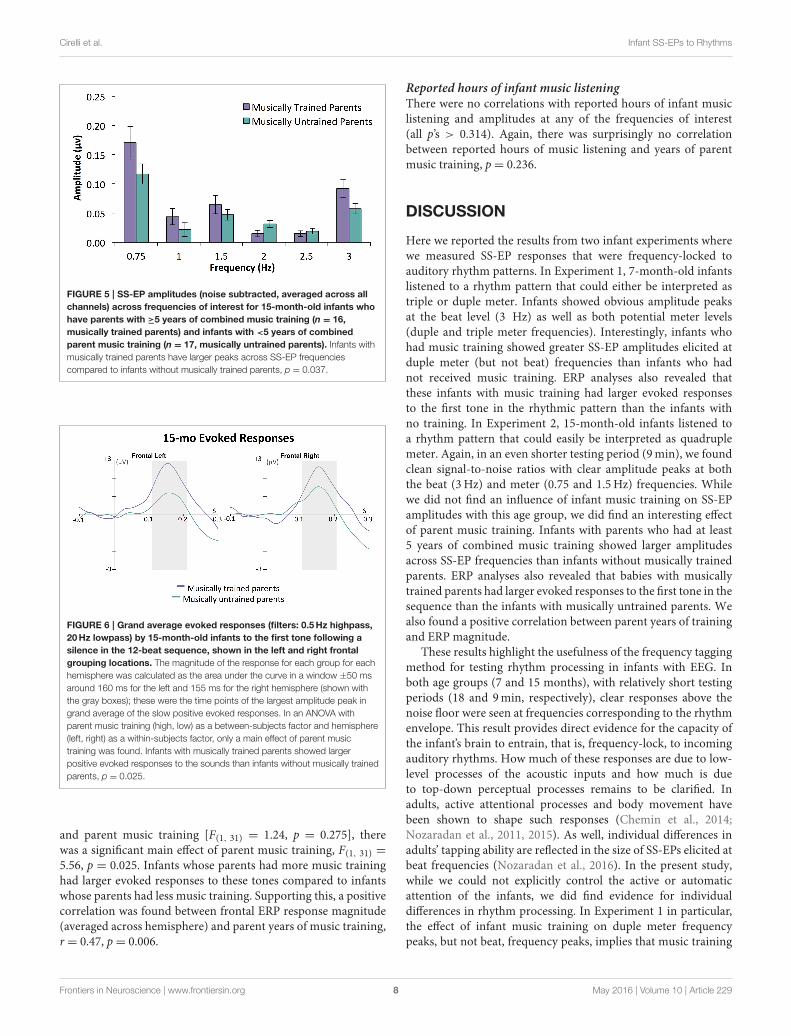
In an ANOVA with parent music training group as abetween subjects variable and frequency (only those that wereabove the noise floor, i.e., 0.75, 1.5, and 3Hz) as a withinsubjects variable, a significant main effects of parent musicgroup was found, F(1, 31) = 4.73, p = 0.037. There was alsoa main effect of frequency [F(1.46, 45.27) = 19.52, p < 0.001]driven by the fact that responses at 0.75Hz were larger thanresponses at 1.5 or 3Hz. Interestingly, there was no interactionbetween parentmusic training and frequency, F(1.46, 45.27) = 0.76,p = 0.473. These results suggest that infants with musicallytrained parents had larger average SS-EP amplitude overallcompared to infants with musically untrained parents (SeeFigure 5).
This effect was further explored in the ERPs. As can be seenin Figure 6, this wave peaked around 160 ms after tone onsetfor the left frontal, and 155 ms after tone onset for the rightfrontal location. The area under the curve method describedabove was used to assess the magnitude of this auditory response.An ANOVA was conducted with between-subjects factor parentmusic training (high, low) and within-subjects factor hemisphere(left, right). While there was no main effect of hemisphere[F(1, 31) = 0.01, p = 0.938] or interaction between hemisphere
Frontiers in Neuroscience | www.frontiersin.org 7 May 2016 | Volume 10 | Article 229
Cirelli et al. Infant SS-EPs to Rhythms
FIGURE 5 | SS-EP amplitudes (noise subtracted, averaged across all
channels) across frequencies of interest for 15-month-old infants who
have parents with ≥5 years of combined music training (n = 16,
musically trained parents) and infants with <5 years of combined
parent music training (n = 17, musically untrained parents). Infants with
musically trained parents have larger peaks across SS-EP frequencies
compared to infants without musically trained parents, p = 0.037.
FIGURE 6 | Grand average evoked responses (filters: 0.5Hz highpass,
20Hz lowpass) by 15-month-old infants to the first tone following a
silence in the 12-beat sequence, shown in the left and right frontal
grouping locations. The magnitude of the response for each group for each
hemisphere was calculated as the area under the curve in a window ±50 ms
around 160 ms for the left and 155 ms for the right hemisphere (shown with
the gray boxes); these were the time points of the largest amplitude peak in
grand average of the slow positive evoked responses. In an ANOVA with
parent music training (high, low) as a between-subjects factor and hemisphere
(left, right) as a within-subjects factor, only a main effect of parent music
training was found. Infants with musically trained parents showed larger
positive evoked responses to the sounds than infants without musically trained
parents, p = 0.025.
and parent music training [F(1, 31) = 1.24, p = 0.275], therewas a significant main effect of parent music training, F(1, 31) =5.56, p = 0.025. Infants whose parents had more music traininghad larger evoked responses to these tones compared to infantswhose parents had less music training. Supporting this, a positivecorrelation was found between frontal ERP response magnitude(averaged across hemisphere) and parent years of music training,r = 0.47, p= 0.006.
Reported hours of infant music listeningThere were no correlations with reported hours of infant musiclistening and amplitudes at any of the frequencies of interest(all p’s > 0.314). Again, there was surprisingly no correlationbetween reported hours of music listening and years of parentmusic training, p= 0.236.
DISCUSSION
Here we reported the results from two infant experiments wherewe measured SS-EP responses that were frequency-locked toauditory rhythm patterns. In Experiment 1, 7-month-old infantslistened to a rhythm pattern that could either be interpreted astriple or duple meter. Infants showed obvious amplitude peaksat the beat level (3 Hz) as well as both potential meter levels(duple and triple meter frequencies). Interestingly, infants whohad music training showed greater SS-EP amplitudes elicited atduple meter (but not beat) frequencies than infants who hadnot received music training. ERP analyses also revealed thatthese infants with music training had larger evoked responsesto the first tone in the rhythmic pattern than the infants withno training. In Experiment 2, 15-month-old infants listened toa rhythm pattern that could easily be interpreted as quadruplemeter. Again, in an even shorter testing period (9min), we foundclean signal-to-noise ratios with clear amplitude peaks at boththe beat (3Hz) and meter (0.75 and 1.5Hz) frequencies. Whilewe did not find an influence of infant music training on SS-EPamplitudes with this age group, we did find an interesting effectof parent music training. Infants with parents who had at least5 years of combined music training showed larger amplitudesacross SS-EP frequencies than infants without musically trainedparents. ERP analyses also revealed that babies with musicallytrained parents had larger evoked responses to the first tone in thesequence than the infants with musically untrained parents. Wealso found a positive correlation between parent years of trainingand ERP magnitude.
These results highlight the usefulness of the frequency taggingmethod for testing rhythm processing in infants with EEG. Inboth age groups (7 and 15 months), with relatively short testingperiods (18 and 9min, respectively), clear responses above thenoise floor were seen at frequencies corresponding to the rhythmenvelope. This result provides direct evidence for the capacity ofthe infant’s brain to entrain, that is, frequency-lock, to incomingauditory rhythms. How much of these responses are due to low-level processes of the acoustic inputs and how much is dueto top-down perceptual processes remains to be clarified. Inadults, active attentional processes and body movement havebeen shown to shape such responses (Chemin et al., 2014;Nozaradan et al., 2011, 2015). As well, individual differences inadults’ tapping ability are reflected in the size of SS-EPs elicited atbeat frequencies (Nozaradan et al., 2016). In the present study,while we could not explicitly control the active or automaticattention of the infants, we did find evidence for individualdifferences in rhythm processing. In Experiment 1 in particular,the effect of infant music training on duple meter frequencypeaks, but not beat, frequency peaks, implies that music training
Frontiers in Neuroscience | www.frontiersin.org 8 May 2016 | Volume 10 | Article 229

Cirelli et al. Infant SS-EPs to Rhythms
may not only selectively amplify specific frequencies, but mayalso enhance metrical processing. This supports the idea that theSS-EPs we measured are not simply stimulus driven, and may beinfluenced by higher-level processing. Overall, these experimentssuggest that the frequency-tagging method is apt to investigatethe mechanisms through which the neural encoding of rhythmsis shaped during early development.
Importantly, the frequency-tagging approach appearspromising for observing the developmental trajectory of neuralentrainment across infancy. The robust signal-to-noise ratiosobtained in 7- and 15-month-olds bode well for observing effectsas young as the newborn period. Little is known about rhythmprocessing in very young infants, and the frequency taggingapproach offers a potential way to study this. Furthermore, itcould be used in conjunction with future experimental designs inwhich infant musical experience is controlled through randomassignment to different types of training. The effects of infantmusic training in Experiment 1 (where assignment to trainingwas not controlled) and lack of effects of infant music trainingin Experiment 2 (where all parents enrolled their infants inmusic classes, but the classes were delayed in the control groupso that those infants were untrained at the time of testing)suggest that either (1) training must occur early, before musicalenculturation, for clear rhythm processing differences to bemeasured or (2) parents who choose to enroll their children ininfant music classes may be different in some related variablefrom parents who do not.
The individual differences observed in the current studyprovide new insights on how infant and parent musicbackground might shape music listening experiences. Withtwo age groups and two different rhythm patterns, we foundtwo different relations between music background and neuralresponses to rhythms. With the younger but not older infants,infant music training was related to enhanced duple meterprocessing. With older but not younger infants, parent musictraining was related to a non-specific enhancement across beatand meter frequencies. It is difficult to compare the results acrossthese two experiments given the methodological differences.Here we present possible ideas for why we may have founddifferences in experiential effects between these age groups, butall such interpretations must be treated with caution. It couldbe that direct musical exposure in the form of infant musicclasses is more likely to shape meter processing in youngerinfants, since they have not yet become fully encultured to themetrical structures of the music in their environment, whichoccurs between 6 and 12 months (Hannon and Trehub, 2005a,b).It could also be the case that parents with higher levels ofmusic training, through an interplay of genes and environment,encourage their infants to attend to temporal information inmusic more than parents with less music training. Furtherresearch is needed to directly assess these possibilities. Otherdifferences in parent-infant lifestyles across these groups (SES,parent involvement in infant’s daily life) would also need to bemeasured and controlled.
It was surprising that a correlation between reported parentyears of training and infant music listening was not found inExperiments 1 or 2. Previous work has shown that parents with
more music training typically engage in more musical activitieswith their babies. More specifically, parental musical experiencewas associated with the habit of listening to music with baby(Ilari, 2005), and with the frequency of playing music to andsinging to baby (Custodero and Johnson-Green, 2003). It ispossible that our simple question “How many hours per weekdoes your infant hear music” (which covers both active andpassive listening, with and without the parent) was not specificenough to capture potential differences in levels of musicalengagement between parent and infant. Therefore, it is possiblethat our measure of parent music training is a better proxy forinfant exposure to music in engaged settings than the question inour questionnaire.
One limitation of this study is that parents did not wear noise-canceling headphones. It is possible that some mothers (despitebeing blind as to our hypotheses and despite our clear instructionto avoid movement) may have subtly moved their bodies (andtherefore their baby) to the rhythms heard over the loudspeaker,which may have influenced EEG recordings. The experimenterin the room tasked with infant distraction was trained to watchfor such movements and, should they occur, to communicate tothe parent that they must stop. All parents complied with thisinstruction. We also had a second experimenter watching theparent and infant from outside the sound attenuated chambervia a live webcam feed, to ensure that instructions were beingfollowed.
Overall, the results of these experiments provide new insightson how the processing of beat and meter may develop fromthe interplay between genes and environment. Specifically, wepresent evidence that the frequency-tagging approach is apt tomeasure infants’ neural entrainment to rhythmic patterns. Wealso present evidence that the neural responses entrained to beatandmeter frequencies can be influenced by individual differencesin infant and parent music backgrounds. These findings raiseinteresting questions about how musical experiences acrossthe lifespan, especially in the early months of infancy, shapeauditory processing in general and temporal processing inparticular.
AUTHOR CONTRIBUTIONS
LC was the primary researcher and LT the senior researcher butall authors contributed to the ideas, analyses, and writing of themanuscript. LC and CS tested participants.
ACKNOWLEDGMENTS
This research was funded by a grant from the Canadian Institutesof Health Research (MOP 42554) to LT, and by a postgraduatescholarship from the Social Sciences and Humanities ResearchCouncil to LC. We also thank the Royal Conservatory ofMusic in Toronto, Ontario for supporting this research andproviding the caregiver/infant classes received by participants inExperiment 2. Thanks also to Elaine Whiskin, Christine Ung,Madeleine McKitrick, Ammaarah Baksh, and Sonia Gandhi fortheir assistance in data collection and pre-processing. We alsothank Dave Thompson for technical support.
Frontiers in Neuroscience | www.frontiersin.org 9 May 2016 | Volume 10 | Article 229

Cirelli et al. Infant SS-EPs to Rhythms
REFERENCES
Baruch, C., and Drake, C. (1997). Tempo discrimination in infants. Infant Behav.Dev. 20, 573–577. doi: 10.1016/S0163-6383(97)90049-7
Brochard, R., Abecasis, D., Potter, D., Ragot, R., and Drake, C. (2003). The“ticktock” of our internal clock direct brain evidence of subjective accentsin isochronous sequences. Psychol. Sci. 14, 362–366. doi: 10.1111/1467-9280.24441
Butler, B. E., and Trainor, L. J. (2015). The musician redefined: a behavioralassessment of rhythm perception in professional club DJs. Tim. Time Percept.3, 116–132. doi: 10.1163/22134468-03002041
Celma-Miralles, A., de Menezes, R. F., and Toro, J. M. (2016). Look at the beat,feel the meter: top-down effects of meter induction on auditory and visualmodalities. Front. Hum. Neurosci. 10:108. doi: 10.3389/fnhum.2016.00108
Chang, H. W., and Trehub, S. E. (1977). Infants’ perception of temporal groupingin auditory patterns. Child Dev. 48, 1666–1670. doi: 10.2307/1128532
Chemin, B., Mouraux, A., and Nozaradan, S. (2014). Body movement selectivelyshapes the neural representation of musical rhythms. Psychol. Sci. 25,2147–2159. doi: 10.1177/0956797614551161
Cirelli, L. K., Einarson, K. M., and Trainor, L. J. (2014a). Interpersonalsynchrony increases prosocial behavior in infants. Dev. Sci. 17, 1003–1011. doi:10.1111/desc.12193
Cirelli, L. K., Wan, S. J., and Trainor, L. J. (2014b). Fourteen-month-oldinfants use interpersonal synchrony as a cue to direct helpfulness. Philos.Trans. R. Soc. Lond. B Biol. Sci. 369, 20130400. doi: 10.1098/rstb.2013.0400
Cirelli, L. K., Wan, S. J., and Trainor, L. J. (2016). Social effects ofmovement synchrony: increased infant helpfulness only transfers to affiliates ofsynchronously moving partners. Infancy. doi: 10.1111/infa.12140. [Epub aheadof print].
Custodero, L. A., and Johnson-Green, E. A. (2003). Passing the cultural torch:musical experience and musical parenting of infants. J. Res. Music Educ. 51,102–114. doi: 10.2307/3345844
de l’Etoile, S. K. (2006). Infant behavioral responses to infant-directed singingand other maternal interactions. Infant Behav. Dev. 29, 456–470. doi:10.1016/j.infbeh.2006.03.002
Demany, L., McKenzie, B., and Vurpillor, E. (1977). Rhythm perception in earlyinfancy. Nature 266, 261–276. doi: 10.1038/266718a0
Drake, C., Penel, A., and Bigand, E. (2000). Tapping in time with mechanicallyand expressively performed music. Music Percept. 18, 1–23. doi: 10.2307/40285899
Fujioka, T., Mourad, N., He, C., and Trainor, L. J. (2011). Comparisonof artifact correction methods for infant EEG applied to extractionof event-related potential signals. Clin. Neurophysiol. 122, 43–51. doi:10.1016/j.clinph.2010.04.036
Gerry, D., Unrau, A., and Trainor, L. J. (2012). Active music classes in infancyenhance musical, communicative and social development. Dev. Sci. 15,398–407. doi: 10.1111/j.1467-7687.2012.01142.x
Hannon, E. E., and Johnson, S. P. (2005). Infants use meter to categorize rhythmsand melodies: implications for musical structure learning. Cognit. Psychol. 50,354–377. doi: 10.1016/j.cogpsych.2004.09.003
Hannon, E. E., and Trehub, S. E. (2005a). Metrical categories in infancy andadulthood. Psychol. Sci. 16, 48–55. doi: 10.1111/j.0956-7976.2005.00779.x
Hannon, E. E., and Trehub, S. E. (2005b). Tuning in to musical rhythms: infantslearn more readily than adults. Proc. Natl. Acad. Sci. U.S.A. 102, 12639–12643.doi: 10.1073/pnas.0504254102
He, C., Hotson, L., and Trainor, L. J. (2007). Mismatch responses to pitch changesin early infancy. J. Cogn. Neurosci. 19, 878–892. doi: 10.1162/jocn.2007.19.5.878
He, C., Hotson, L., and Trainor, L. J. (2009). Maturation of corticalmismatch responses to occasional pitch change in early infancy: effects ofpresentation rate and magnitude of change.Neuropsychologia 47, 218–229. doi:10.1016/j.neuropsychologia.2008.07.019
Ilari, B. (2005). On musical parenting of young children: musical beliefs andbehaviors of mothers and infants. Early Child Dev. Care 175, 647–660. doi:10.1080/0300443042000302573
Large, E. W., and Jones, M. R. (1999). The dynamics of attending: how peopletrack time-varying events. Psychol. Rev. 106, 119–159. doi: 10.1037/0033-295X.106.1.119
Leppänen, P. H., Eklund, K. M., and Lyytinen, H. (1997). Event-related brainpotentials to change in rapidly presented acoustic stimuli in newborns. Dev.Neuropsychol. 13, 175–204. doi: 10.1080/87565649709540677
Manning, F., and Schutz, M. (2013). “Moving to the beat” improves timingperception. Psychon. Bull. Rev. 20, 1133–1139. doi: 10.3758/s13423-013-0439-7
Mourad, N., Reilly, J. P., de Bruin, H., Hasey, G., and MacCrimmon, D. (2007).A simple and fast algorithm for automatic suppression of high-amplitudeartifacts in EEG data. Acoust. Speech Signal Process. 1, 1393–1396. doi:10.1109/icassp.2007.366699
Mouraux, A., Diukova, A., Lee, M. C., Wise, R. G., and Iannetti, G. D.(2011). A multisensory investigation of the functional significance of the“pain matrix”. Neuroimage 54, 2237–2249. doi: 10.1016/j.neuroimage.2010.09.084
Mouraux, A., and Iannetti, G. D. (2008). Across-trial averaging of event-relatedEEG responses and beyond. Magn. Reson. Imaging 26, 1041–1054. doi:10.1016/j.mri.2008.01.011
Nazzi, T., Bertoncini, J., and Mehler, J. (1998). Language discriminationby newborns: toward an understanding of the role of rhythm. J.Exp. Psychol. Hum. Percept. Perform. 24:756. doi: 10.1037/0096-1523.24.3.756
Nozaradan, S. (2014). Exploring how musical rhythm entrains brain activity withelectroencephalogram frequency-tagging. Philos.Trans. R. Soc. Lond. B Biol. Sci.369:20130393. doi: 10.1098/rstb.2013.0393
Nozaradan, S., Peretz, I., and Keller, P. E. (2016). Individual differencesin rhythmic cortical entrainment correlate with predictive behaviorin sensorimotor synchronization. Sci. Rep. 6:20612. doi: 10.1038/srep20612
Nozaradan, S., Peretz, I., Missal, M., and Mouraux, A. (2011). Tagging theneuronal entrainment to beat and meter. J. Neurosci. 31, 10234–10240. doi:10.1523/JNEUROSCI.0411-11.2011
Nozaradan, S., Peretz, I., andMouraux, A. (2012a). Selective neuronal entrainmentto the beat and meter embedded in a musical rhythm. J. Neurosci. 32,17572–17581. doi: 10.1523/JNEUROSCI.3203-12.2012
Nozaradan, S., Peretz, I., and Mouraux, A. (2012b). Steady-state evoked potentialsas an index of multisensory temporal binding. Neuroimage 60, 21–28. doi:10.1016/j.neuroimage.2011.11.065
Nozaradan, S., Zerouali, Y., Peretz, I., and Mouraux, A. (2015).Capturing with EEG the neural entrainment and coupling underlyingsensorimotor synchronization to the beat. Cereb. Cortex, 25, 736–747.doi: 10.1093/cercor/bht261
Phillips-Silver, J., and Trainor, L. J. (2005). Feeling the beat: movementinfluences infant rhythm perception. Science 308, 1430–1430. doi:10.1126/science.1110922
Phillips-Silver, J., and Trainor, L. J. (2007). Hearing what the body feels:auditory encoding of rhythmic movement. Cognition 105, 533–546. doi:10.1016/j.cognition.2006.11.006
Phillips-Silver, J., and Trainor, L. J. (2008). Vestibular influenceon auditory metrical interpretation. Brain Cogn. 67, 94–102.doi: 10.1016/j.bandc.2007.11.007
Regan, D. (1989). Human Brain Electrophysiology: Evoked Potentials and EvokedMagnetic Fields in Science and Medicine. Amsterdam: Elsevier.
Repp, B. H., and Su, Y. H. (2013). Sensorimotor synchronization: a review of recentresearch (2006–2012). Psychon. Bull. Rev. 20, 403–452. doi: 10.3758/s13423-012-0371-2
Schaefer, R. S., Vlek, R. J., and Desain, P. (2011). Decomposing rhythmprocessing: electroencephalography of perceived and self-imposedrhythmic patterns. Psychol. Res. 75, 95–106. doi: 10.1007/s00426-010-0293-4
Trainor, L. J. (1996). Effects of harmonics on relative pitch discriminationin a musical context. Percept. Psychophys. 58, 704–712. doi: 10.3758/BF03213102
Trainor, L. J. (2012). Musical experience, plasticity, and maturation: issues inmeasuring developmental change using EEG and MEG. Ann. N.Y. Acad. Sci.1252, 25–36. doi: 10.1111/j.1749-6632.2012.06444.x
Trainor, L. J., Marie, C., Gerry, D., Whiskin, E., and Unrau, A. (2012).Becoming musically enculturated: effects of music classes for infants onbrain and behavior. Ann. N.Y. Acad. Sci. 1252, 129–138. doi: 10.1111/j.1749-6632.2012.06462.x
Frontiers in Neuroscience | www.frontiersin.org 10 May 2016 | Volume 10 | Article 229

Cirelli et al. Infant SS-EPs to Rhythms
Trainor, L., McFadden, M., Hodgson, L., Darragh, L., Barlow, J., Matsos, L.,et al. (2003). Changes in auditory cortex and the development of mismatchnegativity between 2 and 6 months of age. Int. J. Psychophysiol. 51, 5–15. doi:10.1016/S0167-8760(03)00148-X
Trehub, S. E., and Gudmundsdottir, H. R. (2015). “Mothers as singing mentors forinfants,” in The Oxford Handbook of Singing, eds G. Welch, D. M. Howard, andJ. Nix (Oxford: Oxford University Press).
Trehub, S. E., and Schellenberg, E. G. (1995). Music: its relevance to infants. Ann.Child Dev. 11, 1–24.
Tunçgenç, B., Cohen, E., and Fawcett, C. (2015). Rock with me: the role ofmovement synchrony in infants’ social and nonsocial choices. Child Dev. 86,976–984. doi: 10.1111/cdev.12354
Winkler, I., Háden, G. P., Ladinig, O., Sziller, I., and Honing,H. (2009). Newborn infants detect the beat in music. Proc.
Natl. Acad. Sci. U.S.A. 106, 2468–2471. doi: 10.1073/pnas.0809035106
Conflict of Interest Statement: The authors declare that the research wasconducted in the absence of any commercial or financial relationships that couldbe construed as a potential conflict of interest.
Copyright © 2016 Cirelli, Spinelli, Nozaradan and Trainor. This is an open-accessarticle distributed under the terms of the Creative Commons Attribution License(CC BY). The use, distribution or reproduction in other forums is permitted,provided the original author(s) or licensor are credited and that the originalpublication in this journal is cited, in accordance with accepted academic practice.No use, distribution or reproduction is permitted which does not comply with theseterms.
Frontiers in Neuroscience | www.frontiersin.org 11 May 2016 | Volume 10 | Article 229