measuring performance of electric power distribution ... · measuring performance of electric power...
TRANSCRIPT

Measuring Performance Of Electric Power Distribution
Systems – IEEE Std. 1366-2003Presented at the NARUC
Staff Subcommittee on Electric Reliability
in Washington, DC
February 13, 2005by Cheryl A. Warren ([email protected])
Chair, IEEE WG on System Design

2
Topics for TodayWhat changed between 2001 and 2003?
Why use 1366-2003 - Guide for Electric Power Distribution Reliability Indices
The Major Event Day Definition
Summary
Potential Impact on Regulation
Benchmarking
3
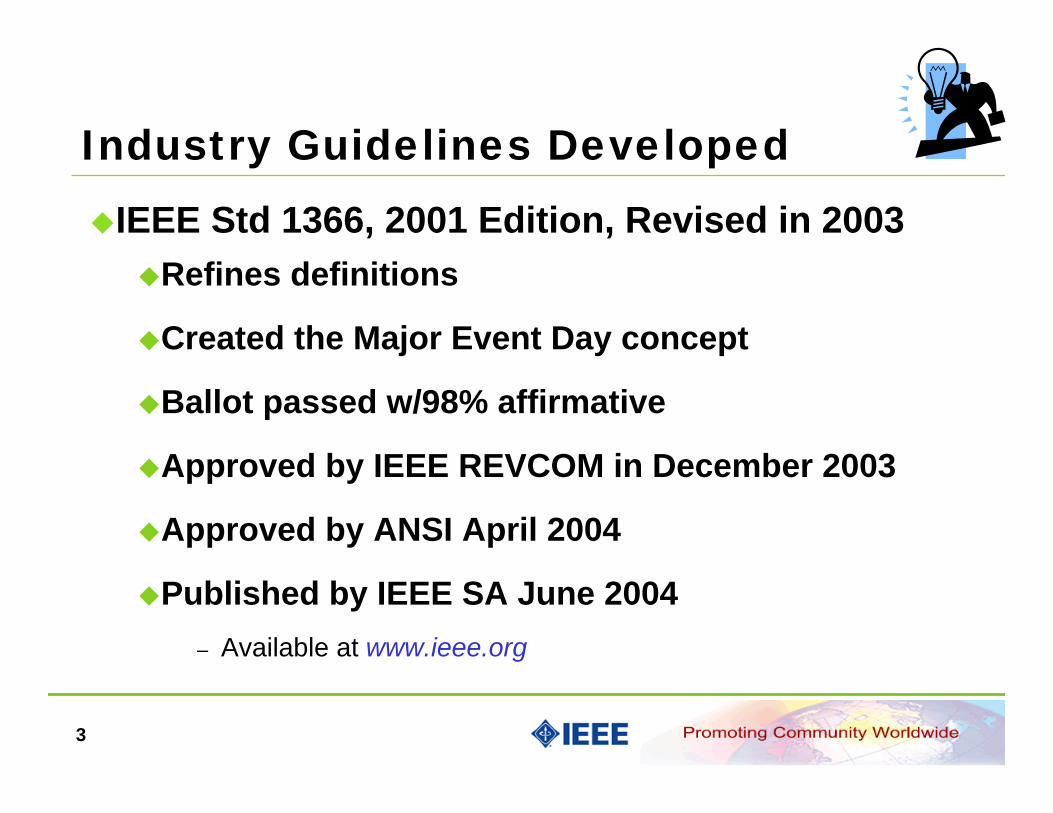
Industry Guidelines DevelopedIEEE Std 1366, 2001 Edition, Revised in 2003
Refines definitions
Created the Major Event Day concept
Ballot passed w/98% affirmative
Approved by IEEE REVCOM in December 2003
Approved by ANSI April 2004
Published by IEEE SA June 2004– Available at www.ieee.org

4
Major changes between 2001 & 2003Tightened definitions.Created the Major Event Day Concept.A tool that can assist company decisions and regulatory policy making by standardizing engineering metrics and approaches.
Standard definitions are offered that will lead to better comparability.
– Still need to address data collection methods.
Policy decisions are left to the regulatory community.
All Events are reviewed including Major Events.

5
Why Use 1366-2003Sound Basis for Measuring Performance.
A clearer view of performance, both on aDaily basis and
During Major Events
Can form a solid basis for review of operational effectiveness, decision making and policy making.
More consistent benchmarking.

6
WA
OR
CA
ID
NV
MT
AZ NM
TX
OK
UT CO
WY
ND
SD
NE
KS
MN
IA
MO
AR
LA
WI
IL
MI
IN OH
KYTN
MS
FL
AL GASC
NCVA
WV
PANY
MENH
MA,CT,RI
MD,DE,NJ
AlaskaHawaii
Reliability Standards in place Reliability Standards being considered
VT
States are Moving Toward Reliability Regulation
Considering Adoption of MED
BC
*source NRRI 2001 survey & other regulatory documents
Adopted MED
7
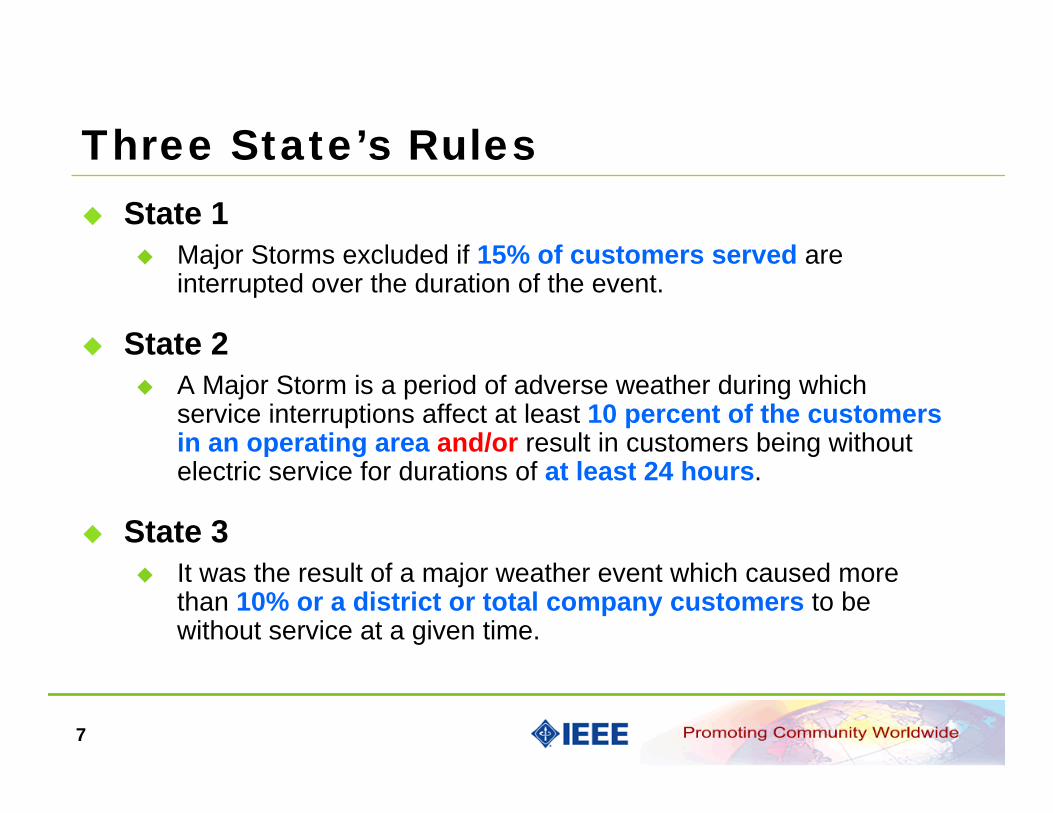
Three State’s RulesState 1
Major Storms excluded if 15% of customers served are interrupted over the duration of the event.
State 2A Major Storm is a period of adverse weather during which service interruptions affect at least 10 percent of the customers in an operating area and/or result in customers being without electric service for durations of at least 24 hours.
State 3It was the result of a major weather event which caused more than 10% or a district or total company customers to be without service at a given time.

8
Different Measurement Methods - Same Company
0
25
50
75
100
125
150
175
200
225
1997 1998 1999 2000 2001 2002 2003Year
SAID
I (m
in) Method 1
Method 2
Method 3
SAIDI Performance

9
Methodology DevelopmentIEEE WG on System Design, that has over 130
members, developed the “2.5 Beta methodology” in IEEE Std 1366 - 2003.
Members include utility employees, regulatory staff, employees from manufacturers, consultants and academics.
Seven members stepped up to perform the analysis.

10
Foundations of the ProcessDefinition must be understandable by all and easy to apply.
Definition must be specific and calculated using the same process for all utilities.
Must be fair to all utilities.Large and small, urban and rural….
SAIDI was chosen as the indicator…because it is size independent and
it is the best indicator of system stresses beyond those that utility’s staff, build, design and operate to minimize.
11
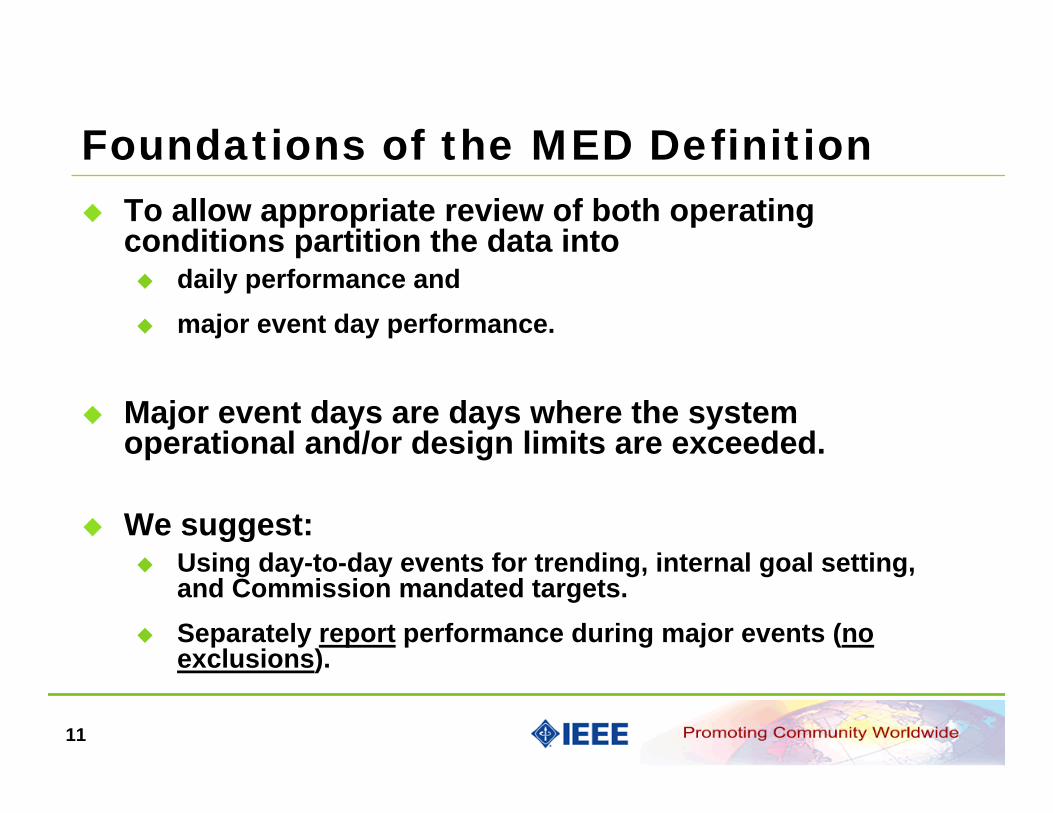
Foundations of the MED DefinitionTo allow appropriate review of both operating conditions partition the data into
daily performance and major event day performance.
Major event days are days where the system operational and/or design limits are exceeded.
We suggest: Using day-to-day events for trending, internal goal setting, and Commission mandated targets.Separately report performance during major events (no exclusions).
12
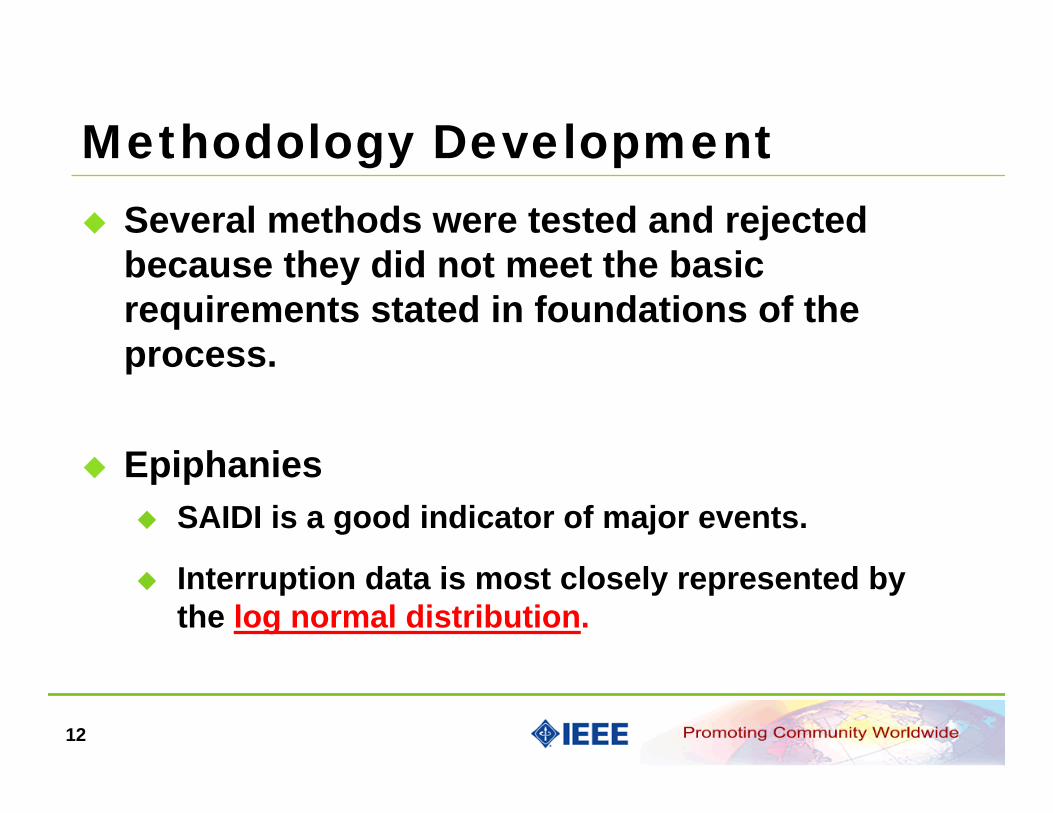
Methodology DevelopmentSeveral methods were tested and rejected because they did not meet the basic requirements stated in foundations of the process.
EpiphaniesSAIDI is a good indicator of major events.
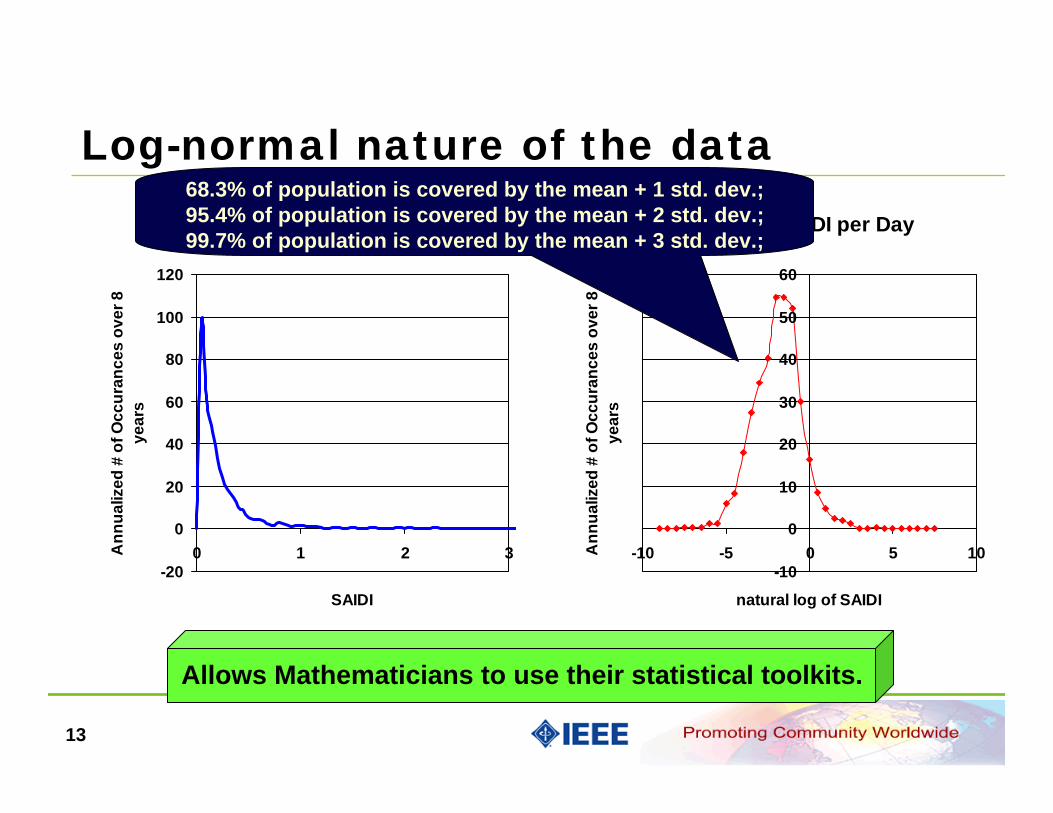
Interruption data is most closely represented by the log normal distribution.
13
Log-normal nature of the dataSAIDI per Day Histogram
-20
0
20
40
60
80
100
120
0 1 2 3
SAIDI
Ann
ualiz
ed #
of O
ccur
ance
s ov
er 8
ye
ars
Log-normal SAIDI per Day
-10
0
10
20
30
40
50
60
-10 -5 0 5 10
natural log of SAIDIA
nnua
lized
# o
f Occ
uran
ces
over
8
year
s
Allows Mathematicians to use their statistical toolkits.
68.3% of population is covered by the mean + 1 std. dev.;95.4% of population is covered by the mean + 2 std. dev.; 99.7% of population is covered by the mean + 3 std. dev.;
14
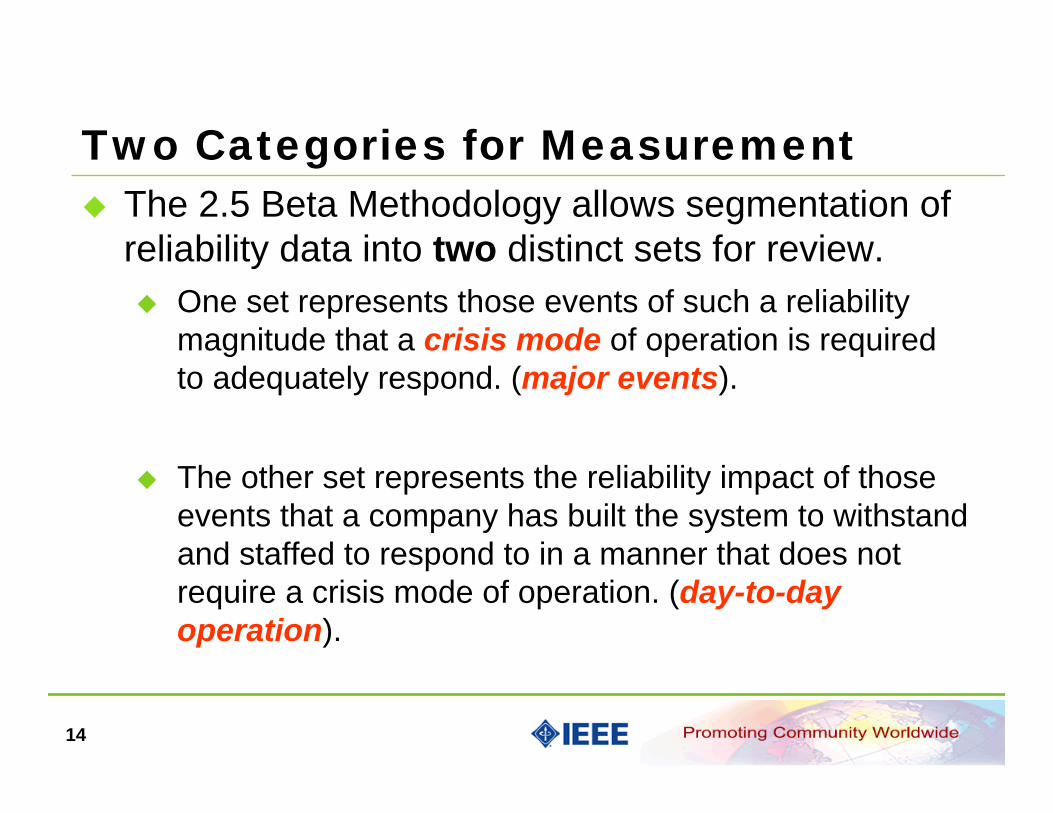
Two Categories for MeasurementThe 2.5 Beta Methodology allows segmentation of reliability data into two distinct sets for review.
One set represents those events of such a reliability magnitude that a crisis mode of operation is required to adequately respond. (major events).
The other set represents the reliability impact of those events that a company has built the system to withstand and staffed to respond to in a manner that does not require a crisis mode of operation. (day-to-day operation).
15
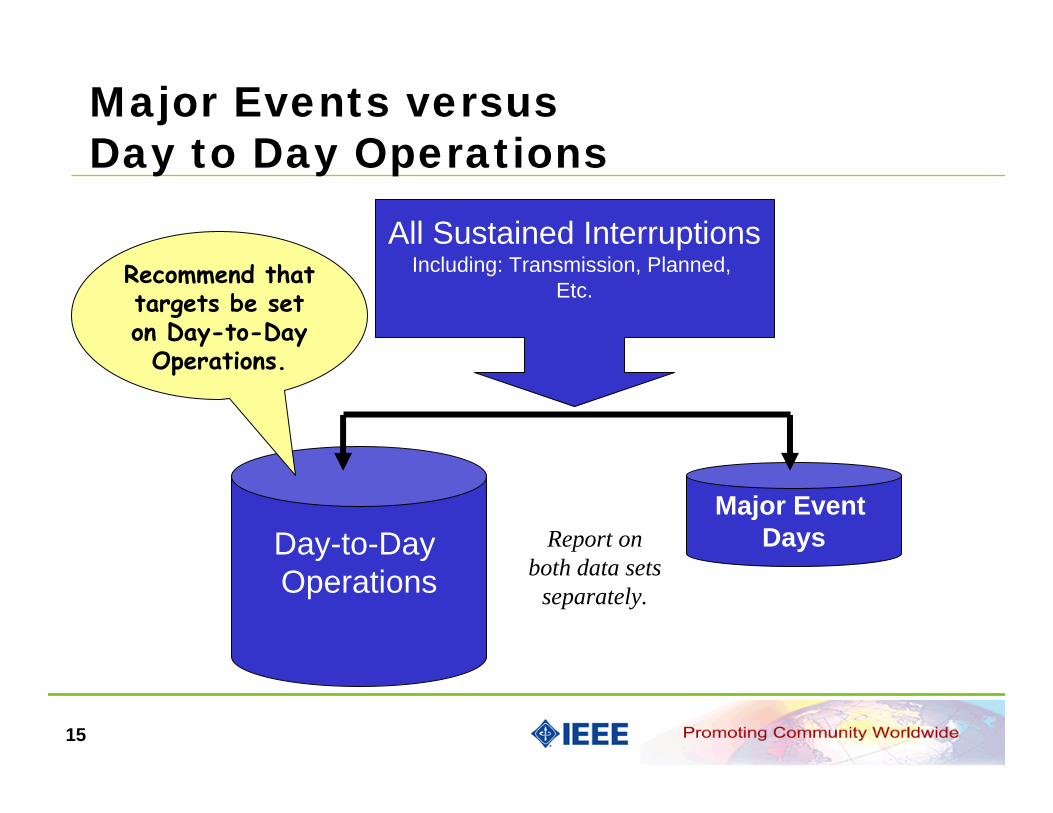
Major Events versus Day to Day Operations
All Sustained InterruptionsIncluding: Transmission, Planned,
Etc.
Day-to-Day Operations
Major Event DaysReport on
both data setsseparately.
Recommend that targets be set on Day-to-Day Operations.

16
Results from One Company
64.66
102.64
167.3
020406080
100120140160180
SAID
I (M
inut
es
Major Event Days Day to Day All
SAIDI
May 3July 9July 23Sept. 11Nov 17-18Dec 25
358 Days
365 Days

17
Seven Simple Steps1. Collect values of daily SAIDI for five sequential years ending on the last day of the last complete
reporting period. If fewer than five years of historical data are available, use all available historical data
2. If any day in the data set has a value of zero for SAIDI, do not include that day in the analysis.
3. Take the natural logarithm (ln) of each daily SAIDI value in the data set.
4. Find α (Alpha), the average of the logarithms (also known as the log-average) of the data set.
5. Find β (Beta), the standard deviation of the logarithms (also known as the log-standard deviation) of the data set.
6. Compute the major event day threshold, TMED, using the equation:
( )βα 5.2+= eTMED
7. Any day with daily SAIDI greater than the threshold value TMED that occurs during the subsequent reporting period is classified as a major event day.
Can be calculated in Excel or an OMS program

18
Major Event Days – A few factsA day in which the daily system SAIDI exceeds a threshold value, TMED that is determined by using the 2.5 beta method.
For example, if TMED = 3 minutes, than any day where more than 3 minutes of SAIDI is accrued is declared a major event day
Activities that occur on major event days should be separately analyzed and reported. Nothing is “Excluded”!!
19
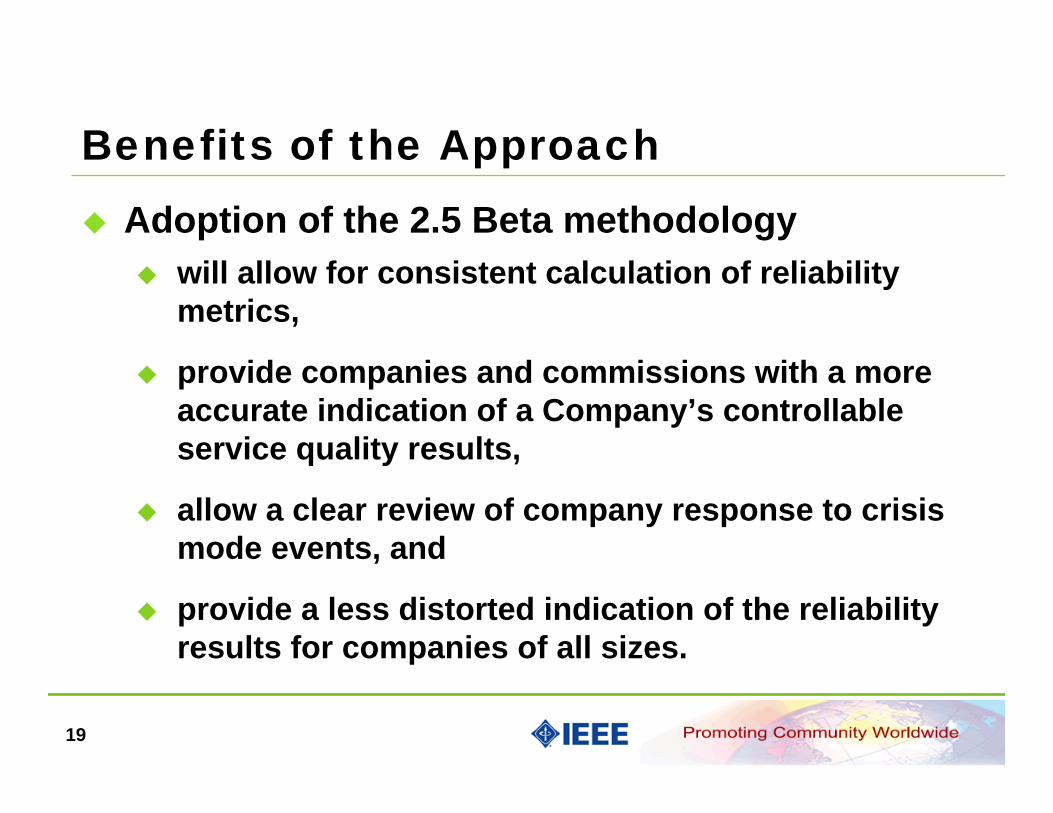
Benefits of the ApproachAdoption of the 2.5 Beta methodology
will allow for consistent calculation of reliability metrics,
provide companies and commissions with a more accurate indication of a Company’s controllable service quality results,
allow a clear review of company response to crisis mode events, and
provide a less distorted indication of the reliability results for companies of all sizes.

20
Summary of IEEE 2.5 Beta MethodologyImproves the ability to view system reliability performance, thereby making goal setting and trending more meaningful.
Provides a mechanism for reporting on both day-to-day performance and performance during major events. A mechanism that:
allows for review of day-to-day performance without considering the outliers that often mask it.
AND, meaningfully focuses on major event performance in its own right to give a clear view of this very different operating condition.
Consistent method that can be applied by all.

Beyond the Standard…PBR and Benchmarking
22
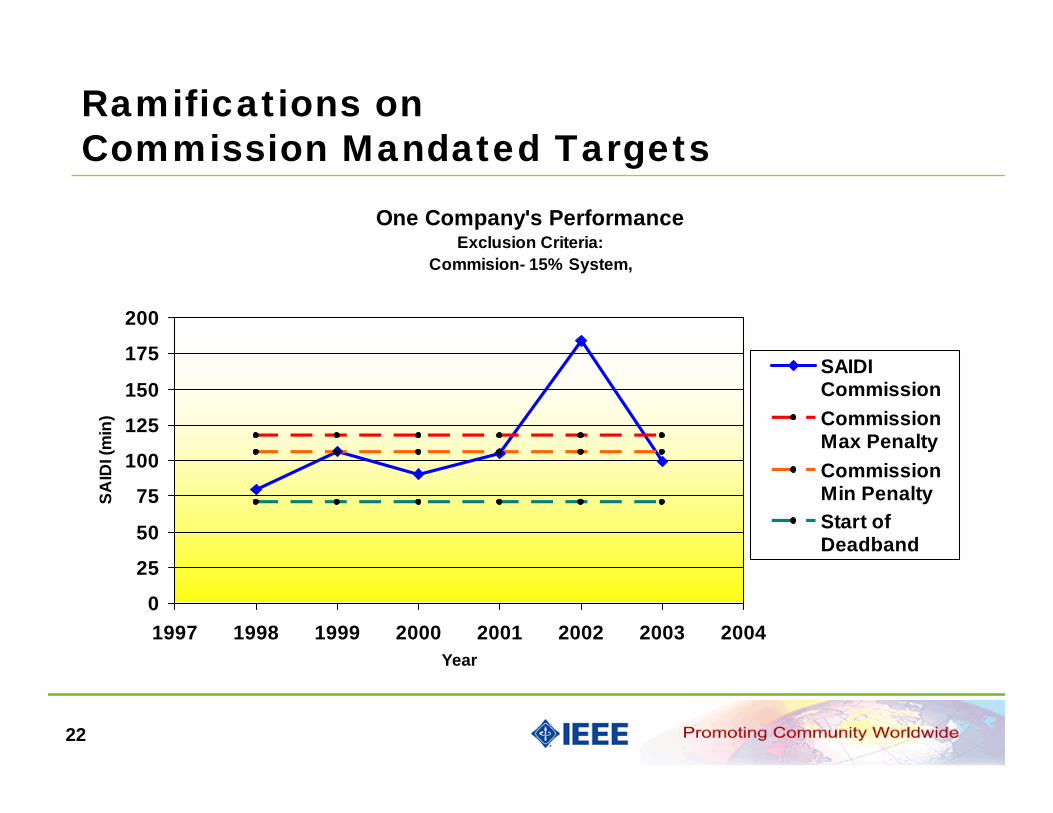
Ramifications on Commission Mandated Targets
One Company's Performance Exclusion Criteria:
Commision- 15% System,
0
25
50
75
100
125
150
175
200
1997 1998 1999 2000 2001 2002 2003 2004Year
SAID
I (m
in)
SAIDI CommissionCommissionMax PenaltyCommissionMin PenaltyStart ofDeadband

23
Ramifications on Commission Mandated Targets
One Company's Performance Major Event Criteria:
IEEE2.5βMethod
0
25
50
75
100
125
150
175
200
1997 1998 1999 2000 2001 2002 2003 2004Year
SAID
I (m
in)
SAIDI IEEE
LognormalMax PenaltyLognormalMin PenaltyStart ofDeadband
24
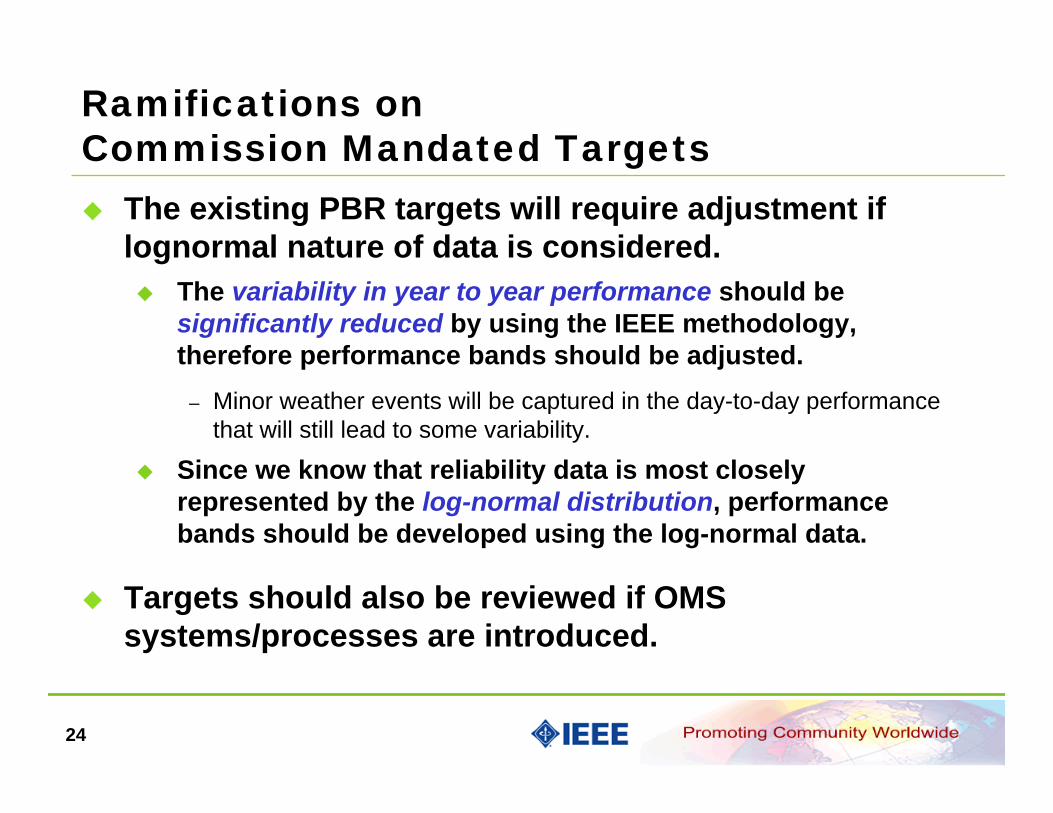
Ramifications on Commission Mandated Targets
The existing PBR targets will require adjustment if lognormal nature of data is considered.
The variability in year to year performance should be significantly reduced by using the IEEE methodology, therefore performance bands should be adjusted.
– Minor weather events will be captured in the day-to-day performance that will still lead to some variability.
Since we know that reliability data is most closely represented by the log-normal distribution, performance bands should be developed using the log-normal data.
Targets should also be reviewed if OMS systems/processes are introduced.

25
Basis for Target SettingIt’s appealing to use an industry average (benchmark data) to set targets for utilities in your state.It’s not practical to do so because:
Each utility has historical rates, maintenance and operating practices, system design, customer density, etc.
– These factors set the underlying performance level of the system.Forcing utilities to change to a radically different performance level has serious rate implications.
Using the companies own historical performance is a reasonable approach.
Issues: Introduction of an OMS, changing weather patterns, mergers and acquisitions.

26
BenchmarkingData is Never exactly the same!
Two main reasons for differences:Data Collection Process/System Differences
Exclusion Criteria Differences (Basis)
IEEE 1366-2003 addresses data basis issues by clearly defining the rules.
It DOES NOT address the data collection issues

27
BenchmarkWe have anonymously analyzed data for 95 companies
throughout the US & Canada for companies that range from rural electric co-ops to IOUs.
Basic Results for 2003.
*includes results from 70 respondents.
All RespondentsQuartile SAIDI IEEE SAIDI All SAIFI IEEE SAIFI All CAIDI IEEE CAIDI All
1 83.59 119.45 0.94 1.29 71.04 84.772 110.99 223.68 1.23 1.59 93.69 146.733 156.10 400.24 1.50 2.14 121.77 211.734 401.55 2352.29 3.15 5.53 424.74 1154.85
Performing another benchmark in 2005.

28

29
IEEE - SAIDI(2003)
020406080
100120140160180200220240260280300320340360380400420440
93 72 91 3 82 90 71 50 92 89 21 55 24 2 56 81 77 66 69 38 63 25 67 7 65 1 17 22 6 75 88 23 41 49 13 45 29 14 53 48 74 86 54 78 84 52 58 4 20 60 19 64 57 80 12 85 44 16 73 59 51 47 68 15 61 83 62 70 76 79
Utility
SAID
I (m
in)
Q2
Q3
Q1
Q4
Benchmarking data cannot be taken at face value…performance is a function of
many things such as rates, service territory, maintenance/operating practices,
etc. Q4 may be an acceptable level of performance for some utilities
30
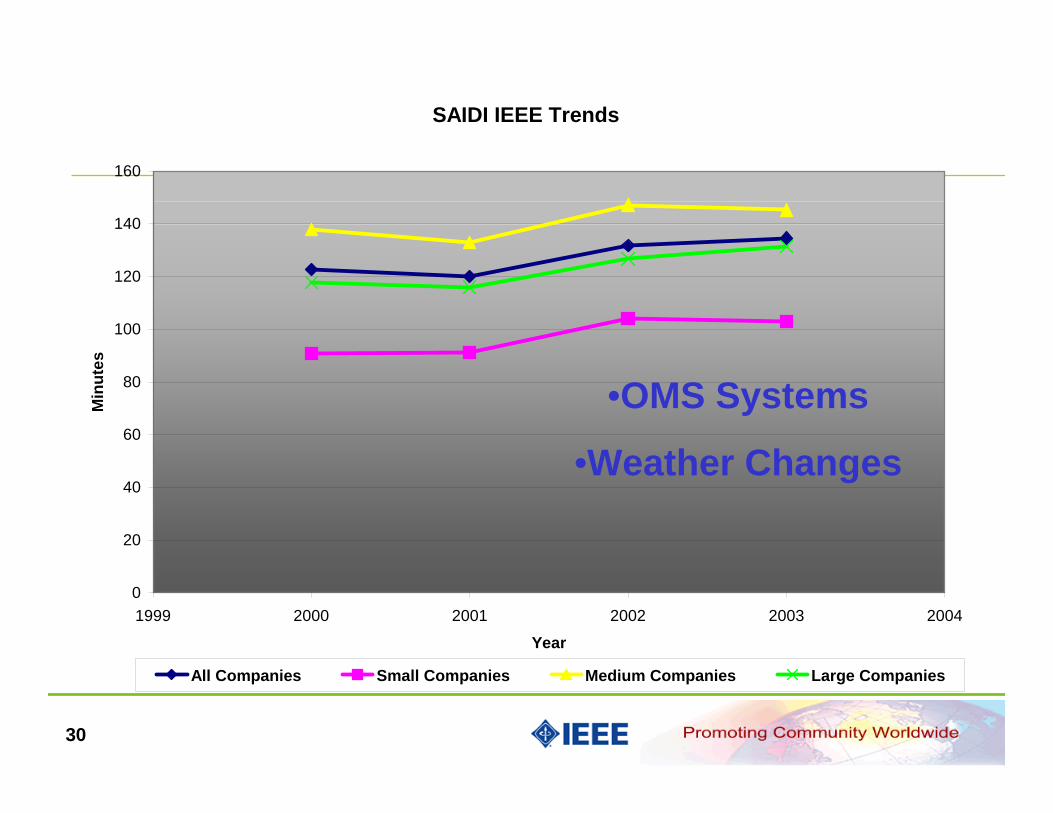
SAIDI IEEE Trends
0
20
40
60
80
100
120
140
160
1999 2000 2001 2002 2003 2004
Year
Min
utes
All Companies Small Companies Medium Companies Large Companies
•OMS Systems
•Weather Changes

31
Questions…