measuring probabilities of vessel infrastructure rawson ... · measuring probabilities of vessel...
TRANSCRIPT

Measuring Probabilities of Vessel Impacts with Infrastructure
Andrew RawsonMarine & Risk Consultants Ltd
Introduction
• Thinking about Risk and Probability in the Marine Environment
• Role and Value of Navigation Risk Assessment in Design
• Statistical and Analytical Methods

Thinking about Risk
Probabilities and Consequences

Risk and Uncertainty
• Risk = Likelihood * Consequence
• Risk is a necessary part of activities and developments in the marine environment:
• Collisions;• Contacts;• Groundings• …and others.
• Understanding risk and implementing appropriate mitigation is essential to good design
• These risks are uncertain in the complex marine environment –predicting future risks under changed conditions increases uncertainty

Navigation Risk Assessment
IMO’s Formal Safety Assessment


Judgement vs Analysis• Judgement: Most common method of measuring risk in
marine industry
• Relies on the experience and knowledge of the assessor; can draw upon data but is not data driven
• Maritime Risk Analysis: Use of analytical and mathematical techniques and routines to answer questions on the probability and consequences of navigational incidents
• Escalating Scale:1. Statistical2. Geometric3. Modelling4. Simulation

Statistical Methods

Historical Incidents• Allows for data to ground your assessment
But
• Reactive not proactive• Maritime incidents are rare• Reliance on good record keeping• Natural variation• Circumstances change

Incident Statistics on the Thames
• Incident rates on the Thames
• Incident data 2006‐2015 from PLA
• Vessel Traffic Data is AIS data for Summer 2015 and Winter 2016

0.00
0.50
1.00
1.50
2.00
2.50
3.00
Num
ber o
f Con
tacts p
er Year
Source: PLA

‐
5,000
10,000
15,000
20,000
25,000
30,000
35,000
40,000
Hours o
f Navigation pe
r Year
‐
20,000
40,000
60,000
80,000
100,000
120,000
140,000
Transits p
er Year
Source: PLA
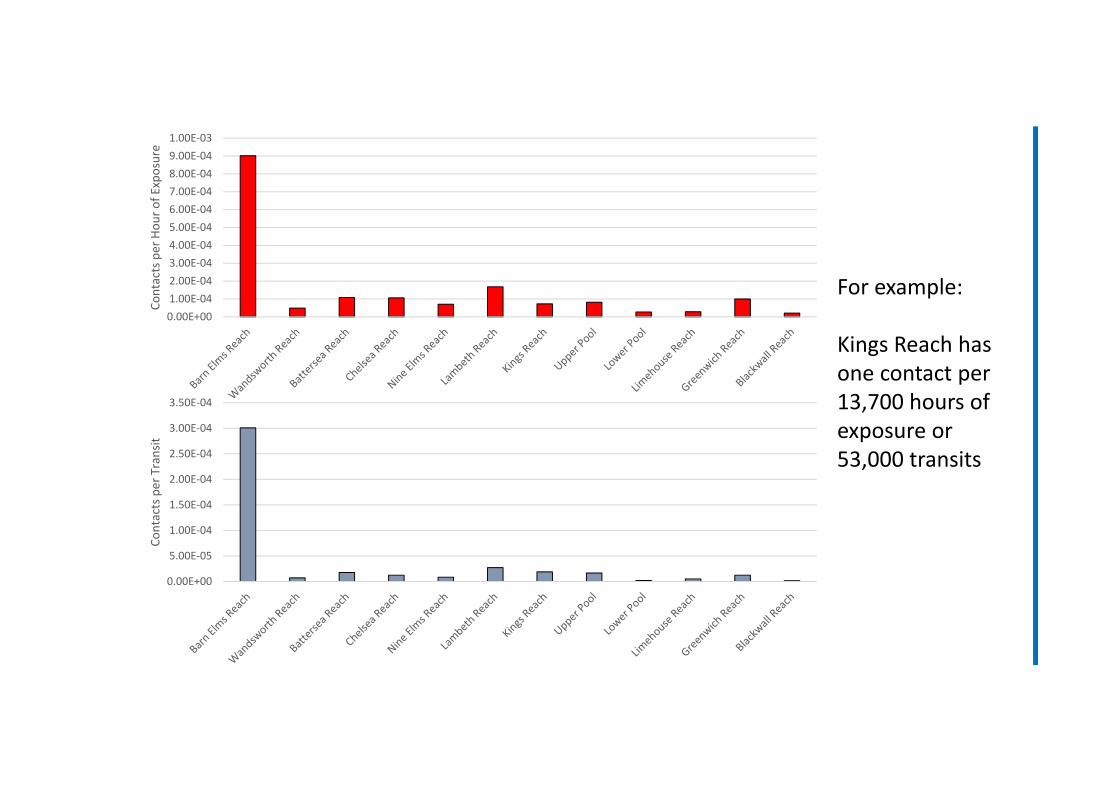
0.00E+001.00E‐042.00E‐043.00E‐044.00E‐045.00E‐046.00E‐047.00E‐048.00E‐049.00E‐041.00E‐03
Contacts per Hou
r of E
xposure
0.00E+00
5.00E‐05
1.00E‐04
1.50E‐04
2.00E‐04
2.50E‐04
3.00E‐04
3.50E‐04
Contacts per Transit
For example:
Kings Reach has one contact per 13,700 hours of exposure or 53,000 transits

0.00E+00
2.00E‐05
4.00E‐05
6.00E‐05
8.00E‐05
1.00E‐04
1.20E‐04
1.40E‐04
1.60E‐04
1.80E‐04Co
ntacts per Hou
r of E
xposure
0.00E+00
5.00E‐06
1.00E‐05
1.50E‐05
2.00E‐05
2.50E‐05
3.00E‐05
Contacts per Transit
For example:
Kings Reach has one contact per 13,700 hours of exposure or 53,000 transits

Causation Probabilities
• Likelihood that a vessel will have an incident per unit of exposure (movement/hour/nm)
• Many risk models are variations of:
Number x Probability

Bridge Contact Probabilities• Variation in probabilities:
• Bridge span configuration• Vessel types and sizes• Channel configuration• MetOcean conditions• Depth of water• Traffic Density• Training of Masters• Risk Controls
• Often Generic, don’t account for local factors
• e.g. Fujii & Mizuki (1981) and the Japanese Straits• e.g. MacDuff (1974) and the Dover Straits
Friis‐Hansen (2008) 0.00
1.00
2.00
3.00
4.00
5.00
6.00
1 2 3 4 5 6 7 8 9 10 11 12 13 14 15 16 17 18 19 20 21
Prob
ability of C
ontact Brid
ge (x10
‐4)

Deriving Causation Probabilities from Scratch
Fault Trees Bayesian Networks

Further Techniques

Geometric
• Product of:• Number of vessels/year• Geometric proportion of vessels at risk
• Causation Probability
• Often contacts and groundings are analysed with identical methodologies
Source: IWRAP

Example: MV Rena


Risk Results
Year Geometric Likelihood/Year Return Years2011 1.71% 1.88E‐03 531 Incident

Risk Results
Year Geometric Likelihood/Year Return Years2011 1.71% 1.88E‐03 531 2012 0.44% 4.84E‐04 2,067 Exclusion Zone

Risk Results
Year Geometric Likelihood/Year Return Years2011 1.71% 1.88E‐03 531 2012 0.44% 4.84E‐04 2,067 2013 0.38% 4.20E‐04 2,381 2014 0.38% 4.17E‐04 2,398 2015 0.33% 3.61E‐04 2,769
Equilibrium?

Risk Results
Year Geometric Likelihood/Year Return Years2011 1.71% 1.88E‐03 531 2012 0.44% 4.84E‐04 2,067 2013 0.38% 4.20E‐04 2,381 2014 0.38% 4.17E‐04 2,398 2015 0.33% 3.61E‐04 2,769 2016 0.18% 1.95E‐04 5,131 Virtual AtoN
Source: Rawson (2017). 12th International Conference on Marine Navigation and Safety of Sea Transportation, TransNav 2017.

Modelling• Use of modelling to better reflect
complexities of maritime systems
• Fast time simulation of all vessel traffic and the interactions between each actor and their environment
• Advantages:• Allows better understanding of system wide
risk and capacity issues• Allows testing of inter‐relationship of hazards –
funnelling of traffic due to a development increases both collision risk and contact risk
• But:• More complex, time consuming and expensive• Accuracy of model dependent on input data


Full Bridge Simulation
• Full bridge simulation allows for a greater appreciation of the feasibility of a passage
• Feedback from pilots and masters

Summary

Summary
1. There is value in understanding navigation risk
2. These risks are uncertain in the complex marine environment
3. Analytical techniques can be employed to better understand the likelihood of incidents
4. Both human judgement and models are imperfect tools
5. Mixture of marine expertise and scientific analysis required
