measuring soil biology - charles sturt university...1500 2000 2500 3000 3500 4000 v1 control v1...
TRANSCRIPT

Measuring soil biologyMeasuring soil biology

Difficult to test for soil biology -is a very complex system
Numbers and types change rapidly withTemperatureTemperature – day/night, depth of soilMoistureMoisture – rain, irrigation, droughtNutrient supplyNutrient supply – organic matter type, & amounts – crop or pasture
Take outside factors into account in tests!
In one single teaspoon of soil there can be In one single teaspoon of soil there can be more soil organisms than there are humans more soil organisms than there are humans on earth!on earth!

How DO we test for soil How DO we test for soil organisms?organisms?
Can use • Direct indicators for presence, activities
and/or numbers– Single or range of species in field e.g. ants– Biological lab tests – enzymes, DNA e.g. micro-
flora and –fauna– Chemical lab tests – microbial biomass, CO2
respiration• Indirect indicators which affect function of
organisms– Organic carbon

• AMOUNT: reasonably stable but assessed withOUT separating into groups
– E.g. bacteria and fungi (microscopy, plate counts- only retrieve 1- 2% actual amount), microbial biomass carbon or nitrogen (most commonly used).
• ACTIVITY – fluctuates with temperature and water and relevant to agriculture
– E.g. enzyme action, decomposition rate, carbon respiration, N- mineralisation
• SPECIES or DIVERSITY: can target specific groups– Nematodes, earthworms, rhizobia, arbuscular mycorrhizal fungi,
DNA, community analysis, microbial functional (Biolog),
And INDIRECT– E.g. Carbon fractions
Tests availableTests availableNumbers/Mass (how many are there?), Diversity (who are they?) and Functions
(what do they do?)

Nematode NumbersNematode Numbers
Root Knot Nematode density/kg dry soil
0
500
1000
1500
2000
2500
3000
3500
4000
V1 control V1 mulch V2 control V2 mulch V3 control V4 mulch
Sample date
Nem
atod
es/k
g dr
y so
il
Sep-09Mar-10
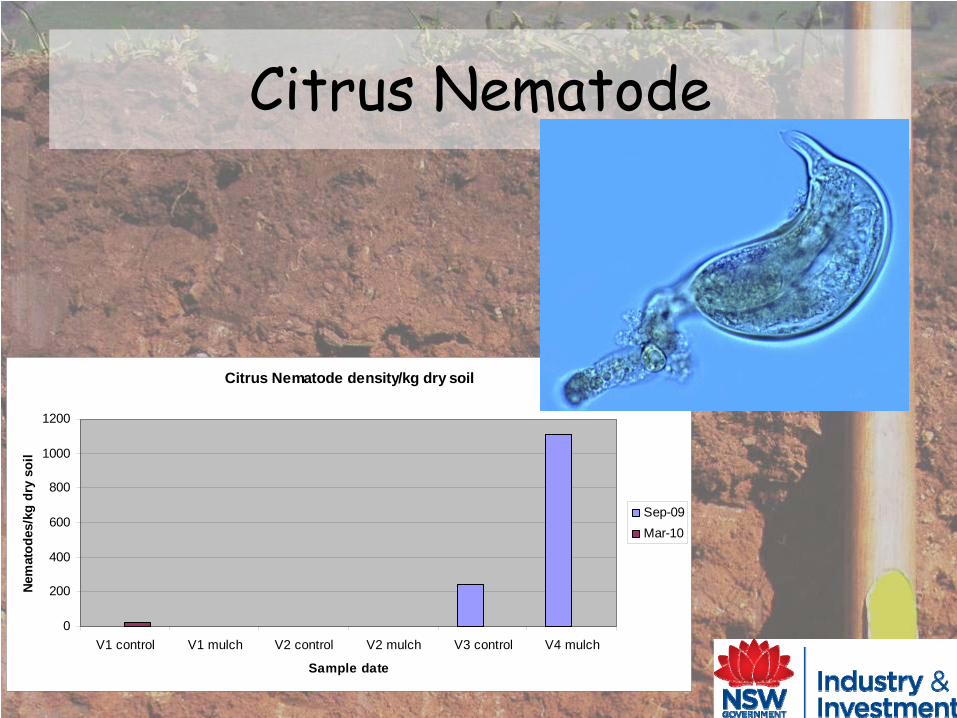
Citrus NematodeCitrus Nematode
Citrus Nematode density/kg dry soil
0
200
400
600
800
1000
1200
V1 control V1 mulch V2 control V2 mulch V3 control V4 mulch
Sample date
Nem
atod
es/k
g dr
y so
il
Sep-09Mar-10

Bacterial feeding NematodesBacterial feeding Nematodes
Bacteria feeding nematode density/kg dry soil
0
500
1000
1500
2000
2500
3000
V1 control V1 mulch V2 control V2 mulch V3 control V4 mulch
Sample date
Nem
atod
es/k
g dr
y so
il
Sep-09
Mar-10

Predator NematodesPredator Nematodes
Predator nematode density/kg dry soil
0
20
40
60
80
100
120
140
160
180
V1 control V1 mulch V2 control V2 mulch V3 control V4 mulch
Sample date
Nem
atod
es/k
g dr
y so
il
Sep-09Mar-10

Other Free living nematodesOther Free living nematodes
Other free living nematodes/kg dry soil
0200400600800
100012001400160018002000
V1 control V1 mulch V2 control V2 mulch V3 control V4 mulch
Sample date
Nem
atod
es/k
g dr
y so
il
Sep-09Mar-10


Test Information Cotton strip assay Decomposer potential Fungi/bacteria ratio Ecosystem health Microbial biomass C/Total C C turnover CO2 Respiration Overall soil microbial activity CO2
Earthworms (#/sp) C levels, structure
Dung beetles C incorporation Cultivable Functional Groups (eg cellulose degraders)
Specific processes
Microbial enzymes Specific processes
BIOLOG™ Community catabolic diversity
DNA profiles Community ‘fingerprints Bacterial genes Specific bacterial functions Predicta B ™ DNA-based; for pathogens
Microarrays 1000’s genes (function & structure)
Examples of tests availableExamples of tests available Pauline Pauline MeleMele
Vic DPIVic DPI
specific
simple generalised
sophisticated

Simple onSimple on--farm testsfarm tests……
• Calico strips - monitor decomposition
• Set traps for macro and mesofauna e.g. ants• Monitor dung beetles • Look for worm casts >> earthworm activity• Examine nodules on legumes
Looking for evidence of organisms:

Low biological High biological acitivity activity
Score: 0.5 / 4.0
Score: 3.5 / 4.0
Soil biology Soil biology ––
how (what) to how (what) to measure and monitormeasure and monitor

Soil and Water Management Research Unit, USDA-Agricultural Research Service, St. Paul, Minnesota.
http://soils.usda.gov/sqi/concepts/soil_biology/
Casts at the soil surface are evidence that earthworms are shredding, mixing, and burying surface residue.

Simple onSimple on--farm testsfarm tests……Dig a hole deep enough so
that you can see the subsoil.• Are the old inactive roots
decomposing? (bacteria and fungi)
• Is there evidence of bioturbation? (macrofauna, e.g. earthworms and beetles)
• Does the soil smell “earthy”? (actinomycetes)
• Is the soil dark in colour? (SOC)
• Is the soil well-structured? (soil aggregation)

Simple onSimple on--farm testsfarm tests……Assessing the soil environment
from soil properties and chemical tests:
• SOC levels• Subsoil colour (grey or mottling
indicates waterlogging)• Soil chemistry: pHCa , salinity,
sodicity, toxicities. • Structural problems:
compaction, erosion, or surface crusting
Other:• Groundcover assessment

What is most important when What is most important when using soil biological data?using soil biological data?
1. Monitor –see if the values are increasing or decreasing
over time.
2. Interpret from more than one set of results
many readings from one site, different times, different types of information
3. Soil biological information is complexinteracts with whole environment: not many
generalities yet (but some emerging)

Carbon fractions are a good surrogate!!!
