measuring the changing conditions of rural health clinics...
TRANSCRIPT

Measuring the changing conditions of rural health clinics over the last decade
Colin Wiltshire, ANU

Presentation Overview 1. Research approach for data collection
1. Survey Results – Health clinics
1. Survey Results – Health financing
1. Health policy and expenditure reforms
– Free primary health care subsidy payments to clinics – Political driven health development expenditures

1 - Research Approach
3

4
Promoting Effective Public Expenditure (PEPE) Project • Partnership between PNG National Research Institute and Devpolicy Centre at ANU
1 – Analyse priority expenditures in the national budget 2 – Research into how expenditure reforms are implemented
• PNG has experienced a minerals boom leading to increasing public expenditure.
• More evidence is needed to understand if this spending is making a difference.
Per capita government spending on health and education, 2011 kina GDP and GDP per capita, 2012 prices

Tracking funds to health facilities • Builds on 2002 Public Expenditure and Service
Delivery (PESD) Survey
• Attempted to visit the same primary schools and health facilities a decade later
• Eight provinces representing four regions of PNG: – Southern region (Gulf, National Capital District) – Highlands region (Enga, Eastern Highlands) – Momase region (Sandaun, Morobe) – Islands region (West New Britain, East New Britain)
• Random selection of districts, primary schools, health facilities
5
6
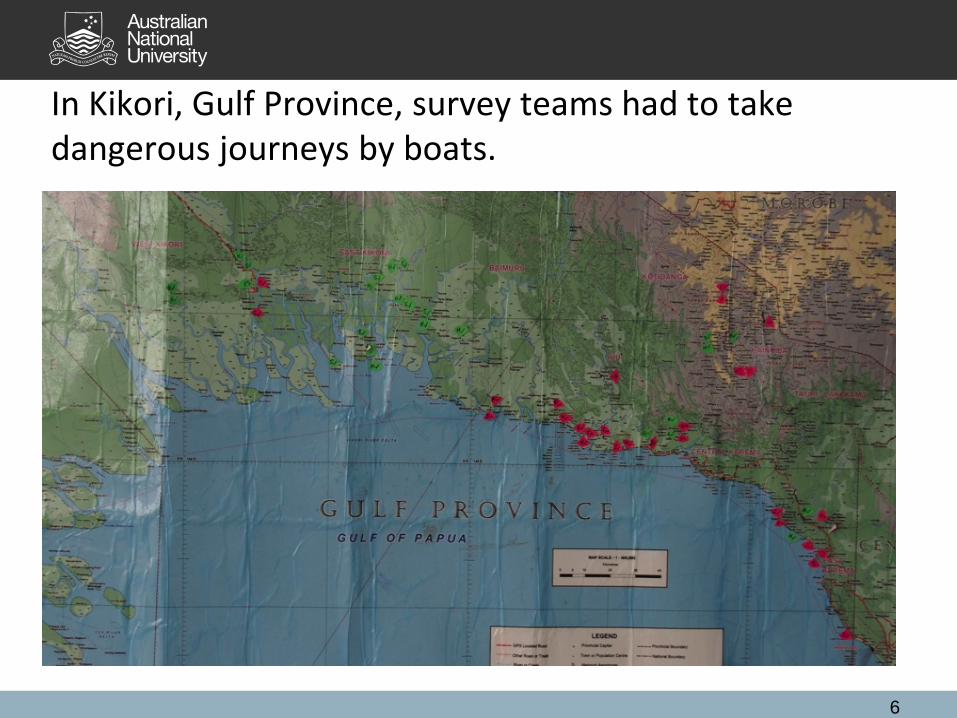
In Kikori, Gulf Province, survey teams had to take dangerous journeys by boats.

7
Sandaun Province – Across Telefomin District

• Five health survey instruments – Officer in Charge, another health worker, user, district and provincial health managers.
• Tracked health reforms, including health function grant, which funds essential operational activities at the facility level.
8
Health expenditure reforms (operational)

9
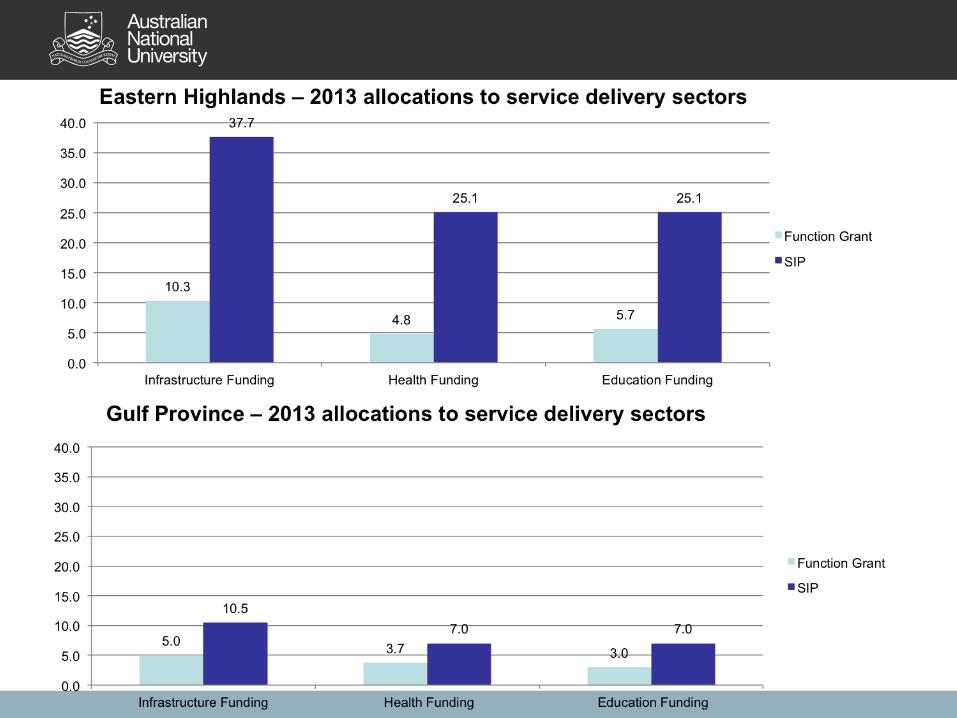
• The survey also focused on development spending through the District Services Improvement Program (DSIP).
• Was DSIP funding reaching health clinics to improve infrastructure?
The rise of constituency funding in PNG
Development health expenditure (Capital)
0
200
400
600
800
1000
1200
1400
1600
1984
1985
1992
1993
1994
1995
1996
1997
1998
1999
2000
2001
2002
2003
2004
2005
2006
2007
2008
2009
2010
2011
2012
2013
2014
2015
p20
16p
2017
p
DSIP SIP

Primary health care facilities visited
142 health clinics visited: • 60% Government-run • 37% Church-run • 3% Private-run
Gender of OIC: • 2002 - 34% female • 2012 - 43% female Other health workers: • 2012 - 62% female
10

2 – Survey Results (Health Clinics)
11

Fewer patients are utilising primary health care services
46.3
66.7
25.9
37.3
48.3
26.4
0
10
20
30
40
50
60
70
80
All clinics Health centers Aid posts
Number of patients on a typical day
2002
2012

13
39.5
62.1
16.8
28.1
35.7
20.4
0
10
20
30
40
50
60
70
80
All clinics Health centres Aid posts
Number of patients day before the survey
2002
2012
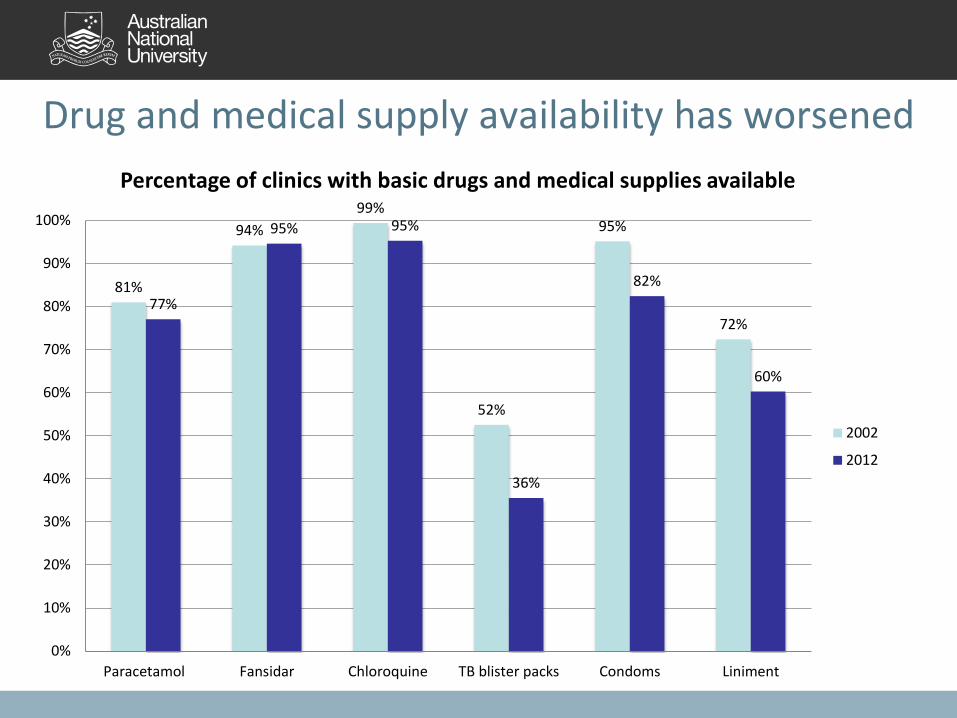
Drug and medical supply availability has worsened
81%
94% 99%
52%
95%
72% 77%
95% 95%
36%
82%
60%
0%
10%
20%
30%
40%
50%
60%
70%
80%
90%
100%
Paracetamol Fansidar Chloroquine TB blister packs Condoms Liniment
Percentage of clinics with basic drugs and medical supplies available
2002
2012

No increase in staff
4.8
4.1
3.4
5.4
4.1
3.2
0
1
2
3
4
5
6
Positions Working Present
Health worker positions, working and present
2002
2012

Some troubling staff indicators
8.9
0
1
2
3
4
5
6
7
8
9
10
Number of years in position
55
75
0
10
20
30
40
50
60
70
80
90
100
Paid at grade Use pay to deliverservices
Health staff pay perspectives (%)

Most clinics do not perform basic functions
27
36 33
0
10
20
30
40
50
60
70
80
90
100
Regular patrols (health centres only) Access to fuel (to pick up drugs) Ability to transfer patients
Health clinics performing basic functions (%)
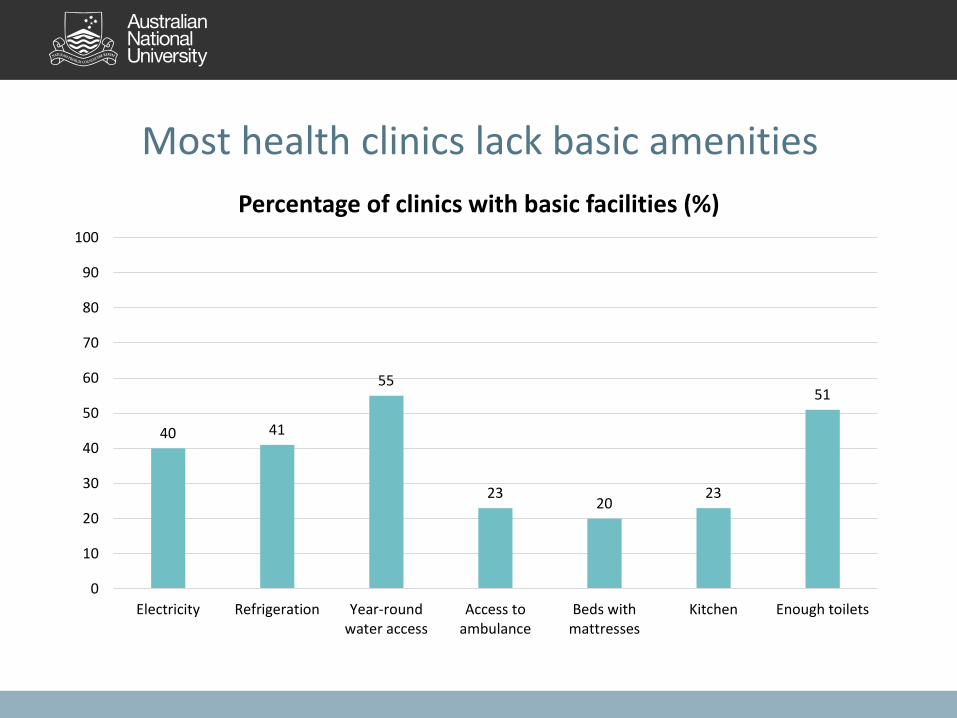
Most health clinics lack basic amenities
40 41
55
23 20
23
51
0
10
20
30
40
50
60
70
80
90
100
Electricity Refrigeration Year-roundwater access
Access toambulance
Beds withmattresses
Kitchen Enough toilets
Percentage of clinics with basic facilities (%)
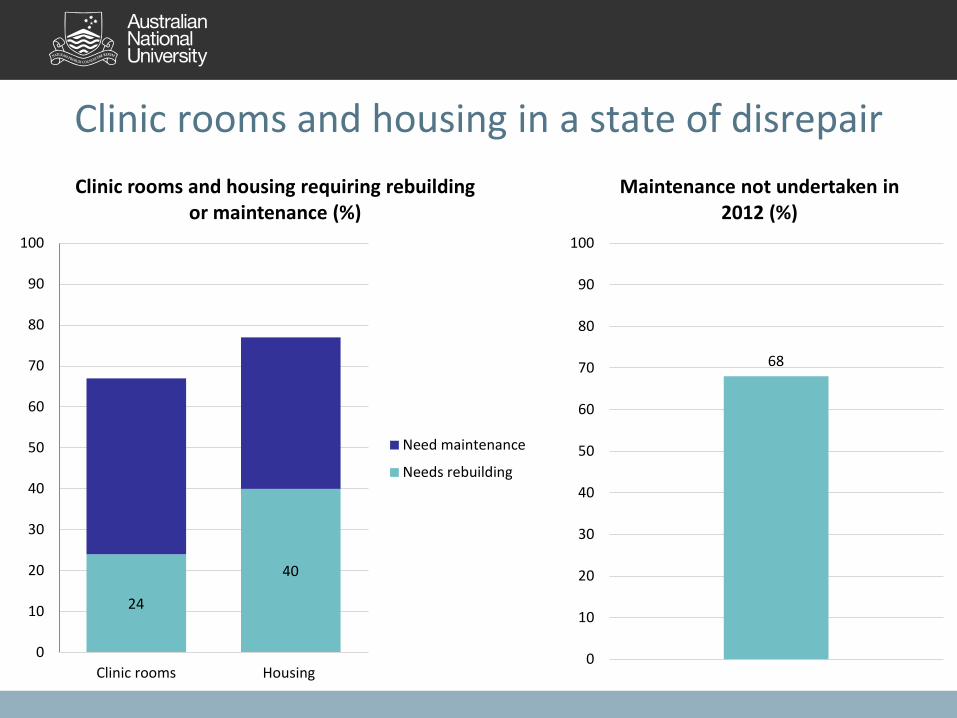
Clinic rooms and housing in a state of disrepair
24
40
0
10
20
30
40
50
60
70
80
90
100
Clinic rooms Housing
Clinic rooms and housing requiring rebuilding or maintenance (%)
Need maintenance
Needs rebuilding
68
0
10
20
30
40
50
60
70
80
90
100
Maintenance not undertaken in 2012 (%)

3 – Survey Results (Health Financing)
20

Facility-level budgeting is not working
34%
25%
19%
12%
0%
10%
20%
30%
40%
50%
60%
70%
80%
90%
100%
Budget prepared Budget submitted Budget approved Funding received
Clinics which budget and receive funding in return (%)

Budgets submitted and received (Average)
22
63,771
45,467
107,500
31,645
9,567
77,254
K 0
K 20,000
K 40,000
K 60,000
K 80,000
K 100,000
K 120,000
All State Church
Budget Submitted
Budget Received
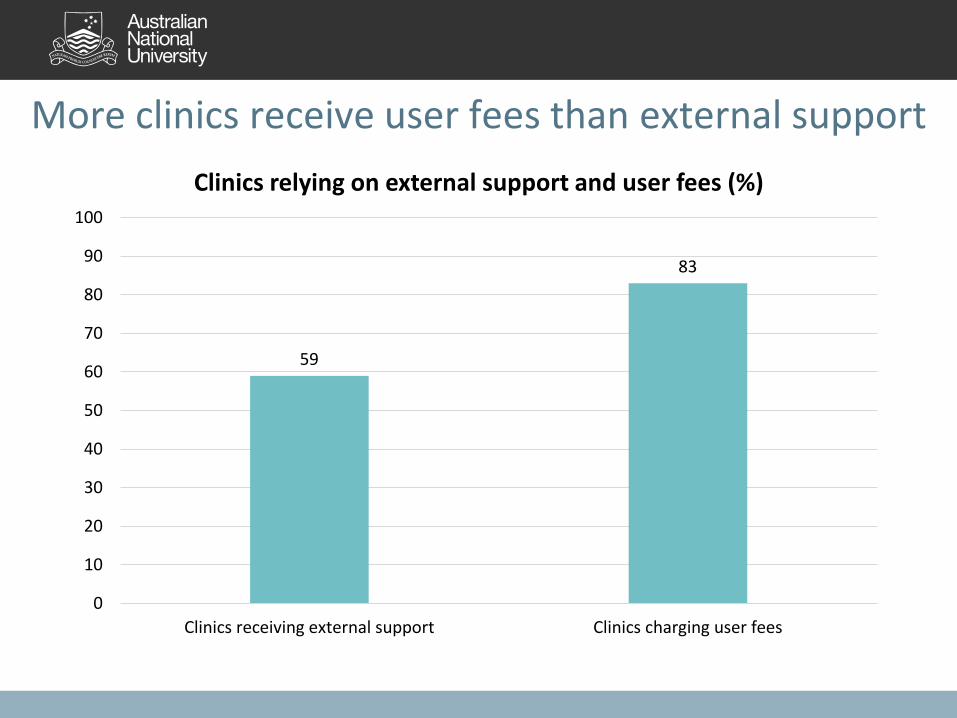
More clinics receive user fees than external support
59
83
0
10
20
30
40
50
60
70
80
90
100
Clinics receiving external support Clinics charging user fees
Clinics relying on external support and user fees (%)

24
1.62
23.5 25.7
15.7
K0
K5
K10
K15
K20
K25
K30
General consultation Domestic violence Tribal fights Births
Clinics charge different fees for different services
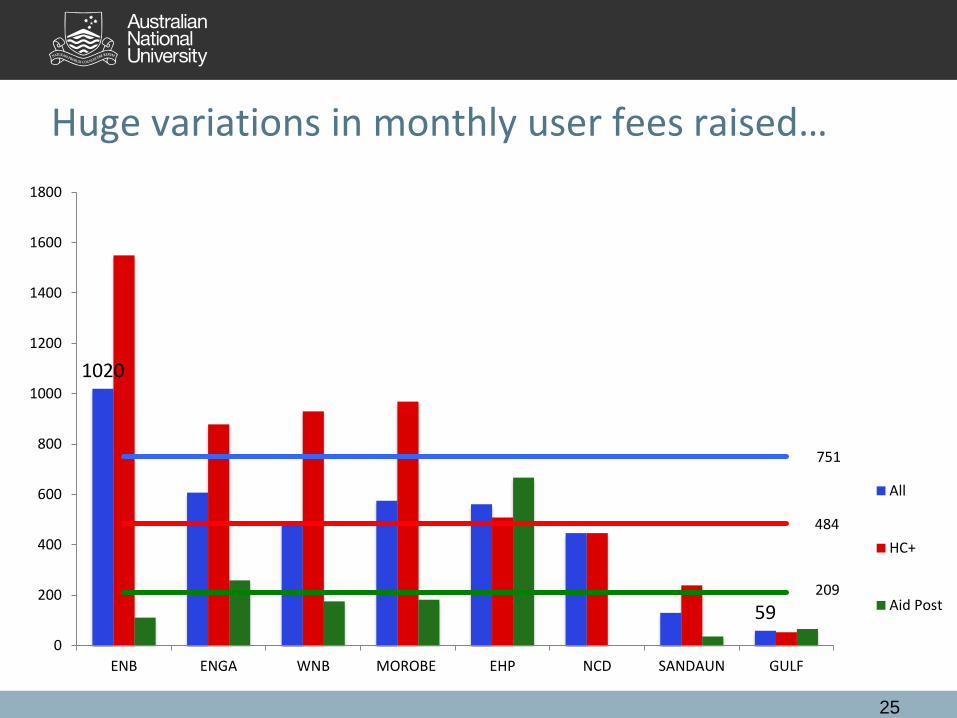
Huge variations in monthly user fees raised…
25
1020
59
484
751
209
0
200
400
600
800
1000
1200
1400
1600
1800
ENB ENGA WNB MOROBE EHP NCD SANDAUN GULF
All
HC+
Aid Post

55%
67%
79% 75%
50%
69%
91%
79%
69%
0%
10%
20%
30%
40%
50%
60%
70%
80%
90%
100%
ENB WNB MOROBE SANDAUN EHP ENGA GULF NCD
Community perceptions of user fees at the health facility
TOO LOW
ABOUT RIGHT
TOO HIGH
AVERAGE

4 - Health Policy
27

PNG’s free primary health care policy
• Launched on 24 February, 2014
• Key policy for the PNG Government set out in the Allotau Accord and politically driven
• K11m subsidy payments allocated to offset fees raised by health clinics
• What implications will the policy have for revenue collected at health facilities
28
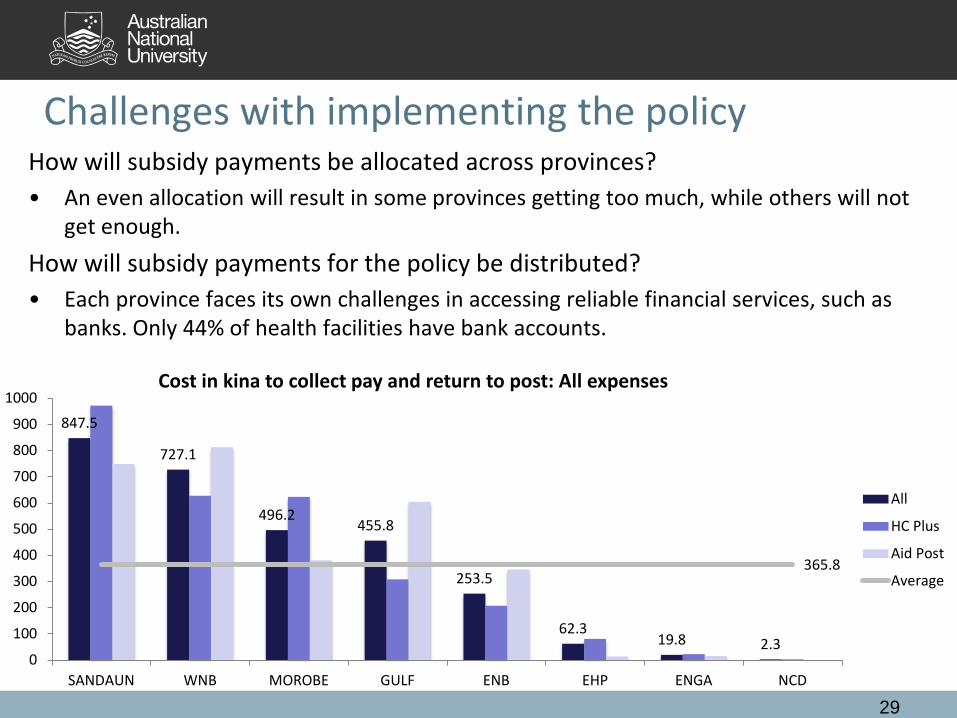
Challenges with implementing the policy How will subsidy payments be allocated across provinces? • An even allocation will result in some provinces getting too much, while others will not
get enough. How will subsidy payments for the policy be distributed? • Each province faces its own challenges in accessing reliable financial services, such as
banks. Only 44% of health facilities have bank accounts.
29
847.5
727.1
496.2 455.8
253.5
62.3 19.8 2.3
365.8
0
100
200
300
400
500
600
700
800
900
1000
SANDAUN WNB MOROBE GULF ENB EHP ENGA NCD
Cost in kina to collect pay and return to post: All expenses
All
HC Plus
Aid Post
Average

Was DSIP funding spent effectively?

31

Changes in expenditure policy – DSIP, LLGSIP, PSIP
33

Spending though politicians in PNG is high by international standards
0%
2%
4%
6%
8%
10%
12%Ratio of constituency funding to total spending (%)
35 (Howes & Sofe 2014, PNG Budget Forum)

What is the problem with this picture?
36

Further research • Expenditure case studies investigating recurrent and
development health financing. – Health function grants / Free health subsidies – Health development expenditures from SIP / DHIP
• Two provinces and two districts – Surveys told us the what is happening and where. – Case studies can help us to answer the why question.
For the full report – A lost decade? Service delivery and reforms in Papua New Guinea 2002 – 2012 go to:
https://devpolicy.crawford.anu.edu.au/png-budget-project
37
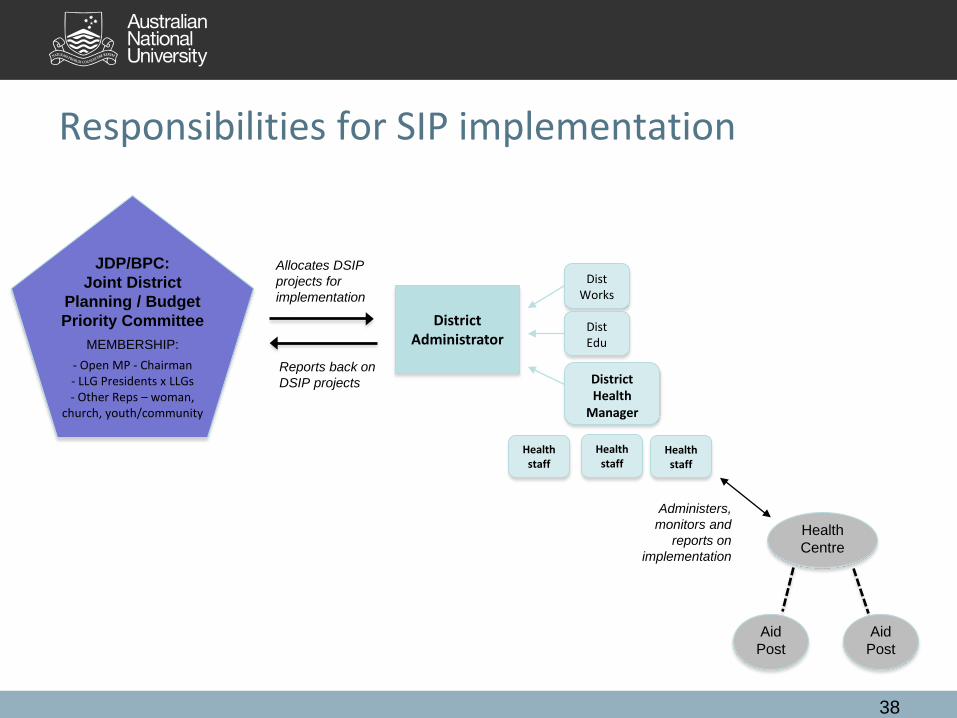
Responsibilities for SIP implementation
38
District Administrator
Health Centre
Dist Works
Dist Edu
District Health
Manager
JDP/BPC: Joint District
Planning / Budget Priority Committee
MEMBERSHIP:
- Open MP - Chairman - LLG Presidents x LLGs - Other Reps – woman,
church, youth/community
Administers, monitors and
reports on implementation
Allocates DSIP projects for implementation
Reports back on DSIP projects
Aid Post
Aid Post
Health staff
Health staff
Health staff

Health clinics are user fees to deliver services
59
29
12
0
10
20
30
40
50
60
70
80
90
100
1
Clinics with and without external support and user fees (%)
Clinics without external support or user fees
Clinics solely reliant on user fees
Clinics with external support