measuring the internet in real time. scott kirkpatrick, systems group (huji), and evergrow partners:...
Post on 19-Dec-2015
215 views
TRANSCRIPT

Measuring the Internet
in real time.Scott Kirkpatrick, Systems Group (HUJI), and EVERGROW partners: DIMES (TAU) and ETOMIC (Budapest, Navarra)

The problem
Isn’t “measuring the Internet” like, sooo last century??
No, conceptual and practical problems remain; new ones are becoming apparent.
Peer to peer applications, soon to accommodate streaming
New clients: DSL, cable, hotspots, blackberries, cellphones with cameras, sensor networks
Making information about uses of digital content accessible and relevant to scholars from disciplines other than computer science.

Some history
Measurement activities Analysis largely based on single snapshots:
Alta Vista, Alexa late 1990s Single source searches for topology RouteViews (U Oregon) takes union of major BGP
tables No one studied bandwidth Some work became proprietary (Google, et al.),
other activities lost in the dot.com meltdown (DEC/Compaq SRC web archeology tools)

Accomplishments to date:
Power Laws Growth plus preferential attachment is sufficient Data has been questioned, alternate models
Robustness and reliability Seen as a percolation process Two attacks – random failure, targeted DOS Yet 11/13 DNS servers recently were brought
down, and internet continued to function. Analysis of strong connectivity of content

Today’s concerns, e.g., content distribution
How to assure that fresh copies of a large piece of information reach users around the world? (news, movies, catalogs, software releases…). Answer will involve spreading copies around.
Classic (Valliant) multicast strategy – always start with a leap into the complete unknown, then proceed greedily.
Peer to Peer approaches redistribute the server’s work by having recipients provide what they have to subsequent requesters. But they greatly INCREASE the load on networks.
JULIA attempts to send the least information over the longest links, most information exchanged between nearby clients. How to know enough about the instantaneous properties of the internet
to make this possible?

Today’s measurement activities are different
Today’s issues are not connectivity to the backbone, but among the leaves. Not characteristics of the distribution tree, but of the mesh that links neighbors in a single geography.

ETOMIC approach for bandwidth Use GPS timers, not network time signal Carefully timed packet train creates momentary overload “Chirp”ing them allows identification of the capacity
15 systems came up in 2004, deployed across Europe HUJI’s is in ROSS 1st floor, disguised as a PlanetLab station
Manage experiments from server in Navarra, Spain Present status – can see time of flight from 70 meters to
3000 km.

Distributed Internet MEasurement and Simulation
Let the network measure itself Convince people to download lightweight client, provide
measurement scripts from central server (“@Home”) Fly under the radar of network administrators
Today we initiate one traceroute request every 30 sec.
Client is Java/Windows. Linux and Mac clients under construction.
DIMES website provides competitive stats on success of each agent
Operational since 1 Sept 2004.

DIMES growth curve
500 agents
Still finding ~1000 links/week. Not steady state. Agents increasing, and new scripts are constantly being introduced.
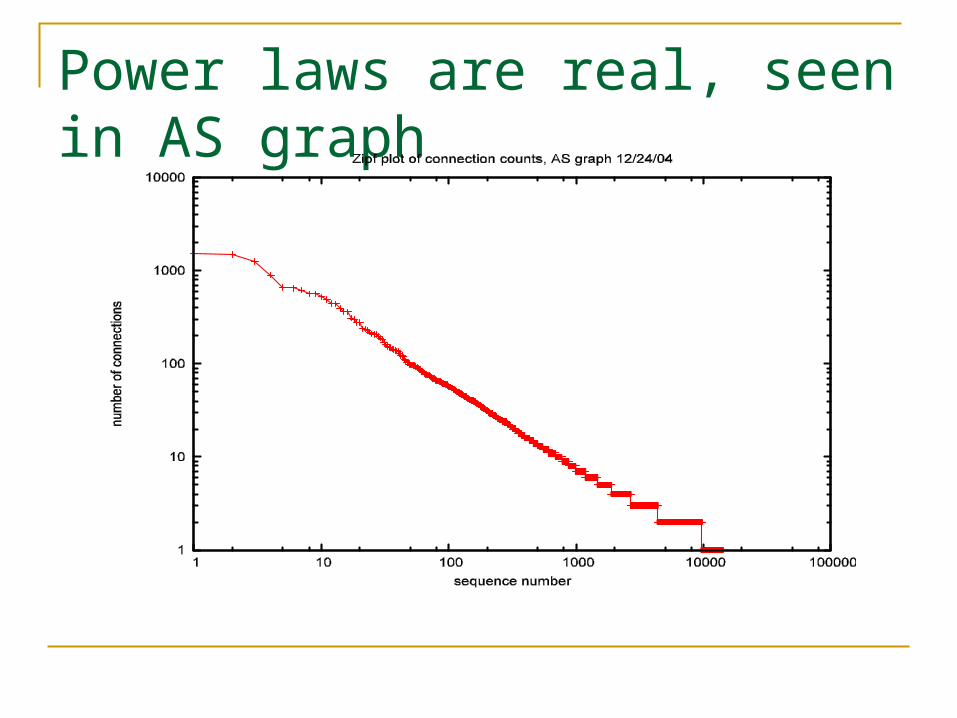
Power laws are real, seen in AS graph

Comparison with BGP data
BGP ~18,000 AS’s, DIMES sees only 14,500 DIMES has >12,000 edges not in BGP BGP has ~7000 edges not yet in DIMES’ map
Joining the two datasets, we see <ngbrs> of 6 or more, definitely not a tree.

Now assign sites to their k-shells Find all sites with k ngbrs or less and remove them.
Continue until only sites with >k ngbrs remain. What’s left is the (k+1)-core. Sites in the k-core, not in the (k+1)-core are the k-shell.
The k-core is w.h.p k-connected (at least on random graphs). K-core is found in linear time. K-connectivity has linear proof only for k<4.

K-shells also follow power law

K-shell membership suggests roles for sites
Highest k: DNS, Akamai; medium k is ripe for peer to peer participation. At least 21 distinct routes connect all the DNS servers in the world.

Current status and next steps
Currently 500 agents, 45 countries, all continents > 100,000 measurements/day Most detailed AS-level map ever, still growing
Each week captures ~2/3 of the whole map, so dynamics is accessible Refining the analysis to resolve POPs
To achieve 2000 agents (YE2005), 10000 (YE2006), 50000 (YE2007)… we will add function, such as: Choose best download site; measure your ISP Internet Weather reports Smart P2P clients – eMule first Virus-immune system

Agents by CountryArgentina
Australia
Austria
Belgium
Brazil
Canada
China
Czech Republic
Denmark
Egypt
Estonia
Finland
France
Germany
Greece
Hong Kong
Hungary
India
Israel
Italy
Japan
Korea (Republic of)
Latvia
Lithuania
Luxembourg
N/A
Namibia
USA
Israel
UK
Sweden
Ger.
Den.
Hun.
Fr.

http://www.netdimes.org