measuring the stress field around an evolving crack in
TRANSCRIPT
General rights Copyright and moral rights for the publications made accessible in the public portal are retained by the authors and/or other copyright owners and it is a condition of accessing publications that users recognise and abide by the legal requirements associated with these rights.
Users may download and print one copy of any publication from the public portal for the purpose of private study or research.
You may not further distribute the material or use it for any profit-making activity or commercial gain
You may freely distribute the URL identifying the publication in the public portal If you believe that this document breaches copyright please contact us providing details, and we will remove access to the work immediately and investigate your claim.
Downloaded from orbit.dtu.dk on: Mar 23, 2022
Measuring the stress field around an evolving crack in tensile deformed Mg AZ31using three-dimensional X-ray diffraction
Oddershede, Jette; Camin, Bettina; Schmidt, Søren; Mikkelsen, Lars Pilgaard; Sørensen, HenningOsholm; Lienert, Ulrich; Poulsen, Henning Friis; Reimers, Walter
Published in:Acta Materialia
Link to article, DOI:10.1016/j.actamat.2012.02.054
Publication date:2012
Link back to DTU Orbit
Citation (APA):Oddershede, J., Camin, B., Schmidt, S., Mikkelsen, L. P., Sørensen, H. O., Lienert, U., Poulsen, H. F., &Reimers, W. (2012). Measuring the stress field around an evolving crack in tensile deformed Mg AZ31 usingthree-dimensional X-ray diffraction. Acta Materialia, 60, 3570-3580.https://doi.org/10.1016/j.actamat.2012.02.054

1
Measuring the stress field around an evolving crack in tensile deformed Mg
AZ31 using 3DXRD
Jette Oddershedea,1,*, Bettina Caminb, Søren Schmidta,1, Lars P. Mikkelsenc, Henning Osholm
Sørensena,2, Ulrich Lienertd,3, Henning Friis Poulsena,1, and Walter Reimersb
aCenter for Fundamental Research: Metal Structures in 4D, Materials Research Division, Risø DTU,
Frederiksborgvej 399, DK-4000 Roskilde, Denmark bInstitut für Werkstoffwissenshaften und –technologien, Metallische Werkstoffe, Sekr. BH18,
Technische Universität Berlin, Ernst-Reuter-Platz 1, DE-10587 Berlin, Germany cDTU Wind Energy, Frederiksborgvej 399, DK-4000 Roskilde, Denmark dAdvanced Photon Source, Argonne National Laboratory, 9700 S. Cass Ave., Argonne, IL 60439, USA
*Corresponding author: Tel.: +45 2371 2331, E-mail: [email protected]
Keywords
Crack propagation; Stress and strain; High-energy X-ray diffraction; Plastic deformation; Finite
element modelling
1 Present address: DTU Physics, Fysikvej, DK-2800 Kgs. Lyngby, Denmark 2 Present address: Nano-Science Center, Department of Chemistry, University of Copenhagen, 2 Present address: Nano-Science Center, Department of Chemistry, University of Copenhagen,
Universitetsparken 5, DK-2100 København Ø, Denmark 3 Present address: DESY Photon Science, Notkestrasse 85, D-22603 Hamburg, Germany

2
Abstract
The stress field around a notch in a coarse-grained Mg AZ31 sample has been measured under tensile
load by using the individual grains as probes in an in situ high-energy synchrotron diffraction
experiment. The experimental setup, a variant of Three-Dimensional X-Ray Diffraction microscopy,
allows the position, orientation and full stress tensor of each illuminated grain to be determined, and
hence enables the study of evolving stress fields in coarse grained materials with a spatial resolution
equal to the grain size. Grain resolved information like this is vital for understanding what happens
when the traditional continuum mechanics approach breaks down and fracture is governed by local
heterogeneities (e.g. phase or stress differences) between grains. As a first approximation the obtained
results were averaged through the thickness of the sample and compared with an elastic-plastic
continuum finite element simulation. It was found that a full three-dimensional simulation was required
to account for the measured transition from the overall plane stress case away from the notch to the
essentially plane strain case observed near the notch tip. The measured and simulated stress contours
were shown to be in good agreement except at the highest applied load where a stress relaxation at the
notch tip was observed in the experimental data. This stress relaxation is attributed to the initiation and
propagation of a crack. Finally it was demonstrated that the measured lattice rotations could be used as
a qualitative measure of the shape and extent of the plastic deformation zone.
1. Introduction
Within the last decade the stress fields around different types of cracks have been studied using a
variety of in situ diffraction techniques. To get sufficient penetration power either neutrons [1,2] or
high-energy synchrotron X-rays [3-7] have been employed. The latter case allows the unique
combination of imaging and diffraction, also known as 3D crack tip microscopy [8], to probe the local
conditions of the crack tip region. Here it is possible to combine tomographic evidence of crack
growth, closure (in case of cyclic fatigue) or the spatial distribution of reinforcements and voids with
the evolution in the stress field and plastic deformation zone measured by diffraction [9-11]. Common
to these diffraction experiments is that the sample is scanned with respect to the beam, and that the
dimensions of the beam determine the spatial resolution of the stress map. The analysis procedure is in
all cases a generalization of the classical powder diffraction technique [12], where the resulting local
strains and stresses are obtained as averages over the grains in the gauge volume. In order to obtain

3
diffraction data of sufficient quality the gauge volume must comprise at least of order 1000 grains.
Consequently this procedure is limited to relatively fine-grained materials [13].
For more coarse-grained materials 3-Dimensional X-Ray Diffraction (3DXRD) microscopy is a
candidate technique [14]. With 3DXRD up to 1000 grains are illuminated simultaneously and the
diffracted signals from these grains are monitored on one or more detectors, while rotating the sample
around an axis perpendicular to the beam. In the variant called Diffraction Contrast Tomography
(DCT) only one near field-detector is used [15-17]. DCT has been shown to be a powerful tool for
studies of short cracks, as space-filling 3D maps of grains and grain orientations can be provided and
directly compared to 3D movies of the crack front as it penetrates through the sample [18,19].
However, it is difficult from DCT to derive strain and stress information with sufficient accuracy, and
only samples deformed less than 1 % can be studied.
In the following we focus on a different variant of 3DXRD, where only a far-field detector is used.
Based on such a set-up the centre-of-mass positions, relative volumes, mean orientations and full stress
tensors for each grain within the illuminated volume can be monitored (but not the exact 3D grain
morphologies). In previous of these so-called grain centre mapping experiments the number of mapped
grains were rather limited [20-24], but recent progress has made it possible to map the stress field in a
representative volume within the bulk of a polycrystalline sample by using the individual grains as
probes [25-27]. Notably, the spatial resolution of the stress map is in this case determined by the grain
size and the detector resolution (in terms of pixel size and spatial distortions) rather than by the
dimensions of the incoming X-ray beam.
In this paper we present a far-field type 3DXRD study of the individual grains around a notch in a 0.8
mm thick coarse-grained specimen of the magnesium alloy AZ31. We determine the evolution of the
stress field and the plastic zone (quantified by the rotations of the individual grains) at the notch tip
during in situ tensile loading. The spatial resolution is 30 µm. The 3DXRD stress mapping is
complemented by phase contrast tomography to visualize the crack growth. To our knowledge this is
the first example of a stress map around a crack tip in a coarse grained material where both the sample
4
size and the spatial resolution are of sufficient quality to be technologically relevant, and in fact are
similar to the very best strain scanning experiments on fine-grained materials [5].
2. Experimental
2.1. Sample preparation and characterisation
As sample material the Mg alloy AZ31 was chosen. A continuously cast billet was homogenized for 12
h at a temperature of T = 350 °C. Then the billet was extruded by indirect extrusion with a billet
temperature of TB = 350 °C using a press ratio of R = 25 and a ramp speed of vR = 0.5 mm s-1 resulting
in an extrusion profile with a diameter of 25 mm. From this rod flat samples with 0.8 mm thickness
were machined with the longitudinal axis in the extrusion direction. After machining they were grinded
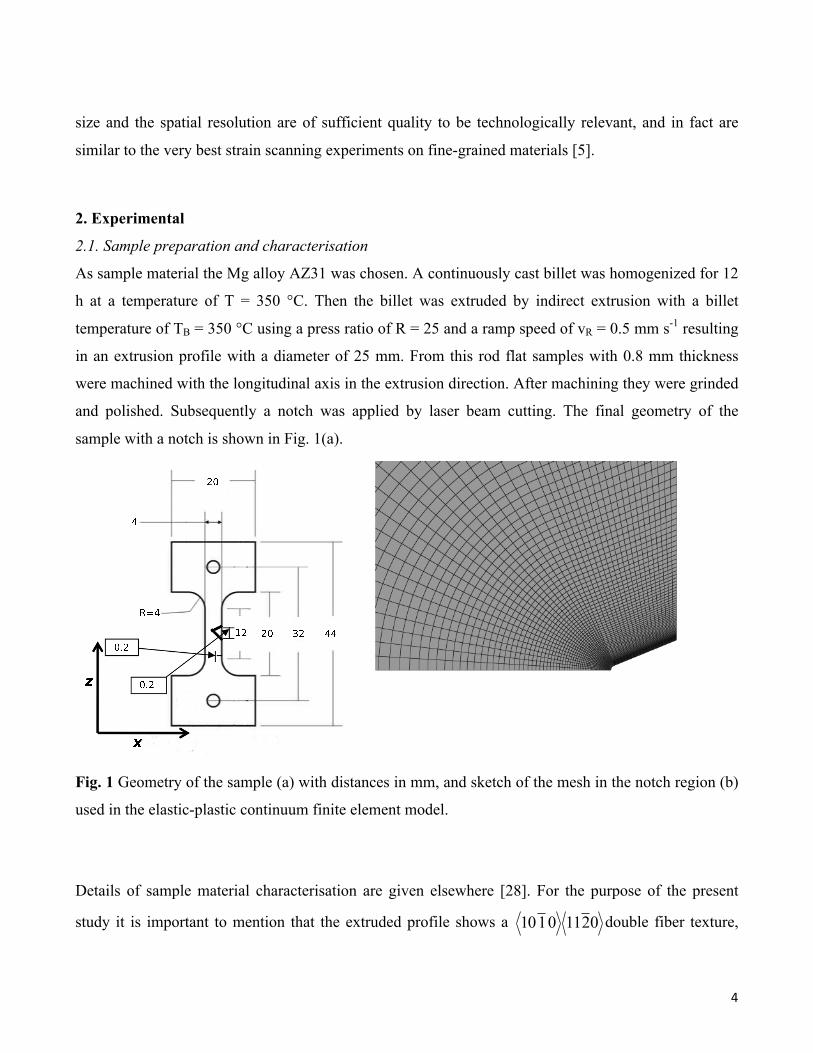
and polished. Subsequently a notch was applied by laser beam cutting. The final geometry of the
sample with a notch is shown in Fig. 1(a).
Fig. 1 Geometry of the sample (a) with distances in mm, and sketch of the mesh in the notch region (b)
used in the elastic-plastic continuum finite element model.
Details of sample material characterisation are given elsewhere [28]. For the purpose of the present
study it is important to mention that the extruded profile shows a 02110110 double fiber texture,

5
and that the microstructure of the profile shows some elongated grains which stem from the cast
structure and some very small dynamically recrystallised grains, whereas the majority of the grains are
statically recrystallised grains that have grown up to a grain size of 50 µm. The macroscopic tensile
stress-strain curve for the sample material is shown in Fig. 2 along with the stress-strain curve from the
synchrotron experiment. The tensile yield strength was determined to 180±3 MPa, the ultimate tensile
strength to 244±3 MPa and the fracture strain to 20±2 %.
Fig. 2 Stress-strain curves for continuous loading and
for the actual experiment. Arrows mark the target
loads for 3DXRD measurements. Above the yield
point the 3DXRD measurements were started after
roughly half of the relaxation.
2.2. Synchrotron experiment
The experiment was carried out at beamline 1-IDC at the Advanced Photon Source at Argonne
National Laboratory using optics and a bandwidth of ΔE/E = 1.2×10⁻³ [29]. The X-ray energy was
calibrated to the Tb K-edge (~52 keV) and continuously monitored by measuring the transmission
through a Tb foil to enable corrections for temporal variations during the data acquisition. Two
detectors were used alternately:
- For 3DXRD a MAR165 (with an active area of 165×165 mm2 and a pixel size of 78.64×78.64
µμm2) was placed at a sample-to-detector distance of 41 cm to enable the detection of the first 10
full Debye-Scherrer rings of Mg.
- For tomography a high-resolution detector with 2048×2048 pixels of 1.4×1.4 µμm2 was placed
on the same rail as the 3DXRD detector.
The sample was mounted in a tension frame with a 445 N (100 lbs) load cell to monitor the
macroscopic stress state. A resistive strain gauge was glued onto the sample face to monitor the
6
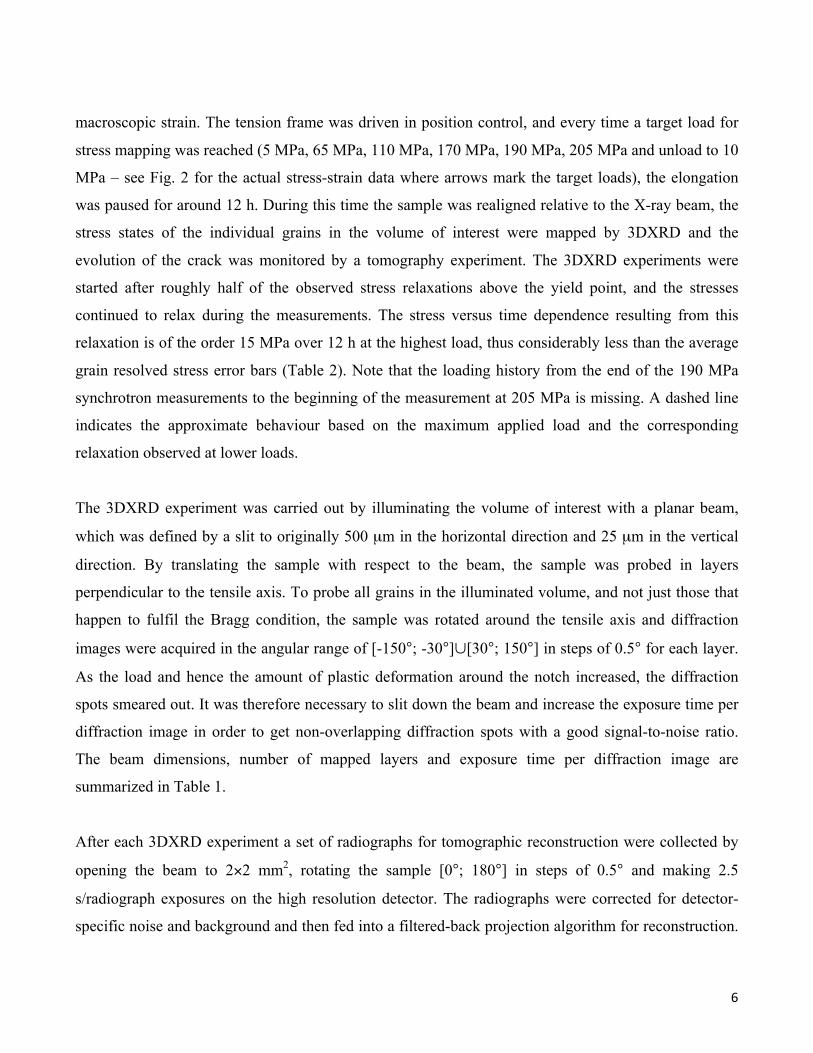
macroscopic strain. The tension frame was driven in position control, and every time a target load for
stress mapping was reached (5 MPa, 65 MPa, 110 MPa, 170 MPa, 190 MPa, 205 MPa and unload to 10
MPa – see Fig. 2 for the actual stress-strain data where arrows mark the target loads), the elongation
was paused for around 12 h. During this time the sample was realigned relative to the X-ray beam, the
stress states of the individual grains in the volume of interest were mapped by 3DXRD and the
evolution of the crack was monitored by a tomography experiment. The 3DXRD experiments were
started after roughly half of the observed stress relaxations above the yield point, and the stresses
continued to relax during the measurements. The stress versus time dependence resulting from this
relaxation is of the order 15 MPa over 12 h at the highest load, thus considerably less than the average
grain resolved stress error bars (Table 2). Note that the loading history from the end of the 190 MPa
synchrotron measurements to the beginning of the measurement at 205 MPa is missing. A dashed line
indicates the approximate behaviour based on the maximum applied load and the corresponding
relaxation observed at lower loads.
The 3DXRD experiment was carried out by illuminating the volume of interest with a planar beam,
which was defined by a slit to originally 500 µm in the horizontal direction and 25 µm in the vertical
direction. By translating the sample with respect to the beam, the sample was probed in layers
perpendicular to the tensile axis. To probe all grains in the illuminated volume, and not just those that
happen to fulfil the Bragg condition, the sample was rotated around the tensile axis and diffraction
images were acquired in the angular range of [-150°; -30°]∪[30°; 150°] in steps of 0.5° for each layer.
As the load and hence the amount of plastic deformation around the notch increased, the diffraction
spots smeared out. It was therefore necessary to slit down the beam and increase the exposure time per
diffraction image in order to get non-overlapping diffraction spots with a good signal-to-noise ratio.
The beam dimensions, number of mapped layers and exposure time per diffraction image are
summarized in Table 1.
After each 3DXRD experiment a set of radiographs for tomographic reconstruction were collected by
opening the beam to 2×2 mm2, rotating the sample [0°; 180°] in steps of 0.5° and making 2.5
s/radiograph exposures on the high resolution detector. The radiographs were corrected for detector-
specific noise and background and then fed into a filtered-back projection algorithm for reconstruction.

7
The reconstructed images were subsequently corrected for ring artefacts [30]. In Fig. 3 the edge-on
radiographs measured at 5 MPa and 205 MPa, which give the best view of the crack propagation, and
the tomographic reconstruction of the non-straight crack front at 205 MPa are shown. From these the
notch opening along z was measured to be 210 µμm up until 110 MPa, 230 µμm at 170 MPa, 235 µμm at
190 MPa, and finally 265 µμm at the maximum load of 205 MPa. At 190 MPa the progression of the
crack front into the sample (towards –x, c.f. the coordinate system in Fig. 1) has just started. The
estimated movement is 30 µμm. At 205 MPa the length of the crack is estimated to be 100 µμm, thus 2-3
grain diameters.
Fig. 3 Edge-on radiographs measured at
(a) 5 MPa and (b) 205 MPa showing the
crack progression in mm along with the
tomographic reconstruction of the
irregular crack front at 205 MPa (c).
Table 1 Details of the 3DXRD experiment. See text for context. Load
[MPa] Beam width
[µμm] Beam height
[µμm] Number of layers Exposure time
[s / image] 5 (d0 reference) 500 25 15 0.5
65 500 25 15 0.5 110 500 25 15 0.5 170 400 20 17 0.5 190 200 10 15 1.5 205 200 10 15 1.8
10 (unload) 200 10 15 1.8
205 MPa
0
y [mm]
x [mm] 0.2
0.2
205 MPa
5 MPa
0.38
0.29 0.21
0.27
(b)
(a)
(c)

8
2.3. Analysis of diffraction data
First, the positions of the diffraction peaks were located. This step was performed using the 2D
peaksearch module from the FABLE suite of programs [31] for the loads 5 MPa, 65 MPa, 110 MPa and
170 MPa. At the higher loads the overlaps due to plastic deformation could only be discerned by
employing the more sophisticated and time consuming 3D peaksearch routine DIGIgrain [32]. The
program GrainSpotter [33] was then used to index the grains, i.e. assign the diffraction spots to oriented
grains, in each illuminated layer. The refinement of the centre-of-mass positions, orientations and full
elastic strain tensors of the indexed grains was performed as a simultaneous 12-parameter-per-grain fit
to the assigned reflections using the FitAllB module of FABLE [25]. The average number of reflections
per grain after the built-in outlier rejections and the convergence of the refinement can be seen in Table
2. The relative grain volumes were estimated based on the intensities of the assigned reflections. The
grain resolved stress tensors were calculated from the strain tensors using the following values for the
stiffness tensor: C11=58.5 GPa, C12=25.0 GPa, C13=20.8 GPa, C33=61.0 GPa, and C44=16.6 GPa [34].
Table 2 Details of the 3DXRD analysis
Load [MPa]
Number of grains
spots/ grain
Average grain resolved error bars 3D
position [µμm]
Relative volume
[%]
Orien-tation
[°]
Stress components Axial [MPa]
Normal [MPa]
Shear [MPa]
5 3268 85 18 19 0.09 11 12-16 4-6 65 2656 85 18 19 0.09 10 11-15 4-6 110 2383 85 17 19 0.08 10 11-14 4-6 170 1750 75 21 20 0.07 11 12-17 5-7 190 207 55 69 14 0.21 45 48-68 17-25 205 99 40 104 20 0.31 67 71-102 25-37 10 132 40 112 28 0.34 73 79-112 28-41
The quality of the grain resolved results obviously depends on the calibration of the global parameters
describing the experimental setup, i.e. the sample-to-detector distance, the position of the beam centre
on the detector, the tilts of the detector face and of the sample rotation stage, the wavelength of the
incident beam and the lattice constants of the undeformed material. All of these parameters were
refined using FitAllB on the indexed grains from the data set collected at a macroscopic load of 5 MPa
9
assuming no residual stress as described previously [25]. 5 MPa was chosen as the reference point to
ensure that the sample was properly gripped. Besides a drift in incident energy of the order ΔE/E = 10-4
over the 4 days it took to do the experiment, the beam centre on the detector was also found to drift
during the entire experiment, presumably because the diffraction detector was moved out of the beam
to make space for the tomography detector occasionally. Both of these effects were corrected for.
Since the average grain size (30 µμm) is larger than the height of the planar beam (25-10 µμm) many
grains were illuminated in more than one layer. This 2D grain information was collected into 3D by
stacking the illuminated layers and matching up the grains with similar positions and orientations
taking into account the relative volumes. At the 5 MPa reference load 3268 such 3D grains were
identified around the initial notch. This corresponds to around 90 % of the grains in the illuminated
volume judging from the number of assigned to observed reflections when taking into account the
beam size relative to the sample thickness. The number of 3D grains that can be followed at the
subsequent loads can be seen in Table 2. Here it should be emphasised that between 170 and 190 MPa
the beam dimensions were halved in both directions, thus the number of grains in the gauge volume
goes down by a factor eight. Grains in the top and bottom layers were kept even though some of these
will be grain fractions rather than entire grains c.f. Fig.4. The error bars on the centre-of-mass grain
positions, volumes, orientations and strain tensors were estimated by FitAllB as described previously
[25]. The average values of these are also summarized in Table 2.
In Fig. 4 the reconstructed grains in the volume of interest in front of the crack are displayed. The grain
maps from different loads have been aligned by minimising the distance between grains found in both
maps, and the initial notch position (x,z)=(0,0) and opening angle have been marked on each map to
illustrate the notch opening and crack propagation. The size of the spheres representing the individual
grains reflects the relative grain volumes. The grains are colour coded according to how much the
crystallographic lattice of each has rotated relative to the initial orientations found at the 5 MPa
reference load. For small deformations like the present 1% the lattice rotation are roughly proportional
to the uptake of plastic deformation in the grain, especially when taking into account the strong
extrusion texture of the sample that minimises the orientation dependence of the lattice rotations
[35,27].

10
2.4. Modelling
A continuum elastic-plastic finite element model of the central part of the test specimen (Fig. 1) has
been built in the commercial finite element code Abaqus [36]. A full 3D model is used in order to
account for the measured transition from the overall plane stress case away from the notch to the
essentially plane strain case near the notch tip. Using the symmetry planes in the transverse direction
through the notch and along the mid plane in the thickness direction, only one quarter of the central
part with the dimension 8x4x0.4mm3 has been modelled using 8-noded brick elements. A uniform
mesh was used in the thickness direction with eight elements meshing half of the thickness. As seen in
Fig. 1(b), a structured concentrated mesh was used in the notch region, while the overall mesh was
unstructured. The notch has through the thickness been modelled using a constant tip radius of 17 µμm.
The magnesium material is modelled using a continuum J2-flow theory with a hardening curve
following the monotonic loading curve in Fig. 2. The hardening curve has been measured up to a strain
!"#$%&%!"#$%&'()#'"*+,(-.%&+.%+'/"+0$1)2"+$3+.%'"("&'+.%+3($%'+$3+'/"+%$'#/+2-(4"*+-'+56768+-'+&"1"#'"*+2-#($&#$9.#+1$-*&:+;/"+&.<"+$3+'/"+&9/"("&+("9("&"%'&+'/"+("1-=0"+,(-.%+0$1)2"&+-%*+'/"+#$1$)(+#$*"+.&+-##$(*.%,+'$+'/"+1->#"+($'-=$%&+("1-=0"+'$+'/"+.%.=-1+?+@A-+1$-*:+;/"+1->#"+($'-=$%+.&+($),/1B+9($9$(=$%-1+'$+'/"+)9'-4"+$3+91-&=#++*"3$(2-=$%+.%+'/"+,(-.%:++
11
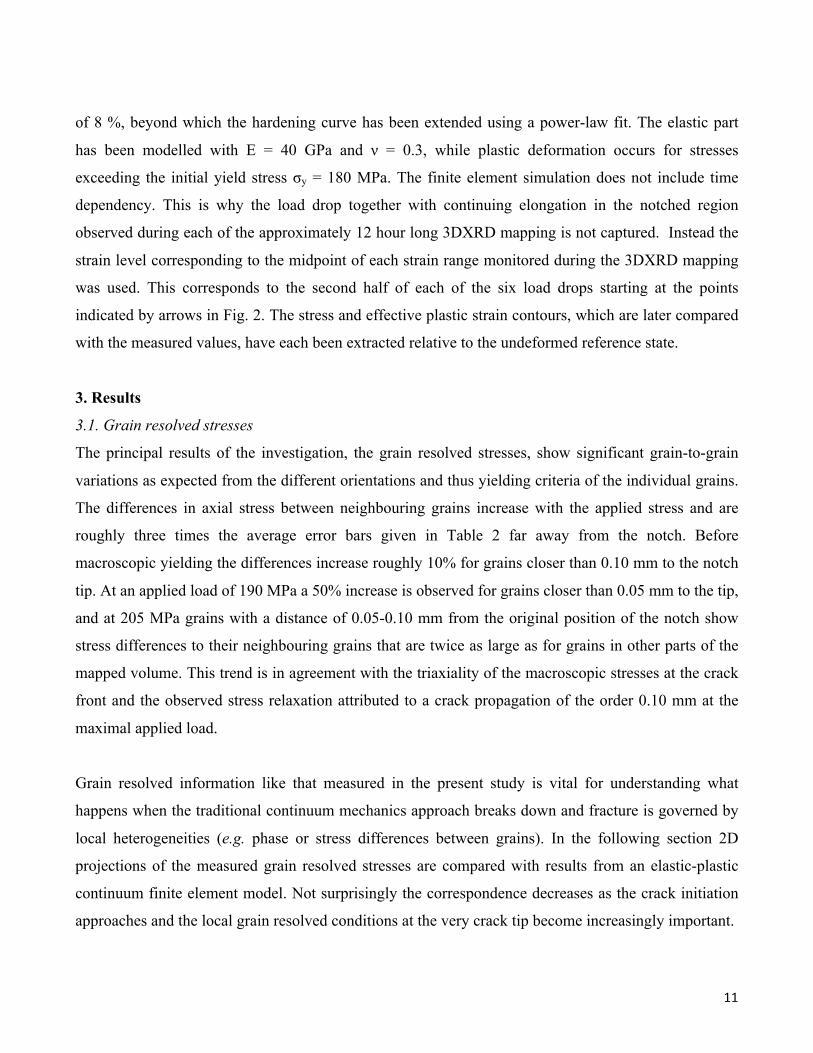
of 8 %, beyond which the hardening curve has been extended using a power-law fit. The elastic part
has been modelled with E = 40 GPa and ν = 0.3, while plastic deformation occurs for stresses
exceeding the initial yield stress σy = 180 MPa. The finite element simulation does not include time
dependency. This is why the load drop together with continuing elongation in the notched region
observed during each of the approximately 12 hour long 3DXRD mapping is not captured. Instead the
strain level corresponding to the midpoint of each strain range monitored during the 3DXRD mapping
was used. This corresponds to the second half of each of the six load drops starting at the points
indicated by arrows in Fig. 2. The stress and effective plastic strain contours, which are later compared
with the measured values, have each been extracted relative to the undeformed reference state.
3. Results
3.1. Grain resolved stresses
The principal results of the investigation, the grain resolved stresses, show significant grain-to-grain
variations as expected from the different orientations and thus yielding criteria of the individual grains.
The differences in axial stress between neighbouring grains increase with the applied stress and are
roughly three times the average error bars given in Table 2 far away from the notch. Before
macroscopic yielding the differences increase roughly 10% for grains closer than 0.10 mm to the notch
tip. At an applied load of 190 MPa a 50% increase is observed for grains closer than 0.05 mm to the tip,
and at 205 MPa grains with a distance of 0.05-0.10 mm from the original position of the notch show
stress differences to their neighbouring grains that are twice as large as for grains in other parts of the
mapped volume. This trend is in agreement with the triaxiality of the macroscopic stresses at the crack
front and the observed stress relaxation attributed to a crack propagation of the order 0.10 mm at the
maximal applied load.
Grain resolved information like that measured in the present study is vital for understanding what
happens when the traditional continuum mechanics approach breaks down and fracture is governed by
local heterogeneities (e.g. phase or stress differences between grains). In the following section 2D
projections of the measured grain resolved stresses are compared with results from an elastic-plastic
continuum finite element model. Not surprisingly the correspondence decreases as the crack initiation
approaches and the local grain resolved conditions at the very crack tip become increasingly important.

12
3.2. Stress fields
2D projections of the measured grain resolved stresses collapsing the sample thickness onto the xz-
plane were made and compared with the simulated contours. The 2D projections were produced on a
10×10 µm2 grid by Laguerre tessellation [37], thus for each grid point the contribution was taken from
the grain for which the distance from grid point to the projected grain centre divided by the grain radius
was smallest. At 65 MPa the volume fraction of contributing grains was 0.85, while this fraction was
increased to 0.97 at 205 MPa where the measured volume was thinner in the y-direction perpendicular
to the projection plane. After the tessellation a 3×3-pixel smoothing was applied. The 2D projections of
selected measured stress tensor components are visualized by colour scaling. The limits are chosen
such as to best display the evolution over the whole load cycle. At higher loads, local extreme stress
values are outside of the chosen limits. The corresponding simulated contours are shown as white lines.
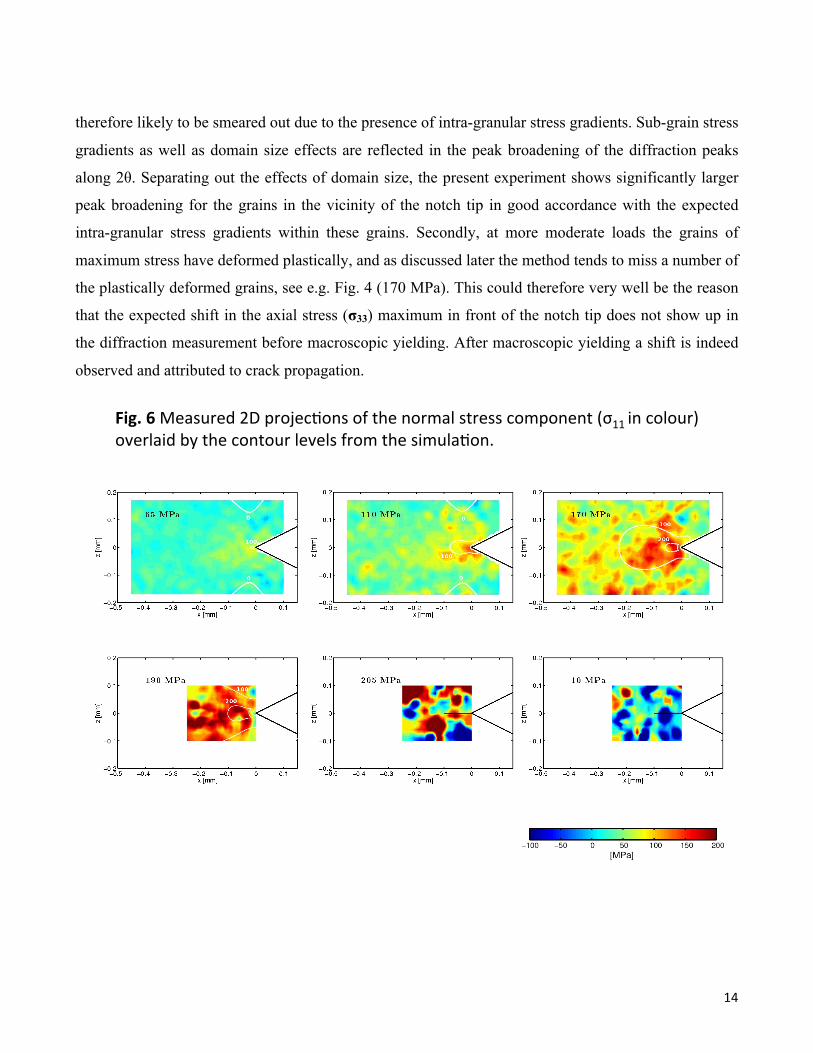
!"#$%&%!"#$%&"'()*(+&,-"./,0$(,1(23"(#45#6($2&"$$(.,7+,0"02(89::(50(.,6,%&;(,<"&6#5'(=>(23"(.,02,%&(6"<"6$(1&,7(23"($57%6#/,0?((((

13
The 2D projection of the stress along the tensile z-axis (σ33) is given in Fig. 5, while Fig. 6 shows the
stress in the direction of crack growth along the x-axis (σ11). For the four load levels before the onset of
crack growth, the measured normal and axial stress fields in Fig. 5 and Fig. 6 have been overlaid with
the stress contours obtained from the elastic-plastic continuum finite element model. Even though the
model was built for a homogeneous material, while the measured stress contours are extracted from a
polycrystalline material measuring the deformation state in each of the individual grains, a reasonable
match can be observed. In particular the simulations support the observation of normal stresses (σ11)
building up in front of the notch, while axial stresses (σ33) build up in a butterfly-shaped contour
around the tip. In the plastic regime the simulated stresses tend to be higher than the measured stresses
in accordance with the stress relaxation observed during the diffraction experiment which results in
reduced stresses relative to the hardening curve used in the simulation (Fig. 2). In the elastic regime the
measured stresses vary more or less continuously, whereas in the plastic regime the fluctuations
increase significantly. This is consistent with the increase in the estimated errors reported in Table 2
and the increased role played by the local grain resolved conditions as the crack initiates. Furthermore,
the y-dimension of the mapped volume is roughly equal to the x-dimension, thus at applied loads of 190
MPa and beyond the grain statistics leading to the projected stress contours on the xz-plane (Fig. 5 and
Fig. 6) are poorer.
At a macroscopic load of 190 MPa all the grains in the mapped volume have yielded and show large
stresses in the x and z-directions. However, at 205 MPa some of the grains immediately in front of the
notch tip display much lower, sometimes even compressive, stresses. This stress relaxation and
accompanying shift in the position of the axial stress (σ33) maximum to be further ahead of the notch
tip is a result of the crack propagation. Upon unloading the stress reversal zone with compressive
stresses can be seen immediately in front of the crack where the tensile stresses were maximum at the
maximum load.
While the simulations predict the position of maximum axial stress (σ33) to move ahead of the notch as
the load is increased in the elastic regime, this shift cannot be measured by 3DXRD. This has two
different plausible explanations. Firstly, at the lower loads the expected shift in stress maximum away
from the notch tip is smaller than the average grain diameter, and the measured stress maximum is
14
therefore likely to be smeared out due to the presence of intra-granular stress gradients. Sub-grain stress
gradients as well as domain size effects are reflected in the peak broadening of the diffraction peaks
along 2θ. Separating out the effects of domain size, the present experiment shows significantly larger
peak broadening for the grains in the vicinity of the notch tip in good accordance with the expected
intra-granular stress gradients within these grains. Secondly, at more moderate loads the grains of
maximum stress have deformed plastically, and as discussed later the method tends to miss a number of
the plastically deformed grains, see e.g. Fig. 4 (170 MPa). This could therefore very well be the reason
that the expected shift in the axial stress (σ33) maximum in front of the notch tip does not show up in
the diffraction measurement before macroscopic yielding. After macroscopic yielding a shift is indeed
observed and attributed to crack propagation.
!"#$%&%!"#$%&"'()*(+&,-"./,0$(,1(23"(0,&4#5($2&"$$(.,4+,0"02(6788(90(.,5,%&:(,;"&5#9'(<=(23"(.,02,%&(5";"5$(1&,4(23"($94%5#/,0>((((
15
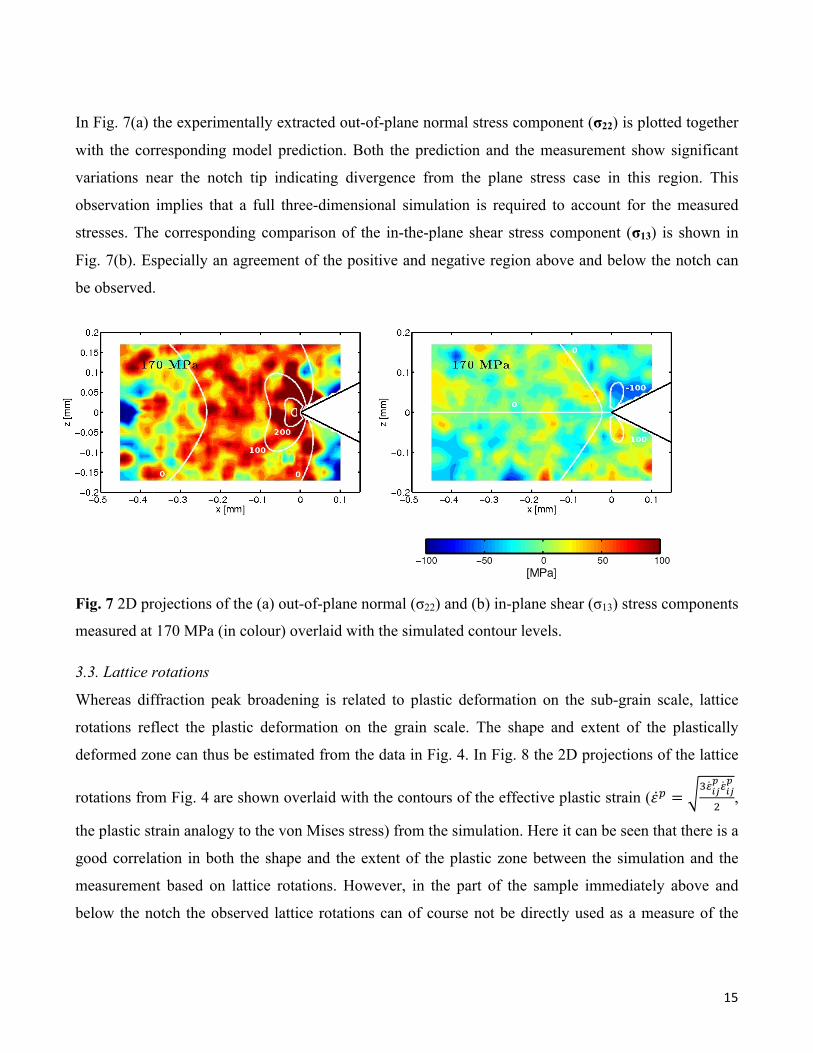
In Fig. 7(a) the experimentally extracted out-of-plane normal stress component (σ22) is plotted together
with the corresponding model prediction. Both the prediction and the measurement show significant
variations near the notch tip indicating divergence from the plane stress case in this region. This
observation implies that a full three-dimensional simulation is required to account for the measured
stresses. The corresponding comparison of the in-the-plane shear stress component (σ13) is shown in
Fig. 7(b). Especially an agreement of the positive and negative region above and below the notch can
be observed.
Fig. 7 2D projections of the (a) out-of-plane normal (σ22) and (b) in-plane shear (σ13) stress components
measured at 170 MPa (in colour) overlaid with the simulated contour levels.
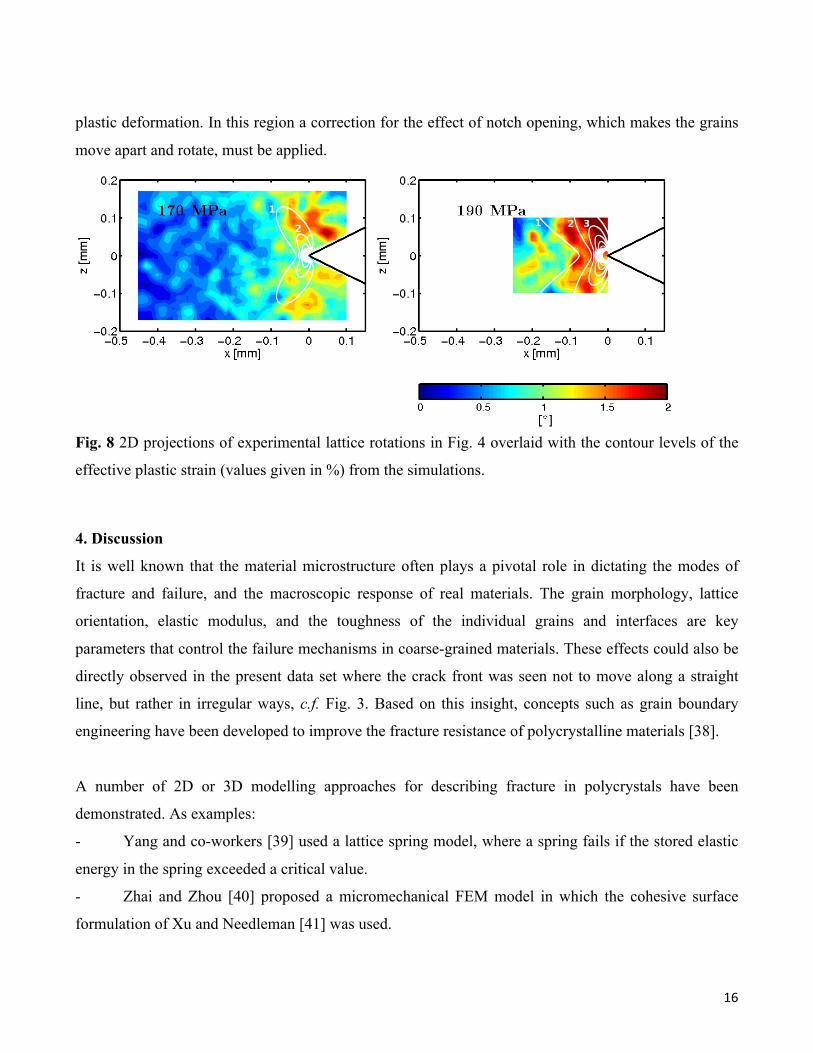
3.3. Lattice rotations
Whereas diffraction peak broadening is related to plastic deformation on the sub-grain scale, lattice
rotations reflect the plastic deformation on the grain scale. The shape and extent of the plastically
deformed zone can thus be estimated from the data in Fig. 4. In Fig. 8 the 2D projections of the lattice
rotations from Fig. 4 are shown overlaid with the contours of the effective plastic strain (!! =!!!"
! !!"!
!,
the plastic strain analogy to the von Mises stress) from the simulation. Here it can be seen that there is a
good correlation in both the shape and the extent of the plastic zone between the simulation and the
measurement based on lattice rotations. However, in the part of the sample immediately above and
below the notch the observed lattice rotations can of course not be directly used as a measure of the
16
plastic deformation. In this region a correction for the effect of notch opening, which makes the grains
move apart and rotate, must be applied.
Fig. 8 2D projections of experimental lattice rotations in Fig. 4 overlaid with the contour levels of the
effective plastic strain (values given in %) from the simulations.
4. Discussion
It is well known that the material microstructure often plays a pivotal role in dictating the modes of
fracture and failure, and the macroscopic response of real materials. The grain morphology, lattice
orientation, elastic modulus, and the toughness of the individual grains and interfaces are key
parameters that control the failure mechanisms in coarse-grained materials. These effects could also be
directly observed in the present data set where the crack front was seen not to move along a straight
line, but rather in irregular ways, c.f. Fig. 3. Based on this insight, concepts such as grain boundary
engineering have been developed to improve the fracture resistance of polycrystalline materials [38].
A number of 2D or 3D modelling approaches for describing fracture in polycrystals have been
demonstrated. As examples:
- Yang and co-workers [39] used a lattice spring model, where a spring fails if the stored elastic
energy in the spring exceeded a critical value.
- Zhai and Zhou [40] proposed a micromechanical FEM model in which the cohesive surface
formulation of Xu and Needleman [41] was used.
17
- Sukumar and co-workers [42] described brittle facture with an extended finite element method,
which uses the notion of partition of unity implying that re-meshing is not required.
Finite element modelling has also been used in a number of cases to determine the stress field in both
mono-phase [43,44] and multi-phase polycrystalline specimens [45] in order to predict crack growth.
The current work is an attempt to provide relevant tools for validating such models.
In our view, the above results demonstrate the potential for stress mapping of materials where the grain
size is comparable to the relevant crack dimensions. The stress resolution is adequate – at least at
applied loads up to the yield point – and the sample dimensions are compatible with characterising
short cracks. Furthermore, the size of the volume characterised provides reasonable grain statistics for
averaging stresses in distances from the crack tip exceeding ~50 µm. The number of grains at the very
crack tip is limited, in the present case to around 20 grains. This number is evidently insufficient for a
detailed quantitative comparison with a continuum model, but it allows for the observation of
symmetries, inhomogeneity and for an approximate comparison of properties such as the “size of the
plastic zone”.
A promising route for future studies would be to include a near-field detector in the set-up, either in a
DCT configuration or in a classical 3DXRD configuration. Similar to the work in [18,19] a space-
filling 3D grain map can then be provided and directly compared to 3D movies of the crack front as it
penetrates through the sample. In combination with the technique introduced in this article the result
would be a very comprehensive characterisation of the influence of the grain scale heterogeneity on the
fracture dynamics. Other relevant generalisations include:
- Simultaneous measurements of the plastic strain by tracking of the centre-of-mass positions of
the individual grains. Alternatively by tracking of embedded marker particles, such as second phase
particles, by tomography [46-51].
- Work on multiphase materials. The software introduced above can be run iteratively, one phase
at the time to give the stress distribution in both matrix and individual reinforcing fibres as a coarse-
grained analogy to e.g. work by the Manchester group [11,52].
- Combined diffraction and tomography studies where the grain resolved information can be
complemented by information about crack debris, closure (for cyclic fatigue), crack deflection at
18
reinforcements or void coalescence for a complete 3D crack tip microscopy [8].
- A more detailed characterisation of the grains at the very crack tip, e.g. in terms of dislocation
content [53] or intra-grain stress distribution [54].
The main limitation of the technique relates to the azimuthal broadening of the diffraction spots with
increasing plastic deformation. This is the reason that the fraction of initially identified grains that are
observed also at 170 MPa and at 205 MPa are 85% and 47%, respectively. More specifically we may
distinguish between two effects: an increasing amount of overlapping spots and the fact that the signal-
to-noise ratio deteriorates when the diffraction spot is spread over many more pixels on the detector.
The latter (and more frequent) case either implies that the diffraction spot completely vanishes after
setting an intensity threshold – and hence no reflection is observed – or that the centre-of-mass
determination of the diffraction spot is flawed. There are several remedies to this problem. The spot
overlap can be reduced by reducing the beam size and/or by placing optical elements like a conical [55]
or spiral slit [56] between the sample and the (far-field) detector. The conical or spiral slit may define a
3D gauge volume of say 20x20x200 µm3 within the sample. More generally the centre-of-mass
approach of this paper – where each diffraction spot is associated only with a centre-of-mass position –
may be replaced by a description in terms of a high-resolution orientation distribution function [57].
This would not only enable tracking of grains to larger strains, but may also be a step in direction of
measuring intra-grain stresses.
5. Conclusions
The present study represents an important step towards understanding the mechanisms governing crack
growth in coarse-grained materials, namely the application of the recently matured far-field 3DXRD
technique to measure the grain resolved stresses around a notch in a coarse-grained specimen during in
situ deformation. Tomography and elastic-plastic continuum finite element simulations complemented
the diffraction measurements. Substantial stress variations between neighbouring grains, an irregular
crack front and local deviations from the continuum model after crack initiation was observed,
illustrating the importance of taking the local grain information into account in a thorough mechanical
description. The evolution of the stress field and plastic deformation zone (as described qualitatively in
terms of lattice rotations of individual grains) was determined from the diffraction experiment with a

19
spatial resolution of 30 µm (the grain size). The measurement clearly showed a concentration of tensile
stresses in the out-of-plane stress component near the notch tip indicating a divergence from the
expected plane stress case in this region, which was consequently implemented in the simulations. The
measured and simulated stress contours were shown to be in good agreement except at the highest
applied load where a stress relaxation at the notch tip was observed in the experimental data. This stress
relaxation is attributed to the initiation and propagation of a crack that was also observed with
tomography. Future prospects in complementing the diffraction experiments by high-resolution
tomography to study plastic flow or multiphase materials, by more localised studies of sub-grains at the
very crack front and by crystal plasticity finite element simulations have been presented and discussed
with the aim to obtain a more comprehensive understanding of crack growth in coarse-grained
materials.
Acknowledgements
JO gratefully acknowledges funding from the German Bundesministerium für Bildung und Forschung,
while SS, HOS and HFP acknowledge the Danish Research Foundation for supporting the Center for
Fundamental Research: Metal Structures in Four Dimensions. Use of Advanced Photon Source was
supported by the U.S. Department of Energy, Offices of Basic Energy Sciences, under Contract No.
DE-AC02-06CH11357. The Danish Research Council is acknowledged for covering expenses in
relation to the synchrotron experiment (via Danscatt). Peter Kenesei, APS 1-ID, is thanked for
providing the DIGIgrain 3D peaksearch software and user support. Erik Mejdal Lauridsen, Risø DTU,
is thanked for assistance in reconstructing the tomographic data.
20
References
[1] Sun Y, Choo H, Liaw PK, Lu Y, Yang B, Brown DW, Bourke MAM. Scripta Mater 2005;53:971.
[2] Lee SY, Sun Y, An K, Choo H, Hubbard CR, Liaw PK. J Appl Phys 2010;107:023517.
[3] Croft M, Zhong Z, Jisrawi N, Zakharchenko I, Holtz RL, Skaritka J, Fast T, Sadananda K,
Lakshmipathy M, Tsakalakos T. Inter J Fatigue 2005;27:1408.
[4] Croft M, Shukla V, Jisrawi NM, Zhong Z, Sadangi RK, Holtz RL, Pao PS, Horvath K, Sadananda
K, Ignatov A, Skaritka J, Tsakalakos T. Inter J Fatigue 2009;31:1669.
[5] Steuwer A, Rahman M, Shterenlikht A, Fitzpatrick ME, Edwards L, Withers PJ. Acta Mater,
2010;58:4039.
[6] Kerr M, Daymond MR, Holt RA, Almer JD. Acta Mater 2010;58:1578.
[7] Steuwer A, Daniels JE. J Strain Analysis 2011;46:593.
[8] Withers PJ. Adv Eng Mater 2011;13:1096.
[9] Sinclair R, Preuss M, Maire E, Buffière J-Y, Bowen P, Withers PJ. Acta Mater 2004;52:1423.
[10] Steuwer A, Edwards L, Pratihar S, Ganguly S, Peel M, Fitzpatric ME, Marrow, TJ, Withers PJ,
Sinclair I, Singh KD, Gao N, Buslaps T, Buffière J-Y. Nucl Instrum Meth Phys Res B
2006;246:217.
[11] Hung Y-C, Bennett JA, Garcia-Pastor FA, Di Michiel M, Buffière J-Y, Doel TJA, Bowen P,
Withers PJ. Acta Mater 2009;57:590.
[12] Reimers W, Pyzalla A, Schreyer AR, Clemens H. Neutron and Synchrotron Radiation in
Engineering Materials Science, Weinheim: Wiley VCH; 2008.
[13] Kelleher JF, Lopez-Crespo P, Yusof F, Withers PJ. Mater Sci Forum 2010;652:216.
[14] Poulsen HF. Three-Dimensional X-ray Diffraction Microscopy. Berlin: Springer; 2004.
[15] Ludwig W, Schmidt S, Lauridsen EM, Poulsen HF. J Appl Cryst 2008;41:302.
[16] Johnson G, King A, Honnicke MG, Marrow J, Ludwig W. J Appl Cryst 2008;41:310.
[17] Ludwig W, Reischig P, King A, Herbig M, Lauridsen EM, Johnson G, Marrow TJ, Buffière J-
Y. Rev Sci Instrum 2009;80:033905.
[18] King A, Johnson G, Engelberg D, Ludwig W, Marrow J. Science 2008;321:382.
[19] Herbig M, King A, Reischig P, Proudhon H, Lauridsen EM, Marrow J, Buffière J-Y, Ludwig
W. Acta Mater 2011;59:590.

21
[20] Martins RV, Margulies L, Schmidt S, Poulsen HF, Leffers T. Mater Sci Eng A 2004;387-
379:84.
[21] Aydiner CC, Bernier JV, Clausen B, Lienert U, Tomé CN, Brown DW. Phys Rev B
2009;80:024113.
[22] Lienert U, Brandes MC, Bernier JV, Weiss J, Shastri SD, Mills MJ, Miller MP. Mater Sci Eng
A 2009;524:46.
[23] Edminston JK, Barton NR, Bernier JV, Johnson GC, Steigmann DJ. J Appl Cryst 2011;44:299.
[24] Bernier JV, Barton NR, Lienert U, Miller MP. J Strain Analysis 2011;46:527.
[25] Oddershede J, Schmidt S, Poulsen HF, Sørensen HO, Wright J, Reimers W. J Appl Cryst
2010;43:539.
[26] Oddershede J, Schmidt S, Poulsen HF, Reimers W. Mater Sci Forum 2010;652:63.
[27] Oddershede J, Schmidt S, Poulsen HF, Margulies L, Wright J, Moscicki M, Reimers W,
Winther G. Mater Char 2011;62:651.
[28] Huppman M, Reimers W. Int J Mater Res 2010;101:1264.
[29] Shastri SD. J Synchr Rad 2004;11:150.
[30] Lyckegaard A, Johnson G, Tafforeau P. Int J Tomography Stat 2011;18:1.
[31] http://sourceforge.net/apps/trac/fable/wiki
[32] Kenesei P. http://sourceforge.net/projects/digigrain/
[33] Schmidt S. 2011 preprint.
[34] Hosford WF. The Mechanics of Crystals and Textured Polycrystals. Oxford University Press;
1993.
[35] Winther G, Margulies L, Schmidt S, Poulsen HF. Acta Mater 2004;52:2863.
[36] Abaqus/Standard 6.11. Abaqus Users’ Manual. Available from www.simulia.com; 2011.
[37] Lyckegaard A, Lauridsen EM, Ludwig W, Fonda RW, Poulsen HF. Adv Eng Mater
2011;13:165.
[38] Watanabe T. Mater Sci Eng A 1994;176:39.
[39] Yang WH, Srolovitz DJ, Hassold GN, Anderson MP. Microstructural effects in the fracture of
brittle materials, in: Anderson MP, Rollett AD (Eds.). Simulation and Theory of Evolving
Microstructures, The Metallurgical Society: Warrendale, PA; 1990.
22
[40] Zhai J, Zhou M. Finite element analysis of micromechanical failure modes in a heterogeneous
ceramic material system. Int J Fracture 2000; 101:161.
[41] Xu X-P, Needleman A. Numerical simulations of fast crack growth in brittle solids. J Mech
Phys Solids 1994;42:1397.
[42] Sukumar N, Srolovitz DJ, Baker TJ, Prevost J-H. Int J Numer Meth Eng 2003;56:2015.
[43] Proudhon H, Forest S, Ludwig W. Proceedings of the 31st Risø International Symposium on
Materials Science, 2010.
[44] Proudhon H, Basseville S. Eng Fracture Mech 2011;78:685.
[45] Moon RJ, Hoffman M, Rödel J, Tochino S, Pezzotti G. Acta Mater 2009;57:570.
[46] Nielsen SF, Poulsen, HF, Beckmann F, Thorning C, Wert, J. Acta Mater 2003;51;2407.
[47] Toda H, Sinclair I, Buffiere JY, Maire E, Connolley T, Joyce M, Khor KH, Gregson P. Phil
Mag 2003; 83;2429.
[48] Toda H, Maire E, Aoki Y, Kobayashi M. J Strain Analysis 2011;46:549.
[49] Rannou J, Limodin N, Rethore J, Gravouil A, Ludwig W, Baietto-Dubourg M-C, Buffiere J-Y,
Combescure A, Hild F, Roux S. Comput Methods Appl Mech Engrg 2010;199:1307.
[50] Limodin N, Rethore J, Buffiere J-Y, Hild F. Roux S, Ludwig W, Rannou J, Gravouil A. Acta
Mater 2010;58:2957.
[51] Limodin N, Rethore J, Buffiere J-Y, Hild F. Ludwig W, Rannou J, Roux S. Adv Eng Mater
2011;13:186.
[52] Withers PJ, Bennett JA, Kuroda M. Acta Mater 2010;58:6090.
[53] Jakobsen B, Poulsen HF, Lienert U, Almer J, Shastri S, Sørensen HO, Gundlach C, Pantleon W.
Science 2006;312:889.
[54] Ludwig W, Reischig P, King A, Herbig M, Proudhon H, Buffiere JY, Rutishauser S, David C.
Proceedings of the 31st Risø International Symposium on Materials Science, 2010.
[55] Martins RV, Lienert U, Margulies L, Pyzalla A. J Neutron Res 2001;2-4:249.
[56] Martins RV, Honkimäki V. J Neutron Res 2003;4:277.
[57] Schmidt S, Gade-Nielsen NF, Høstergaard M, Dammann B, Kazantsev IG. Proceedings of
ICOTOM 16, Mater Sci Forum 2012, accepted.