mechanical characterization of therapeutic cells and
TRANSCRIPT
Mechanical Characterization of Therapeutic Cells and
Physical Property-based Sorting in Microfluidic Systems
By
Mingming Du
A thesis submitted to The University of Birmingham
For the degree of DOCTOR OF PHILOSOPHY
School of Chemical Engineering The University of Birmingham
United Kingdom
April 2017
University of Birmingham Research Archive
e-theses repository This unpublished thesis/dissertation is copyright of the author and/or third parties. The intellectual property rights of the author or third parties in respect of this work are as defined by The Copyright Designs and Patents Act 1988 or as modified by any successor legislation. Any use made of information contained in this thesis/dissertation must be in accordance with that legislation and must be properly acknowledged. Further distribution or reproduction in any format is prohibited without the permission of the copyright holder.
Abstract
I
Abstract
Bone marrow-derived mesenchymal and hematopoietic stem cells (MSCs and HSCs)
have rapidly become the leading cells for consideration to aid tissue regeneration
following injury. T cell therapy has also generated significant interest clinically for a
different class of diseases. However, potential HSCs and MSCs migration to the injured
tissue after infusion is impeded by cell trap within the upstream vessels, where physical
and mechanical properties of cells play an important role. Pre-treating murine HSCs with
inflammatory cytokines has previously been shown to significantly enhance their
adhesion to injured tissues compared to pre-treatment of the cells with phosphate
buffered saline (PBS) as control. In T cell therapy, the separation of Ag-specific T cells is
challenging, which is considered to be a limiting step.
Microfluidic system has a potential to sort cells/particles based on their mechanical
properties. It is hypothesized that such sorting system could be utilized to separate
smaller and more deformable SCs from a cell population, infusion of which might be
able to enhance the recruitment of the cells. It is also proposed that microfluidic device
can be potentially utilized to separate Ag-specific T cells if activated T cells obtain
different biophysical and mechanical properties from those before activation.
The mechanical properties of murine HSCs were determined and compared to murine
blood neutrophils and also to murine MSCs using micromanipulation and atomic force
microscopy (AFM). Moreover, the biomechanical changes of CD8+ T cells following
antigen (Ag)-induced stimulation were measured. Straight and curved Microfluidic
devices were fabricated to separate sub-set of HSCs, followed by the infusion of the
isolated cells into ischemia-reperfusion injured animals.

Abstract
II
It has been found that HSCs and MSCs were larger in size compared to blood neutrophils.
Neutrophils and HSCs could be compressed to rupture, while MSCs did not demonstrate
obvious rupture force in micromanipulation compression. Both nominal rupture stress
and tension, indicative of the cellular mechanical strength, was significantly greater for
neutrophils when compared to HSCs. The Young’s modulus values calculated based on
the force versus displacement data up to a nominal deformation of 60% determined by
micromanipulation for neutrophils, HSCs and MSCs were 24.0 ± 1.8 kPa, 18.1 ± 1.3 kPa
and 15.6 ± 1.2 kPa respectively. HSCs as a whole became weaker and more deformable
after pre-treatment with SDF-1α and H2O2, but HSC surface stiffened after the same pre-
treating, accompanied by the expansion and polymerization of F-actin interacting with
the plasma membrane. A spiral microfluidic system with channel width 300 μm and
height 40 μm was found to effectively isolate smaller and more deformable HSCs from a
cell population, resulting in a significant increase of free flowing cells in vivo. Moreover,
a preliminary study of CD8+ T cells showed unique biomechanical changes of activated T
cells which may be utilized as a marker in future separation of the cells in microfluidic
systems.
This study comprehensively characterized cell mechanics at different levels using
micromanipulation and AFM, determining mechanical markers of therapeutic cells.
Most importantly, a simple cell sorting system was successfully developed to isolate
target cells without introducing any chemical modification, and the possible underlying
mechanism was discussed, which can be valuable to cellular therapy.

Acknowledgement
III
Acknowledgement
My greatest thanks must go to Professor Zhibing Zhang for his invaluable guidance,
advice and patience, without which this work would not have been done. I must also
thank Dr Neena Kalia for her effort and time, especially her support in improving my
writing and presentation skills. Dr Dean Kavanagh’s contribution to this project is
irreplaceable, and I appreciate his sense of humour which often made things amusing.
I also would like to thank Dr Frederick Chan and Mr Guido Frumento from the Institute
of Immunology and Immunotherapy for their guidance and collaboration in the project.
I am grateful to the people in the labs, both in the School of Chemical Engineering and
Institute for Biomedical Research. My thanks go to Mr Teddy Liu, Dr James Bowen and
Mr Alessandro Di Maio for their training and help in using various instruments, Professor
Colin Thomas for his constructive suggestions, and Dr Yan Zhang for his well-
experienced insights into PhD studies. And all the other excellent colleagues in the
Group of Micromanipulation for their hands-on help and support, including Javier
Marques De Marino, Bingyu Zhuo, Tom Simons, Xiaotong Zhang, Cong Sui and Andrew
Grey.
Ultimately, I want to express my immense love for my family for their spiritual
understanding and support, which keep me going throughout everything.
Content
IV
Content
Abstract ......................................................................................................................... I Acknowledgement ..................................................................................................... III Content ...................................................................................................................... IV List of Figures ............................................................................................................. IX List of Tables ............................................................................................................. XII Nomenclature .......................................................................................................... XIII
Chapter 1 ............................................................................................................................. 1
General Introduction and Literature Survey ............................................................... 1 1.1 Stem Cells for Regenerative Medicine ......................................................................... 2 1.2 Bone Marrow-derived Adult Stem Cells ...................................................................... 3
1.2.1 Haematopoietic Stem Cells ............................................................................... 3 1.2.2 Mesenchymal Stem Cells .................................................................................. 6
1.3 Using HSCs and MSCs for Regenerative Purposes ....................................................... 6 1.3.1 Mechanisms of HSC and MSC Mediated Tissue Repair .................................... 6 1.3.2 Mechanisms of Transplanted HSC and MSC Recruitment to Sites of Tissue Injury ........................................................................................................................... 8 1.3.3 Current Challenges in Stem Cell Recruitment for Tissue Repair..................... 10
1.3.3.1 Pulmonary Entrapment of Stem Cells .................................................. 10 1.3.3.2 Cell Deformability – an Important Determinant of Efficient Stem Cell Homing .............................................................................................................. 11
1.3.4 Strategies for Enhancing Stem Cell Recruitment Following Injury ................. 13 1.4 Mechanical Property of Living Cells ........................................................................... 14
1.4.1 Cell Mechanics and the Cytoskeleton ............................................................. 14 1.4.2 Techniques for Measuring Cell Mechanics ..................................................... 15
1.4.2.1 Micropipette Aspiration ....................................................................... 18 1.4.2.2 Atomic Force Microscopy (AFM) ......................................................... 18 1.4.2.3 Micromanipulation Technique............................................................. 22
1.5 Label-free Cell Separation in Microfluidic Systems ................................................... 24 1.5.1 Introduction .................................................................................................... 24 1.5.2 Passive Cell Separation Techniques ................................................................ 25 1.5.3 Microfluidic Separation Based on the Inertial Effect ...................................... 30
1.5.3.1 Physics of Inertial Migration ................................................................ 31 1.5.3.2 Inertial Migration in Straight Rectangular Microfluidic Channels ....... 32 1.5.3.3 Inertial Migration in Curved Microfluidic Channels - Dean Secondary Flow ................................................................................................................... 35 1.5.3.4 Inertial Focusing of Deformable Particles ............................................ 37
1.6 Adoptive T cell Therapy.............................................................................................. 39 1.6.1 Procedure and Challenges of T Cell-Based Therapy ....................................... 39

Content
V
1.6.2 Potential Use of Microfluidic Systems in Isolation of Antigen-Specific T cells 40 1.7 Summary .................................................................................................................... 40 1.8 Aims and Hypotheses ................................................................................................. 43 1.9 Outline of the thesis ................................................................................................... 45 Chapter 2 ........................................................................................................................... 47
Materials and Methods ............................................................................................. 47 2.1 Introduction ............................................................................................................... 48 2.2 Preparation of the Different Cell Types ..................................................................... 50
2.2.1 Haematopoietic Stem Cells –Immortalised HPC-7 Cell Line ........................... 50 2.2.2 Culture of the Murine HSC Cell Line, HPC-7s .................................................. 50 2.2.3 Isolation and Expansion of Murine Bone Marrow-derived MSCs .................. 51 2.2.4 Isolation of Murine Neutrophils ...................................................................... 52 2.2.5 Pre-treatment of HPC-7’s Using SDF-1α, KC and H2O2 ................................... 52 2.2.6 Isolation, Culture and in vitro Activation of Human T lymphocytes ............... 53
2.3 Calibration of Micromanipulation System ................................................................. 54 2.3.1 Introduction of the Micromanipulation Rig .................................................... 54 2.3.2 Calibration of Force Transducer Sensitivity .................................................... 54 2.3.3 Calibration of Image Size on the TV Screen .................................................... 55 2.3.4 Calibration of Compression Speed .................................................................. 56
2.4 Measurement with the Micromanipulation Technique ............................................ 56 2.4.1 Experimental Procedure to Compress Cells to Rupture ................................. 56 2.4.2 Determination of Mechanical Property Parameters from Micromanipulation Data ........................................................................................................................... 58
2.4.2.1 Young’s Modulus .................................................................................. 58 2.4.2.2 Nominal Rupture Stress and Nominal Rupture Tension ...................... 59
2.4.3 Compression/Holding Experiments ................................................................ 60 2.4.4 Statistical Analysis of Data from Micromanipulation Compression ............... 60
2.5 AFM Measurement Procedures ................................................................................. 60 2.5.1 AFM Instrument .............................................................................................. 60 2.5.2 Procedure of Force Scanning on Cell Sample with AFM ................................. 61 2.5.3 Calculation of Young’s Modulus of the Cell Membrane as Determined by AFM................................................................................................................................... 63
2.6 Analysis of F-actin with Flow Cytometry and Confocal Microscopy .......................... 63 2.7 Microfluidic System Preparations and Cell Sorting Procedures ................................ 64
2.7.1 Design Principles of Microfluidic Devices ....................................................... 64 2.7.2 Fabrication of Microfluidic Devices ................................................................ 65 2.7.3 Preparations of Microfluidic Systems ............................................................. 66 2.7.4 Cell Sorting Procedures ................................................................................... 68 2.7.5 Mechanical Analysis of Harvested Cells .......................................................... 68 2.7.6 Cell Viability Assay ........................................................................................... 68
2.8 Animal Experimental Procedures............................................................................... 69 2.8.1 HPC-7 Culture, Separation and Labelling ........................................................ 69 2.8.2 Animals ............................................................................................................ 69
Content
VI
2.8.3 Intestinal IR Injury Model ................................................................................ 70 2.8.4 Intravital Microscopy and Tracking of HPC-7s in vivo..................................... 70
Chapter 3 ........................................................................................................................... 72
Mechanical Characterization of Neutrophils, HSCs and MSCs Using Micromanipulation and AFM .................................................................................... 72
3.1 Introduction ............................................................................................................... 73 3.1.1 Hypothesis ....................................................................................................... 75
3.2 Methods ..................................................................................................................... 75 3.2.1 Cell Samples .................................................................................................... 75 3.2.2 Compression of Single Cells with Micromanipulation .................................... 76 3.2.3 Probing of Cells with AFM ............................................................................... 76 3.2.4 Calculation of Mechanical Property Parameters ............................................ 76 3.2.5 Flow Cytometry and Fluorescent Confocal Assay ........................................... 77
3.3 Results - Mechanical Properties of Cells Corresponding to Large Deformations as Determined Using Micromanipulation ............................................................................. 77
3.3.1 Size of Neutrophil, HPC-7 and MSC after Pre-treatment with Inflammatory Factors as Determined by Micromanipulation ......................................................... 77 3.3.2 Neutrophils and HPC-7s Share Similarities in the Force-displacement Curves Generated during Micromanipulation Compression ................................................ 78 3.3.3 Mechanical Properties of Different Cell Types ............................................... 82
3.3.3.1 Nominal Rupture Stress and Tension of HPC-7s is Less Than Neutrophils ....................................................................................................... 82 3.3.3.2 Young’s Modulus of HPC-7s & MSCs Determined using the Data up to Large Deformations .......................................................................................... 84 3.3.3.3 Compression/holding Curves of Neutrophils, HPC-7s and MSCs at Different Deformations ..................................................................................... 84
3.3.4 Mechanical Properties of HPC-7 Cells after SDF-1, H2O2 or KC Pre-treatment................................................................................................................................... 88
3.3.4.1 Rupture Force and Nominal Rupture Stress/tension Decreases with SDF-1α and H2O2 pre-treatment ....................................................................... 88 3.3.4.2 Young’s Modulus of HSCs Determined from Data up to Large
Deformations Decreases with SDF-1 and H2O2 Pre-treatment ...................... 88 3.3.4.3 Compression/holding Curves of Pre-treated HPC-7s at Different Deformations .................................................................................................... 89
3.4 Results - Mechanical Properties of HSCs Corresponding to Small Deformations as Determined Using AFM ..................................................................................................... 92
3.4.1 Force Mapping Mode of AFM Identifies Relatively Flat Regions on the Spherical HPC-7 Cell Surface ..................................................................................... 92
3.4.2 Young’s Modulus of HPC-7s at Small Deformations Increases with SDF-1 and H2O2 Pre-treatment .................................................................................................. 93
3.5 Pre-treatment of HPC-7s with SDF-1 and H2O2 Induced Polymerization and Reorganization of F-actin .................................................................................................. 94

Content
VII
3.6 Mechanical Properties of Microcapsules Measured by AFM and Micromanipulation Confirms the Reliability of These Techniques for Cells..................................................... 99 3.7 Discussion .................................................................................................................. 102
3.7.1 Mechanical Properties as Determined by Micromanipulation Studies ........ 103 3.7.2 Why MSCs Do not Demonstrate Rupture ..................................................... 107 3.7.3 Mechanical Properties as Determined by AFM Studies ............................... 109 3.7.4 Mechanical Properties of Pre-treated Cells .................................................. 109
3.8 Conclusions .............................................................................................................. 112 Chapter 4 ......................................................................................................................... 113
HSC Sorting with Microfluidic Systems ................................................................... 113 4.1 Introduction ............................................................................................................ 114 4.2 Materials and Methods ............................................................................................ 119
4.2.1 Fabrication of Microfluidic Chips .................................................................. 119 4.2.2 Cell Sorting Procedures ................................................................................. 119 4.2.3 Cell Viability Assay ......................................................................................... 119 4.2.4 Mechanical Testing of Cells after Sorting Using Micromanipulation ........... 120 4.2.5 Surgical Preparation to Induce Intestinal IR Injury in Mice .......................... 120 4.2.6 Intravital Imaging of the Mucosal Surface of the IR Injured Small Intestine 120
4.3 Results ...................................................................................................................... 123 4.3.1 Geometry Characterization of Microfluidic Devices ..................................... 123 4.3.2 Effect of Culture Condition on the Mechanical Strength of HPC-7s ............. 123 4.3.3 HPC-7s Demonstrate a Wide Variation in Nominal Rupture Stress but not Size Suggesting a Heterogeneity in Their Mechanical Properties ................................. 127 4.3.4 Performance of the Two Straight Microchannel Devices ............................. 129
4.3.4.1 Separation Efficiency Using the Straight Microchannel Device A with AR = 5 .............................................................................................................. 129 4.3.4.2 Separation Efficiency Using the Straight Microchannel Device B with AR =10 ............................................................................................................. 130
4.3.5 Performance of The Three Spiral Microchannel Devices ............................. 134 4.3.5.1 Determination of Velocity Limit and Cell Number Distribution for Spiral Devices ............................................................................................................ 134 4.3.5.2 Separation Efficiency Using the Spiral Microchannel Device C with AR=7.5 and Curvature Ratio θ=0.0044 ........................................................... 135 4.3.5.3 Separation Efficiency Using the Spiral Microchannel Device D with AR=5 and Curvature Ratio θ=0.0063 .............................................................. 136 4.3.5.4 Separation Efficiency Using the Spiral Microchannel Device E with AR=3.75 and Curvature Ratio θ=0.0079 ......................................................... 136
4.3.6 Summary of Separation Efficiency of all Devices .......................................... 142 4.3.7 Relationship Between Size and Nominal Rupture Stress (σR) for Cell Populations before and after Separation Using Device C....................................... 144 4.3.8 Viability of Cells ............................................................................................. 145 4.3.9 Intravital Micorscopy to Assess the Trafficking of HPC-7 Isolated Using Device C .............................................................................................................................. 148
Content
VIII
4.3.9.1 More Free Flowing HPC-7s Harvested from the Inner Outlet Observed than from the Outer Outlet ............................................................................ 148 4.3.9.2 Adhesion of HPC-7s Harvested from the Inner and Outer Outlets was not Different ................................................................................................... 148 4.3.9.3 Presence of HPC-7s Harvested from the Inner and Outer Outlets was not Different in the Lungs ............................................................................... 149
4.4 Discussion ................................................................................................................. 153 4.4.1 Separation of HSCs Using Straight Channels ................................................ 153 4.4.2 Separation of HSCs Using Spiral Channels .................................................... 157 4.4.3 Intravital Studies ........................................................................................... 161
4.5 Conclusions .............................................................................................................. 165 Chapter 5 ......................................................................................................................... 167
Biomechanical properties of human T cells ............................................................ 167 5.1 Introduction ............................................................................................................. 168 5.2 Methods ................................................................................................................... 170
5.2.1 Isolation, Culture and in vitro Activation of T lymphocytes ......................... 170 5.2.2 Diametric Compression with Micromanipulation Technique ....................... 170 5.2.3 Determination of Activation-related Changes in Cell Size ............................ 170 5.2.4 Determination of Mechanical Property Parameters .................................... 171 5.2.5 Statistical Analysis ......................................................................................... 171
5.3 Results ...................................................................................................................... 172 5.3.1 Activation of CD8+ T Lymphocytes Increases their Cell Size ........................ 172 5.3.2 Compression Curves of T Lymphocytes to Rupture ...................................... 172 5.3.3 Rupture Force Increases at 4 days Post-activation ....................................... 173 5.3.4 Nominal rupture stress / tension Decreases at 2 days Post-activation ........ 173 5.3.5 Young’s Modulus Decreases in Activated CD8+ T Lymphocytes .................. 178 5.3.6 No Change in the Mechanical Properties of Non-activated CD8+ T Lymphocytes for up to 4 days ................................................................................. 178
5.4 Discussion ................................................................................................................. 182 5.5 Conclusion ................................................................................................................ 185 Chapter 6 ......................................................................................................................... 186
Overall Conclusions and Recommendations for Future Work ............................... 186 6.1 Summary of main findings ....................................................................................... 187 6.2 Future work .............................................................................................................. 191
References .............................................................................................................. 194
List of Figures
IX
List of Figures
Figure 1.1 Schematic of hematopoietic development.................................................. 5 Figure 1.2 Modes of probing the cell to determine its mechanical properties…………. 17 Figure 1.3 A schematic view of the AFM method and typical force-height curves
generated using AFM………………………………………………………………………………. 21
Figure 1.4 Schematic diagram of the micromanipulation rig...…………………………………. 23 Figure 1.5 Different passive separation techniques...……………………………..……............. 29 Figure 1.6 Schematic diagram to describe how inertial lift is generated in a flow…….. 34 Figure 1.7 Inertial migration involves secondary flows arising in curved channels……. 36 Figure 2.1 Schematic diagrams illustrating the micromanipulation and AFM
compression methods……………………………………………………………………………… 57
Figure 2.2 Image of a JPK Nano WizardR AFM system………………………………..……………. 62 Figure 2.3 Microfluidic systems used for separating small/deformable HSCs from a
heterogenous population………………………………………………………………………… 67
Figure 3.1 Similarities between Neutrophils and HPC-7s in the force-displacement curves generated from micromanipulation compression……………………..….
81
Figure 3.2 Nominal rupture stress and tension of HPC-7’s and neutrophils……………… 83 Figure 3.3 Whole cell deformation with micromanipulation for the determination of
the Young’s modulus of HPC-7s and MSCs up to large deformations……….. 86
Figure 3.4 Compression/holding curves of neutrophils, HPC-7s and MSCs at different deformations provided supportive evidence that the Hertz modelling can be used to calculate the Young’s Modulus for up to 60% deformations…………………………………………………………………………….................
87
Figure 3.5 Rupture force, nominal rupture stress/tension and Young’s modulus values significantly decrease with SDF-1α and H2O2 pre-treatment as determined using micromanipulation………………………………………………………
90
Figure 3.6 Compression/holding curves of pre-treated HPC-7’s provide supportive evidence that the Hertz modelling can be used to calculate the Young’s modulus for up to 60% deformations……………………………………………………….
91
Figure 3.7 Optical image and topography information of HPC-7s using the force mapping mode of AFM identifies relatively flat regions on the HPC-7 cell surface……………..………………………………………………………………………................
95
Figure 3.8 Localised cell surface indentation with AFM for the determination of the Young’s modulus of HPC-7s at small deformation. The Young’s modulus of HSCs at small deformations increases with SDF-1α and H2O2 pre-treatment…………………………………………….………………………………………………….
96
Figure 3.9 Pre-treatment of HPC-7s with SDF-1α and H2O2 induced polymerization of F-actin as determined by flow cytometry…………………………………………….
97
Figure 3.10 The characteristic distribution of actin filaments in response to PBS, SDF-1α and H2O2………………………………………………………………….………………………..
98
Figure 3.11 Mechanical properties of perfume microcapsules measured by AFM and micromanipulation…………………………………………………………………………………..
100
List of Figures
X
Figure 3.12 Only MSCs that are either small and/or deformable were able to home to sites of tissue injury…………………………………………………………….……………………
104
Figure 4.1 Optical brightfield images illustrating the outlet section of the (a) straight and (b) spiral microchannel……………………………………….……………………………..
125
Figure 4.2 The effect of culture condition on the phenotype and nominal rupture stress of HPC-7…………………………………………………………………………………………
126
Figure 4.3 HPC-7s demonstrated a wide variation in nominal rupture stress but not size suggesting a heterogeneity in their mechanical properties………………..
128
Figure 4.4 Separation efficiency of HPC-7s using the straight, trifurcated DEVICE A with AR = 5 and κ=0.3……………………………………………..……………………............
132
Figure 4.5 Separation efficiency of HPC-7s using the straight, trifurcated DEVICE B with AR = 10 and κ=0.5…………………………………………………………………………….
133
Figure 4.6 Determination of the velocity limit and cell number distribution at varying flow rate for the 3 SPIRAL devices……………………………………………….
138
Figure 4.7 Separation efficiency of HPC-7s using spiral and bifurcated DEVICE C with AR=7.5 and θ=0.0044……………………………………………………………………………….
139
Figure 4.8 Separation efficiency of HPC-7s using spiral and bifurcated DEVICE D with AR=5 and θ =0.0063………………………………………………………………………………..
140
Figure 4.9 Separation efficiency of HPC-7s using spiral and bifurcated DEVICE E with AR=3.75 and θ=0.0079……………………………………………………………………………
141
Figure4.10 Relationship between size and nominal rupture stress (σR) for cell populations before and after separation using Device C…………….…………….
146
Figure 4.11 Viability and nominal rupture stress of HPC-7s before and after separation using Device C…………………………..………………….………………………..
147
Figure 4.12 Changes of free flowing and adherent HPC-7 cells in IR injured colon over time……………………………………………………………………..…………………………………..
150
Figure 4.13 Intravital microscopy images of fluorescent CFSE-labelled HPC-7 cells either freely circulating or adherent within IR injured murine small intestinal mucosal villi……………………………………………………………………...........
151
Figure 4.14 The number of cells present with lungs removed from mice undergoing intestinal IR injury was similar between the sub-populations tested……………………………………………………………………………………………………….
152
Figure 4.15 The inertial lift forces acting on particles flowing in a straight microchannel……………………………………………………………………………………………
155
Figure 4.16 The effects of increasing flow rate on the movement of HSCs within the two STRAIGHT trifurcated microfluidic devices with varying aspect ratios………………………………………………………………………………………………………..
156
Figure 4.17 Schematic illustrating how spiral microfluidic devices exhibit Dean flow (FD) in addition to the net lift forces (FL)……………………………………………………
159
Figure 5.1 Diameter changes of T lymphocytes in the process of activation…………..... 174 Figure 5.2 Typical force-displacement curves for T lymphocytes……………………………… 175 Figure 5.3 Rupture parameters of T lymphocytes in the process of activation…………. 176 Figure 5.4 Changes of mechanical strength of T lymphocytes in the process of
activation……………………………………………………………………………………….………… 177
List of Figures
XI
Figure 5.5 Force-displacement data fitted with Hertz model……………………………………. 179 Figure 5.6 Mechanical properties of non-activated T lymphocytes in the process of
incubation……………………………………….………………………………………………………. 180
List of Tables
XII
List of Tables
Table 1.1 List of the various active and passive separation methods used to separate cells into specific sub-populations…………………………………………
26
Table 3.1 Pre-treatment with inflammatory factors does not change neutrophil, HSC or MSC size as determined by micromanipulation………………………..
80
Table 3.2 Summary of the changes in the mechanical properties of HSCs after pre-treating with PBS (control), SDF-1α , H2O2 and KC as characterised by AFM and micromanipulation…………………….…………………………………….
101
Table 4.1 Dimensionless numbers used in this chapter and equations used to derive these values……………………………………………………………………………..
118
Table 4.2 Geometries of the 5 microfluidic devices used to separate murine HSCs…………………………………………………………………………………………………….
122
Table 4.3 Summary of the performance of the 5 different microfluidic systems in separating cells based on mechanical strength and size…………………..
143
Table 5.1 Summary of the changes in the mechanical properties of human T lymphocytes at 2 days and 4 days post-activation……………………………….
180
Nomenclature
XIII
Nomenclature
Symbol Definitions
a Diameter of cells/particles, m
AFM Atomic Force Microscopy
AR Aspect Ratio (width/height) of rectangular channel
d Cell diameter, m
De Dean number
Dh Hydraulic diameter of channel, m
E Young’s modulus, Pa
F Applied force, N
FACS Fluorescent Activated Cell Sorting
FL Inertial lift force, N
fL Non-dimensional lift coefficient
FLS Shear gradient-induced lift force, N
FLW Wall-induced inertial lift force, N
FR Rupture force, N
H2O2 Hydrogen peroxide
HSC Haematopoietic Stem Cell
KC Keratinocyte chemoattractant
MACS Magnetic-activated Cell Sorting
MSC Mesenchymal Stem Cell
R Curvature radius of curved channel, m
Rc Original cell/AFM tip radius, m
Re Reynolds number
SC Stem Cell
SDF-1α Stromal cell-derived factor 1
SCF Stem Cell Factor
Nomenclature
XIV
SEM Standard Error of Mean
TR Nominal rupture tension, Pa
U Average velocity, m/s
δ Diametric compressive displacement, m
θ Curvature ratio (channel size/diameter of curvature)
κ Blockage ratio (cell size/channel height)
μ Dynamic viscosity, Pa∙s
ρ Fluid density, kg/m3
σR Nominal rupture stress, Pa
υ Poisson’s ratio

Chapter 1 General Introduction and Literature Survey
1
Chapter 1
General Introduction and Literature Survey
Chapter 1 General Introduction and Literature Survey
2
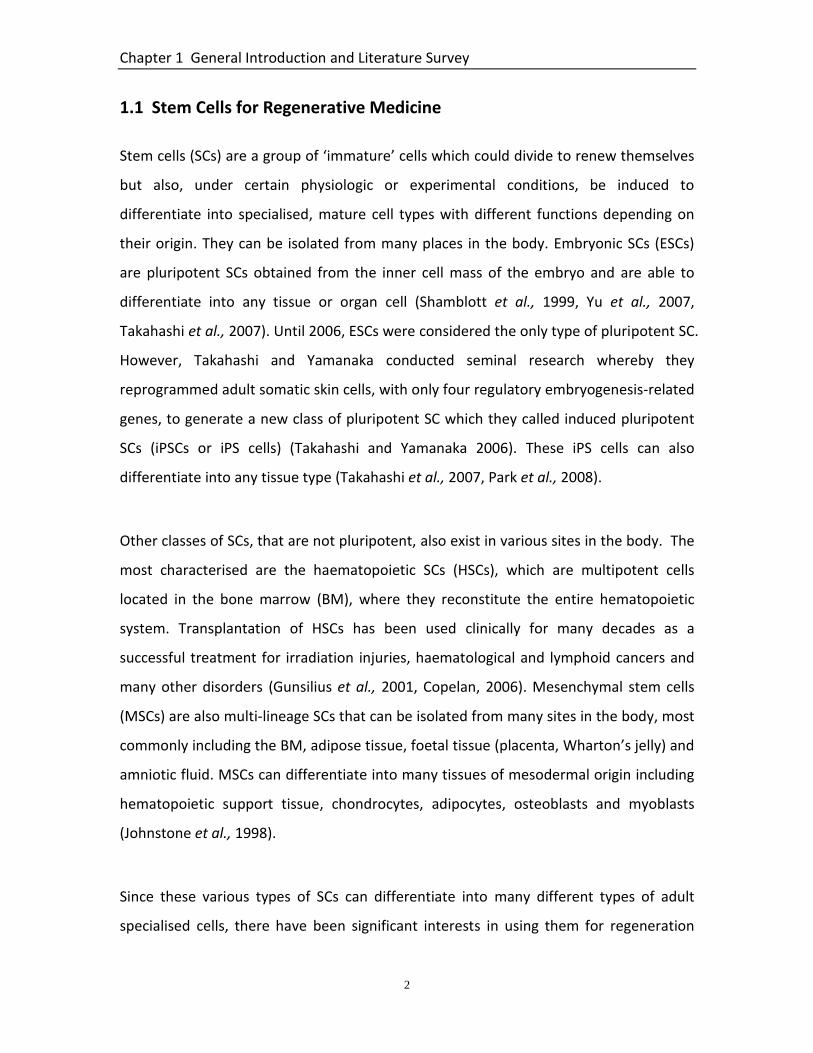
1.1 Stem Cells for Regenerative Medicine
Stem cells (SCs) are a group of ‘immature’ cells which could divide to renew themselves
but also, under certain physiologic or experimental conditions, be induced to
differentiate into specialised, mature cell types with different functions depending on
their origin. They can be isolated from many places in the body. Embryonic SCs (ESCs)
are pluripotent SCs obtained from the inner cell mass of the embryo and are able to
differentiate into any tissue or organ cell (Shamblott et al., 1999, Yu et al., 2007,
Takahashi et al., 2007). Until 2006, ESCs were considered the only type of pluripotent SC.
However, Takahashi and Yamanaka conducted seminal research whereby they
reprogrammed adult somatic skin cells, with only four regulatory embryogenesis-related
genes, to generate a new class of pluripotent SC which they called induced pluripotent
SCs (iPSCs or iPS cells) (Takahashi and Yamanaka 2006). These iPS cells can also
differentiate into any tissue type (Takahashi et al., 2007, Park et al., 2008).
Other classes of SCs, that are not pluripotent, also exist in various sites in the body. The
most characterised are the haematopoietic SCs (HSCs), which are multipotent cells
located in the bone marrow (BM), where they reconstitute the entire hematopoietic
system. Transplantation of HSCs has been used clinically for many decades as a
successful treatment for irradiation injuries, haematological and lymphoid cancers and
many other disorders (Gunsilius et al., 2001, Copelan, 2006). Mesenchymal stem cells
(MSCs) are also multi-lineage SCs that can be isolated from many sites in the body, most
commonly including the BM, adipose tissue, foetal tissue (placenta, Wharton’s jelly) and
amniotic fluid. MSCs can differentiate into many tissues of mesodermal origin including
hematopoietic support tissue, chondrocytes, adipocytes, osteoblasts and myoblasts
(Johnstone et al., 1998).
Since these various types of SCs can differentiate into many different types of adult
specialised cells, there have been significant interests in using them for regeneration
Chapter 1 General Introduction and Literature Survey
3
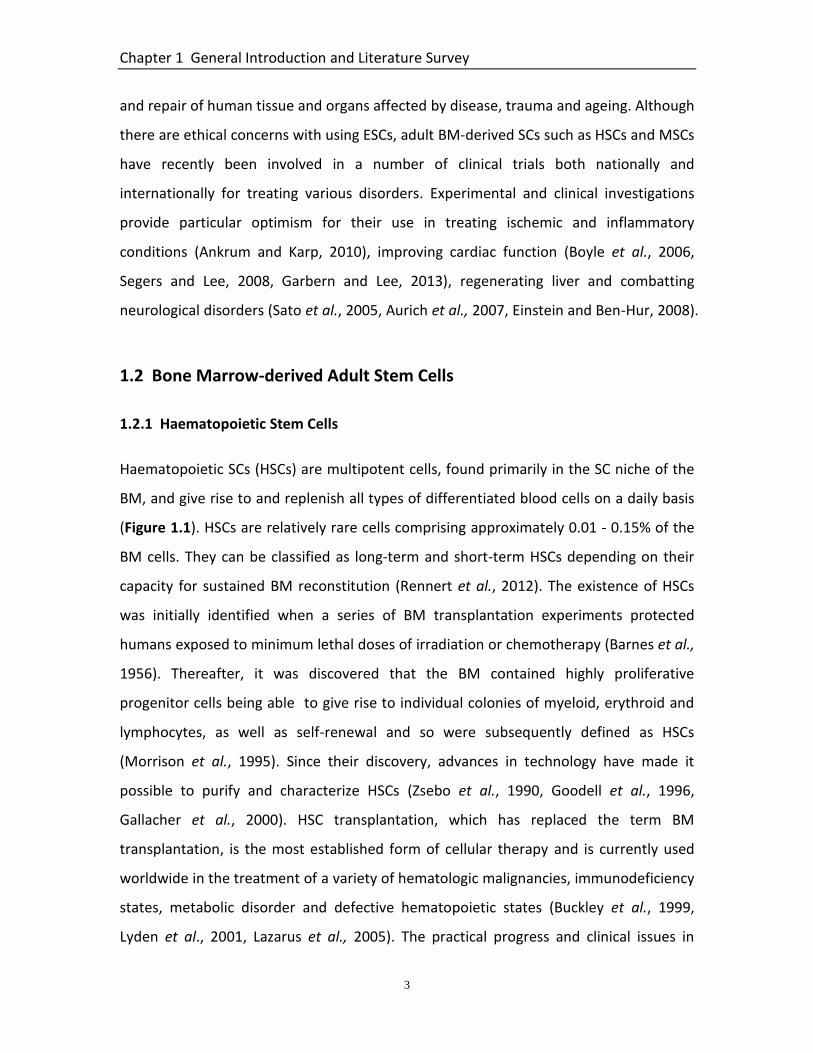
and repair of human tissue and organs affected by disease, trauma and ageing. Although
there are ethical concerns with using ESCs, adult BM-derived SCs such as HSCs and MSCs
have recently been involved in a number of clinical trials both nationally and
internationally for treating various disorders. Experimental and clinical investigations
provide particular optimism for their use in treating ischemic and inflammatory
conditions (Ankrum and Karp, 2010), improving cardiac function (Boyle et al., 2006,
Segers and Lee, 2008, Garbern and Lee, 2013), regenerating liver and combatting
neurological disorders (Sato et al., 2005, Aurich et al., 2007, Einstein and Ben-Hur, 2008).
1.2 Bone Marrow-derived Adult Stem Cells
1.2.1 Haematopoietic Stem Cells
Haematopoietic SCs (HSCs) are multipotent cells, found primarily in the SC niche of the
BM, and give rise to and replenish all types of differentiated blood cells on a daily basis
(Figure 1.1). HSCs are relatively rare cells comprising approximately 0.01 - 0.15% of the
BM cells. They can be classified as long-term and short-term HSCs depending on their
capacity for sustained BM reconstitution (Rennert et al., 2012). The existence of HSCs
was initially identified when a series of BM transplantation experiments protected
humans exposed to minimum lethal doses of irradiation or chemotherapy (Barnes et al.,
1956). Thereafter, it was discovered that the BM contained highly proliferative
progenitor cells being able to give rise to individual colonies of myeloid, erythroid and
lymphocytes, as well as self-renewal and so were subsequently defined as HSCs
(Morrison et al., 1995). Since their discovery, advances in technology have made it
possible to purify and characterize HSCs (Zsebo et al., 1990, Goodell et al., 1996,
Gallacher et al., 2000). HSC transplantation, which has replaced the term BM
transplantation, is the most established form of cellular therapy and is currently used
worldwide in the treatment of a variety of hematologic malignancies, immunodeficiency
states, metabolic disorder and defective hematopoietic states (Buckley et al., 1999,
Lyden et al., 2001, Lazarus et al., 2005). The practical progress and clinical issues in

Chapter 1 General Introduction and Literature Survey
4
every aspect of this field were specifically discussed in the book titled “Hematopoietic
Stem Cells Transplantation in Clinical Practice” (Treleaven and Barrett, 2009).

Chapter 1 General Introduction and Literature Survey
5
Figure 1.1. Schematic of hematopoietic development. The maintainance of the hematopoietic
system is realised through differentiation of HSCs into all of the different mature blood cell types. When they proliferate, some of their daughter cells remain as HSCs, and other daughters of HSCs can be divided into three groups: (1) the lymphoid progenitor cells give rise to lymphocytes (T-cells and B-cells) and NK cells of adaptive immune system; (2) myeloid progenitor cells divide into neutrophils, eosinophil, basophils and other cell types involving in diverse roles as innate immunity, adaptive immunity and blood clotting; and (3) Erythroid progenitor cells can generate a group of short-lived cells, including blood red cells and platelets keeping the proper function of circulatory system (Zon, 1995).
Chapter 1 General Introduction and Literature Survey
6
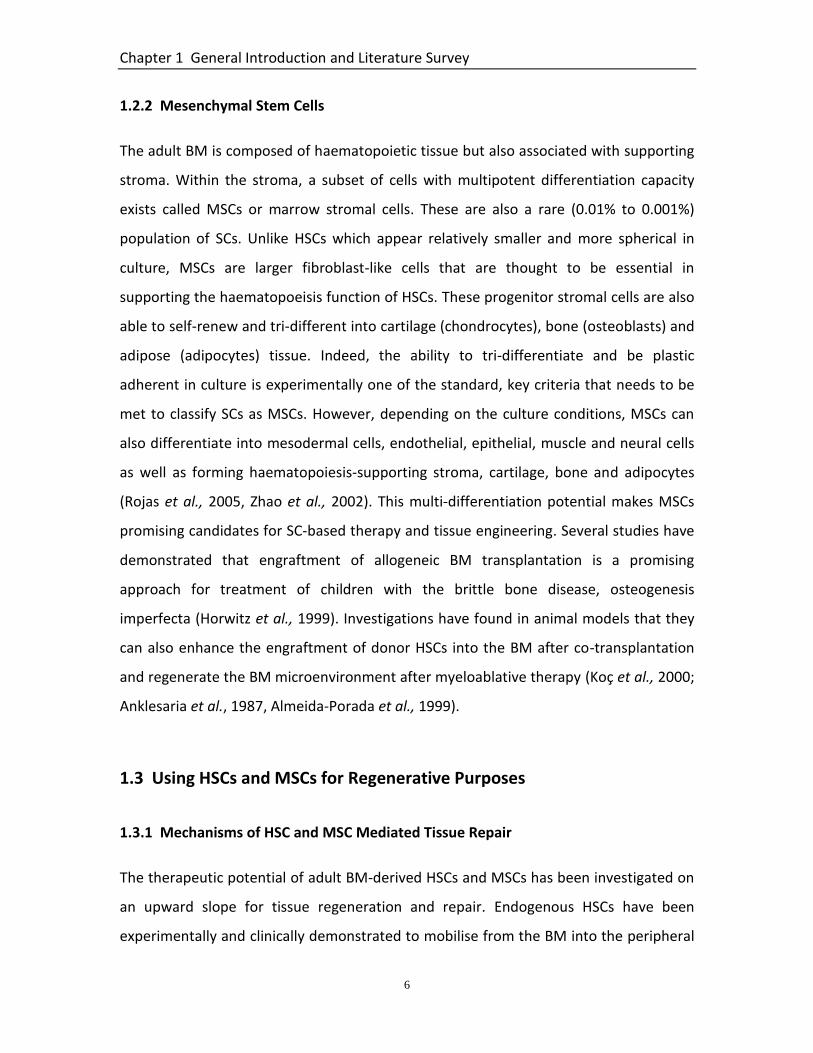
1.2.2 Mesenchymal Stem Cells
The adult BM is composed of haematopoietic tissue but also associated with supporting
stroma. Within the stroma, a subset of cells with multipotent differentiation capacity
exists called MSCs or marrow stromal cells. These are also a rare (0.01% to 0.001%)
population of SCs. Unlike HSCs which appear relatively smaller and more spherical in
culture, MSCs are larger fibroblast-like cells that are thought to be essential in
supporting the haematopoeisis function of HSCs. These progenitor stromal cells are also
able to self-renew and tri-different into cartilage (chondrocytes), bone (osteoblasts) and
adipose (adipocytes) tissue. Indeed, the ability to tri-differentiate and be plastic
adherent in culture is experimentally one of the standard, key criteria that needs to be
met to classify SCs as MSCs. However, depending on the culture conditions, MSCs can
also differentiate into mesodermal cells, endothelial, epithelial, muscle and neural cells
as well as forming haematopoiesis-supporting stroma, cartilage, bone and adipocytes
(Rojas et al., 2005, Zhao et al., 2002). This multi-differentiation potential makes MSCs
promising candidates for SC-based therapy and tissue engineering. Several studies have
demonstrated that engraftment of allogeneic BM transplantation is a promising
approach for treatment of children with the brittle bone disease, osteogenesis
imperfecta (Horwitz et al., 1999). Investigations have found in animal models that they
can also enhance the engraftment of donor HSCs into the BM after co-transplantation
and regenerate the BM microenvironment after myeloablative therapy (Koç et al., 2000;
Anklesaria et al., 1987, Almeida-Porada et al., 1999).
1.3 Using HSCs and MSCs for Regenerative Purposes
1.3.1 Mechanisms of HSC and MSC Mediated Tissue Repair
The therapeutic potential of adult BM-derived HSCs and MSCs has been investigated on
an upward slope for tissue regeneration and repair. Endogenous HSCs have been
experimentally and clinically demonstrated to mobilise from the BM into the peripheral

Chapter 1 General Introduction and Literature Survey
7
blood and then travel via the circulation to enrich near sites of injuries resulting from
inflammatory and wound-response stimuli (Whetton and Graham, 1999). Since they are
rare cells, this phenomenon is not observed readily. Although mobilization of
endogenous HSCs from the BM can be enhanced, it still does not appear to deliver
sufficient numbers into the peripheral blood to be therapeutically effective. Therefore,
isolated and subsequently culture-expanded exogenous HSCs are considered ideal for
therapeutic purposes. Recent evidence suggests exogenously transplanted HSCs are
able to contribute to the regeneration and repair of a number of organs. In the injured
kidney, HSCs promote the proliferation of both vascular endothelial and epithelial cells
(Lin et al., 2003, Li et al., 2010). HSCs have also been shown to facilitate regeneration of
injured liver by either generating epithelial cells or altering the inflammatory response
(Dalakas et al., 2005, Jang et al., 2004). Studies have also shown the ability of HSCs to
generate cardiomyocytes through cell fusion in mice subjected to acute myocardial
infarction (Nygren et al., 2004). These early studies eluded to tissue repair by recruited
HSCs being realized by one or more mechanisms including direct replacement of
damaged cells, differentiation into the desired cells/tissue or fusion with host tissue
cells. However, this concept of HSC ‘plasticity' has been disregarded and more recent
evidence suggests a host of paracrine factors are released locally by HSCs and that it is
these that modify the response to injury. Secretion of growth factors helps to stimulate
local SC growth and differentiation and/or secretion of homing signals help recruit
distant SCs (Ährlund-Richter et al., 2009). Furthermore, HSCs are also thought to release
paracrine factors that can confer, anti-inflammatory, immunomodulatory and
vasculoprotective effects (Baraniak and McDevitt, 2010).
Similar observations have been made for MSCs. Though transplantation of MSCs was
initially proposed as a therapeutic approach by utilising their SC-like properties, their
therapeutic function were benefited from other characteristics, such as anti-
proliferative, anti-inflammatory and immunomodulatory qualities (Uccelli et al., 2008;
Baraniak and McDevitt, 2010). They are thought to protect injured neurons through

Chapter 1 General Introduction and Literature Survey
8
secretion of anti-apoptotic, anti-inflammatory and trophic molecules (Li et al., 2002). In
spite of limitations in the existing knowledge of MSCs behaviors in disease treatment,
researchers are very optimistic about their potential to treat disorders such as diabetes
(Urban et al., 2008), spinal cord injury (Syková et al., 2006), liver disease (Kuo et al.,
2008), and lung cancer (Rojas et al., 2005). Indeed, their capacity for
immunomodulatory and anti-inflammatory effects seems somewhat greater than HSCs.
1.3.2 Mechanisms of Transplanted HSC and MSC Recruitment to Sites of Tissue Injury
Regardless of the mechanism of repair, both HSC and MSC therapy is dependent on
successful engraftment of these cells within the site of injury after their systemic
delivery into the bloodstream. Although local transplantation or injection directly into
the injury site has been used to deliver cells, systemic infusion is considered the more
preferable route for safety and broad application concerns (Karp and Teo, 2009). If
HSC/MSC infusion is to assist therapy, a better knowledge of the parameters modulating
engraftment to injured sites is critical for development of strategies to increase their
recruitment and thus maximise their therapeutic potential. Engraftment is a multi-step
process whereby HSCs/MSCs circulating in the peripheral blood firstly need to be
recruited by the local injured tissue microcirculation, from where they must
subsequently transmigrate into the surrounding parenchyma of the injured tissue. SC
‘homing’ to sites of injury refers to the phenomenon whereby circulating SCs migrate or
traffick to an organ and then become retained within it through firm adhesive
interactions with the microvascular endothelium. The precise mechanism that govern
HSC homing to sites of injury and subsequent engraftment have been recently identified
and appear to vary somewhat depending on the organ (Kavanagh et al., 2011; Kavanagh
et al., 2013a; Kavanagh et al., 2013b). Generally, adhesion molecule phenotypes are
similar between HSCs and blood neutrophils, demonstrating that their recruitment
follows a similar pathway used by these inflammatory cells (Kobayashi et al., 1994,
Turner et al., 1995).
Chapter 1 General Introduction and Literature Survey
9
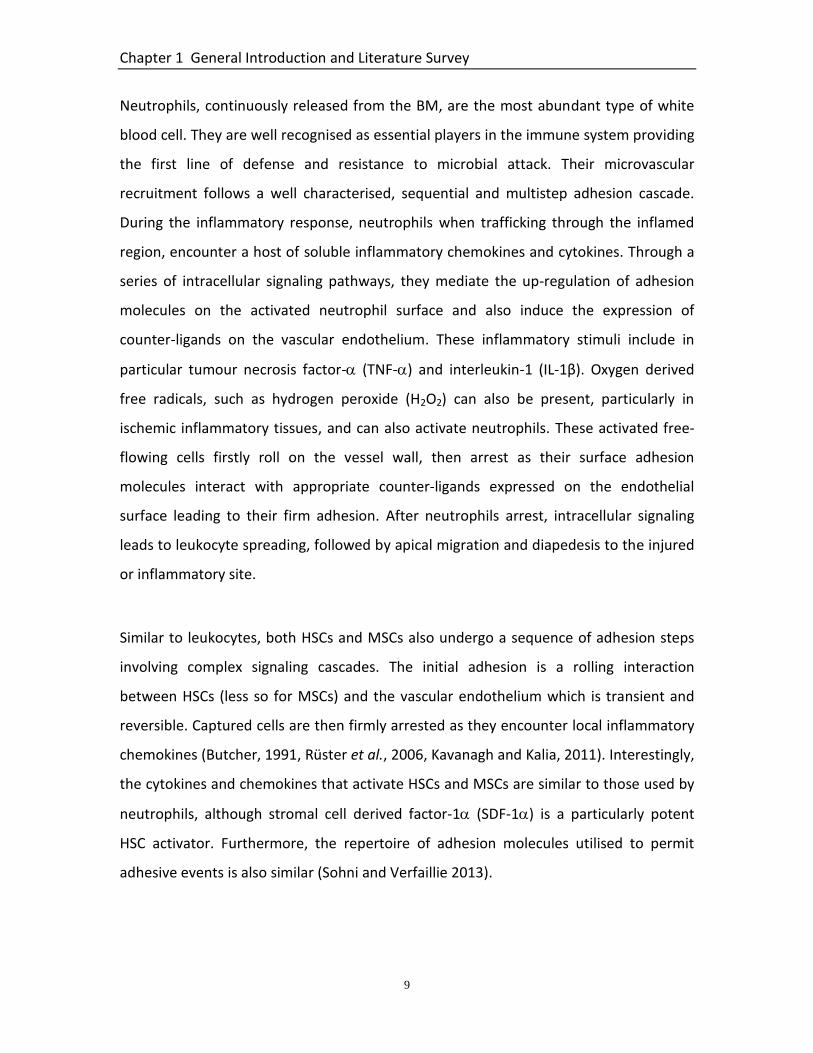
Neutrophils, continuously released from the BM, are the most abundant type of white
blood cell. They are well recognised as essential players in the immune system providing
the first line of defense and resistance to microbial attack. Their microvascular
recruitment follows a well characterised, sequential and multistep adhesion cascade.
During the inflammatory response, neutrophils when trafficking through the inflamed
region, encounter a host of soluble inflammatory chemokines and cytokines. Through a
series of intracellular signaling pathways, they mediate the up-regulation of adhesion
molecules on the activated neutrophil surface and also induce the expression of
counter-ligands on the vascular endothelium. These inflammatory stimuli include in
particular tumour necrosis factor- (TNF-) and interleukin-1 (IL-1β). Oxygen derived
free radicals, such as hydrogen peroxide (H2O2) can also be present, particularly in
ischemic inflammatory tissues, and can also activate neutrophils. These activated free-
flowing cells firstly roll on the vessel wall, then arrest as their surface adhesion
molecules interact with appropriate counter-ligands expressed on the endothelial
surface leading to their firm adhesion. After neutrophils arrest, intracellular signaling
leads to leukocyte spreading, followed by apical migration and diapedesis to the injured
or inflammatory site.
Similar to leukocytes, both HSCs and MSCs also undergo a sequence of adhesion steps
involving complex signaling cascades. The initial adhesion is a rolling interaction
between HSCs (less so for MSCs) and the vascular endothelium which is transient and
reversible. Captured cells are then firmly arrested as they encounter local inflammatory
chemokines (Butcher, 1991, Rüster et al., 2006, Kavanagh and Kalia, 2011). Interestingly,
the cytokines and chemokines that activate HSCs and MSCs are similar to those used by
neutrophils, although stromal cell derived factor-1 (SDF-1) is a particularly potent
HSC activator. Furthermore, the repertoire of adhesion molecules utilised to permit
adhesive events is also similar (Sohni and Verfaillie 2013).
Chapter 1 General Introduction and Literature Survey
10
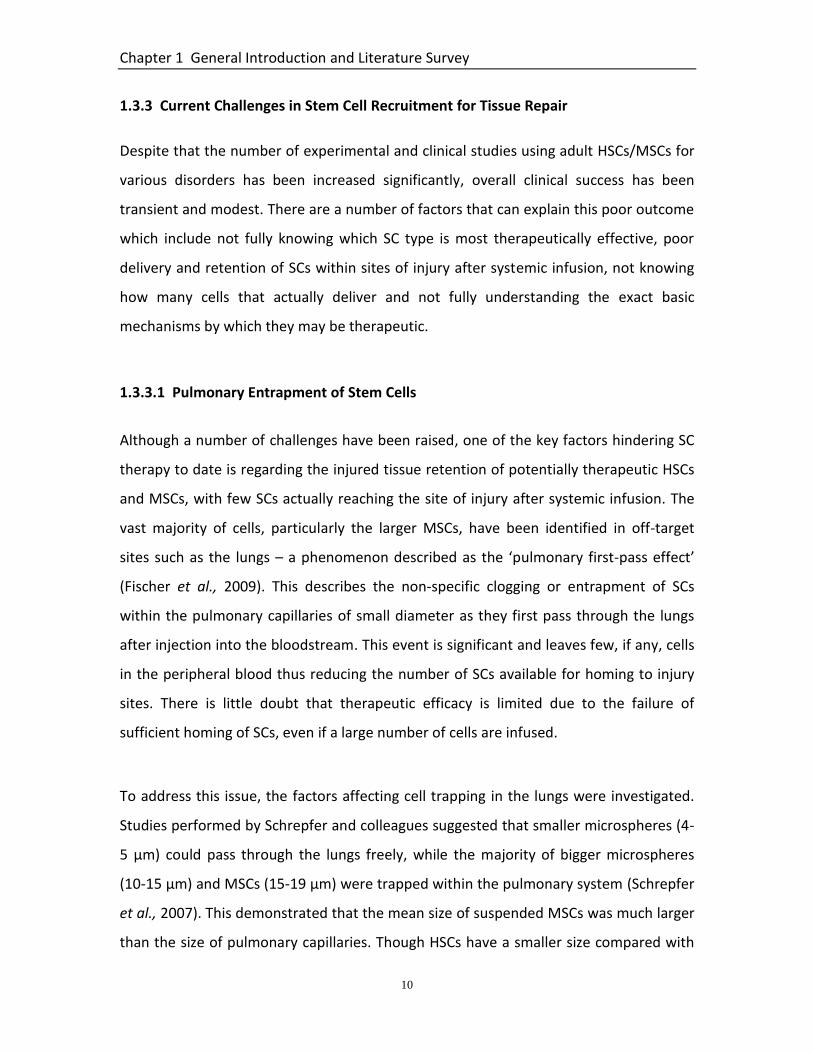
1.3.3 Current Challenges in Stem Cell Recruitment for Tissue Repair
Despite that the number of experimental and clinical studies using adult HSCs/MSCs for
various disorders has been increased significantly, overall clinical success has been
transient and modest. There are a number of factors that can explain this poor outcome
which include not fully knowing which SC type is most therapeutically effective, poor
delivery and retention of SCs within sites of injury after systemic infusion, not knowing
how many cells that actually deliver and not fully understanding the exact basic
mechanisms by which they may be therapeutic.
1.3.3.1 Pulmonary Entrapment of Stem Cells
Although a number of challenges have been raised, one of the key factors hindering SC
therapy to date is regarding the injured tissue retention of potentially therapeutic HSCs
and MSCs, with few SCs actually reaching the site of injury after systemic infusion. The
vast majority of cells, particularly the larger MSCs, have been identified in off-target
sites such as the lungs – a phenomenon described as the ‘pulmonary first-pass effect’
(Fischer et al., 2009). This describes the non-specific clogging or entrapment of SCs
within the pulmonary capillaries of small diameter as they first pass through the lungs
after injection into the bloodstream. This event is significant and leaves few, if any, cells
in the peripheral blood thus reducing the number of SCs available for homing to injury
sites. There is little doubt that therapeutic efficacy is limited due to the failure of
sufficient homing of SCs, even if a large number of cells are infused.
To address this issue, the factors affecting cell trapping in the lungs were investigated.
Studies performed by Schrepfer and colleagues suggested that smaller microspheres (4-
5 µm) could pass through the lungs freely, while the majority of bigger microspheres
(10-15 µm) and MSCs (15-19 µm) were trapped within the pulmonary system (Schrepfer
et al., 2007). This demonstrated that the mean size of suspended MSCs was much larger
than the size of pulmonary capillaries. Though HSCs have a smaller size compared with
Chapter 1 General Introduction and Literature Survey
11
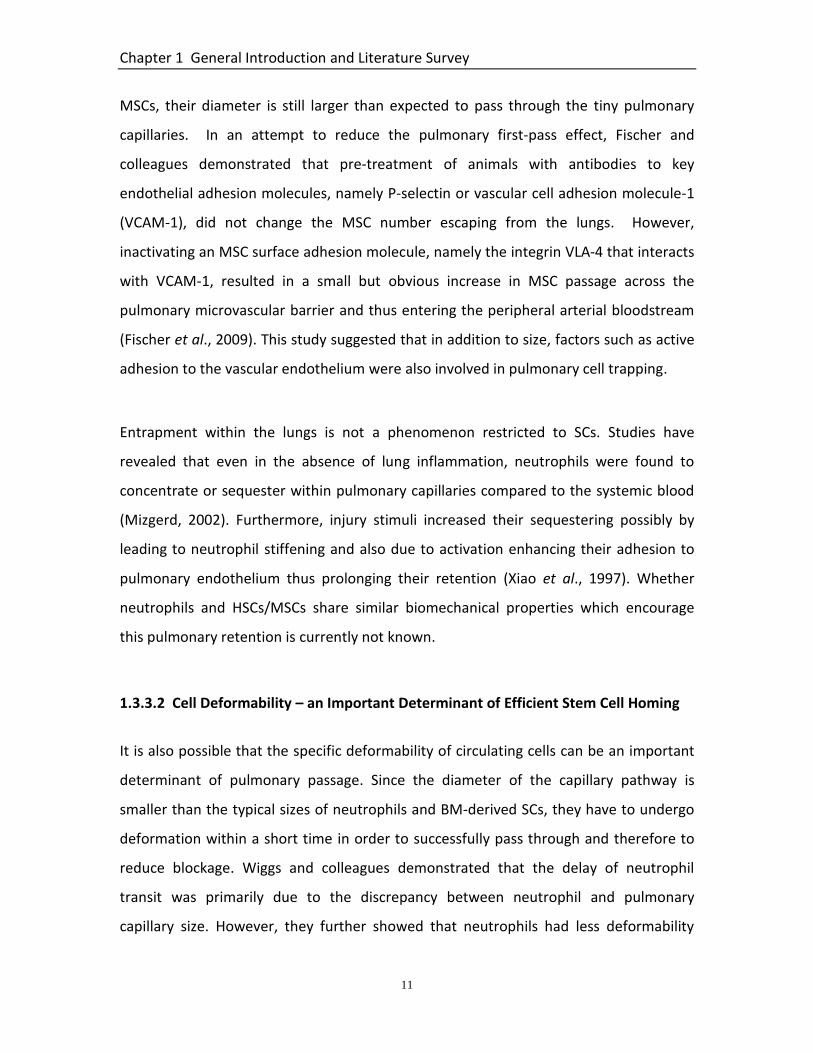
MSCs, their diameter is still larger than expected to pass through the tiny pulmonary
capillaries. In an attempt to reduce the pulmonary first-pass effect, Fischer and
colleagues demonstrated that pre-treatment of animals with antibodies to key
endothelial adhesion molecules, namely P-selectin or vascular cell adhesion molecule-1
(VCAM-1), did not change the MSC number escaping from the lungs. However,
inactivating an MSC surface adhesion molecule, namely the integrin VLA-4 that interacts
with VCAM-1, resulted in a small but obvious increase in MSC passage across the
pulmonary microvascular barrier and thus entering the peripheral arterial bloodstream
(Fischer et al., 2009). This study suggested that in addition to size, factors such as active
adhesion to the vascular endothelium were also involved in pulmonary cell trapping.
Entrapment within the lungs is not a phenomenon restricted to SCs. Studies have
revealed that even in the absence of lung inflammation, neutrophils were found to
concentrate or sequester within pulmonary capillaries compared to the systemic blood
(Mizgerd, 2002). Furthermore, injury stimuli increased their sequestering possibly by
leading to neutrophil stiffening and also due to activation enhancing their adhesion to
pulmonary endothelium thus prolonging their retention (Xiao et al., 1997). Whether
neutrophils and HSCs/MSCs share similar biomechanical properties which encourage
this pulmonary retention is currently not known.
1.3.3.2 Cell Deformability – an Important Determinant of Efficient Stem Cell Homing
It is also possible that the specific deformability of circulating cells can be an important
determinant of pulmonary passage. Since the diameter of the capillary pathway is
smaller than the typical sizes of neutrophils and BM-derived SCs, they have to undergo
deformation within a short time in order to successfully pass through and therefore to
reduce blockage. Wiggs and colleagues demonstrated that the delay of neutrophil
transit was primarily due to the discrepancy between neutrophil and pulmonary
capillary size. However, they further showed that neutrophils had less deformability
Chapter 1 General Introduction and Literature Survey
12
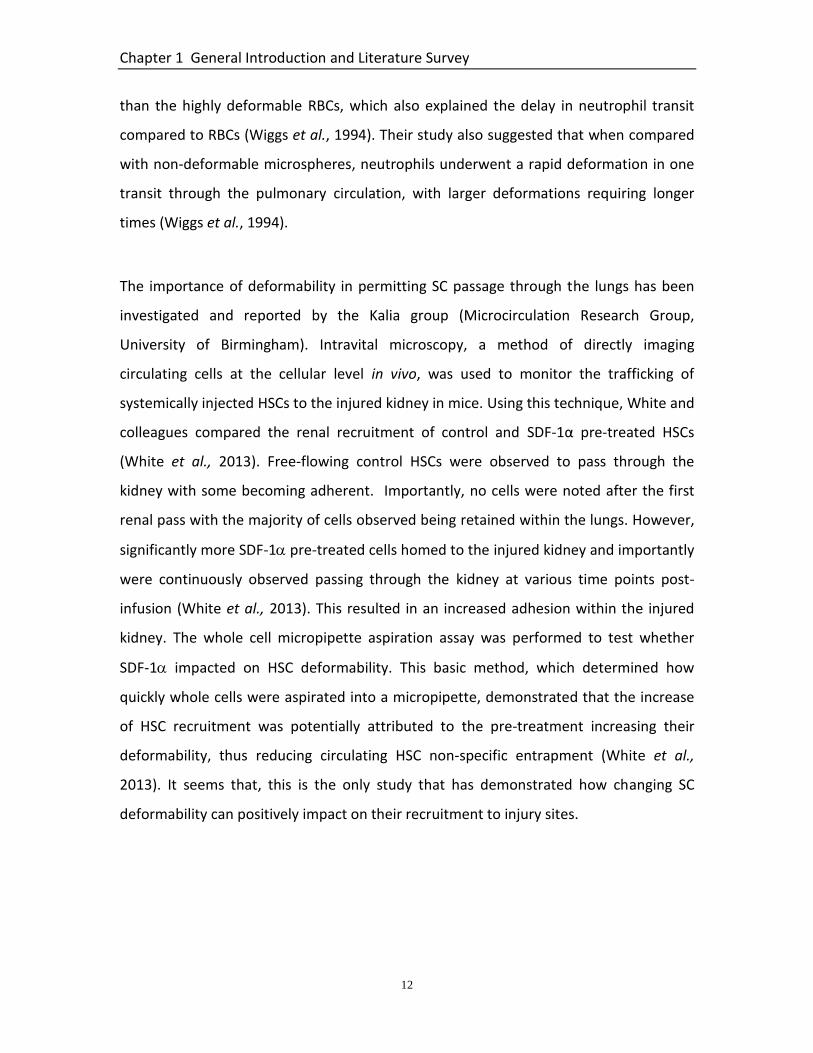
than the highly deformable RBCs, which also explained the delay in neutrophil transit
compared to RBCs (Wiggs et al., 1994). Their study also suggested that when compared
with non-deformable microspheres, neutrophils underwent a rapid deformation in one
transit through the pulmonary circulation, with larger deformations requiring longer
times (Wiggs et al., 1994).
The importance of deformability in permitting SC passage through the lungs has been
investigated and reported by the Kalia group (Microcirculation Research Group,
University of Birmingham). Intravital microscopy, a method of directly imaging
circulating cells at the cellular level in vivo, was used to monitor the trafficking of
systemically injected HSCs to the injured kidney in mice. Using this technique, White and
colleagues compared the renal recruitment of control and SDF-1α pre-treated HSCs
(White et al., 2013). Free-flowing control HSCs were observed to pass through the
kidney with some becoming adherent. Importantly, no cells were noted after the first
renal pass with the majority of cells observed being retained within the lungs. However,
significantly more SDF-1 pre-treated cells homed to the injured kidney and importantly
were continuously observed passing through the kidney at various time points post-
infusion (White et al., 2013). This resulted in an increased adhesion within the injured
kidney. The whole cell micropipette aspiration assay was performed to test whether
SDF-1 impacted on HSC deformability. This basic method, which determined how
quickly whole cells were aspirated into a micropipette, demonstrated that the increase
of HSC recruitment was potentially attributed to the pre-treatment increasing their
deformability, thus reducing circulating HSC non-specific entrapment (White et al.,
2013). It seems that, this is the only study that has demonstrated how changing SC
deformability can positively impact on their recruitment to injury sites.

Chapter 1 General Introduction and Literature Survey
13
1.3.4 Strategies for Enhancing Stem Cell Recruitment Following Injury
The limited efficiency of SC recruitment has led to the development of a number of pre-
clinical techniques to enhance this process. Previous attempts to enhance SC
recruitment within injured tissue included techniques, such as genetic manipulation and
modification of SCs to either express more surface adhesion molecules or using plasmid
DNA encoding for SDF-1α to increase tissue levels of this potent HSC chemokine (Hiasa
et al., 2004). However, this approach could pose a potential risk due to the misguided
insertion of genetic material and a lack of clarity on what potential problems this could
create in vivo in the long term. Various non-genetic, biochemical pre-treatment
strategies have also been considered to increase the interaction between SCs and the
microcirculation of the injured tissue. This idea was primarily proposed based on the
fact that the adhesion of SCs to microvasculature was shown to depend on local, soluble
inflammatory factors that can activate those circulating cells to adhere. From this
knowledge it was hypothesised that pre-exposure of SCs to an environment containing
critical soluble inflammatory factors prior to infusion would prime or pre-activate them.
Indeed, this was shown to be the case using H2O2 which resulted in a significant increase
in HSC recruitment to injured mouse colon and small intestine, but importantly was
associated with reduced pulmonary adhesion (Yemm et al., 2014; Kavanagh et al 2013a).
Mechanisms of action included increasing the HSC surface adhesion molecule lateral
clustering and enhancing their affinity for endothelial counterligands. Whether an
additional mechanism involved increasing the deformability of HSCs was not
investigated. Interestingly, H2O2 is also able to regulate the adhesive process of
leukocytes by increasing their rolling and adhesion on vascular endothelium (Fraticelli et
al., 1996). H2O2 is not the only effective pre-treatment strategy as using the chemokine
SDF-1α also enhanced HSC recruitment to murine injured intestine (Kavanagh et al.,
2013b) and kidney (White et al., 2013). As reviewed earlier, the mechanical properties
(size and deformability) of therapeutic cells are important parameters affecting
pulmonary entrapment. However, there is a paucity of literature examining whether

Chapter 1 General Introduction and Literature Survey
14
such pre-treatment strategies with chemokines or free radicals also impacts on the
deformability of SCs to modify their recruitment.
1.4 Mechanical Property of Living Cells
1.4.1 Cell Mechanics and the Cytoskeleton
The ability of cells to resist deformation and maintain their shape when the various
stresses exerted on them in the body, or to modify shape during mobilisation, depends
mainly on their cytoskeleton. This is an interaction and complex network of filamentous
polymers and regulatory proteins. There are three types of proteins contributing to the
cytoskeleton: actin, tubulin and intermediate filament (IF) composing filaments of F-
actin, microtubules and intermediate filaments (IFs) respectively. In vitro experiments
have extensively identified and characterised the basic building blocks of cytoskeleton,
including their roles in controlling the mechanical properties of the cell. F-actin, as the
critical component of the cytoskeleton, is particularly abundant beneath the plasma
membrane in the form of a network which is able to determine the cell shape,
mechanical properties and regulate cell migration (Cooper, 2000). IFs, as the least stiff
of the three polymers, are the most diverse and mainly located throughout the
cytoplasm and the nucleus (Fletcher and Mullins, 2010). Microtubules are involved in
nucleic and cell division, organization of intracellular structure and transport.
Experiments involving selectively disrupting any one of the three cytoskeleton elements
have demonstrated that microtubules do not provide mechanical support to spherical
cells in terms of cell rigidity on the whole-cell scale (Brown et al., 2001). F-actin
networks have attracted considerable interest in the mechanical response of the cell for
the reason of their diversity in structures that they form and their function acting as
semi-flexible polymers. When the F-actin, extracellular and intermediate networks are
all together resistant to the applied forces, the additional deformation is resisted by
filament entanglement. When the stress is applied merely on a single cell with highly
organized architecture, the bending of actin filaments contributes to the elastic
Chapter 1 General Introduction and Literature Survey
15
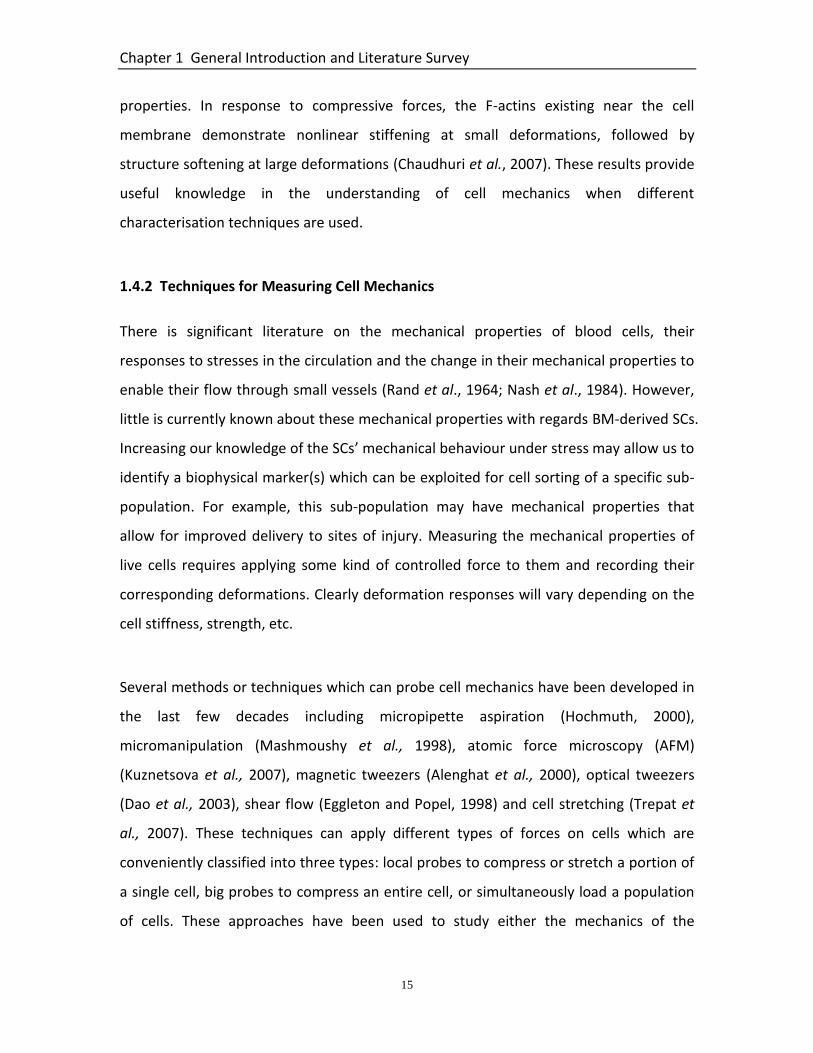
properties. In response to compressive forces, the F-actins existing near the cell
membrane demonstrate nonlinear stiffening at small deformations, followed by
structure softening at large deformations (Chaudhuri et al., 2007). These results provide
useful knowledge in the understanding of cell mechanics when different
characterisation techniques are used.
1.4.2 Techniques for Measuring Cell Mechanics
There is significant literature on the mechanical properties of blood cells, their
responses to stresses in the circulation and the change in their mechanical properties to
enable their flow through small vessels (Rand et al., 1964; Nash et al., 1984). However,
little is currently known about these mechanical properties with regards BM-derived SCs.
Increasing our knowledge of the SCs’ mechanical behaviour under stress may allow us to
identify a biophysical marker(s) which can be exploited for cell sorting of a specific sub-
population. For example, this sub-population may have mechanical properties that
allow for improved delivery to sites of injury. Measuring the mechanical properties of
live cells requires applying some kind of controlled force to them and recording their
corresponding deformations. Clearly deformation responses will vary depending on the
cell stiffness, strength, etc.
Several methods or techniques which can probe cell mechanics have been developed in
the last few decades including micropipette aspiration (Hochmuth, 2000),
micromanipulation (Mashmoushy et al., 1998), atomic force microscopy (AFM)
(Kuznetsova et al., 2007), magnetic tweezers (Alenghat et al., 2000), optical tweezers
(Dao et al., 2003), shear flow (Eggleton and Popel, 1998) and cell stretching (Trepat et
al., 2007). These techniques can apply different types of forces on cells which are
conveniently classified into three types: local probes to compress or stretch a portion of
a single cell, big probes to compress an entire cell, or simultaneously load a population
of cells. These approaches have been used to study either the mechanics of the

Chapter 1 General Introduction and Literature Survey
16
integrated whole cell or the micro- and nano-mechanics of individual cell structure
components separately, such as the isolated membrane plasma, cell nuclei and even the
actin filaments. These various methods utilise different ways by which the force probe
can contact and sample the cell or its surface (Figure 1.2). Each method has its own
strengths and weaknesses. Among these techniques, micropipette aspiration, AFM and
micromanipulation are described in the following section due to their importance and
wide uses. Other techniques, which are not repeated here, have been discussed
extensively by Janmey and McCulloch (2007).

Chapter 1 General Introduction and Literature Survey
17
Figure 1.2. Modes of probing the cell to determine its mechanical properties. The various methods utilise different ways by which the force probe can contact and sample the cell. Each method has its own strengths and weaknesses.

Chapter 1 General Introduction and Literature Survey
18
1.4.2.1 Micropipette Aspiration
Micropipette aspiration has been utilised to investigate the whole-cell mechanics. It
involves sucking up a small portion of a cell into a small glass tube in response to
negative pressure and tracking the leading edge of its surface. The changes of the edges
are tracked with a light microscope. The applied vacuum pressure, the time it takes to
aspirate the whole cell, the cell length that is sucked into the pipette, the inner diameter
of the pipette and the diameter of the spherical portion outside the pipette can be used
to calculate the elastic and viscoelastic moduli of the cell based on basic continuum
models (Janmey and McCulloch, 2007). Though this technique is simpler and the cost to
build the device is relatively lower compared to other methods, the approach is
somewhat hindered in the spatial resolution to the micron scale, the cells have to be
deformed to a large deformation, and its accuracy is dependent on the optical imaging
resolutions.
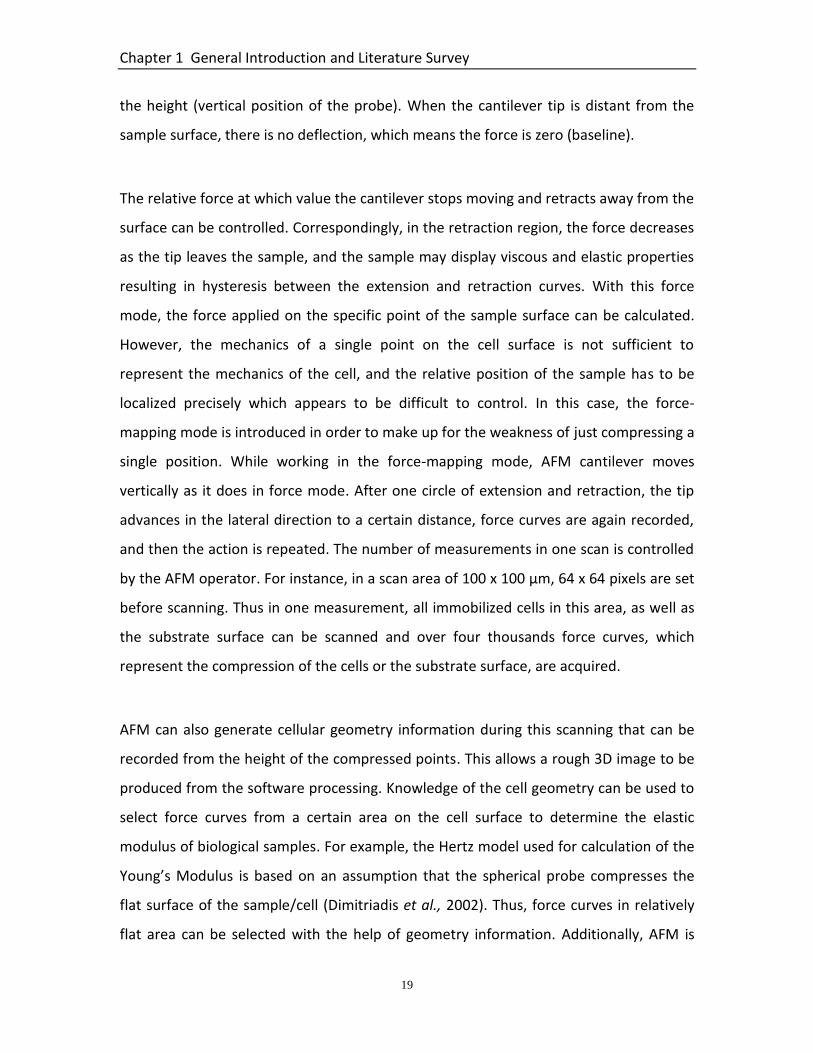
1.4.2.2 Atomic Force Microscopy (AFM)
AFM-based compression is the most recent and powerful technique to understand the
spatial distribution of mechanics within a single cell. The basic operation of AFM relies
on the laser tracking of the deflection of a micro-sized cantilever, which with a fine tip
can probe the cell surface. Its deflection determines the applied compression or
adhesion force, as well as the displacement (Figure 1.3a) (Kirmizis and Logothetidis,
2010). AFM can be operated in several different modes depending on the nature of the
interaction between the tip and the sample surface. These include contact, tapping, and
force mode. In force mode, an advanced, so-called force-mapping mode is most useful
for the study of cell mechanics. Force mode is used to measure forces acting between
the AFM tip and the sample surface at a specific point. The cantilever simply goes up
and down, and its tip is therefore elevated and approached to the surface at a certain
velocity. As a result, a force profile is recorded and typical extend and retract curves can
be generated (Figure 1.3b). The vertical deflection of the cantilever is plotted against
Chapter 1 General Introduction and Literature Survey
19
the height (vertical position of the probe). When the cantilever tip is distant from the
sample surface, there is no deflection, which means the force is zero (baseline).
The relative force at which value the cantilever stops moving and retracts away from the
surface can be controlled. Correspondingly, in the retraction region, the force decreases
as the tip leaves the sample, and the sample may display viscous and elastic properties
resulting in hysteresis between the extension and retraction curves. With this force
mode, the force applied on the specific point of the sample surface can be calculated.
However, the mechanics of a single point on the cell surface is not sufficient to
represent the mechanics of the cell, and the relative position of the sample has to be
localized precisely which appears to be difficult to control. In this case, the force-
mapping mode is introduced in order to make up for the weakness of just compressing a
single position. While working in the force-mapping mode, AFM cantilever moves
vertically as it does in force mode. After one circle of extension and retraction, the tip
advances in the lateral direction to a certain distance, force curves are again recorded,
and then the action is repeated. The number of measurements in one scan is controlled
by the AFM operator. For instance, in a scan area of 100 x 100 µm, 64 x 64 pixels are set
before scanning. Thus in one measurement, all immobilized cells in this area, as well as
the substrate surface can be scanned and over four thousands force curves, which
represent the compression of the cells or the substrate surface, are acquired.
AFM can also generate cellular geometry information during this scanning that can be
recorded from the height of the compressed points. This allows a rough 3D image to be
produced from the software processing. Knowledge of the cell geometry can be used to
select force curves from a certain area on the cell surface to determine the elastic
modulus of biological samples. For example, the Hertz model used for calculation of the
Young’s Modulus is based on an assumption that the spherical probe compresses the
flat surface of the sample/cell (Dimitriadis et al., 2002). Thus, force curves in relatively
flat area can be selected with the help of geometry information. Additionally, AFM is

Chapter 1 General Introduction and Literature Survey
20
able to generate compression force curves of cells at very small deformations of
individual cells corresponding to pico-Newton force, and it is far more sensitive than
other techniques.
Chapter 1 General Introduction and Literature Survey
21
Figure 1.3. A schematic view of the AFM method and typical force-height curves generated using AFM. (a) The basic operation of AFM relies on the laser tracking of the deflection of a micro-sized cantilever, the flexible cantilever with a fine tip can probe the cell surface, and its deflection determines the applied compression or adhesion force, as well as the displacement. (b) When the cantilever tip is distant from the sample surface, there is no deflection. At some point, the sample is compressed with the increase of the force (red line). When the force reaches to a set point, the tip retracts from the sample and the force decreases (blue line).
Chapter 1 General Introduction and Literature Survey
22
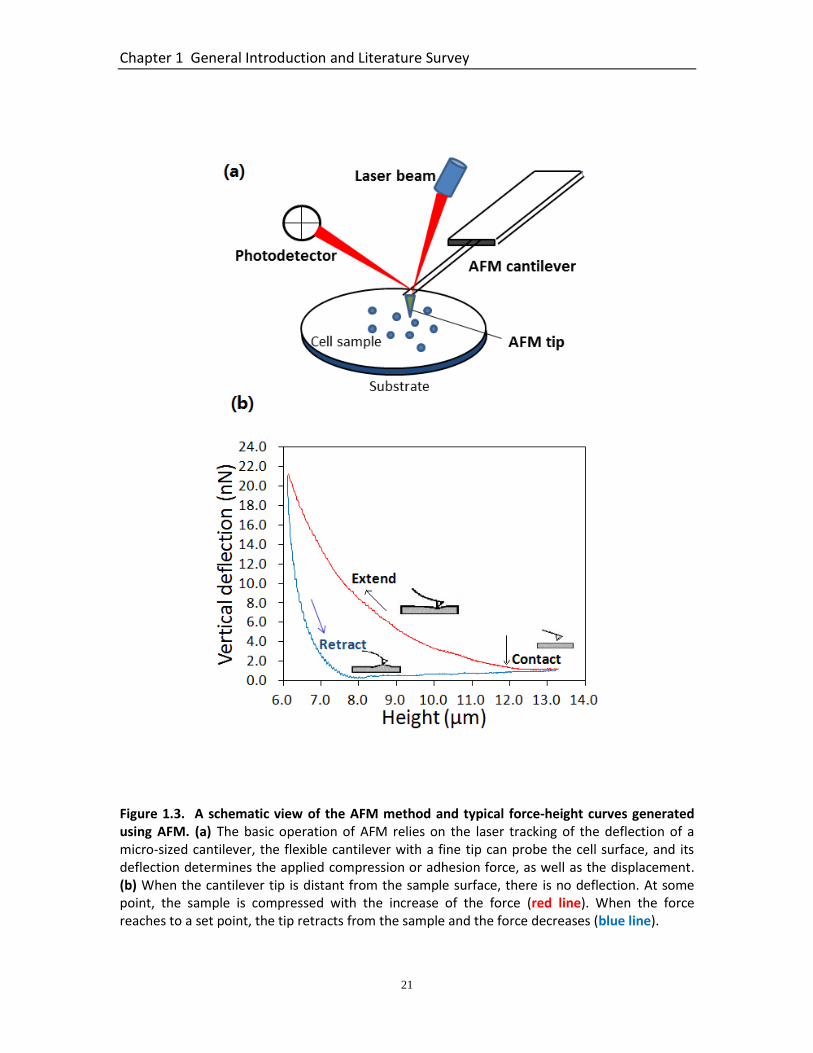
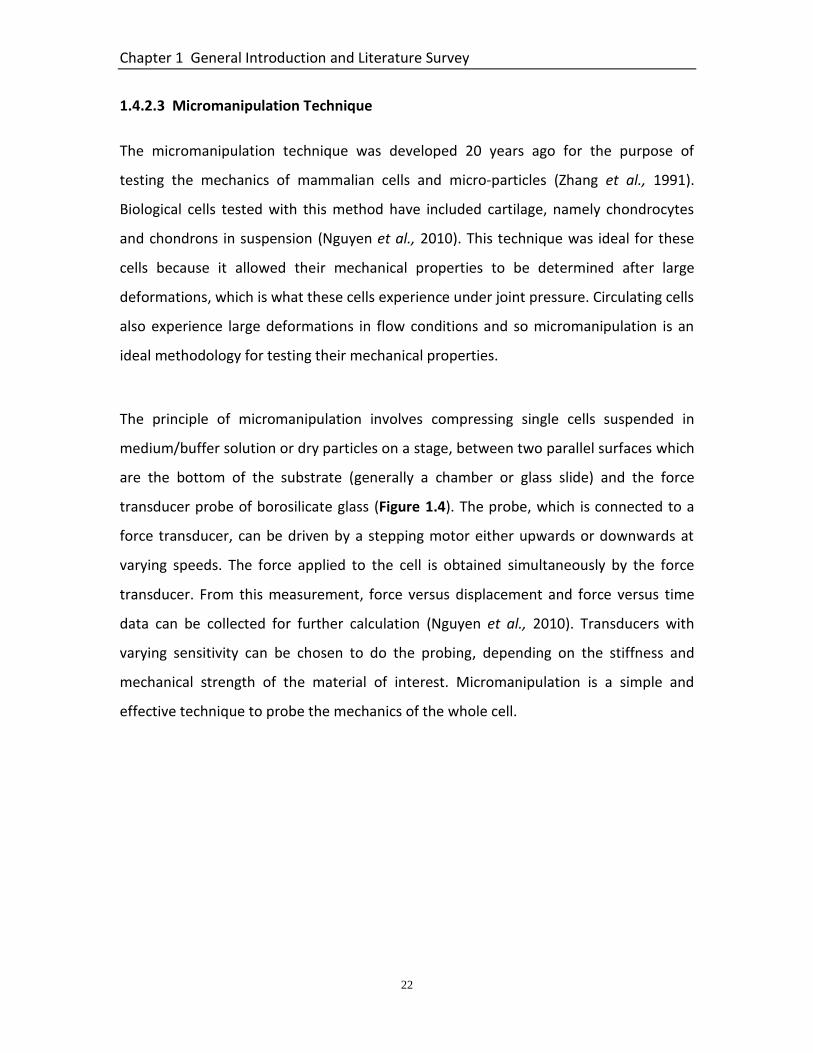
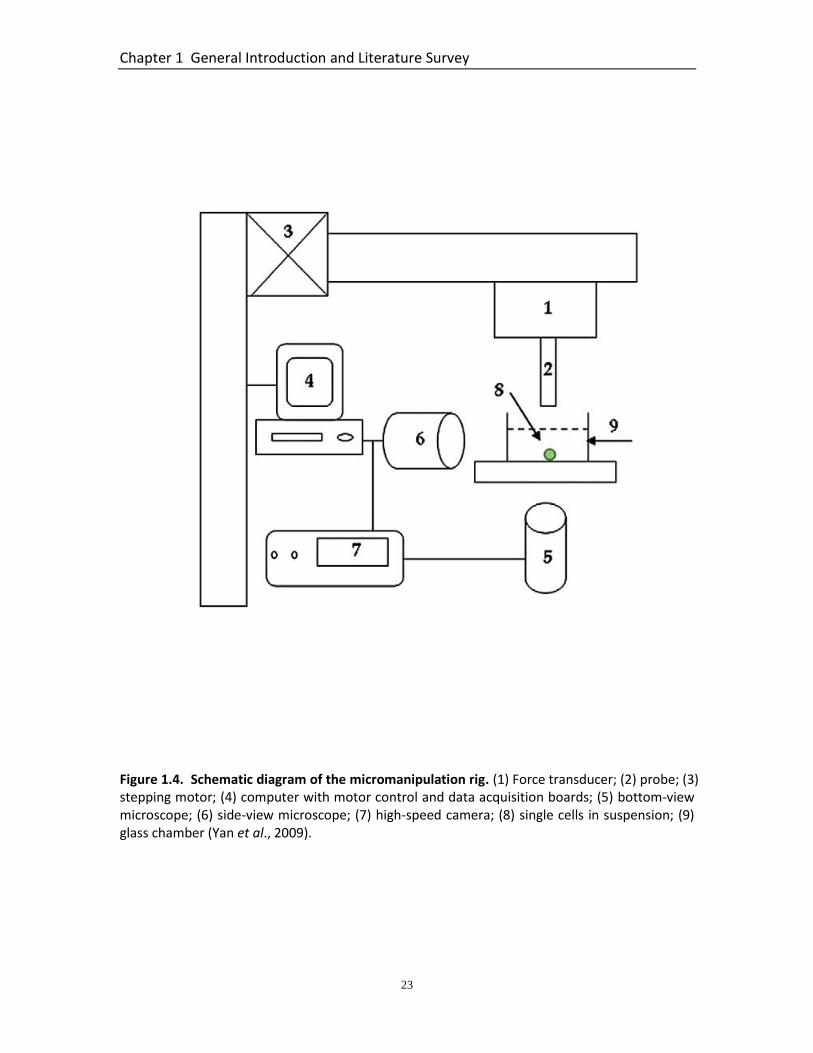
1.4.2.3 Micromanipulation Technique
The micromanipulation technique was developed 20 years ago for the purpose of
testing the mechanics of mammalian cells and micro-particles (Zhang et al., 1991).
Biological cells tested with this method have included cartilage, namely chondrocytes
and chondrons in suspension (Nguyen et al., 2010). This technique was ideal for these
cells because it allowed their mechanical properties to be determined after large
deformations, which is what these cells experience under joint pressure. Circulating cells
also experience large deformations in flow conditions and so micromanipulation is an
ideal methodology for testing their mechanical properties.
The principle of micromanipulation involves compressing single cells suspended in
medium/buffer solution or dry particles on a stage, between two parallel surfaces which
are the bottom of the substrate (generally a chamber or glass slide) and the force
transducer probe of borosilicate glass (Figure 1.4). The probe, which is connected to a
force transducer, can be driven by a stepping motor either upwards or downwards at
varying speeds. The force applied to the cell is obtained simultaneously by the force
transducer. From this measurement, force versus displacement and force versus time
data can be collected for further calculation (Nguyen et al., 2010). Transducers with
varying sensitivity can be chosen to do the probing, depending on the stiffness and
mechanical strength of the material of interest. Micromanipulation is a simple and
effective technique to probe the mechanics of the whole cell.
Chapter 1 General Introduction and Literature Survey
23
Figure 1.4. Schematic diagram of the micromanipulation rig. (1) Force transducer; (2) probe; (3) stepping motor; (4) computer with motor control and data acquisition boards; (5) bottom-view microscope; (6) side-view microscope; (7) high-speed camera; (8) single cells in suspension; (9) glass chamber (Yan et al., 2009).
Chapter 1 General Introduction and Literature Survey
24
1.5 Label-free Cell Separation in Microfluidic Systems
1.5.1 Introduction
Although the mechanical properties of cells can be investigated with micromanipulation
and AFM, these techniques cannot separate the tested cells physically into sub-
populations with different characteristics. This can be achieved using active cell
separation methods, routinely found in most laboratories, that involve biochemical
modification or labeling of cells, such as fluorescent activated cell sorting (FACS) and
magnetic-activated cell sorting (MACS) (Parks et al., 1989, Miltenyi et al., 1990, Gossett
et al., 2010). However, these techniques are often labour intensive and not very
effective. Recently, label-free passive microfluidic systems for cell sorting have been
developed and are based on using the intrinsic biophysical markers of the cell to
separate them. These markers can include cell mechanical properties (size, shape and
deformability), electrical properties (polarizability and impedance), and hydrodynamic
properties.
When a cell suspension sample flows through the microfluidic channel, cell separation
and sorting can be accomplished physically by using microscale filters, or techniques
which can manipulate fluid dynamics in microscale, such as hydrodynamic filtration,
field-flow fractionation and inertial microfluidics. Table 1.1 summarizes different cell
sorting methods and the characteristics of each method regarding their mechanisms,
separation markers and throughput. Compared with the conventional active cell
separation systems, these passive microfluidic separation devices offer a number of
advantages including: 1) reduced sample and reagent cost; 2) high throughput; 3) high
sensitivity and spatial resolution; 4) increased portability and 6) relatively low cost (Sia
and Whitesides, 2003, Bhagat et al., 2010).

Chapter 1 General Introduction and Literature Survey
25
1.5.2 Passive Cell Separation Techniques
Traditionally, passive cell separation techniques make use of the heterogeneity of the
intrinsic properties of the cells in one population to achieve their separation. Because of
their high sensitivity and efficicacy, several different methods have been developed in
recent years. Cell size is a common physical property used for differentiation.
Generation of cell flow in micro-scale filters can selectively direct cells into different
paths and is mainly based on arrays of microscale constrictions or pores which can trap
the larger and more rigid cells. Four types of microfilters have been experimentally
applied for whole blood cell separation: weir, pillar, cross-flow and membrane (Ji et al.,
2008) (Figure 1.5a). Though using the microscale filters is a conceptually straightforward
strategy for cell separation, there are a number of challenges with regards the
throughout and efficiency of the application. Heterogenous cell sizes can induce mesh
clogging or membrane fouling by small cells, resulting in irregular flow locally. Also, very
fragile cells can become damaged or lost when they are pushed through the pores,
especially when throughput is increased.

Chapter 1 General Introduction and Literature Survey
26
Table 1.1. List of the different active and passive separation techniques used to separate cells into specific sub-populations. This table summarizes a variety of passive and active techniques in cell separation and the characteristics of each technique regarding their mechanisms, separation markers and throughput.

Chapter 1 General Introduction and Literature Survey
27
Hydrodynamic filtration in microfluidic devices is a method developed for separating
cells according to size with the use of laminar flow. The microchannel device has
multiple branch points and side channels. The cell suspension in laminar flow is
continuously injected to a branch channel in the direction shown by the arrow in Figure
1.5b. When a cell “a” flows along the sidewalls (the right side wall for instance), if the
centre position of the cell is located in the right region of the borderline A, the cell
migrates to the side channel. While the centre position is on the left of the borderline A,
like cell “b” and cell “c”, the cells do not enter the side channel, flowing in the main
direction. This technique has been applied for separating liver cells from two different
populations, based on the difference in sizes between hepatocytes and non-
parenchymal cells (Yamada et al., 2007). A particle suspension was also accurately and
continuously focused by utilizing the hydrodynamic filtration (Aoki et al., 2009).
Deterministic lateral displacement (DLD) is also a hydrodynamic microfluidic technology
capable of separating cells based on their size in continuous flow. The mechanism relies
on the interaction between suspended cells with an ordered, specific arrangement of
micro-sized circular or triangular posts within the channel where the cell suspension is
pushed in a laminar flow. These posts can divide the fluid into many narrow streams,
the width of which corresponds to the critical diameter (Dc). Cells smaller than the
critical size are allowed to pass following the direction of the main laminar flow (vertical
direction as shown in Figure 1.5c). However, bigger cells are forced to interact with the
posts, the streamlines are changed many times, thus the migration direction is laterally
changed, and cells follow the tilted lanes of the pillar array. The DLD based separation
has been modelled and applied in a variety of biological cells, such as classification of
whole blood (Inglis et al., 2011), separation of cancerous cells (Liu et al., 2013) or
parasite from human blood (Holm et al., 2011).
In the field-flow fractionation (FFF) separation technique, a field (flow, electric,
gravitational, centrifugal, etc.) applies on the fluid suspension or solution in an
Chapter 1 General Introduction and Literature Survey
28
orientation perpendicular to the channel flow (Figure 1.5d). Thus particles in the fluid
are separated based on the balance of the force produced by the velocity profile and
the forces provided by the field. The FFF technique has been successfully applied to
mammalian cell separation from a mixture consisting of human breast cancerous cells
and normal blood cells using dielectrophoretic/gravitational FFF (Yang et al., 1999).
Fixed human and avian red cells and viable Hela cells were separated by steric FFF in a
time frame of less than 15 minutes and their viability was maintained after flowing
through the separation channel (Caldwell et al., 1984).

Chapter 1 General Introduction and Literature Survey
29
Figure 1.5. Different passive separation techniques. (a) Schematics of the microfilter designs. In the weir design, barriers obstruct the flow path to trap cells based on size allowing smaller cells through. In the pillar design, rows of small pillars spaced apart at certain dimensions allow certain size cells to pass between them. The cross-flow filter is derived from the pillar type except that the pillars are perpendicular to the flow path to avoid problems associated with obstructed flow. (b) The principle of the hydrodynamic filtration method to separate and sort cells. (c) Schematic of a deterministic lateral displacement (DLD) pillar array for cell separation (d) Illustration of field-flow fractionation (FFF) principle for cell separation ( Bhagat et al., 2010; Autebert et al., 2012).
Chapter 1 General Introduction and Literature Survey
30
1.5.3 Microfluidic Separation Based on the Inertial Effect
One of the most promising microfluidic techniques to separate and concentrate cells of
interest is called inertial focusing, originally discovered in the 1960s (Segré and
Silberberg, 1961). One of its major recent uses has been to detect cancerous cells within
a blood sample (Hou et al., 2013). Among passive microfluidic techniques, inertial
microfluidics has attracted the most interest in the past two decades due to its precise
manipulation, simple structure, and high throughput (106 cells/min). The flowing
behaviour of a fluid in the microfluidic channels are characterized by a dimensionless
parameter called the Reynolds number (Re), defined as Re = ρUH/μ , where ρ, U and µ
are the fluid density, average velocity and dynamic viscosity respectively, and H is the
characteristic channel dimension (usually < 1mm). Hence Re can describe the competing
action between inertial and viscous forces in the flow. Since the dimensions of
microchannels are very small (normally in micron scale), the Re is usually much less than
100, often less than 1.0. Hence in conventional microfluidics, fluid inertia is regarded
negligible because Re is close to 0 (Re → 0) in Stokes flow regime due to small channel
length and low flow velocity. In this regime, the flow is absolutely laminar without
turbulence. The turbulent flow generally occurs when the Reynolds number increases to
2000. In a laminar flow, generally the transportation of fluids through microchannels
can be predicted. However, when the microfluidic system is working in an intermediate
range between stokes regime and turbulent regime (1 < Re < 100), the Stokes
assumption is no longer valid. In this system both the inertia and the viscosity of the
fluid become finite, in which case nonlinear and unpredictable movements of fluid and
particles are observed. Two resulting effects are thus found in these microchannels: (1)
inertial particle migration and (2) geometry induced secondary flows. Such fluid physics
have been utilized to control and manipulate the movement of the particles/cells in the
channel.

Chapter 1 General Introduction and Literature Survey
31
1.5.3.1 Physics of Inertial Migration
Inertial focusing occurs when particles/cells in a flow spontaneously migrate across
streamlines to equilibrium positions across the microchannels. Particles/cells flowing in
a confined channel experience both shear and normal forces applying on their surfaces.
These forces can be parallel or perpendicular to the main flow direction respectively and
work to drag particles to an equilibrium position where they are force free. In seminal
studies in the 1960’s, it was observed that in a 1 cm-diameter tube, the randomly
distributed particles moves in the cross-section surface to form an annulus with a
diameter of ~0.6 times the tube diameter (Segré and Silberberg, 1961) (Figure 1.6a). In
such systems, since Re is finite and inertia is significant, it is difficult to explain this
phenomenon with dynamic theory at that time. After that, the technique of matched
asymptotic expansions was used to determine the lift forces (FL ) acting on particles with
diameter a, in microchannels with hydrodynamic diameter Dh, which is given by:
242 / hL DaUF (1.1)
Later studies theoretically predicted additional dependence of FL on channel Reynolds
number and the lateral position of particles, such that:
242 /)/(Re, hLL DaUhxfF (1.2)
where fL is a function of Re and the particle cross-sectional position (x/h), which is a
non-dimensional lift coefficient. Recently, a novel scaling for FL was found to be further
dependent on a particle’s position in the channel. Di Carlo’s that (Di Carlo, 2009) work
showed:
hL DaUF /32 , near the channel centreline (1.3)
462 / hL DaUF , near the side walls (1.4)
Chapter 1 General Introduction and Literature Survey
32
The channel wall and centreline were scaled separately suggesting that two disparate
fluid dynamics effects worked to yield the equilibrium positions between centre and
wall of the channel. A balance of two opposing forces was proposed: 1) the wall-induced
lift force (FLW) which drags the particles away from the wall by interaction between the
particle and the adjacent wall and 2) the shear-gradient-induced lift force (FLS), directing
the particles to the channel wall due to the curvature of the axial velocity profile (Amini
et al., 2014). The two forces act together to direct the particles to an equilibrium
position where the particles are laterally force free (Figure 1.6b).
In a tube flow, the particles migrate in the radical direction due to the sole force balance.
However, the current fabrication methods normally generate microchannels with
square or rectangular cross-sections, in which the particles behave in a different manner.
The follow-up experiments and numerical simulations have been done to determine the
complicated dependence of equilibrium positions on the blockage ratio κ (κ = a/H),
where a is the diameter of the particle and H is the channel height), channel Re and the
channel aspect ratio AR (AR = W/H, where W and H are the channel width and height
respectively). Experiments and simulations performed by Kilimnik et al. (2011) produced
results with Re = 0 - 100 and AR = 1 - 10. Rigid spherical particles equilibrated near the
channel centre of the long walls at small AR (≤ 4), whereas for large AR (4 - 10), the
equilibrium position was close to the side walls, which demonstrated that there is a
monotonic dependence of equilibrium position on the channel AR. It also revealed that
larger particles (lower κ) equilibrated more closely to the channel centreline. Data for
different Re almost overlap demonstrating a weak dependence of equilibrium position
on Re (Kilimnik et al., 2011).
1.5.3.2 Inertial Migration in Straight Rectangular Microfluidic Channels
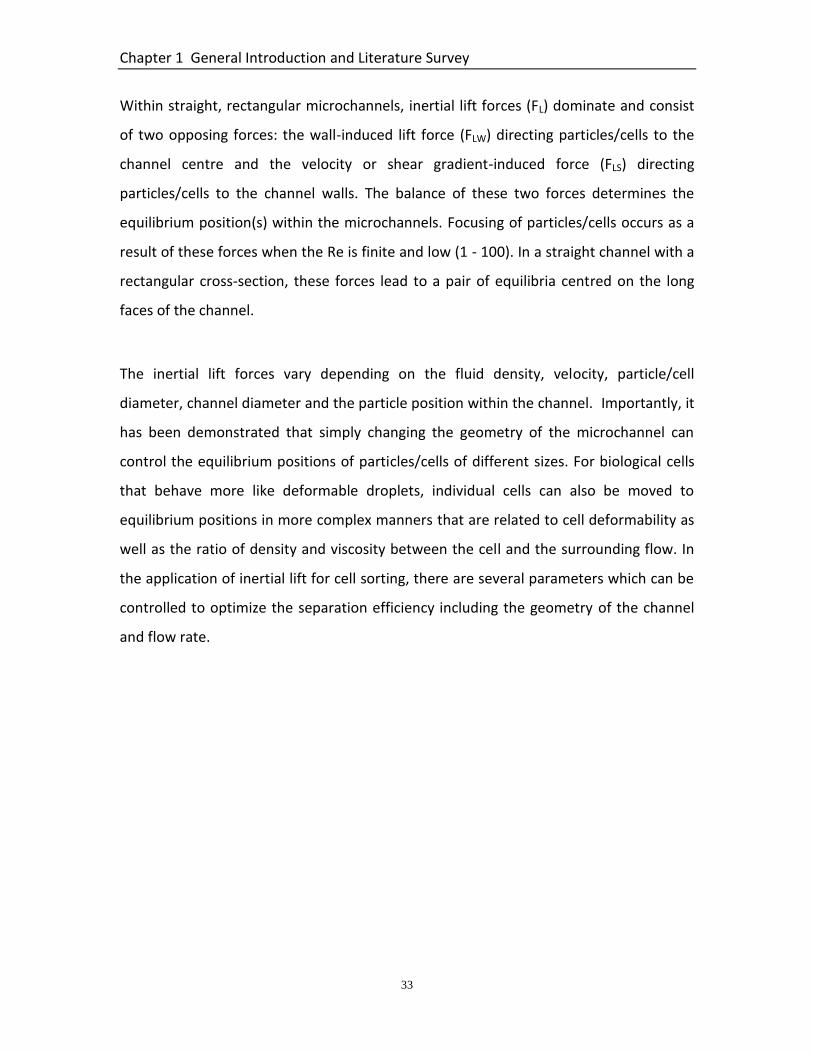
Chapter 1 General Introduction and Literature Survey
33
Within straight, rectangular microchannels, inertial lift forces (FL) dominate and consist
of two opposing forces: the wall-induced lift force (FLW) directing particles/cells to the
channel centre and the velocity or shear gradient-induced force (FLS) directing
particles/cells to the channel walls. The balance of these two forces determines the
equilibrium position(s) within the microchannels. Focusing of particles/cells occurs as a
result of these forces when the Re is finite and low (1 - 100). In a straight channel with a
rectangular cross-section, these forces lead to a pair of equilibria centred on the long
faces of the channel.
The inertial lift forces vary depending on the fluid density, velocity, particle/cell
diameter, channel diameter and the particle position within the channel. Importantly, it
has been demonstrated that simply changing the geometry of the microchannel can
control the equilibrium positions of particles/cells of different sizes. For biological cells
that behave more like deformable droplets, individual cells can also be moved to
equilibrium positions in more complex manners that are related to cell deformability as
well as the ratio of density and viscosity between the cell and the surrounding flow. In
the application of inertial lift for cell sorting, there are several parameters which can be
controlled to optimize the separation efficiency including the geometry of the channel
and flow rate.
Chapter 1 General Introduction and Literature Survey
34
Figure 1.6. Schematic diagram to describe inertial lift generated in a flow. (a) In a tube, at moderate Reynold number (Re), randomly distributed particles are observed to migrates to an annulus located between the channel centre and wall. (b) Two lift forces in perpendicular direction of the flow direction acting to form equilibrium positions in the channel (Di Carlo et al., 2009).

Chapter 1 General Introduction and Literature Survey
35
1.5.3.3 Inertial Migration in Curved Microfluidic Channels - Dean Secondary Flow
In addition to lift forces arising from different forms of nonlinearities or particle
asymmetry in the straight channels discussed above, the effect of having a curved
channel induces secondary flows and can be utilized to manipulate the motions of
particles/cells and fluid. In a curved channel, this secondary transverse flow arises due
to the mismatch of velocity between fluid near the centreline and fluid in the side walls
in the downstream direction as it passes around a curve. Fluids in the centreline have
larger velocity, thus, they obtain larger inertia than fluids near the channel wall, and
tend to migrate outward around a curve. As a results, the pressure gradient in the
radical direction of the channel is generated (Figure 1.7). Because this is an enclosed
channel, relatively stagnant fluids in the top and bottom walls move inwards, creating
two symmetric vortices (Di Carlo, 2009). The strength of this secondary flow varies
depending on the curvature of the microchannel and is characterized by the non-
dimensional Dean number, De. Therefore, although in straight channels channel
dimensions, particle size, Re impact the equilibrium positions, in curved channels an
additional De dictates particle/cell focusing. De, describing the magnitude and
qualitative feature of this flow, was proposed by W. R. Dean (Dean, 1927) as:
R
DUD
R
D
D
UDR
U
D
R
cesviscousfor
rcesinertialfolforcescentripetaDe hhh
h
hh
2Re
2
))()(
())((
2
2
2
(1.5)
where ρ is the density of the fluid, µ is the dynamic viscosity, U is the axial velocity scale,
R is the radius of the channel curvature, and Dh is the channel hydraulic diameter. It
demonstrates that the strength of the secondary flow depends on the Re and the
curvature ratio, which means that a higher flow rate and faster turn in the channel can
lead to a stronger Dean flow.

Chapter 1 General Introduction and Literature Survey
36
Figure 1.7. Inertial migration due to secondary flows arising in curved channels. Dean flow with two counter-rotating vortices is created in curved channels due to the mismatch of velocity direction between fluid in the central and near-wall regions. De is used to characterize the magnitude of secondary flow, De= Re (Dh/2R)1/2 where Dh
is the microchannel hydraulic diameter and R is the curvature radius. De has important effects on the degree of the secondary flow, the centres of the symmetric vortices move towards the outer wall and boundary layers are developed with the increase of De. Flowing cells in a curved channel experience an interaction of inertial lift force (FL) and Dean drag force (FD), and the magnitude and direction of these forces are dependent on their size and deformability (Di Carlo et al., 2009).

Chapter 1 General Introduction and Literature Survey
37
For particles flowing in this system, it is assumed that particles are manipulated in
superposition of the inertial focusing and secondary flow. Therefore, particles that have
moved to inertial lift equilibrium positions would experience the Dean drag force that at
its maximum can be directly proportional to the local secondary flow velocity, which is
perpendicular to the primary flow direction. Consequently, particles would experience a
drag force which is in competition with lift forces, directing particles to new equilibrium
positions. To describe the particle behaviour in this system, a ratio of the two types of
forces (inertial lift/Dean drag) was proposed (Hasabnis, 2015):
32 // HRaFFR DLf (1.6)
This equation describes the order of magnitude scaling between the inertial and
secondary forces. It is useful to predict the particle behaviour: Rf→0, secondary flow
plays the dominating role, and particles remain entrained in it, and Rf→∞, for
sufficiently high flow rate, particles would focus to inertial lift equilibrium positions
without the effect of the Dean flow. While for intermediate Rf, particles will migrate to
inertial equilibrium positions which can be modified by the Dean flow, creating new
migration modes and applications. The equation also demonstrates that Rf is related to
particle size so that particles with different sizes can experience different focusing
behaviour. Despite that Rf is a simple parameter to characterise the curved channel
system, the precise mechanism of secondary flow focusing is complicated and not fully
understood experimentally and theoretically, but this does not prevent us from applying
these systems for particle/cell focusing.
1.5.3.4 Inertial Focusing of Deformable Particles
In describing inertial focusing behaviour, rigid particles have been used as simple
components for theoretical and experimental studies. Such research has provided a
solid foundation for microfluidic applications in particle separation and enrichment
based on size. However, in applications of interest, particles are often not rigid, but

Chapter 1 General Introduction and Literature Survey
38
deformable, such as biological cells and two-phase emulsion droplets. In these cases,
the flow behaviour of these particles may not be the same as that of rigid particles and
their noticeable deformations caused by hydrodynamic forces should be considered. To
study the motion of these particles in flow, three models have been used to
approximate a deformable particle: 1) an elastic solid particle, which is considered as a
continuous single solid body, 2) a deformable droplet - a boundary filled with fluid which
can also slip under the driving flow, and 3) a deformable capsule – a deformable but
solid shell filled with fluid (Amini et al., 2014). HSCs of interest in this study are
considered to be deformable and they may behave more like droplets than rigid
particles in microchannels (Hur et al., 2011). It was first demonstrated that deformable
droplets could migrate in lateral direction in Strokes flow, indicating that droplets can
migrate even at Re = 0, only if they deform (Karnis et al., 1966). Several theoretical,
numerical and a few experimental studies on lateral motion of deformable particles have
been conducted to explain this phenomenon. The essential factor responsible for the
deformation and consequent lateral migration of droplets is found to be stress matching
type of boundary conditions at the corresponding interface instead of non-slip condition
at the boundary of rigid wall. Later studies report that the direction of migration
depends on the type of deformable particles and its relative viscosity with respect to the
surrounding fluid. The latter parameter can be quantified by the viscosity ratio of the
droplet to the surrounding flow, λ = µin/µex. Karnis and colleagues reported that in Stokes
flow (Re << 1), the highly deformable droplets migrated to the centreline if λ is low
(0.0002 - 4.8), while droplets with high λ behaved like rigid particles and suspended at a
position between the centreline and channel wall (Karnis et al., 1966). Therefore, the
droplet migration in non-zero Re depends on the competition or balance between the
deformability-induced lift and the inertia lift, and the deformability-induced lift
increases with increasing deformability. A number of investigations have demonstrated
that with AR of 2, 3 and 5, deformable droplets and cells tended to migrate to near the
channel centre when the relatively rigid ones obtained equilibrium positions near the
channel walls (Stan et al., 2013, Kilimnik et al., 2011). It can be simply attributed to that

Chapter 1 General Introduction and Literature Survey
39
the deformability-induced lift can move deformable particles away from the migration
direction of rigid particles that do not have deformation.
1.6 Adoptive T Cell Therapy
1.6.1 Procedure and Challenges of T Cell-Based Therapy
The use of SC-based therapies has increased for a variety of different inflammatory,
ischemic and degenerative disorders. However, cells other than SCs, particularly
immune cell therapy have also witnessed tremendous expansion in the past two
decades. Most explored has been the use of adoptive antigen (Ag)-specific T cell
immunotherapies for viral infections and cancers (Mount et al., 2015). T cells for
adoptive immunotherapies can be generated through in vitro expansion or
immunomagnetic isolation of pre-existing Ag-specific lymphocytes from blood or tumor-
infiltrating lymphocytes. The former method has the drawback of driving T cells to
exhaustion through repeated cycles of in vitro antigen stimulation and expansion, which
ultimately impacts on their efficacy to eliminate tumour or infected cells (Klebanoff et
al., 2012). This is in contrast to direct in vitro selection which requires minimal
manipulation and thus retains the proliferative capacity and therapeutic functionality of
the lymphocytes. For this reason, immunomagnetic selection of fresh ex vivo cells has
been adopted in recent clinical trials where a small number of pre-existing circulating
virus-specific T cells can be directly selected from donor blood to target viral infections
and tumours in stem cell transplant patients (Peggs et al., 2003, Moosmann et al., 2010,
Feuchtinger et al., 2006). This method has been used in the treatment of
cytomegalovirus, adenovirus infections and Epstein–Barr virus, and also lymphomas
such as post-transplant lymphoproliferative disorder. Immunomagnetic selection
systems utilize antibody or ligand-recognition of unique phenotypic markers on the cell
surface to separate cells. With the recent breakthrough in utilizing T cells expressing the
CD19-specific chimeric antigen receptor (CAR) to treat B cell acute lymphoblastic
leukaemia, selection of Ag-specific cells could also become a key purification step in the

Chapter 1 General Introduction and Literature Survey
40
in vitro expansion of immunoreceptor engineered cells. However, there are limitations
in immunomagnetic methods with regards to the loss of low frequency cells through
multiple processing steps such as washes and sub-optimal purity and recovery from the
selection itself, and not least, the costs of the specialized GMP reagents. An alternate
approach to immunomagnetic isolation, is to select cells using clinical grade FACS
(Cepok et al., 2005, Kodituwakku et al., 2003, Sung et al., 2008). Though highly sensitive
and specific, FACS sorting of rare cells (< 1%) to therapeutic quantities, is time
consuming and associated with the risk of reduced cell viability (Wulff et al., 2006).
1.6.2 Potential Use of Microfluidic Systems in Isolation of Antigen-Specific T cells
As stated earlier, the biophysical properties of cells also allow different cell types to be
discriminated. For example, in flow cytometry the cell size determines light scattering
properties, and in apheresis, centrifugal forces separate blood into its constituent
cellular components based on their sizes. An emerging technique based on microfluidic
separation utilizes the biophysical properties of live cells by applying different
hydrodynamic forces on the target particles or by utilizing the natural biomechanical
variation of the cells to guide them into different flow paths (Tsutsui and Ho, 2009).
Studies reporting cell sorting based on size or stiffness demonstrate the potential
applications of the microfluidic cell sorting technique for separating tumour cells,
erythrocytes as well as activated Ag-specific T cells (Chwee Teck Lim, 2014, Hou et al.,
2010, Hur et al., 2011, Preira et al., 2013). It should therefore be possible to use natural
or induced variations in biomechanical properties to separate activated lymphocytes
from non-activated lymphocytes and other cell types.
1.7 Summary
Despite the emerging evidence that SCs, such as HSCs, can help to treat a variety of
ischaemic and inflammatory disorders, their benefits are either minor or less efficient.
This has been partly attributed to poor homing or trafficking of systemically delivered

Chapter 1 General Introduction and Literature Survey
41
HSCs to actual sites of injury. If SCs are to be potentially used in the treatment of
regenerative diseases or the repair of ischemic or inflamed organs, it is obvious that
strategies to increase HSC retention within injured tissues need to be urgently
developed. The route of administration for cell delivery is critical in the introduction of
SCs into the injured organ. Cardiac tissue repair has been approached using
intracoronary and direct intramuscluar delivery of SCs locally (Dimmeler et al., 2008,
Ott et al., 2005, Sherman et al., 2006). However, this local delivery method may not
always be practically possible for other organs. Indeed for inflammatory diseases of the
gut such as Crohn’s disease, colitis or inflammatory bowel disease, often a significant, if
not whole, length of the gut is damaged. For such organs, local injection of SCs would
not be possible as multiple sites of injection would be required, making this a very ‘cell
hungry’ means of delivery. For such disorders, systemic administration of SCs into the
bloodstream would be preferable (Willing et al., 2008). Systemic delivery relies on the
local microcirculation of the injured organ to capture SCs as they home or traffick
through that organ. This homing efficiency and subsequent capture or adhesion of SCs
within injured organs is certainly poor and may be explained by a number of factors
including a loss of SCs to the peripheral circulation as they pass through the pulmonary
microcirculation where they become entrapped. This occurs either due to their size or
poor deformability making it difficult for them to pass through the limited space of the
capillaries.
It is possible therefore that the infusion of a more deformable sub-population of SCs
may improve their homing efficacy by preventing non-specific tissue entrapment and
thus increasing the number of circulating cells available for capture from the peripheral
blood. However, no studies to date have investigated whether isolated SCs actually even
exist as a heterogeneous population with regards their biomechanical properties. If they
do, this could be exploited to isolate and inject in patients only SCs with physical
properties that can potentially enhance their therapeutic efficacy clinically. It is
anticipated that microfluidic devices, particularly those based on the combined inertial

Chapter 1 General Introduction and Literature Survey
42
effect and secondary flow, may have the potential to perform this isolation procedure.
Indeed, it has been experimentally demonstrated that particles and different cell
populations can be separated in either straight or curved microchannels depending on
the variation of their sizes and deformability.
The use of microfluidics may not be restricted to improving the efficacy of just SC-based
cellular therapy. T cell therapy has also garnered significant recent interest clinically for
a different class of diseases. However, their efficacy would be improved if the
separation of Ag-specific T cells could be performed as currently this is the limiting step.
It is proposed that activated T cells obtain different biophysical and mechanical
properties compared with T cells before activation. This phenomenon may aid in their
separation using microfluidics. However, before we can utilise microfluidic assays to
separate lymphocytes for clinical therapeutic purposes, a more precise study of their
biomechanical properties is needed. Parameters such as cell rigidity and deformability
can be measured using several techniques including AFM, micromanipulation, magnetic
tweezers, micropipette aspiration, optical tweezers, shear flow, cell stretching and
microelectromechanical systems (Neubauer et al., 2014). Powerful techniques such as
AFM have previously been used to describe the elastic properties of lymphocytes, but
only deform a portion of the cell surface (nano-indentation) rather than cell mechanical
properties on the whole cell scale (Cai et al., 2010). However, circulating lymphocytes
experience significant repeated hydrodynamic and mechanical stresses in blood vessels,
which are applied along their entirety leading to large deformations in the
microcirculation. These are particularly seen following lymphocyte activation when they
transmigrate out of blood vessels into the surrounding interstitial tissue. Therefore, it is
important to characterise the mechanical property parameters of lymphocytes under
large, as well as small, deformations. Of the techniques mentioned, micromanipulation,
on the basis of compressing single cells by two flat parallel surfaces, can be used to
generate large deformations of cells, including deformations until they rupture, but can
also reversibly compress cells to small deformations (Nguyen et al., 2010).

Chapter 1 General Introduction and Literature Survey
43
To summarise, the need to identify strategies that can separate (i) smaller and more
deformable SCs and (ii) activated T cells is required to improve the benefits of these
various types of cellular therapies. If microfluidic systems can isolate one type of cell
from a heterogenous mixture of cells with high efficiency, then it is quite likely that they
are able to separate sub-populations of the same cell type based on mechanical
differences. However, a detailed characterisation of the mechanical properties of these
cell types is needed and micromanipulation and/or AFM methods may be able to
provide this information.
1.8 Aims and Hypotheses
The aim of this thesis was firstly to utilise micromanipulation and AFM methodologies to
characterise in detail the mechanical properties of HSCs after exposure to large and
small deformations. It is hypothesised that HSCs isolated from the same site, such as the
BM, potentially exist as a heterogenous population with regards their deformability.
Specifically, this study aimed to compare the stiffness of HSCs with another BM-derived
SC, namely the MSC, and also with blood neutrophils. For lymphocytes, this project
aimed to also use micromanipulation to test whether antigen activation can change
their biochemical properties. It has been demonstrated that pre-treating HSCs with
soluble inflammatory mediators such as SDF-1ɑ or H2O2 enhanced their adhesion within
injury sites. Basic micropipette aspiration methodology suggested this may be due to
improvements in SC deformability, which would have limited non-specific entrapment.
This project aimed to characterise, in a more sensitive assay, whether biochemical pre-
treatment strategies using pro-inflammatory soluble mediators could modify the
physical parameters of SCs.
The ultimate aim was to assess whether sub-populations of SCs (if they exist) based on
physical properties could be isolated and whether infusion of the more deformable sub-
group maintained a circulating pool of SCs in vivo. A range of fabricated microfluidic

Chapter 1 General Introduction and Literature Survey
44
devices will be tested to identify the most efficient and effective at separating cells. Two
straight and three curved microfluidic devices, in which their geometry is altered, will be
designed and used to allow identification of a device that can effectively separate SCs
based on size and deformability. Spiral devices will permit to assess whether the
coupling of inertial focusing and secondary Dean flows impacts on the efficiency of SC
separation. It is hypothesized that sub-populations of SCs with different sizes and
deformability can be separated when passing through at least one of these devices by
modulating the channel aspect ratio and flow parameters. This hypothesis will be
validated by microfluidic flow experiments.
The impact of deformability on SC trafficking in vivo to the injured mouse gut will be
assessed using fluorescent intravital microscopy (IVM). This technique allows direct
imaging of the microcirculation of various organs in vivo in anaesthetised mice. Indeed,
recent advances in intravital imaging methods have made it possible for live monitoring
of infused cells in living animals (Rodriguez-Porcel, 2010). Following this, the ability of
HSCs to home to the ischaemia-reperfusion (IR) injured small intestine will be
investigated. IR injury induces a significant cellular and microvascular damage to tissues
and organs resulting from the return/reperfusion of blood flow to previously ischemic
tissues or organs. This injury often occurs during a wide array of routine surgical
procedures, such as organ transplantation which can inevitably hamper the blood
supply (King et al., 2000), as well as many other clinical pathologies including stroke,
myocardial infarction and limb ischaemia (Collard and Gelman, 2001). The return of the
blood supply or reperfusion produces a number of inflammatory responses that both
heighten local tissue and microvascular damage and lead to a systemic insult as well
(Dorweiler et al., 2007). The clinical outcomes of IR injury can be severe and diverse
including direct organ dysfunction, breakdown of the gastrointestinal barrier, systemic
inflammatory response syndrome and multi-organ dysfunction syndrome (Collard and
Gelman, 2001).
Chapter 1 General Introduction and Literature Survey
45
1.9 Outline of the Thesis
Chapter 1 contains a literature review on the background and emerging challenges of
cellular therapy, techniques used to test the mechanical properties of animal cells, and
the current marker free approaches using microfluidic devices to separate cells of
interest.
Chapter 2, the materials and methods section explains clearly how this study was
conducted and describes the used experimental techniques and data analysis in detail.
Chapter 3 presents the key results of mechanical characterization of HSCs with
micromanipulation and AFM techniques. The values of Young’s modulus and nominal
rupture tension/stress of single HSCs from micromanipulation measurements were
calculated to determine the mechanical parameters of the whole-cell network. The
Young’s modulus of cell membrane was extracted from AFM measurements by fitting
the experimental data to the Hertz model. Reorganization of actin filaments in response
to SDF-1α or H2O2 pretreatment was displayed. The mechanical parameters of
neutrophils and MSCs based on micromanipulation were obtained and compared with
HSCs.
Chapter 4 presents the results of HSCs sorting using different microfluidic systems. The
separation effectiveness of each system was assessed in terms of precision and
throughput. The optimum operating conditions of the microfluidic systems for cell
sorting were determined with the help of micromanipulation tests on isolated HSCs. The
possible underlying mechanism of the lateral migration of cells was revealed. The
isolated HSCs using a spiral microfluidic system were infused into intestine IR injured
mice. The free flowing and adherent cells were continuously observed and quantified to
verify the benefit of the cell sorting system.

Chapter 1 General Introduction and Literature Survey
46
Chapter 5 presents preliminary mechanical property data of CD8+ T lymphocytes before
and after being activated for a period of time (4 days). The size and mechanical property
change accompanying the activation process were displayed, and the mechanical
property parameters include Young’s modulus, nominal rupture stress/tension and
deformation at rupture.
Chapter 6 summarises and discusses the major findings, and proposes
recommendations for future research.
Chapter 2 Materials and Methods
47
Chapter 2
Materials and Methods
Chapter 2 Materials and Methods
48
2.1 Introduction
In this study, the mechanical properties of murine HSCs were determined and compared
to murine blood neutrophils and also to murine MSCs. Two methods were utilised –
micromanipulation to assess cell mechanical properties corresponding to large
deformations and atomic force microscopy (AFM) causing small deformations of the cell
surface. All types of circulating cells experience significant repeated hydrodynamic and
mechanical stresses in blood vessels, which are applied along their entirely leading to
large deformations in the microcirculation. Therefore, it is important to characterise the
physical properties of stem cell populations at large deformations, as well as small
deformations. Micromanipulation, on the basis of compressing single cells between two
flat parallel surfaces, can be used to generate small to large deformations of cells,
including deformations where the cells are actually ruptured (Nguyen et al., 2010).
Important mechanical parameters such as percentage deformation at rupture, rupture
force, nominal rupture stress (σR), nominal rupture tension (TR) and the Young’s
modulus (elastic modulus of the cell) were determined. The effects of pre-treating with
key inflammatory markers, including stromal cell derived factor-1 (SDF-1ɑ), keratinocyte
chemoattractant (KC), and hydrogen peroxide (H2O2) on cell deformability were also
comprehensively measured using the micromanipulation and AFM techniques. To
provide some indication of how potential changes in deformability were induced, the
polymerization of F-actin filaments after pre-treatment was analysed quantitatively
using flow cytometry and confocal microscopy. These results are presented in Chapter 3.
After cell mechanical properties were characterised, it was further investigated whether
any heterogeneity in the mechanical properties of HSCs could be exploited to separate
cells into more soft/deformable and more rigid sub-populations. To do this, microfluidic
devices were utilised to separate cells based on various principles, including micro-scale
filters, hydrodynamic filtration (laminar flow), deterministic lateral displacement, field-
flow fractionation and inertial effect. In this project, the inertial effect in five different
Chapter 2 Materials and Methods
49
microchannels was used to sort cells. Inertial force is the force due to the momentum of
the fluid. These microfluidic systems provide a label-free method to sort cells based on
their size and deformability variations with the ultimate aim of injecting only the more
deformable sub-population to enhance HSC circulation and recruitment in vivo.
Microfluidic systems with different channel geometries were designed and fabricated
for separating smaller and more deformable HSCs from one heterogeneous population.
The separation efficiency and throughput of the five different devices were assessed at
varying flow rates. These results and the in vivo implications are presented in Chapter 4.
In addition to separating stem cells on the basis of their deformability, it should also be
possible to use natural or induced variations in biomechanical properties to separate
activated lymphocytes from non-activated lymphocytes and other cell types. Before we
can utilize microfluidic assays to separate lymphocytes for clinical therapeutic purposes,
a precise study of their biomechanical properties is needed. The micromanipulation
technique was thus applied to measure the temporal biomechanical changes of CD8+ T
cells following antigen (Ag)-induced stimulation. Again, the various mechanical strength
parameters such as rupture force, rupture deformation, nominal rupture stress/tension
for resting (unactivated) and activated T cells were determined. The compression data
of T cells corresponding to smaller deformations obtained by micromanipulation was
modelled to obtain a measure of the elasticity, defined as the Young’s modulus. This
work provides important new data on the biomechanics of activated CD8+ T cells which
can be used for future development of microfluidic separation of cells that can
selectively respond to specific antigen stimulation. These results are presented in
Chapter 5.
The current chapter details the sample preparation, reagents, techniques and
experimental procedures used to generate thesis data.
Chapter 2 Materials and Methods
50
2.2 Preparation of the Different Cell Types
2.2.1 Haematopoietic Stem Cells –Immortalised HPC-7 Cell Line
Since HSCs are rare cells, it is difficult to isolate enough cells from the mice for
experimental research. Indeed, intravital microscopy studies looking at HSC circulation
in vivo have been hampered by the difficulty in separating enough numbers for
observation following systemic infusion (Chen et al., 1997). Therefore, all studies utilized
a murine hematopoietic progenitor cell line called HPC-7 (kind gift of Professor Leif
Carlsson, Umea University, Sweden). This functionally relevant cell line was generated
and immortalised by transfection of LIM-homeobox gene, Lhx2 into murine embryonic
SCs. This cell line displays the critical characteristics of pure primary HSCs, such as being
highly enriched for surface markers characteristic of the most immature HSCs (c-kit+,
Sca-1+, CD34-, Lin-) (Pinto et al., 1998, Pinto et al., 2002). The Kalia group (University of
Birmingham) have further characterised the HPC-7 surface adhesion molecule profile
and found it to be similar to primary HSCs (Kavanagh et al., 2013, Kavanagh et al., 2010).
They have also utilized HPC-7s to model hepatic HSC recruitment for intravital studies.
Such studies include investigating the mechanisms of adhesion and subsequent steps of
HPC-7s in the injured kidney or intestinal microcirculation and their retention to injured
murine liver sinusoids (Kavanagh et al., 2013, Kavanagh et al., 2010). Therefore, the
immortalized HPC-7 cell line was also used in this study. HPC-7s were cultured in Stem
Pro-34 SFM media with the manufacturer’s medium supplement (Life Technologies,
Paisley, UK ), 100 ng/ml Stem Cell Factor (SCF, Life Technologies), 2 mM L-Glutamine
(PAA, Somerset, UK), 50 U/mL penicillin and 50 U/mL streptomycin (PAA).
2.2.2 Culture of the Murine HSC Cell Line, HPC-7s
Since HPC-7 growth was sensitive to their density, cells were counted on a daily basis
and maintained at the density of between 0.8 - 1.3×10⁶ cells/mL by controlling the

Chapter 2 Materials and Methods
51
medium volume. To determine cell density, trypan blue (1:1 v/v) was added to the cell
suspension. Cells that had taken up the trypan blue dye were considered non-viable and
those that excluded the dye were counted as viable. Approximate 20 µL of the mixed
suspension was viewed under a microscope with a ×10 objective. The number of cells
not taking up the blue stain (viable cells) in four 1 × 1 mm2 grids of a standard
haemocytometer was counted. The average number from the four grids was calculated
and multiplied by 2 × 10⁴ to yield the density of cells (cells/mL). Cells were harvested
from the cell suspension by centrifugation (300 × g, 5 min) for further experiments.
2.2.3 Isolation and Expansion of Murine Bone Marrow-derived MSCs
Bone marrow-derived MSCs were obtained as described in detail elsewhere (Houlihan et
al., 2012). Briefly, muscles and surrounding tissues were taken off from the fibulae and
tibiae of male C57BI/6 mice aged between 8 and 12 week adult. Bones were broken,
followed by the digestion of marrow contents in 0.2% collagenase solution(Wako
Chemicals, Osaka, Japan) in DMEM (Sigma-Aldrich, Poole, UK). Then cells were isolated
as a result of mechanical dissociation from the bone. Subsequently, MSCs were
selectively collected from suspensions by the use of flow cytometry (MoFlo XDP,
Beckman Coulter, HighWycombe, UK). FITC conjugated anti-mouse Sca-1 (Ly6A/E; Clone
D7, eBioscience, Hatfield, UK), PE conjugated anti-mouse CD45 (30-F11, eBioscience,
Hatfield, UK), PE conjugated anti-mouse TER-119 (Clone TER-119, eBioscience, Hatfield,
UK) and APC conjugated anti-mouse CD140a (PDGFRα; Clone APA5, eBioscience,
Hatfield, UK) were labelled to the suspensions. Suspensions after being labelled were
washed and re-suspended in Hanks’ balanced saline solution (Sigma-Aldrich) with
propidium iodide (eBioscience, Hatfield, UK). MSCs were sorted and enriched resulting
from positive staining for Sca-1 and CD140a, and negative staining for TER-119, CD45
and PI (Kavanagh et al., 2015). This criterion harvests an enriched population of
proliferative murine MSCs. Isolated MSCs were cultured in a 6-well plate and
maintained in Minimum Essential Medium Eagle - Alpha (MEM) supplemented with 10%
fetal bovine serum (FBS; Sigma-Aldrich), L-glutamine (PAA Laboratories, Yeovil, UK),

Chapter 2 Materials and Methods
52
penicillin/streptomycin (PAA) and 10 ng/mL transforming growth factor-β (TGFβ; New
England Biolabs, Herts, UK). This culture medium was changed every 3 days to obtain a
cellular confluence of 90%. Cells between passage 4 and 9 used for experiments were
recovered by incubating them for 5 min at 37C with 0.25% trypsin/EDTA solution.
Immediately after trypsinization, cells were collected with a pipette, transferred to a
15mL conical tube and centrifuged at 300 × g for 5 min. Cells were re-suspended in
phosphate buffered saline (PBS) for mechanical testing.
2.2.4 Isolation of Murine Neutrophils
The density gradient separation method was used to isolate murine neutrophils from
bone marrow as previously described in detail (Nauseef, 2007). Briefly, rear legs were
removed from 8-12 week adult male C57BI/6 mice, and the bone marrow was carefully
aspirated into a syringe. This cell suspension was filtered, washed and centrifuged and
cells re-suspended in 2mL EDTA (Sigma-Aldrich). A percoll gradient (2.5 mL 72%, 2.5 mL
64%, 2.5 mL 52%) was set up in a 15mL falcon tube, onto which the cell suspension was
added. The percoll gradient dilutions were prepared from 100 % percoll (Sigma-Aldrich)
and PBS. The gradient was spun at 1500 × g for 3 min to separate the neutrophils, from
which a fuzzy band of cells were seen at the interface of the 72% and 64% Percoll. By
removing the percoll and cells above it, which was then discarded, the neutrophils were
collected, washed and re-suspended in 1 mL PBS for mechanical testing.
2.2.5 Pre-treatment of HPC-7’s Using SDF-1α, KC and H2O2
SDF-1ɑ and KC (Peprotech, UK) solution was made at a primary concentration of 10
µg/mL which contained 0.1% bovine serum albumin (Sigma-Aldrich, Poole, UK). Both
were then diluted to working concentrations of 10 ng/mL in 1 mL PBS for pre-treatment
studies. H2O2 (Sigma-Aldrich, Poole, UK) was made at a high concentration of 8.8 M
prior to use and diluted to 100 µM with PBS (Life Technologies) for subsequent pre-
treatment experiments. 1 × 10⁶ HPC-7 cells were obtained from a cell suspension by

Chapter 2 Materials and Methods
53
centrifugation (300×g, 5min) and pre-treated for 30 min with either the vehicle control
(PBS), SDF-1ɑ, KC or H2O2 at 37⁰C. After pre-treatment, cells were washed and re-
suspended in PBS and mechanically tested within 2 h.
2.2.6 Isolation, Culture and in vitro Activation of Human T Lymphocytes
Peripheral blood was collected from three healthy drug-free donors after informed
consent (Ethics ref: 11/WM/0315). Peripheral blood mononuclear cells (PBMC) were
isolated by Ficoll separation (Reinherz et al., 1979). Briefly, the contaminating
erythrocytes were removed by osmotic lysis and 1 ml of distilled water was added to the
cell pellet. After 30s, 14 ml of RPMI 1640 (Sigma-Aldrich) was added, and the cells were
washed once. CD8+ T lymphocytes were isolated by negative immunomagnetic
separation using a commercial CD8+ T Cell Isolation Kit and LS columns (Miltenyi Biotec,
Bergisch Gladbach, Germany). PBMC were labelled with anti-CD3/PE antibody (Dako,
Denmark) and CD3+ cells were separated using anti-PE MicroBeads and LS columns
following the manufacturer’s instructions. Cell purity was checked using a FacsCanto II
flow cytometer (BD, San Jose, CA, USA) and in all the cases the T lymphocyte purity was
above 90%. Enriched T lymphocytes were re-suspended in RPMI 1640 plus 10% foetal
calf serum (Sigma-Aldrich). Some cells were activated by culturing in the presence of
30ng/mL of the anti-CD3 antibody OKT3 (BioLegend, San Diego, CA, USA) plus 600 U/mL
IL-2 (Chiron, Emeryville, USA). The mechanical properties of resting and activated CD8+
T lymphocytes were measured either immediately after harvesting (day 0) or tested 2
days or 4 days post-activation. Cells were diluted with PBS to reduce cell density in
suspension and mechanical testing was completed within 3 h.

Chapter 2 Materials and Methods
54
2.3 Calibration of Micromanipulation System
2.3.1 Introduction of the Micromanipulation Rig
The mechanical properties of cells were measured with a micromanipulation as shown
in Figure 1.4 in Chapter 1. The principle and details of this technique have been given
elsewhere (Nguyen et al., 2009a, Nguyen et al., 2010). Briefly, the technique involves
compression of a single cell between the flat end of a probe and the bottom of a glass
chamber containing the culture medium. Suspended single cells were allowed to settle
to the bottom of the transparent chamber, and images were captured with a side-view
high-speed digital camera. A probe with a 25 µm diameter flat end was driven
downwards by a stepping motor towards the single cells. The probe had been made by
pulling a borosilicate glass rod (~500 m diameter) in heat and polishing one end using
a microgrinder (NARISHGE Ltd, United Kingdom). The probe was connected to a force
transducer (406A-ER, Aurora Scientific Inc. Canada) which collected the data of
instantaneous force imposed on single cells at a frequency of 50 Hz. From the
measurement, force versus time and force versus displacement data could be obtained.
2.3.2 Calibration of Force Transducer Sensitivity
The sensitive 406A-ER force transducer was used to collect the data of forces imposed
on single cells. On this force transducer, the manufacturer perpendicularly glued a glass
tube onto a cantilever beam which could deflect when a force was applied on it and
induce the output of a voltage alteration. The bigger the force applied onto the tube,
the more cantilever beam deflected, resulting in a bigger change of output voltage. The
force transducer sensitivity was defined as a change in the applied force per unit change
of voltage which needed to be calibrated prior to the experimental test.
The calibration procedure has been specifically presented elsewhere (Liu, 2010). Briefly,
the 406A-ER force transducer was inversely placed on a flat stage and fixed by Blue-Tac.

Chapter 2 Materials and Methods
55
A piece of paper was cut into tiny papers in square shape which had various weights
(0.75 mg, 1.5 mg, and 3 mg). When there was no paper on the tube, the output voltage
was recorded as the baseline. The calibration procedures were undertaken in triplicate
by considering the possible signal fluctuation and weight variation. Subsequently, one or
several pieces of paper were put onto the top of the tube in sequence in order to get
different loading force. The corresponding voltage was recorded after each piece of
paper was carefully added and remained stable. The force applied onto the transducer
was calculated by multiplying paper weight with the gravitational constant G (9.8 m/s2).
The relationship between the applied force and change of voltage is shown is by
Equation 2.1.
F = ∆V*Ks (2.1)
where F is the applied force, ∆V is the change of voltage compared with the baseline
and Ks is the transducer sensitivity.
The calculated sensitivity of the 406A-ER transducer was 0.0558 mN/V. Additionally,
transducers could be selectively connected with a ×10 signal amplifier to further
increase the sensitivity considering the fragile property of cells.
2.3.3 Calibration of Image Size on the TV Screen
The side view camera was connected to a ×35 objective used to capture the image of
the cells. The diameter of these cells could then be measured through the TV screen.
The dimention of images on the screen was accurately calibrated before performing
such measurements. A standard measurement graticule of 100 µm in length was
vertically fixed in front of the lens and the scale image on the screen was accurately and
clearly marked.
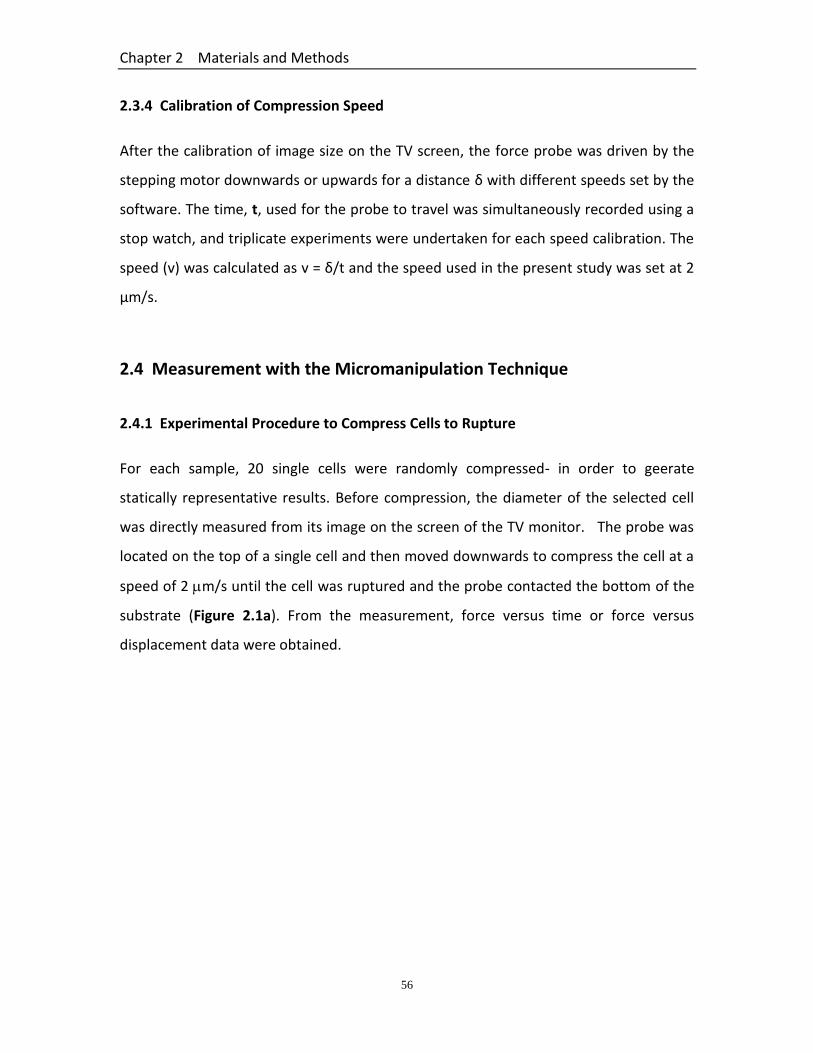
Chapter 2 Materials and Methods
56
2.3.4 Calibration of Compression Speed
After the calibration of image size on the TV screen, the force probe was driven by the
stepping motor downwards or upwards for a distance δ with different speeds set by the
software. The time, t, used for the probe to travel was simultaneously recorded using a
stop watch, and triplicate experiments were undertaken for each speed calibration. The
speed (v) was calculated as v = δ/t and the speed used in the present study was set at 2
μm/s.
2.4 Measurement with the Micromanipulation Technique
2.4.1 Experimental Procedure to Compress Cells to Rupture
For each sample, 20 single cells were randomly compressed- in order to geerate
statically representative results. Before compression, the diameter of the selected cell
was directly measured from its image on the screen of the TV monitor. The probe was
located on the top of a single cell and then moved downwards to compress the cell at a
speed of 2 m/s until the cell was ruptured and the probe contacted the bottom of the
substrate (Figure 2.1a). From the measurement, force versus time or force versus
displacement data were obtained.

Chapter 2 Materials and Methods
57
Figure 2.1. Schematic diagrams illustrating the micromanipulation and AFM compression methods. (a) The compression process of an individual cell between two flat surfaces with the micromanipulation technique. The big probe was located on the top of a single cell and then moved downwards to compress the cell with a speed of 2 μm/s until the cell was ruptured. From the measurement, the data of force versus time or force versus displacement data were obtained. (b) Local probing of cell surface mechanics with AFM. A cantilever was elevated and approached to the sample. Forces acting between the tip and the sample/surface at a specific point were recorded in a single force-height curve. In the meantime, the cantilever was moved in the lateral direction, thus force curves from all the compressed points formed a scanning map.
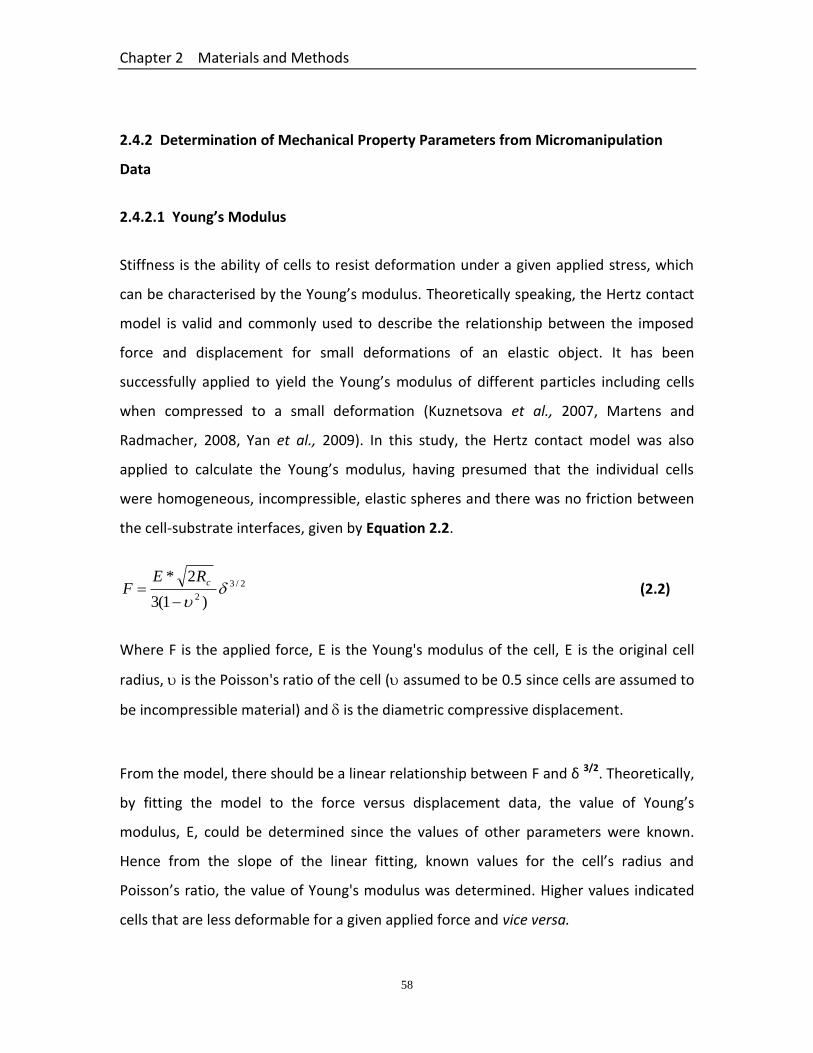
Chapter 2 Materials and Methods
58
2.4.2 Determination of Mechanical Property Parameters from Micromanipulation
Data
2.4.2.1 Young’s Modulus
Stiffness is the ability of cells to resist deformation under a given applied stress, which
can be characterised by the Young’s modulus. Theoretically speaking, the Hertz contact
model is valid and commonly used to describe the relationship between the imposed
force and displacement for small deformations of an elastic object. It has been
successfully applied to yield the Young’s modulus of different particles including cells
when compressed to a small deformation (Kuznetsova et al., 2007, Martens and
Radmacher, 2008, Yan et al., 2009). In this study, the Hertz contact model was also
applied to calculate the Young’s modulus, having presumed that the individual cells
were homogeneous, incompressible, elastic spheres and there was no friction between
the cell-substrate interfaces, given by Equation 2.2.
2/3
2 )1(3
2*
cREF (2.2)
Where F is the applied force, E is the Young's modulus of the cell, E is the original cell
radius, is the Poisson's ratio of the cell ( assumed to be 0.5 since cells are assumed to
be incompressible material) and is the diametric compressive displacement.
From the model, there should be a linear relationship between F and δ 3/2. Theoretically,
by fitting the model to the force versus displacement data, the value of Young’s
modulus, E, could be determined since the values of other parameters were known.
Hence from the slope of the linear fitting, known values for the cell’s radius and
Poisson’s ratio, the value of Young's modulus was determined. Higher values indicated
cells that are less deformable for a given applied force and vice versa.

Chapter 2 Materials and Methods
59
2.4.2.2 Nominal Rupture Stress and Nominal Rupture Tension
When compressed to a large deformation the cell can be ruptured and the
corresponding force used to determine the cells’ mechanical strength. Since the force
required to rupture a cell depends on the initial size of the cell, it is difficult to compare
the rupture force between different samples of cells if they have different sizes.
Therefore, two additional parameters were quantitated which take into account the
actual size of the tested cells. This allowed meaningful comparisons between different
cell groups. These parameters were nominal rupture stress (R) and nominal rupture
tension (TR). These values provide a comparable indication of the mechanical strength of
cell.
The combination of nominal rupture stress/tension and the percentage deformation at
rupture may be used to decide whether cells are strong/brittle, strong/flexible,
weak/brittle or weak/flexible. The real rupture stress and tension can be determined by
applying the appropriate mathematical models (Ferguson et al., 2015), but this is
beyond the scope of this study.
The nominal rupture stress (σR) was defined by the ratio of the rupture force (FR) to the
initial cross-sectional area, given by Equation 2.3.
2
4
d
FRR
(2.3)
where FR is the rupture force and d is the original cell diameter before compression.
The nominal rupture tension (TR) was defined by the ratio of the rupture force and the
original cell diameter, as shown in Equation 2.4.
d
FT R
R (2.4)
Chapter 2 Materials and Methods
60
2.4.3 Compression/Holding Experiments
Cells may also show visco-elastic behaviour In order to ascertain this,
compression/holding experiments were carried out to determine if there was obvious
force relaxation. Approximate 20 cells were selected and single cells were compressed
to different deformations before rupture, and then held for several seconds. The data of
force versus time were obtained for further analysation.
2.4.4 Statistical Analysis of Data from Micromanipulation Compression
The various values of the cell mechanical property parameters are presented as mean ±
standard error. A paired Student’s t-test was performed to determine whether
significant differences exist in the mechanical properties between different samples,
with statistical significance reported at 95% (p < 0.05) and 99% (p < 0.01) confidence
levels.
2.5 AFM Measurement Procedures
2.5.1 AFM Instrument
When a cell was compressed using micromanipulation to small fractional deformations,
e.g. < 10% (ratio of the cell displacement), it was found that the force imposed on the
cell was small, and comparable to the noise level of the force measurement. Therefore,
a JPK NanoWizardR AFM system was used to carry out the mechanical experiments,
particularly on small deformations (nano-indentation) which deformed only a portion of
the cell surface (Figure 2.2). The instrument was placed on an anti-vibration platform in
order to reduce the noise level due to possible vibration of surrounding environment.
The AFM system interrogates the surface of the cell by means of a sharp probe or tip
situated at the end of a flexible cantilever. This AFM head with a cantilever is the most

Chapter 2 Materials and Methods
61
important part of the system and was installed on an inverted optical microscope. The
cell sample could be observed in reflected light through the CCD camera and the long-
distance top-viewed optics. The cantilever could be driven by the motor both
horizontally and vertically to scan across the sample surface. To form an image, the tip
was brought close to the cell and raster-scanned over its surface, causing the cantilever
to be deflected as a result of probe-cell force interactions. A line-by-line image of the
cell surface was formed as a result of this deflection. JPK software was used to give
instantaneous commands and collect force and image data. In this study, the force-
mapping mode was adopted to measure the forces imposed on cell surface at a number
of points (or pixels), taking into account of the cell geometry to get a sufficient number
of force curves for statistical analysis.
2.5.2 Procedure of Force Scanning on Cell Sample with AFM
The groups of PBS control, SDF-1α and H2O2 pre-treated HPC-7s were mechanically
measured with the AFM system (Figure 2.1 b). Single cells were required to be
immobilized to reduce the lateral movement during the force scan. However, HPC-7s
were not able to adhere to the surface and their gravity was not sufficient to keep them
still. To address this issue, the adhesive substrate was prepared by coating a polystyrene
surface with Cell-Tak solution (Corning, USA) prior experiments, and spherical cells were
allowed to immobilize for 20 min. The immobilized cells were placed on the XY stage
and visualized by the optical microscopy. An oxide sharpened silicon nitride (Si3N4)
cantilever with a specialized spherical tip of 4 µm in diameter and a spring constant of
0.2 N/m was elevated and approached to the sample, forces acting between the tip and
the sample/surface at a specific point were recorded in a single force-height curve. In
the meantime, the cantilever was moved in lateral direction, and thus force curves from
all the compressed points formed a scanning map. The scan area was 100 X 100 µm with
pixels of 64 x 64 and vertical speed was 15 µm/s, thus in one measurement,
approximately 20 cells could be scanned and over four thousand force curves which
represented the compression of substrate surface and cells were acquired.
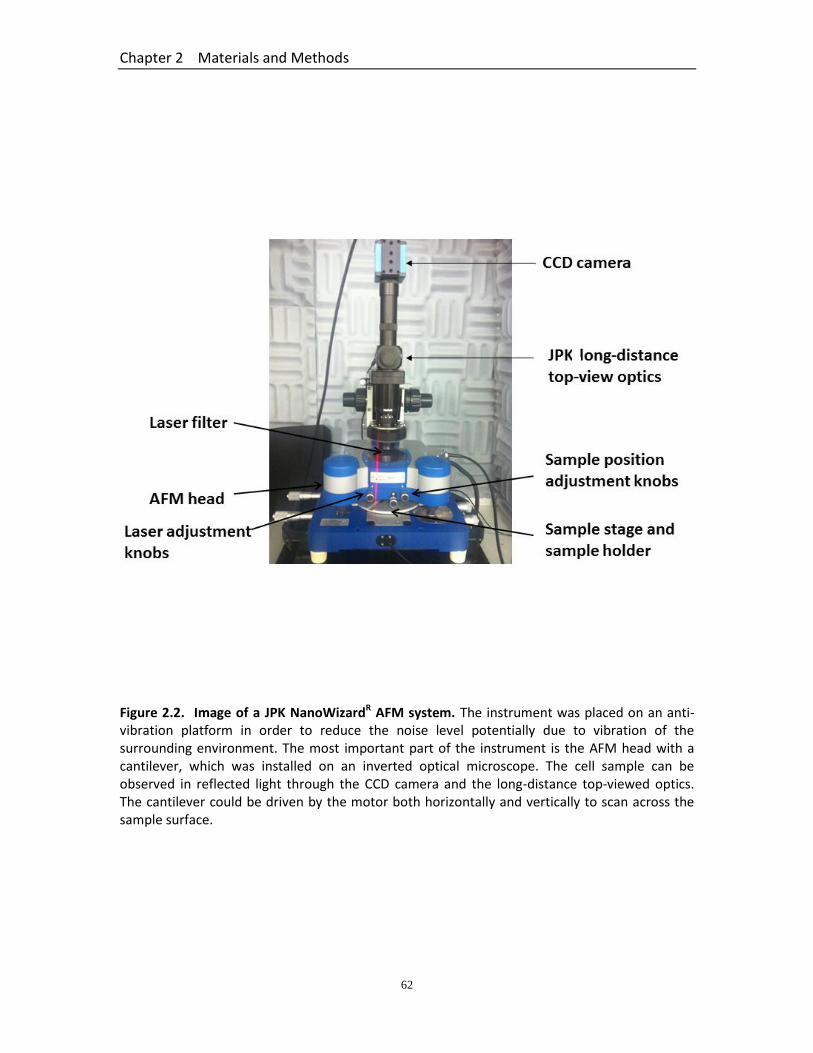
Chapter 2 Materials and Methods
62
Figure 2.2. Image of a JPK NanoWizardR AFM system. The instrument was placed on an anti-vibration platform in order to reduce the noise level potentially due to vibration of the surrounding environment. The most important part of the instrument is the AFM head with a cantilever, which was installed on an inverted optical microscope. The cell sample can be observed in reflected light through the CCD camera and the long-distance top-viewed optics. The cantilever could be driven by the motor both horizontally and vertically to scan across the sample surface.
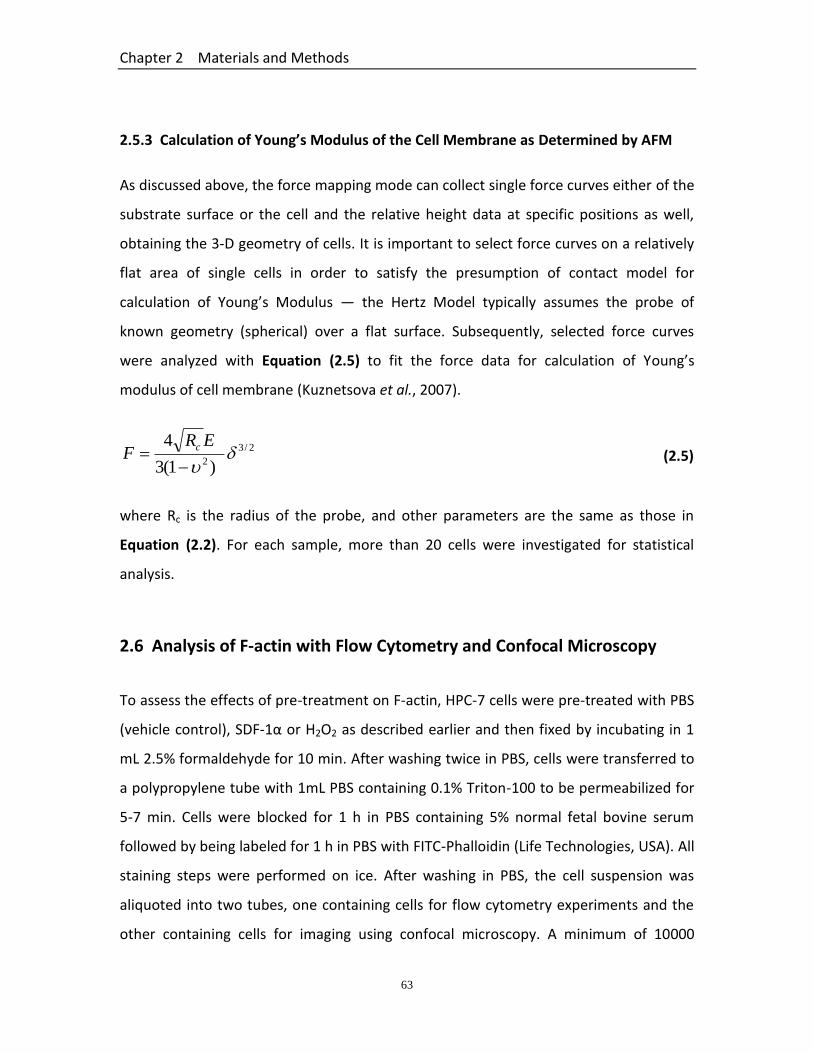
Chapter 2 Materials and Methods
63
2.5.3 Calculation of Young’s Modulus of the Cell Membrane as Determined by AFM
As discussed above, the force mapping mode can collect single force curves either of the
substrate surface or the cell and the relative height data at specific positions as well,
obtaining the 3-D geometry of cells. It is important to select force curves on a relatively
flat area of single cells in order to satisfy the presumption of contact model for
calculation of Young’s Modulus ― the Hertz Model typically assumes the probe of
known geometry (spherical) over a flat surface. Subsequently, selected force curves
were analyzed with Equation (2.5) to fit the force data for calculation of Young’s
modulus of cell membrane (Kuznetsova et al., 2007).
2/3
2 )1(3
4
ERF
c (2.5)
where Rc is the radius of the probe, and other parameters are the same as those in
Equation (2.2). For each sample, more than 20 cells were investigated for statistical
analysis.
2.6 Analysis of F-actin with Flow Cytometry and Confocal Microscopy
To assess the effects of pre-treatment on F-actin, HPC-7 cells were pre-treated with PBS
(vehicle control), SDF-1α or H2O2 as described earlier and then fixed by incubating in 1
mL 2.5% formaldehyde for 10 min. After washing twice in PBS, cells were transferred to
a polypropylene tube with 1mL PBS containing 0.1% Triton-100 to be permeabilized for
5-7 min. Cells were blocked for 1 h in PBS containing 5% normal fetal bovine serum
followed by being labeled for 1 h in PBS with FITC-Phalloidin (Life Technologies, USA). All
staining steps were performed on ice. After washing in PBS, the cell suspension was
aliquoted into two tubes, one containing cells for flow cytometry experiments and the
other containing cells for imaging using confocal microscopy. A minimum of 10000

Chapter 2 Materials and Methods
64
fluorescent cells from each sample were analyzed on a BD FACS Calibur cytometer
(Becton Dickinson, USA), and background green fluorescence (FL) was evaluated on cells
pre-treated with PBS. Data were analyzed with CellQuest (Becton Dickinson, USA). FL
intensity was automatically calculated and presented in a probability distribution. Cell
samples in another tube were examined on a Leica SP2 laser-scanning confocal
microscope using a 100× objective and pinhole settings providing optical sections of
around 0.5 μm. HPC-7 cells without apparent damage or aggregation were randomly
selected. An automated macro then acquired two perpendicular Z-scans (XZ and YZ
profiles) crossing the geometric centre of the XY region of interest.
2.7 Microfluidic System Preparations and Cell Sorting Procedures
2.7.1 Design Principles of Microfluidic Devices
Different types of microchannels with various geometries have been designed to
separate particles/cells into specific equilibrium positions within the microchannel
cross-section. Within straight, rectangular microchannels, inertial lift forces (FL)
dominate in focussing particles/cells into these positions and consist of two opposing
forces: the wall-induced lift force (FLW) directing particles/cells to the channel centre and
the velocity or shear gradient-induced force (FLS) directing particles/cells to the channel
walls. The balance of these two forces determines the equilibrium position(s) within the
microchannels. Changing the aspect ratio (channel width /height) and/or the Reynold’s
number (Re) are two different ways to control the equilibrium positions of
particles/cells of different sizes and deformabilities. Re can be simply altered by
changing the flow velocity of the fluid within the microchannel. Therefore, in the current
study, two straight microfluidic devices with different geometries, Device A and Device
B, were utilised under different flow velocities to allow identification of a device that
can effectively separate cells based on size and deformability.
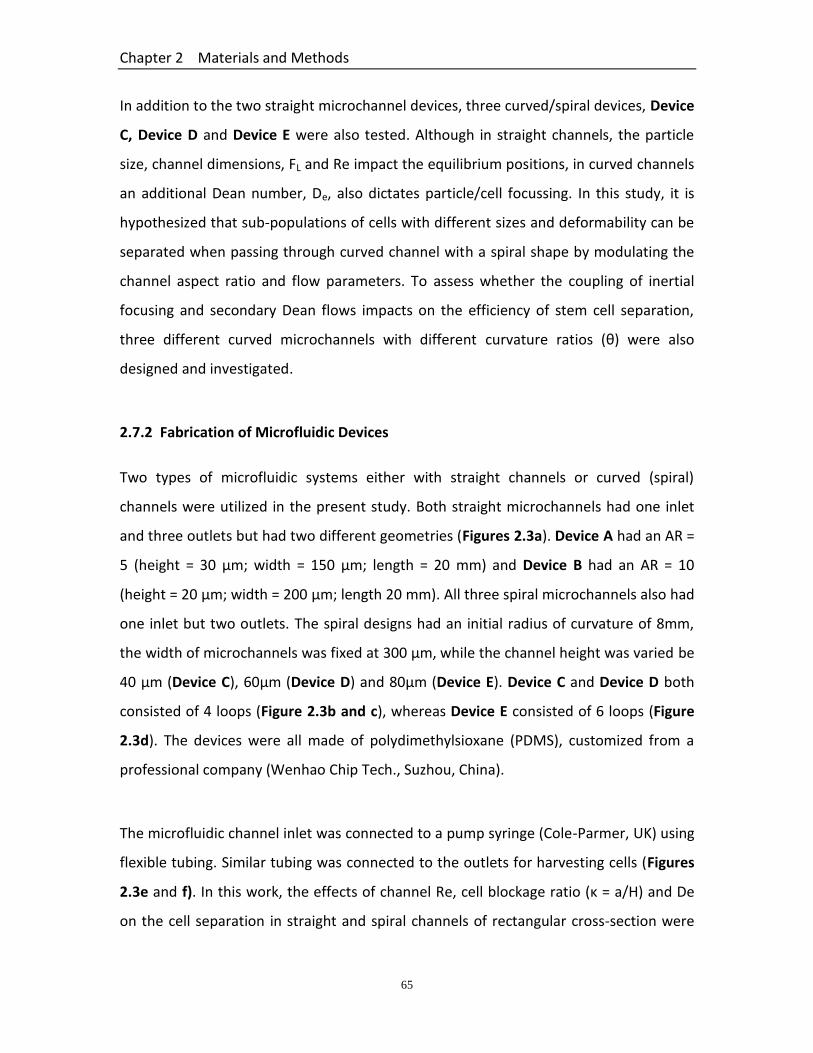
Chapter 2 Materials and Methods
65
In addition to the two straight microchannel devices, three curved/spiral devices, Device
C, Device D and Device E were also tested. Although in straight channels, the particle
size, channel dimensions, FL and Re impact the equilibrium positions, in curved channels
an additional Dean number, De, also dictates particle/cell focussing. In this study, it is
hypothesized that sub-populations of cells with different sizes and deformability can be
separated when passing through curved channel with a spiral shape by modulating the
channel aspect ratio and flow parameters. To assess whether the coupling of inertial
focusing and secondary Dean flows impacts on the efficiency of stem cell separation,
three different curved microchannels with different curvature ratios (θ) were also
designed and investigated.
2.7.2 Fabrication of Microfluidic Devices
Two types of microfluidic systems either with straight channels or curved (spiral)
channels were utilized in the present study. Both straight microchannels had one inlet
and three outlets but had two different geometries (Figures 2.3a). Device A had an AR =
5 (height = 30 μm; width = 150 μm; length = 20 mm) and Device B had an AR = 10
(height = 20 μm; width = 200 μm; length 20 mm). All three spiral microchannels also had
one inlet but two outlets. The spiral designs had an initial radius of curvature of 8mm,
the width of microchannels was fixed at 300 µm, while the channel height was varied be
40 μm (Device C), 60μm (Device D) and 80μm (Device E). Device C and Device D both
consisted of 4 loops (Figure 2.3b and c), whereas Device E consisted of 6 loops (Figure
2.3d). The devices were all made of polydimethylsioxane (PDMS), customized from a
professional company (Wenhao Chip Tech., Suzhou, China).
The microfluidic channel inlet was connected to a pump syringe (Cole-Parmer, UK) using
flexible tubing. Similar tubing was connected to the outlets for harvesting cells (Figures
2.3e and f). In this work, the effects of channel Re, cell blockage ratio (κ = a/H) and De
on the cell separation in straight and spiral channels of rectangular cross-section were
Chapter 2 Materials and Methods
66
studied. The distributions of cells in different outlets in terms of number and mechanical
strength after separation were assayed to compare the cell separation efficiency using
varying operational conditions and microchannels.
2.7.3 Preparations of Microfluidic Systems
The PDMS chip was added to the stage of an EVOS cell imaging system equipped with a
microscope and a camera (Thermo Fisher Scientific, USA; Figure 2.3g). The channel was
washed with 70% ethanol using the syringe pump for around 10 min at a flow rate of 10
ml/h, and then the channel was washed once with PBS buffer for 10 min at the same
flow rate. Only after washing was the chip considered ready to use. HPC-7 suspensions
were centrifuged and re-suspended in PBS at a certain concentration. A 5 mL vertically
oriented syringe was used to pump the cells through the device using the syringe pump.
Instantaneous images near the downstream region of the microchannel were captured
from the screen and videos recorded for real time control of the sorting system. Sub-
populations of HPC-7s were harvested from the outlets for further mechanical
assessment or for use in intravital in vivo trafficking studies.
Chapter 2 Materials and Methods
67
Figure 2.3. Microfluidic systems used for separating small/deformable HSCs from a heterogenous population. (a) Schematic diagram of Device A and Device B that varied only in their aspect ratio with Device B having less height and being wider. Schematic diagrams of (b) Device C (c) Device D and (d) Device E that varied in their height ( 40μm, 60μm or 80μm) and the number of loops (4 or 6). Typical photographs of PDMS fabricated chips with (e) straight and (f) spiral microchannels with connected tubing. The inlet tubing was connected to a syringe pump which infused the cells at varying velocities. (g) The PDMS chip was mounted onto an EVOS cell imaging system equipped with a microscope and camera. A vertically oriented 5ml syringe attached to the pump was connected to the inlet of the chip through flexible tubing.

Chapter 2 Materials and Methods
68
2.7.4 Cell Sorting Procedures
In order to obtain reproducible data, it was essential to make sure that the mechanical
strength of cell populations used in each experiment was consistent. However, preliminary
experiments showed that the cell mechanical properties varied with complex factors like
medium, culture time, and other external environmental factors. Moreover, building blocks
of cytoskeleton played important roles in cell proliferation, thus, cells in different
proliferative stages could also lead to different cell mechanical properties. Therefore, before
pumping cells through the microchannel, the mechanical properties had to be tested in
advance to make sure the consistency of experiments performed at different times. For all
experiments, 4 mL HPC-7 suspension with density of 2 × 10⁶/mL was initially injected into
the microchannel at various flow rates (2.5 mL/h, 5 mL/h, 7.5 mL/h and 10 mL/h), and
subpopulations harvested from the two outlets were counted and processed for further
studies. During the cell sorting experiments, any bubbles and clogging in the channel were
avoided.
2.7.5 Mechanical Analysis of Harvested Cells
HPC-7’s harvested from the side and central outlets of the straight microchannels and from
the inner and outer outlets of the curved/spiral microchannels were mechanically tested
with the micromanipulation technique. The mean values of nominal rupture stress were
used to demonstrate the mechanical strength of isolated cells and compare the separation
efficiency, as described above.
2.7.6 Cell Viability Assay
The viability of HPC-7s before and after undergoing separation was assessed via trypan blue
exclusion assay, and the number of cells that excluded the dye was counted for comparison.
Additionally, since the mechanical properties of cells can change in accordance with their

Chapter 2 Materials and Methods
69
physiological state or in response to stimuli within the environment (Rodriguez et al., 2013),
the obtained cell mechanical properties after separation experiments can also be regarded
as an indicator of cell viability.
2.8 Animal Experimental Procedures
2.8.1 HPC-7 Culture, Separation and Labelling
HPC-7 cells were maintained in a Stem-pro medium as described previously. The
experiments conducted using the 5 microfluidic devices demonstrated that Device C was
most effective and efficient at separating deformable HPC-7 cells at a flow rate of 10mL/h.
Therefore for intravital studies, Device C was used to conduct cell isolation. A 4mL HPC-7
cell suspension with a concentration of 2 × 10⁶/mL was pumped into the microchannel at a
flow rate of 10 mL/h. A more deformable sub-population of cells harvested from the inner
outlet were processed for a second flow through the microchannel. Cells that were further
separated from the inner outlet were used for the intravital study. HPC-7s harvested from
the outer outlet in the first flow were used for comparison purposed intravitally. Isolated
cells were washed with PBS, and then re-suspended in 4 mL PBS containing 5 μM
carboxyfluorescein diacetate succinimidyl ester (CFDA-SE), followed by incubation at 37 C
for 10 min. CFDA-SE is a cell permeable dye that enters cells by diffusion. It is cleaved by
intracellular esterases to produce CFSE which fluoresces a green colour after excitation at
488 nm. Fluorescently labelled cells were centrifuged and re-suspended in 200 μL warm
StemPro media (37 ℃) prior to systemic injection in mice for intravital imaging.
2.8.2 Animals
Male C57BL/6 mice (8 - 12 week old; Harlan, UK) were utilised for experiments in
accordance with the Animals Act of 1986 (Scientific Procedures; PPL:7008204 held by Dr
Kalia). Local Birmingham Ethical Reviews Sub-Committee (BERSC) approval was also sought
Chapter 2 Materials and Methods
70
before Home Office approval. All studies were performed under terminal anesthesia with
animals being sacrificed by cervical dislocation, as approved by Home Office. Anaesthetised
animals (100 mg/kg ketamine hydrochloride; 10 mg/kg xylazine hydrochloride; I.P.) can keep
breathing by tracheostomy and carotid artery cannulation to allow administration of
labelled cells and any additional maintenance anesthetic.
2.8.3 Intestinal IR Injury Model
Intravital microscopy was involved to observe HPC-7 trafficking with the injured intestinal
microvasculature as previously described (Kavanagh et al., 2015). The injury induced was
ischaemia-reperfusion (IR) injury, which was prepared through occlusion of the small
mesenteric artery using a non-traumatic artery clamp for 45 minutes. Reperfusion was
generated after the clamp was removed. The small intestine was gently pulled away from
the animal using a surgical swab onto a sterile petri dish, avoiding puncture of the organ and
vasculature. The mucosal surface was visualised after cautery incision alongside the anti-
mesenteric border.
2.8.4 Intravital Microscopy and Tracking of HPC-7s in vivo
Exposed mucosal villi were visualised under the inverted intravital microscope (motorised
Olympus IX-81, Olympus, UK). For observation, a single x10 field of view was randomly
selected prior to cell infusion. A single dose of 2 x 10⁶ HPC-7s pre-labelled with CFDA-SE, was
intra-arterially infused at 30 minutes post-reperfusion and cell attachment/movement in
the mucosal villi were accounted. Cells were introduced at this time point to allow IR injury
to be prepared in the gut. Digital videos were recorded from the selected field of view for
one minute, at a frequency of every 5 minutes, for an hour post-reperfusion. The number of
free flowing and adherent cells at each time point was counted. Free flowing HPC-7s were
counted as cells that freely moved through the field of view without stay for more than 30
seconds. Adherent HPC-7s were defined as those that remained stationary for more than 30
seconds. At the end of the experiment, the small intestine was excised and 5 additional

Chapter 2 Materials and Methods
71
fields of view were monitored to make sure the events in the pre-selected area were
representative. The lungs were also removed from the mouse and five fields were randomly
selected and entrapped cells were counted. Data was stored digitally and analysed off-line
(Slidebook, Intelligent Imaging Innovations, USA).
Chapter 3 Mechanical Characterisation of Cells Using Micromanipulation and AFM
72
Chapter 3
Mechanical Characterisation of Neutrophils, HSCs and MSCs Using
Micromanipulation and AFM
Chapter 3 Mechanical Characterisation of Cells Using Micromanipulation and AFM
73
3.1 Introduction
HSCs and MSCs have increasingly acted as the leading cells for consideration to treat a
whole host of inflammatory and degenerative diseases. Clinically, the preferred route of
infusion of stem cells for cellular therapy is directly infusion into the bloodstream. This
provides both a non-invasive administration method and permits repeated injections of cells
(Houlihan and Newsome, 2008). Therefore, the capture of exogenously infused circulating
stem cells by injured tissue microvessels is a prerequisite event for successful therapy,
regardless of the reparative mechanisms used by these cells. However, this event seems to
be limited partially due to poor delivery of circulating stem cells to sites of injury, which may
contribute to explaining the poor current success of cellular therapy clinically.
This is a particular problem for MSCs, which are known to be a larger cell type compared to
HSCs. Indeed, the Kalia group have provided results that very few administered MSCs
actually homed to and became retained within the injured site, unlike HSC recruitment
which was four- to five fold higher within a similarly injured tissue (Kavanagh et al., 2015).
This lack of delivery to the intended site might be due to large MSCs becoming trapped in
upstream microvessels. It is hypothesized that possibly more deformable stem cells may be
able to migrate to the injured organ by avoiding entrapment elsewhere. Indeed, mechanical
deformation is a key player in permitting neutrophils, with diameters of 6-8 m, to traverse
smaller pulmonary capillaries, with diameters of 2 – 15 m (Doerschuk et al., 1993, Tse et al.,
2005). In their transit through the pulmonary and systemic microcirculations, neutrophils
tend to undergo a mechanical deformation when being subjected to mechanical stimulation
in narrow capillaries (Yap and Kamm, 2005). Neutrophils in capillaries tend to present with
an elongated shape whereas those in arterioles are generally more spherical. Indeed, some
neutrophils are even found to concentrate in the pulmonary capillaries compared to the
arterioles (Mizgerd, 2002). This ability to mostly avoid entrapment explains why neutrophils
are typically the first leukocytes to be recruited to an inflammatory site where they can
Chapter 3 Mechanical Characterisation of Cells Using Micromanipulation and AFM
74
eliminate pathogens by multiple mechanisms, and they are obviously recruited more rapidly
than HSCs and MSCs (Summers et al., 2010, Kolaczkowska and Kubes, 2013).
Some evidence already exists to suggest better deformability may hold a key to improving
stem cell delivery to sites of tissue injury. Pre-treating murine HSCs with inflammatory
cytokines has previously been shown by the Kalia group to significantly enhance their
adhesion to a number of different injured tissues both in vitro and in vivo when compared
to pre-treatment with PBS controls (White et al., 2013, Kavanagh et al., 2013). Basic
micropipette aspiration methodology suggested this may be partially due to improvements
in cell deformability. This was postulated to have resulted in reduced non-specific
entrapment in small capillaries and maintenance of a pool of stem cells circulating within
the peripheral blood, available for capture by microvessels within injured sites. However,
the micropipette aspiration methodology is somewhat limited in spatial resolution to the
micron scale. Its accuracy to measure deformability changes is dependent on the optical
imaging resolutions.
Currently, very little is known about the basic mechanical properties of HSCs and MSCs,
particularly with regards their deformability characteristics. Comparisons with other
circulating blood cells such as the neutrophil have also not been made. Therefore, to
investigate the mechanical properties of these stem cells more precisely, including their
mechanical behaviour at both large and small deformations, micromanipulation and AFM
techniques were used to measure the forces applied to the cytoskeleton structure, as well
as the plasma membrane respectively. This study aimed to directly derive or calculate
various mechanical property parameters of both HSCs and MSCs, from large and small
deformations and compare these values to those obtained for the blood neutrophil. For
HSCs, the effects of pre-treatment with soluble inflammatory factors on their mechanical
behaviour were also determined. The mechanical property parameters calculated included
cell diameter, the rupture deformation, the force required to rupture the cell, nominal
Chapter 3 Mechanical Characterisation of Cells Using Micromanipulation and AFM
75
rupture stress, nominal rupture tension and also the Young’s or elastic modulus. The
polymerization of F-actin after pre-treatment of HSCs with inflammatory factors was also
assessed using flow cytometry and imaged using fluorescent confocal microscopy. The
mechanics of the whole-cell cytoskeleton, the localized membrane mechanical stiffness of
cells and the potential underlying mechanisms are discussed.
3.1.1 Hypothesis
It was hypothesized that the poor recruitment of both HSCs and MSCs, when compared to
the rapid response of inflammatory neutrophils, was due to their larger size. Furthermore,
since MSCs demonstrate significantly more non-specific entrapment, it was hypothesized
that in addition to size being a major factor, these cells also were the more ‘stiff’ cell type
which hindered their easy transit through small capillaries. Since studies on pre-treatment
with inflammatory factors had previously alluded to improvements in stem cell
deformability, it was also hypothesized that both micromanipulation and AFM
methodologies would better detect and confirm improvements in this mechanical property
following exposure to a host of different soluble inflammatory factors.
3.2 Methods
3.2.1 Cell Samples
Mechanical testing was conducted on HPC-7s (murine HSC immortalised line), murine bone
marrow-derived MSCs and murine neutrophils. Details on how these cells were isolated,
cultured and maintained can be found in Section 2.2. For some studies, HPC-7s were pre-
treated with SDF-1α (10 ng/mL for 1 hour), Keratinocyte chemoattractant (KC, 10 ng/mL for
1 hour) and H2O2 (100 μM for 1 hour), which were prepared in suspension and in spherical
phenotype. Control cells were pre-treated with PBS.

Chapter 3 Mechanical Characterisation of Cells Using Micromanipulation and AFM
76
3.2.2 Compression of Single Cells with Micromanipulation
In brief, cells were allowed to settle down to the bottom of a transparent chamber, and a
bigger flat probe was driven downwards to compress a single cell at a speed of 2 m/s.
Forces applied on the cell were acquired instantaneously, and the force versus time curve
was obtained for further data analysis. In each experiment, 20 cells were randomly selected
for compression.
3.2.3 Probing of Cells with AFM
HPC-7 cells were immobilized with Cell-Tak adhesive prior to AFM experiments. A force-
mapping mode was used to probe the cells at specific positions, as well as the substrate
surface. Forces in nano-Newton level were recorded for data processing, thus localized
mechanics of cell surface was derived from this sensitive characterization.
3.2.4 Calculation of Mechanical Property Parameters
In the micromanipulation method, cells were compressed until they were ruptured.
Therefore, the rupture force, nominal rupture stress, nominal rupture tension and Young’s
modulus were calculated to illustrate the mechanical strength and stiffness of cells. The
Young’s modulus was determined using the Hertz model to fit the force versus displacement
data up to a deformation of 60%. In AFM probing, force data derived from a relatively flat
area of the cell surface (usually the topmost region) were selected to fit the Hertz model,
and again values of Young’s modulus were calculated, which this time represented the
stiffness of cell membrane.
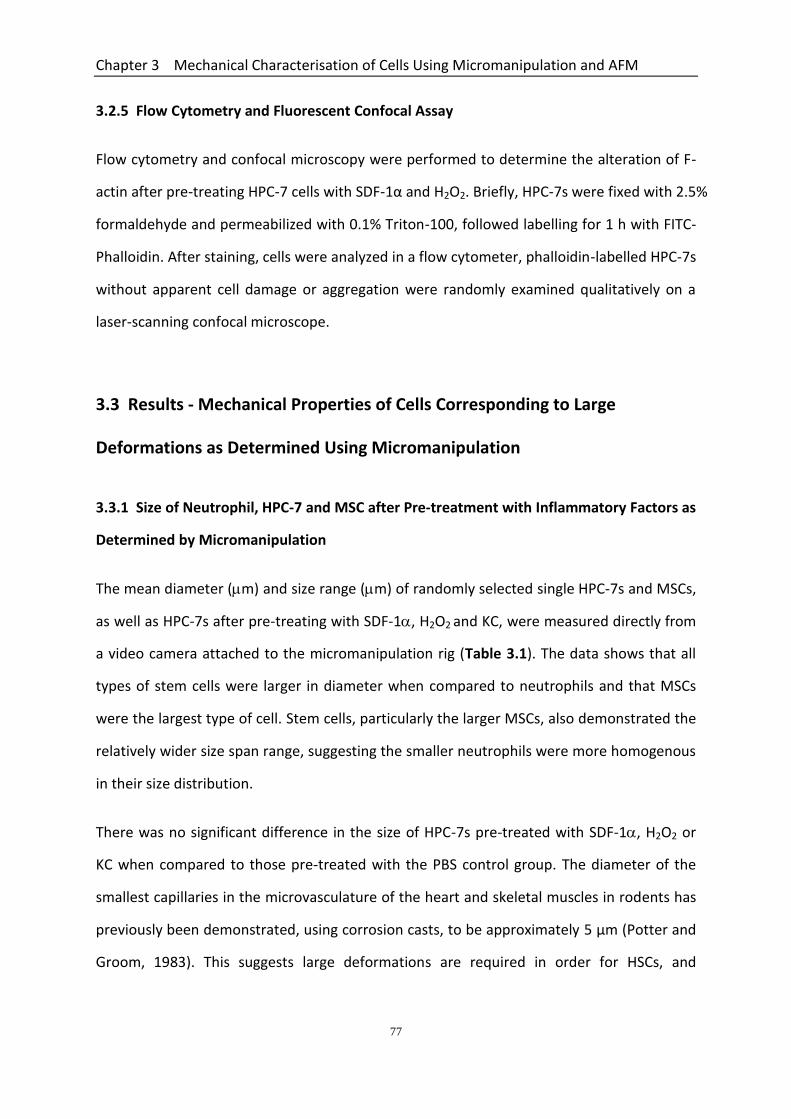
Chapter 3 Mechanical Characterisation of Cells Using Micromanipulation and AFM
77
3.2.5 Flow Cytometry and Fluorescent Confocal Assay
Flow cytometry and confocal microscopy were performed to determine the alteration of F-
actin after pre-treating HPC-7 cells with SDF-1α and H2O2. Briefly, HPC-7s were fixed with 2.5%
formaldehyde and permeabilized with 0.1% Triton-100, followed labelling for 1 h with FITC-
Phalloidin. After staining, cells were analyzed in a flow cytometer, phalloidin-labelled HPC-7s
without apparent cell damage or aggregation were randomly examined qualitatively on a
laser-scanning confocal microscope.
3.3 Results - Mechanical Properties of Cells Corresponding to Large
Deformations as Determined Using Micromanipulation
3.3.1 Size of Neutrophil, HPC-7 and MSC after Pre-treatment with Inflammatory Factors as
Determined by Micromanipulation
The mean diameter (m) and size range (m) of randomly selected single HPC-7s and MSCs,
as well as HPC-7s after pre-treating with SDF-1, H2O2 and KC, were measured directly from
a video camera attached to the micromanipulation rig (Table 3.1). The data shows that all
types of stem cells were larger in diameter when compared to neutrophils and that MSCs
were the largest type of cell. Stem cells, particularly the larger MSCs, also demonstrated the
relatively wider size span range, suggesting the smaller neutrophils were more homogenous
in their size distribution.
There was no significant difference in the size of HPC-7s pre-treated with SDF-1, H2O2 or
KC when compared to those pre-treated with the PBS control group. The diameter of the
smallest capillaries in the microvasculature of the heart and skeletal muscles in rodents has
previously been demonstrated, using corrosion casts, to be approximately 5 µm (Potter and
Groom, 1983). This suggests large deformations are required in order for HSCs, and
Chapter 3 Mechanical Characterisation of Cells Using Micromanipulation and AFM
78
especially MSCs, to circulate or squeeze through these limited spaces without becoming
entrapped.
3.3.2 Neutrophils and HPC-7s Share Similarities in the Force-displacement Curves
Generated during Micromanipulation Compression
Single neutrophils, HPC-7s or MSCs were compressed between two parallel surfaces at a
speed of 2 m/s. The force (N) imposed on the cell was plotted against the distance (m)
the probe moved towards the glass chamber on which the cells were placed (force vs
displacement). A typical relationship between the force and displacement each for
neutrophils and HPC-7s is shown in Figure 3.1a and Figure 3.1b respectively. Despite their
biological variation, common characteristics can be observed between neutrophils and HPC-
7s in their compression curves. At a lower applied load, the force-displacement curve shows
a relatively small slope (region A-B of the curve) i.e. force increases slowly with
displacement. At point A the probe started to touch the cell and so Point A-B therefore
informs the resistance of the cell cytoskeleton to the pressure being applied. At point B it is
likely that the cell nucleus was also being compressed. Hence at deformations of ϵ ~ 0.6,
the cytoskeleton played a critical role in the mechanical resistance offered (ϵ = cell height
change / initial cell diameter). At deformations in the region of ϵ ~ 0.6 - 0.8, the force
increased rapidly (region B - C of the curve) indicated by the gradient of the force versus
displacement curve becoming bigger. This is followed by a stress peak (point C of the curve)
in the force versus deformation curve at which point the cell burst. Thereafter, the force
decreases rapidly (to point D of the curve). The forces responding to this region are highly
nonlinear. Although the cell nuclei may have been involved in resisting the applied load, the
cell membrane burst at the peak and the subsequent leakage of cell fluid caused a force
drop. Beyond 80% deformation, the slope of the force curve increases more rapidly (region
DE of the curve). This region corresponds to the compression of the cell nuclei, cell debris
and the glass bottom/substrate on which cells were placed.
Chapter 3 Mechanical Characterisation of Cells Using Micromanipulation and AFM
79
Unlike neutrophils and HPC-7s, there is an absence of a peak force, indicative of cells
bursting, in the force curves of MSCs (Figure 3.1c). In these cells, the force increased
smoothly and slowly at low applied loads inducing deformations of ϵ ~ 0 - 0.8 of the cell
membrane and cytoskeleton. The slope increased at deformations larger than 80% because
of the addition of cell nuclei in force resistance until the probe touched the bottom
substrate where the slope of force curve increased more rapidly. The absence of stress peak
demonstrated that there was no obvious rupture point or force for MSCs.

Chapter 3 Mechanical Characterisation of Cells Using Micromanipulation and AFM
80
Table 3.1. Pre-treatment with inflammatory factors does not change neutrophil, HSC or MSC size
as determined by micromanipulation. The diameter of single cells was measured directly from the
images captured using a camera attached to the micromanipulation rig. Neutrophils were the
smallest in size compared to both stem cell types and MSCs were bigger than HSCs. Pre-treatment of
HPC-7s did not significantly affect their size. Stem cells showed greater variation or heterogeneity in
their size distribution than neutrophils. For each cell type, n = 200 cells were measured. Data are
presented as the means SEM.
Cell type Mean (µm) Size range (µm)
Neutrophils 6.6±0.2 5-7
HPC-7s 10±0.2 6-13
HPC-7s(SDF-1ɑ) 10±0.1 6-13
HPC-7s(H2O2) 10±0.3 6-13
HPC-7s(KC) 10±0.2 6-13
MSCs 16±0.5 12-20
Chapter 3 Mechanical Characterisation of Cells Using Micromanipulation and AFM
81
Figure 3.1. Similarities between Neutrophils and HPC-7s in the force-displacement curves
generated from micromanipulation compression. Typical force-displacement curves for (a)
neutrophils (b) and HPC-7s show that force increases slowly with displacement as shown in region
AB of the curve. At deformations in the region of about 0.6 ~ 0.8, the gradient of force versus
displacement becomes bigger as shown in region BC of the curve. This is followed by the cell
bursting at point C, with the force decreasing rapidly to point D, after which the force increases
rapidly corresponding to the compression of cell debris and glass substrate as shown in region DE.
For (c) MSCs, the force increases smoothly with displacement and no cells demonstrated a clear
rupture point. All cells were compressed at a speed of 2 μm/s. N = 20 single cells for each cell type.
Neutrophil
MSC
HPC-7
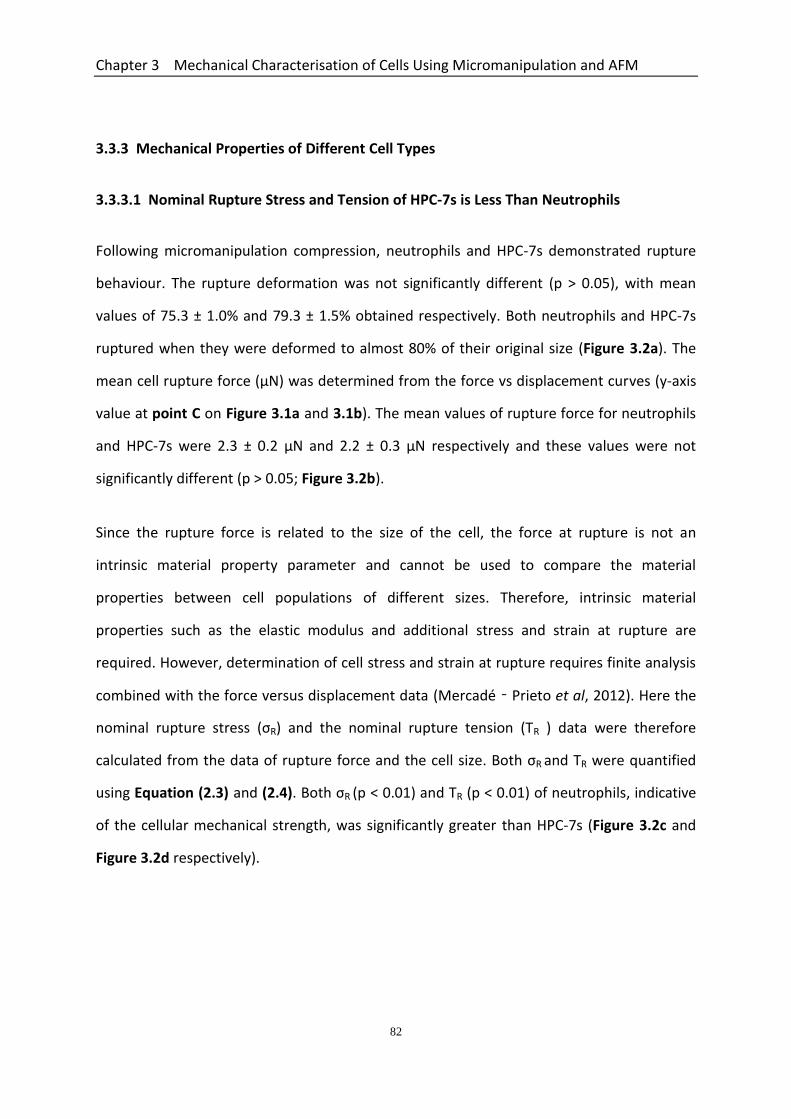
Chapter 3 Mechanical Characterisation of Cells Using Micromanipulation and AFM
82
3.3.3 Mechanical Properties of Different Cell Types
3.3.3.1 Nominal Rupture Stress and Tension of HPC-7s is Less Than Neutrophils
Following micromanipulation compression, neutrophils and HPC-7s demonstrated rupture
behaviour. The rupture deformation was not significantly different (p > 0.05), with mean
values of 75.3 ± 1.0% and 79.3 ± 1.5% obtained respectively. Both neutrophils and HPC-7s
ruptured when they were deformed to almost 80% of their original size (Figure 3.2a). The
mean cell rupture force (µN) was determined from the force vs displacement curves (y-axis
value at point C on Figure 3.1a and 3.1b). The mean values of rupture force for neutrophils
and HPC-7s were 2.3 ± 0.2 µN and 2.2 ± 0.3 µN respectively and these values were not
significantly different (p ˃ 0.05; Figure 3.2b).
Since the rupture force is related to the size of the cell, the force at rupture is not an
intrinsic material property parameter and cannot be used to compare the material
properties between cell populations of different sizes. Therefore, intrinsic material
properties such as the elastic modulus and additional stress and strain at rupture are
required. However, determination of cell stress and strain at rupture requires finite analysis
combined with the force versus displacement data (Mercadé‐Prieto et al, 2012). Here the
nominal rupture stress (σR) and the nominal rupture tension (TR ) data were therefore
calculated from the data of rupture force and the cell size. Both σR and TR were quantified
using Equation (2.3) and (2.4). Both σR (p < 0.01) and TR (p < 0.01) of neutrophils, indicative
of the cellular mechanical strength, was significantly greater than HPC-7s (Figure 3.2c and
Figure 3.2d respectively).
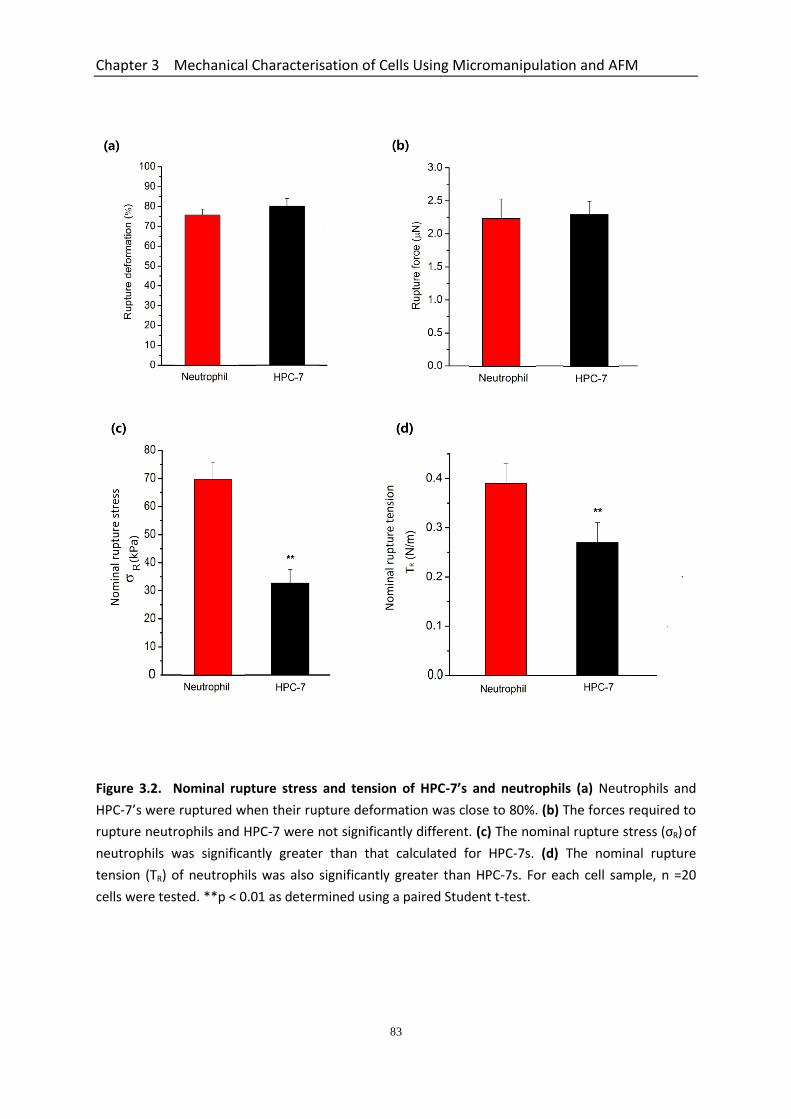
Chapter 3 Mechanical Characterisation of Cells Using Micromanipulation and AFM
83
Figure 3.2. Nominal rupture stress and tension of HPC-7’s and neutrophils (a) Neutrophils and
HPC-7’s were ruptured when their rupture deformation was close to 80%. (b) The forces required to
rupture neutrophils and HPC-7 were not significantly different. (c) The nominal rupture stress (σR) of
neutrophils was significantly greater than that calculated for HPC-7s. (d) The nominal rupture
tension (TR) of neutrophils was also significantly greater than HPC-7s. For each cell sample, n =20
cells were tested. **p < 0.01 as determined using a paired Student t-test.

Chapter 3 Mechanical Characterisation of Cells Using Micromanipulation and AFM
84
3.3.3.2 Young’s Modulus of HPC-7s & MSCs Determined Using the Data up to Large
Deformations
The Young’s modulus is a parameter calculated to represent the stiffness of the elastic
material or cell being studied. The force data obtained using micromanipulation of cells to
large deformations was fitted to Equation (2.2) for calculation of the Young’s modulus value.
The results demonstrate that the Hertz model was valid up to a nominal deformation of 60%.
Figure 3.3a illustrates the typical linear fitting based on the Hertz model to the experimental
data and the value of correlation coefficient obtained was 0.9. The calculated Young’s
modulus value for neutrophils, HPC-7s and MSCs were 24.0 ± 1.8 kPa, 18.1 ± 1.3 kPa and
15.6 ± 1.2 kPa respectively (Figure 3.3b). It was possible to calculate the Young’s modulus
value for MSCs as only deformation to 60% data was used and no rupture data was required
(MSCs did not demonstrate rupture). Since a higher Young’s modulus indicates less
deformable cells, the data obtained demonstrated neutrophils were significantly stiffer than
both HPC-7s (p < 0.01) and MSCs (p < 0.01). Interestingly, MSCs obtained similar stiffness to
HPC-7s despite the fact that their overall cell size (Table 3.1) was much bigger than HPC-7s
(Figure 3.3b).
3.3.3.3 Compression/holding Curves of Neutrophils, HPC-7s and MSCs at Different
Deformations
The Hertz model does not account for viscoelasticity. In principle, the Hertz equation applies
to relatively small deformations (< 10%) of a material with linear elasticity (Mercadé-Prieto
and Zhang, 2012). While in this study, the model still fits the data of large deformations up
to 60%, in order to understand whether the cells were viscoelastic, single cells were
compressed to different deformations (~ 30% and ~ 60%) at 2 µm/s and then held for a few
seconds. After the compression / holding to 30% deformation, the force was released from

Chapter 3 Mechanical Characterisation of Cells Using Micromanipulation and AFM
85
the cells and the same cell was again compressed to 60% deformation and held for several
seconds.
Figure 3.4 shows typical force-time curves of neutrophils, HPC-7s and MSCs from
compression/holding experiments. Clearly, the larger the deformation at the end of
compression, the bigger the force loaded on the cell. For all the tested cell types, there was
no significant force relaxation at deformations of 60% and less. This data demonstrates that
up to a deformation of 60%, the elastic behaviour was still dominant and the data of force
versus displacement could therefore be used to fit the Hertz equation for calculating the
Young’s elastic modulus.
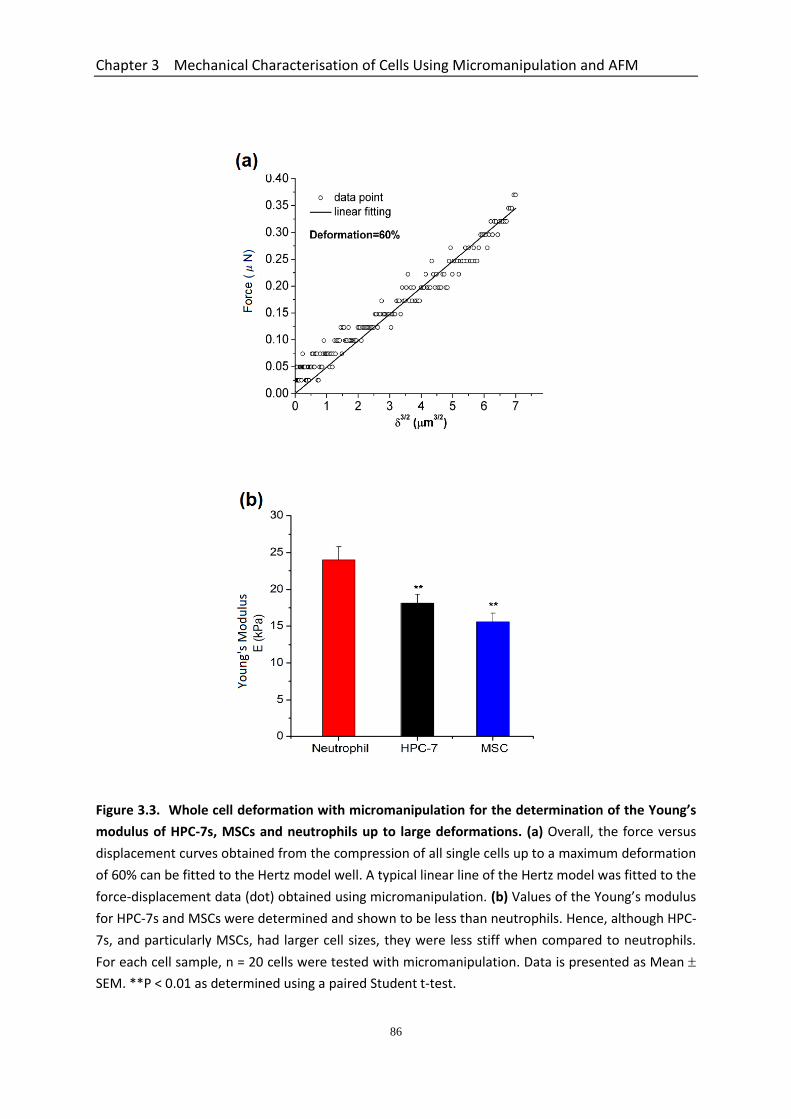
Chapter 3 Mechanical Characterisation of Cells Using Micromanipulation and AFM
86
Figure 3.3. Whole cell deformation with micromanipulation for the determination of the Young’s
modulus of HPC-7s, MSCs and neutrophils up to large deformations. (a) Overall, the force versus
displacement curves obtained from the compression of all single cells up to a maximum deformation
of 60% can be fitted to the Hertz model well. A typical linear line of the Hertz model was fitted to the
force-displacement data (dot) obtained using micromanipulation. (b) Values of the Young’s modulus
for HPC-7s and MSCs were determined and shown to be less than neutrophils. Hence, although HPC-
7s, and particularly MSCs, had larger cell sizes, they were less stiff when compared to neutrophils.
For each cell sample, n = 20 cells were tested with micromanipulation. Data is presented as Mean
SEM. **P < 0.01 as determined using a paired Student t-test.
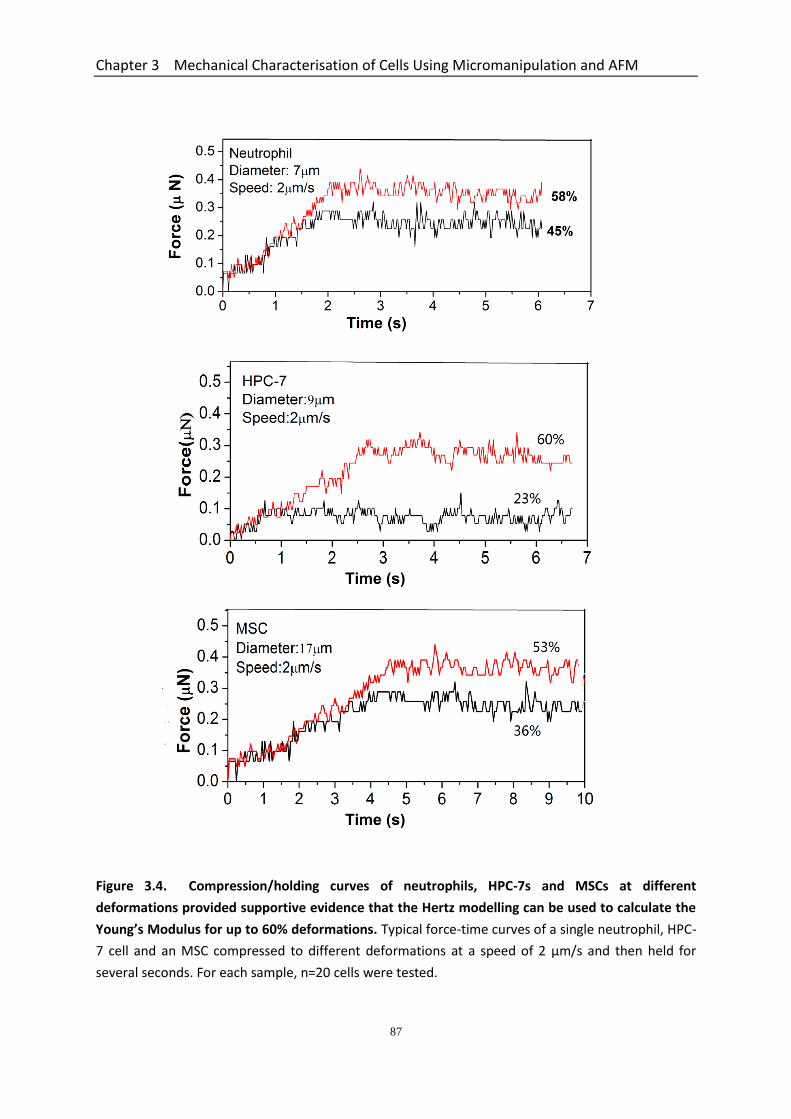
Chapter 3 Mechanical Characterisation of Cells Using Micromanipulation and AFM
87
Figure 3.4. Compression/holding curves of neutrophils, HPC-7s and MSCs at different
deformations provided supportive evidence that the Hertz modelling can be used to calculate the
Young’s Modulus for up to 60% deformations. Typical force-time curves of a single neutrophil, HPC-
7 cell and an MSC compressed to different deformations at a speed of 2 μm/s and then held for
several seconds. For each sample, n=20 cells were tested.

Chapter 3 Mechanical Characterisation of Cells Using Micromanipulation and AFM
88
3.3.4 Mechanical Properties of HPC-7 Cells after SDF-1, H2O2 or KC Pre-treatment
3.3.4.1 Rupture Force and Nominal Rupture Stress/tension Decreases with SDF-1α and
H2O2 pre-treatment
To determine whether pre-treatment of HPC-7s with inflammatory factors affects their
mechanical properties, they were pre-treated with PBS (control), SDF-1, H2O2 or KC prior
to mechanical testing with the micromanipulation technique. Values for the deformation at
rupture and the force required for rupture were derived from their respective force-
displacement curves. Pre-treatment did not affect the % deformation at rupture and
demonstrated similar deformations for all cells of ~ 80% (Figure 5.5a). However, the force
required to induce rupture significantly decreased from 2.2 ± 0.3 µN after pre-treatment
with the PBS control to 1.3 ± 0.1 μN and 1.6 ± 0.2 μN after pretreating with SDF-1 (p < 0.01)
and H2O2 (p < 0.01) respectively. In contrast, the force required to rupture KC pre-treated
cells did not change significantly compared to the PBS control group (Figure 3.5b). Both SDF-
1 (p < 0.01) and H2O2 (p < 0.01) also significantly reduced the nominal rupture stress (σR).
Again, KC did not affect this value (Figure 3.5c). A similar pattern was observed for nominal
rupture tension (TR) (Figure 3.5d). This data suggested HPC-7 cells became weaker after pre-
treating with SDF-1α or H2O2 making it easier to deform and rupture them, while the KC
group showed similar mechanical strength to PBS control cells.
3.3.4.2 Young’s Modulus of HSCs Determined from Data up to Large Deformations
Decreases with SDF-1 and H2O2 Pre-treatment
The micromanipulation data up to large deformations was again used for calculation of the
Young’s modulus of HPC-7s before and after pre-treating with SDF-1α, H2O2 and KC. The
results demonstrated that the Hertz model was valid up to a nominal deformation of 60%.
The values of Young’s modulus for PBS, SDF-1α, H2O2 and KC pre-treated HPC-7s were 18.1 ±

Chapter 3 Mechanical Characterisation of Cells Using Micromanipulation and AFM
89
1.2 kPa, 13.8 ± 0.8 kPa, 14.5 ± 0.8 kPa and 17.8 ± 1.4 kPa respectively (Figure 3.5d). Since a
lower Young’s modulus indicates more deformable cells, the data obtained demonstrated
that pre-treatment with SDF-1 α (p < 0.01) and H2O2 (p < 0.01) generated HPC-7 cells which
were significantly more deformable than PBS pre-treated cells. KC pre-treatment did not
generate any significant effect on the Young’s modulus of HPC-7 cells.
3.3.4.3 Compression/holding Curves of Pre-treated HPC-7’s at Different Deformations
Typical force-time curves of HPC-7s for PBS control, SDF-1α, H2O2 and KC groups were
generated from compression / holding experiments (Figure 3.6). There was no significant
force relaxation at a final nominal deformation of 60% and less for all the three cell samples
(n = 10 per sample). Likewise, it can be concluded that at a compression speed of 2 μm/s,
there was not significant visco effect for HPC-7s up to a deformation of 60%, and the Hertz
model is valid to quantify the stiffness of the whole cell.

Chapter 3 Mechanical Characterisation of Cells Using Micromanipulation and AFM
90
Figure 3.5. Rupture force, nominal rupture stress/tension and Young’s modulus values
significantly decrease with SDF-1α and H2O2 pre-treatment as determined using
micromanipulation. (a) The mean rupture deformation for all of the pre-treatments was 80%. (b)
Forces required to rupture SDF-1α and H2O2 pre-treated HPC-7s were significantly smaller than that
required to rupture PBS control cells. KC pre-treatment did not significantly affect the rupture force
when compared to PBS control cells. (c) Nominal rupture stress (σR) of HPC-7s after pre-treating with
SDF-1α and H2O2 significantly decreased, with no changes observed with KC pre-treatment. A similar
pattern of events was observed for (d) nominal rupture tension (TR) and (e) values of the Young’s
modulus. For each cell sample, n=20 cells were tested. Data is presented as mean SEM. ** P < 0.01
as determined using a paired Student t-test.
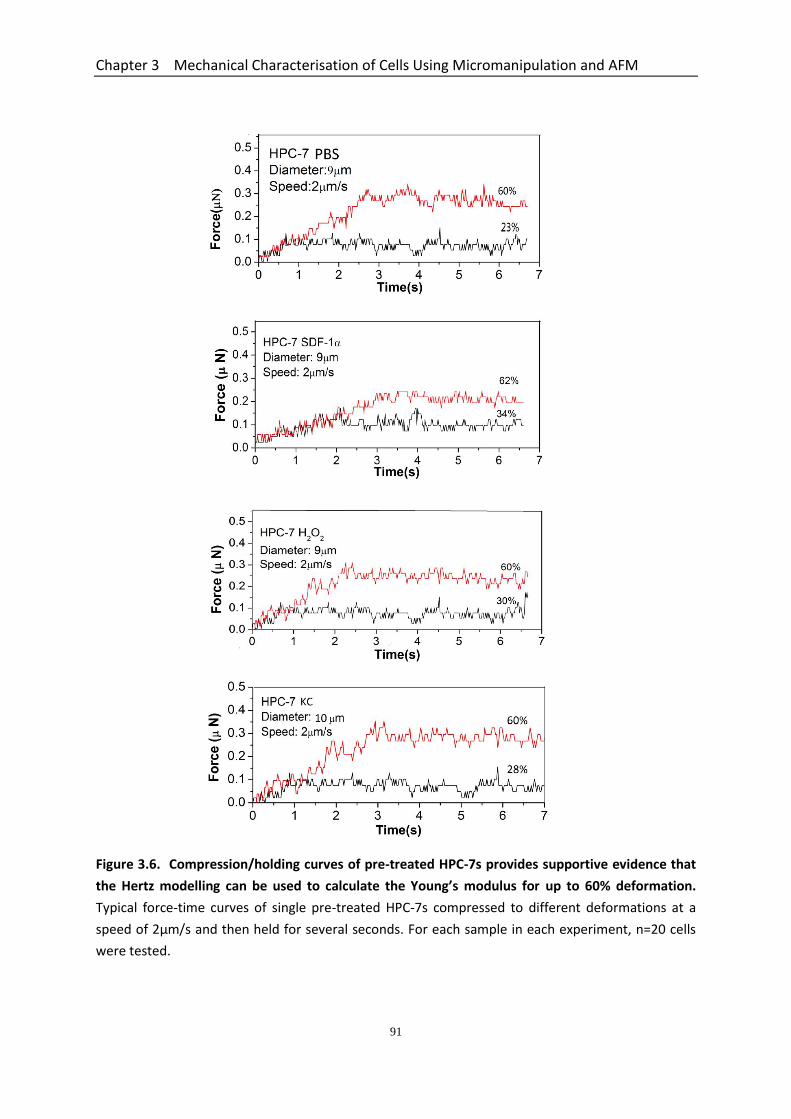
Chapter 3 Mechanical Characterisation of Cells Using Micromanipulation and AFM
91
Figure 3.6. Compression/holding curves of pre-treated HPC-7s provides supportive evidence that
the Hertz modelling can be used to calculate the Young’s modulus for up to 60% deformation.
Typical force-time curves of single pre-treated HPC-7s compressed to different deformations at a
speed of 2μm/s and then held for several seconds. For each sample in each experiment, n=20 cells
were tested.

Chapter 3 Mechanical Characterisation of Cells Using Micromanipulation and AFM
92
3.4 Results - Mechanical Properties of HSCs Corresponding to Small
Deformations as Determined Using AFM
3.4.1 Force Mapping Mode of AFM Identifies Relatively Flat Regions on the Spherical HPC-
7 Cell Surface
Immobilised HPC-7 cells were visualised through an optical microscope which allowed
identification of those cells which were to be scanned in detail using AFM (Figure 3.7a). AFM
allows an insight into the surface, structure and topography of cells to be gained in 3D, as
well as an investigation of tip induced deformation of the cells. An area of 64x64 pixels was
identified in which the cantilever was to be applied (containing approximately 20 HPC-7
cells). At each point or pixel in this image a measurement of surface height was made using
the force mapping mode of the software. By ‘touching’ the cells with a small tip attached to
a cantilever, and measuring the vertical displacement needed to do so, the height could be
measured as the tip scanned the 64 x 64 pixel region. These measured heights were
displayed as colors (dark-is-low, bright-is-high) with a gradient of color (red-orange-yellow).
This generated a multicolor image of surface topography (Figure 3.7b). Height information
mapped to color value was also used to distinguish single cells from the underlying
substrate (darkest colour). This height information could also be represented as a histogram
showing the height distribution across the cross-section of a single cell (Figure 3.7c). These
histograms demonstrated that cells had some relatively flat areas, usually at the centre of
the cell, which made contact with the AFM cantilever tip. This region meets the condition of
contact mode for calculation of Young’s modulus with the Hertz model (Note). Hence the
collection of force curves at relatively flat areas (center area of the cell) could be obtained
(Section 3.4.2). At least 20 cells were randomly selected and 4 curves at the highest position
of each cell were generated for further data analysis. The data containing all the force
curves and corresponding spatial information were recorded in one single scan.
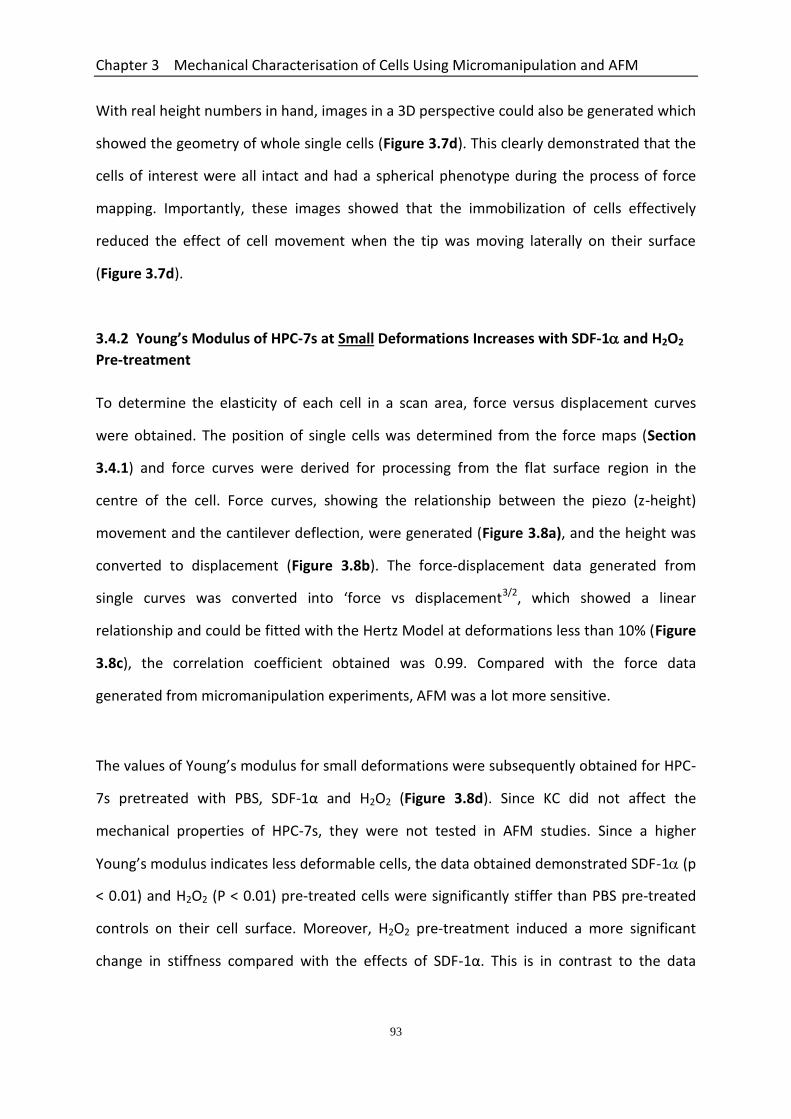
Chapter 3 Mechanical Characterisation of Cells Using Micromanipulation and AFM
93
With real height numbers in hand, images in a 3D perspective could also be generated which
showed the geometry of whole single cells (Figure 3.7d). This clearly demonstrated that the
cells of interest were all intact and had a spherical phenotype during the process of force
mapping. Importantly, these images showed that the immobilization of cells effectively
reduced the effect of cell movement when the tip was moving laterally on their surface
(Figure 3.7d).
3.4.2 Young’s Modulus of HPC-7s at Small Deformations Increases with SDF-1 and H2O2
Pre-treatment
To determine the elasticity of each cell in a scan area, force versus displacement curves
were obtained. The position of single cells was determined from the force maps (Section
3.4.1) and force curves were derived for processing from the flat surface region in the
centre of the cell. Force curves, showing the relationship between the piezo (z-height)
movement and the cantilever deflection, were generated (Figure 3.8a), and the height was
converted to displacement (Figure 3.8b). The force-displacement data generated from
single curves was converted into ‘force vs displacement3/2, which showed a linear
relationship and could be fitted with the Hertz Model at deformations less than 10% (Figure
3.8c), the correlation coefficient obtained was 0.99. Compared with the force data
generated from micromanipulation experiments, AFM was a lot more sensitive.
The values of Young’s modulus for small deformations were subsequently obtained for HPC-
7s pretreated with PBS, SDF-1α and H2O2 (Figure 3.8d). Since KC did not affect the
mechanical properties of HPC-7s, they were not tested in AFM studies. Since a higher
Young’s modulus indicates less deformable cells, the data obtained demonstrated SDF-1 (p
< 0.01) and H2O2 (P < 0.01) pre-treated cells were significantly stiffer than PBS pre-treated
controls on their cell surface. Moreover, H2O2 pre-treatment induced a more significant
change in stiffness compared with the effects of SDF-1α. This is in contrast to the data

Chapter 3 Mechanical Characterisation of Cells Using Micromanipulation and AFM
94
obtained for HPC-7s at larger deformations up to 60% in which both pre-treatments
decreased the Young’s modulus.
3.5 Pre-treatment of HPC-7s with SDF-1 and H2O2 Induced Polymerization
and Reorganisation of F-actin
F-actin content in HPC-7 cells was analysed by flow cytometry using phalloidin staining.
Cells incubated with PBS acted as control group. Results demonstrated significantly
increased F-actin accumulation in SDF-1 (p < 0.05) and H2O2 (p < 0.05) pre-treatment
groups compared to PBS control cells (Figure 3.9a). H2O2 induced a more significant change
in content than SDF-1ɑ, which concurs with the change of local mechanics measured by
AFM.
Confocal microscopy revealed that cells pre-treated with SDF-1ɑ or H2O2 appeared to lose
the characteristic rounded shape that was observed for the PBS control treated cells.
Within control cells, the F-actin network was diffuse and distributed evenly within the whole
cell. However, with both SDF-1 and H2O2 pre-treatment, this staining pattern was
disrupted and replaced with more punctate staining which was primarily localized to the
plasma membrane (Figure 3.10). Hence, although the overall F-actin content was increased,
the content of F-actin appeared reduced in the cell interior and increased in the outer
cortical region close to the membrane. Furthermore, the cell membrane appeared more
ruffled in appearance compared to the control cells. Moreover, the level of cellular
fluorescence from confocal microscopy images was semi-quantified using ImageJ, the
histogram results of the corrected total cell fluorescence (CTCF) below the images suggested
that pre-treated samples had higher F-actin content, and H2O2 induced more significant
changes on the content change, which is in consistent with the flow cytometry results
(shown in Figure 3.9) .

Chapter 3 Mechanical Characterisation of Cells Using Micromanipulation and AFM
95
Figure 3.7. Optical image and topography information of HPC-7s using the force mapping mode of
AFM identifies relatively flat regions on the HPC-7 cell surface. (a) An image of the cell sample
was observed through an optical microscope. The square box indicates an area of 100x100 m that
was further analysed using AFM. Force scanning was conducted in this 100x100 m area, a region
equivalent to 64x64 pixels. (b) A typical 100x100 m area is shown in which the height data was
mapped to a colour value from which force curves were derived from the central area of the cell. (c)
Cross section of a single cell’s height is shown based on plotting data with steps representing that
the top points of the cell are relatively flat. (d) 3D height projection showing the rough geometry of
the cells in a 100 x 100 m area.
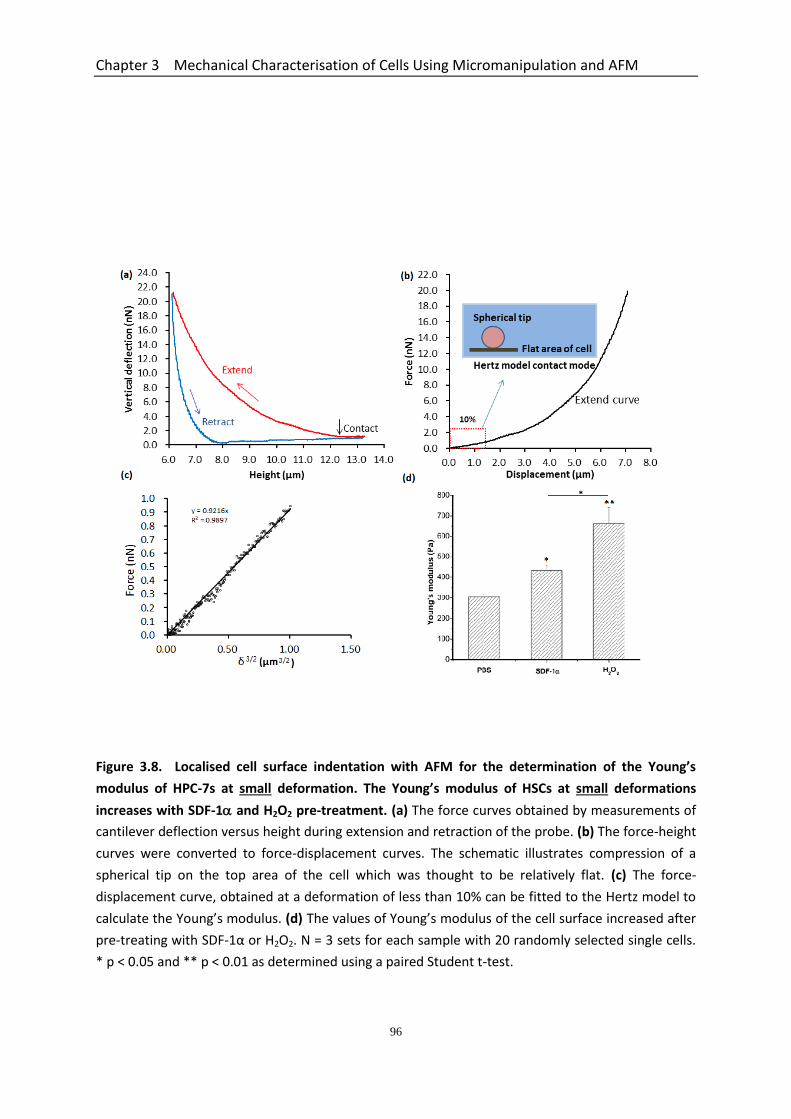
Chapter 3 Mechanical Characterisation of Cells Using Micromanipulation and AFM
96
Figure 3.8. Localised cell surface indentation with AFM for the determination of the Young’s
modulus of HPC-7s at small deformation. The Young’s modulus of HSCs at small deformations
increases with SDF-1 and H2O2 pre-treatment. (a) The force curves obtained by measurements of
cantilever deflection versus height during extension and retraction of the probe. (b) The force-height
curves were converted to force-displacement curves. The schematic illustrates compression of a
spherical tip on the top area of the cell which was thought to be relatively flat. (c) The force-
displacement curve, obtained at a deformation of less than 10% can be fitted to the Hertz model to
calculate the Young’s modulus. (d) The values of Young’s modulus of the cell surface increased after
pre-treating with SDF-1α or H2O2. N = 3 sets for each sample with 20 randomly selected single cells.
* p < 0.05 and ** p < 0.01 as determined using a paired Student t-test.
Chapter 3 Mechanical Characterisation of Cells Using Micromanipulation and AFM
97
Figure 3.9. Pre-treatment of HPC-7s with SDF-1 and H2O2 induced polymerization of F-actin as
determined by flow cytometry. (a) represents the mean fluorescence intensity (FLI) for each group.
Cells pre-treated with SDF-1α or H2O2 increased F-actin accumulation compared to PBS control
group (p < 0.05). H2O2 induced a more significant change in content than SDF-1α. Typical histograms
obtained for (b) SDF-1α and (c) H2O2 group. The blue shaded area represents the control and the
black line the F-actin test antibody. A shift to the right hand side indicates increased F-actin
detection. Results are presented as mean ± SEM of 3 experiments.

Chapter 3 Mechanical Characterisation of Cells Using Micromanipulation and AFM
98
Figure 3.10. The characteristic distribution of actin filaments in response to PBS, SDF-1α and H2O2.
PBS control cells showed more spherical morphologies and smooth surfaces with more diffuse and
uniform F-actin staining within the cell cytoplasm. However, within pre-treated HPC-7s, the uniform
F-actin staining was replaced with more punctate staining which was localized to the plasma sub-
membrane region. Hence, although the overall F-actin content was increased, it appeared that the
content of F-actin was reduced in the cell interior and increased in the outer cortical region close to
the membrane. Furthermore, the cell membrane appeared more irregular and ruffled in appearance
compared to the control cells. Some cells showed lamellipodia formation which contained F-actin
within them. Scale Bar = 20 m.
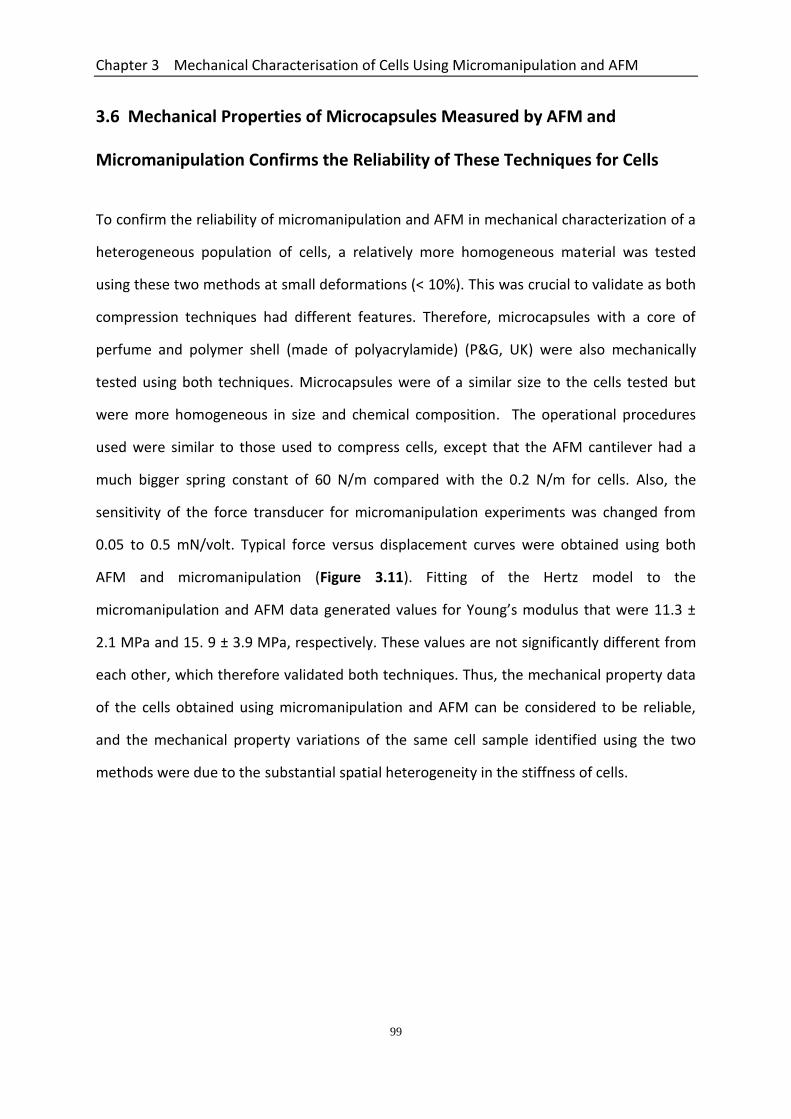
Chapter 3 Mechanical Characterisation of Cells Using Micromanipulation and AFM
99
3.6 Mechanical Properties of Microcapsules Measured by AFM and
Micromanipulation Confirms the Reliability of These Techniques for Cells
To confirm the reliability of micromanipulation and AFM in mechanical characterization of a
heterogeneous population of cells, a relatively more homogeneous material was tested
using these two methods at small deformations (< 10%). This was crucial to validate as both
compression techniques had different features. Therefore, microcapsules with a core of
perfume and polymer shell (made of polyacrylamide) (P&G, UK) were also mechanically
tested using both techniques. Microcapsules were of a similar size to the cells tested but
were more homogeneous in size and chemical composition. The operational procedures
used were similar to those used to compress cells, except that the AFM cantilever had a
much bigger spring constant of 60 N/m compared with the 0.2 N/m for cells. Also, the
sensitivity of the force transducer for micromanipulation experiments was changed from
0.05 to 0.5 mN/volt. Typical force versus displacement curves were obtained using both
AFM and micromanipulation (Figure 3.11). Fitting of the Hertz model to the
micromanipulation and AFM data generated values for Young’s modulus that were 11.3 ±
2.1 MPa and 15. 9 ± 3.9 MPa, respectively. These values are not significantly different from
each other, which therefore validated both techniques. Thus, the mechanical property data
of the cells obtained using micromanipulation and AFM can be considered to be reliable,
and the mechanical property variations of the same cell sample identified using the two
methods were due to the substantial spatial heterogeneity in the stiffness of cells.
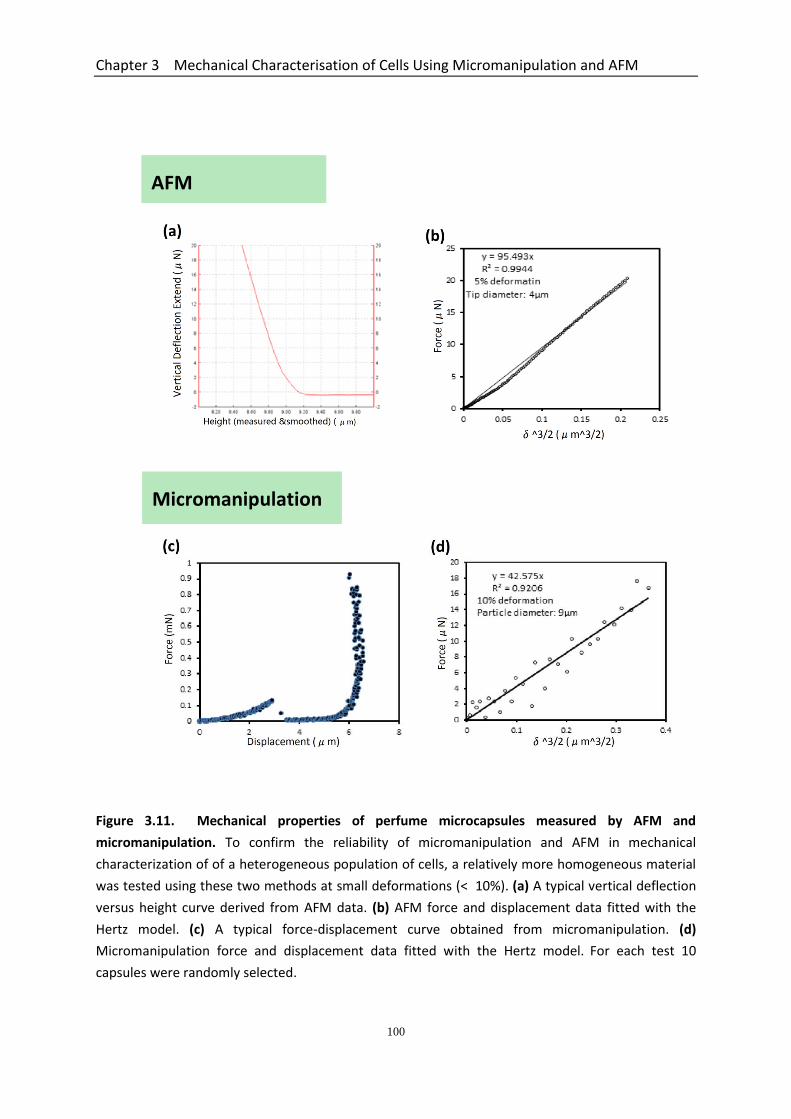
Chapter 3 Mechanical Characterisation of Cells Using Micromanipulation and AFM
100
Figure 3.11. Mechanical properties of perfume microcapsules measured by AFM and
micromanipulation. To confirm the reliability of micromanipulation and AFM in mechanical
characterization of of a heterogeneous population of cells, a relatively more homogeneous material
was tested using these two methods at small deformations (< 10%). (a) A typical vertical deflection
versus height curve derived from AFM data. (b) AFM force and displacement data fitted with the
Hertz model. (c) A typical force-displacement curve obtained from micromanipulation. (d)
Micromanipulation force and displacement data fitted with the Hertz model. For each test 10
capsules were randomly selected.
Micromanipulation
AFM
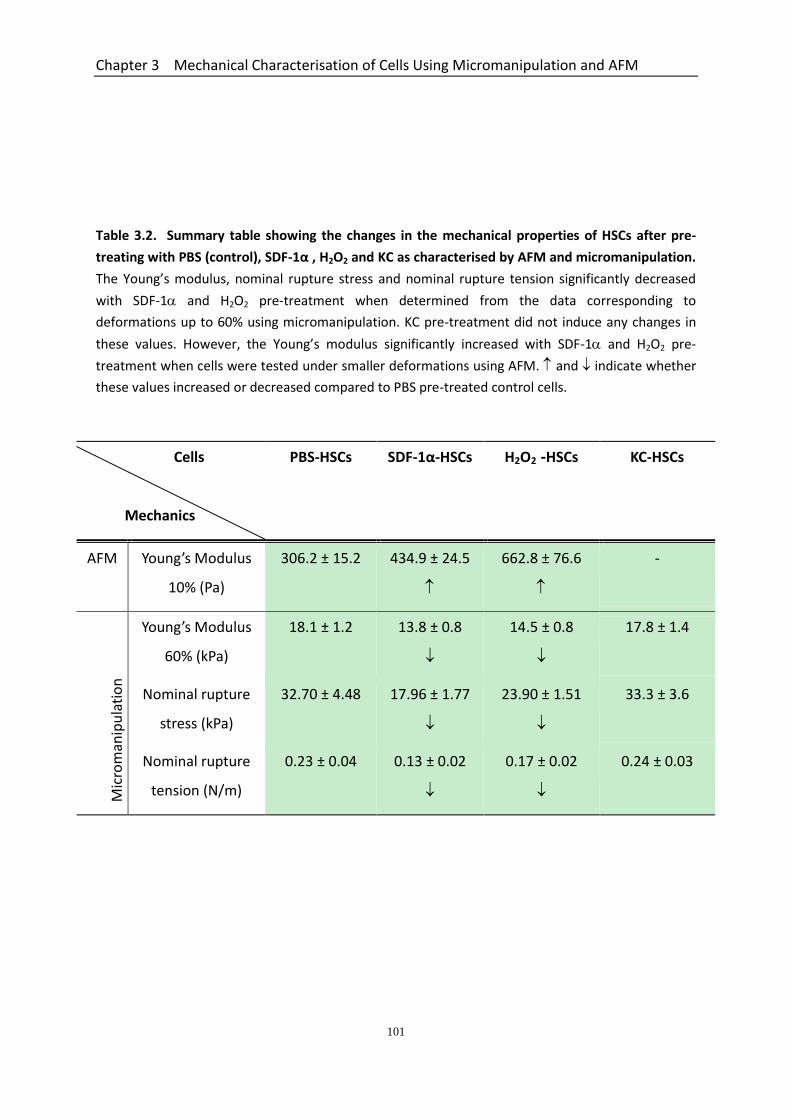
Chapter 3 Mechanical Characterisation of Cells Using Micromanipulation and AFM
101
Table 3.2. Summary table showing the changes in the mechanical properties of HSCs after pre-
treating with PBS (control), SDF-1α , H2O2 and KC as characterised by AFM and micromanipulation.
The Young’s modulus, nominal rupture stress and nominal rupture tension significantly decreased
with SDF-1 and H2O2 pre-treatment when determined from the data corresponding to
deformations up to 60% using micromanipulation. KC pre-treatment did not induce any changes in
these values. However, the Young’s modulus significantly increased with SDF-1 and H2O2 pre-
treatment when cells were tested under smaller deformations using AFM. and indicate whether
these values increased or decreased compared to PBS pre-treated control cells.
Cells
Mechanics
PBS-HSCs SDF-1α-HSCs H2O2 -HSCs KC-HSCs
AFM Young’s Modulus
10% (Pa)
306.2 ± 15.2 434.9 ± 24.5
662.8 ± 76.6
-
Mic
rom
anip
ula
tio
n
Young’s Modulus
60% (kPa)
18.1 ± 1.2 13.8 ± 0.8
14.5 ± 0.8
17.8 ± 1.4
Nominal rupture
stress (kPa)
32.70 ± 4.48 17.96 ± 1.77
23.90 ± 1.51
33.3 ± 3.6
Nominal rupture
tension (N/m)
0.23 ± 0.04 0.13 ± 0.02
0.17 ± 0.02
0.24 ± 0.03

Chapter 3 Mechanical Characterisation of Cells Using Micromanipulation and AFM
102
3.7 Discussion
Reducing the entrapment of injected stem cells within the microvessels of non-specific sites,
and thus increasing and maintaining their circulation in peripheral blood, is a potential
mechanism for enhancing their homing to sites of injury. This can be achieved either by
improving stem cell deformability using pre-treatment strategies or by separating stem cells
based on their deformability and only injecting the more deformable sub-set. However, no
studies have investigated in detail whether chemical pre-treatment strategies can modify
stem cell deformability or even characterised the deformability of per se. This chapter
therefore aimed to characterise and compare the mechanical properties of naïve and pre-
treated bone marrow-derived murine HSCs (HPC-7s) and MSCs with micromanipulation and
AFM techniques. A summary of major HSC findings can be found in Table 3.2. Briefly, initial
experiments firstly showed that HSCs and MSCs were larger in size compared to blood
neutrophils. Also, both cell types were a more heterogenous population with regards their
size as demonstrated by the diameter range. Micromanipulation experiments showed both
neutrophils and HSCs could be compressed to rupture, unlike MSCs which did not
demonstrate obvious rupture force. Furthermore, it was demonstrated that neutrophils
were stronger/stiffer cells with HSCs being mechanically ‘weaker’ cells. The Young’s
modulus (elastic modulus) was also determined which represents the stiffness of the cells
being studied. Greater Young’s modulus values for neutrophils determined from data up to
large deformations again indicated they were significantly stiffer mechanically than the
more deformable HSCs. Interestingly, HSCs and MSCs were shown to possess similar
deformability despite their size difference. More importantly, micromanipulation studies
also demonstrated that SDF-1 and H2O2, but not KC, significantly increased HSC
deformability. This was evidenced by less force required to rupture pre-treated cells,
decreased nominal rupture stress/tension and significantly reduced Young’s modulus values
at large deformations. Interestingly, the Young’s modulus values significantly increased with
SDF-1 and H2O2 pre-treatment when cells were tested under smaller deformations (10%)
Chapter 3 Mechanical Characterisation of Cells Using Micromanipulation and AFM
103
using AFM.
3.7.1 Mechanical Properties as Determined by Micromanipulation Studies
HSC/MSC-based therapies are limited by inefficient homing of systemically injected cells to
the tissue/organ that is actually injured (Kavanagh et al., 2014). This is primarily due to non-
specific entrapment within capillaries, with the lungs being a particularly common site in
which stem cells become physically lodged. Entrapment of MSCs is evidenced by their
striking elongated and distorted appearance, when observed in vivo using intravital
microscopy, within numerous microvessels upstream of the injured tissue (Figure 3.12). This
is sometimes associated with partial or complete obstruction of the blood flow within the
microvessel (Kavanagh et al., 2015). In contrast, cells that successfully home to injured
tissue appear more rounded in morphology, suggesting that possibly smaller stem cells are
delivered to actual sites of injury. The wide diameter range of both HSCs and MSCs does
suggest size may indeed be a likely important factor in maintaining stem cells within the
peripheral blood and allowing their active recruitment.

Chapter 3 Mechanical Characterisation of Cells Using Micromanipulation and AFM
104
Figure 3.12. Only MSCs that are either small and/or deformable are able to home to sites of tissue
injury. Representative fluorescent intravital microscopy images are shown of CFSE-labelled MSCs
adherent within the microcirculation of the healthy (sham) and ischemia-reperfusion (IR) injured
mucosa of the mouse small intestine in vivo. These MSCs are more rounded in appearance. It is
possible that these MSCs are either smaller and/or a more deformable sub-set. Entrapment of MSCs
that are either too large and/or poorly deformable can be seen in other regions of the body (e. g. the
intestinal serosa as shown). Here the MSCs appeared elongated and contorted (white arrows).Image
taken from Kavanagh et al., 2015.
Chapter 3 Mechanical Characterisation of Cells Using Micromanipulation and AFM
105
However, size does not necessarily limit the ability of circulating cells to traverse small
diameter capillaries. For example, red blood cells have an approximate diameter of 8 m
diameter but can easily circulate through capillaries that are as small as 2–2.5 m in
diameter (Kwan et al., 2013). This suggests large cells, if they possess appropriate
deformability capabilities, could avoid entrapment within capillaries of non-specific sites,
and thus increase the opportunity for their active recruitment from flow. As such, it is
possible that the MSCs that actually home to, and become adherent within, injured tissues
may have been those that possessed sufficient deformability to avoid entrapment in smaller
microvessels elsewhere.
To determine and compare HSC and MSC deformability, two methods were employed,
namely micromanipulation and AFM. The former can be used to determine the mechanical
properties of single cells of various sizes over a wide range of deformations including high
deformations that lead to cell rupture. In contrast, AFM is powerful in measuring local
elastic properties corresponding to small deformations, primarily impacting only the cell
surface rather than the whole cell. Although AFM can detect the mechanics of the cell
surface with perfect accuracy, micromanipulation is much more straightforward to use and
cells do not need to be immobilized using adhesive proteins which simplifies the sample
preparation procedure. Therefore, micromanipulation was the main choice of experimental
tool for most of the studies described within this chapter. HSC/MSC mechanical properties
were compared to neutrophils. It is firstly demonstrated that only neutrophils and HSCs
could undergo rupture. In terms of cell size, MSCs ˃ HSCs ˃ neutrophils. The large size of
MSCs is well established (Ge et al., 2014). In the current study, the murine BM-derived MSCs
used had a diameter span of 12-20 m. However, MSCs can be much larger, especially when
grown in 2D culture rather than as 3D suspensions, where MSCs extending > 50 m have
been identified (Ge et al., 2014). However, despite their large size, the rupture parameters
that were derived from the force versus displacement curves showed neutrophils were
stronger than both HSCs and MSCs. The force required to rupture neutrophils and HSCs was
Chapter 3 Mechanical Characterisation of Cells Using Micromanipulation and AFM
106
similar (2.2 - 2.3 N) with both cell types rupturing at just under 80% cellular deformation.
At first glance, this suggested both neutrophils and HSCs were equally ‘strong’ or ‘stiff’.
However, this data did not take into account that the size of these cells was different.
Therefore to make meaningful comparisons between the mechanical properties of
neutrophils and HSCs, nominal rupture stress and nominal rupture tension was calculated,
which took into account the different cross-sectional area and diameter of the cells
respectively. Once corrected for size, it became apparent that neutrophils were
stronger/stiffer cells with HSCs being ‘weaker’ cells. The Young’s modulus determined from
data corresponding to large deformations up to 60%, was also confirmed that neutrophils
were indeed significantly stiffer than HSCs. A Young’s modulus value, at 60% deformation,
was also determined for MSCs which, interestingly, demonstrated that they were only
slightly more deformable than HSCs despite the fact that their overall cell size was much
bigger.
This novel data primarily demonstrated that the naïve/un-treated, smaller blood neutrophils
were stiffer than naïve stem cells. This is interesting when considering that fact that
recruitment of the more deformable stem cells is not as rapid or as efficient as ‘stiffer’
neutrophil recruitment during inflammatory processes (Summers et al., 2010, Kolaczkowska
and Kubes, 2013). Indeed, the Kalia group have frequently observed large numbers of
neutrophils infiltrating injured tissues within minutes of an inflammatory insult, numbers
that far exceed those of recruited HSCs or MSCs. Of the two stem cell types, the recruitment
of HSCs is much higher than MSCs within a similarly injured tissue (Kavanagh et al., 2015).
Collectively, this suggests that size is likely to play an important and dominant factor in the
recruitment of different free flowing circulating cell types in vivo. Smaller cells clearly
circulate and adhere better than larger cells even though they are a lot stiffer, and therefore
deformability may be considered as being of secondary importance.

Chapter 3 Mechanical Characterisation of Cells Using Micromanipulation and AFM
107
3.7.2 Why MSCs Did not Demonstrate Rupture
One of the interesting observations made within this chapter was the fact that MSCs did not
demonstrate rupture. During compression with the micromanipulation probe, neutrophils
and HSCs demonstrated obvious rupture behavior, whilst MSCs showed an absence of clear
rupture force. These two different mechanical responses are in likely agreement with the
two main mechanical behaviour models that have previously been described for cells
(Stamenović & Ingber, 2002; Lim et al., 2006; Fei et al., 2014; Bansod and Bursa, 2015).
These models suggest specific structures in a cell dominate its deformability and play a
major role in transmitting and distributing mechanical stresses within the cell after exposure
to an external force. Cells can behave either more similarly to a ‘cortical shell - liquid core’
structure (membrane-like; also called the liquid drop model) or as a ‘homogeneous solid
state’ structure (cytoskeleton-like) when being compressed by the applied forces. Their
response to this stress is suited to the biological processes they need to undergo. The
‘cortical shell - liquid core’ model assumes that the main cellular structures resisting any
external forces are confined within the thin (~100 nm) actin-rich deformable cortex
beneath the plasma membrane of the cell (Ge et al., 2014, Saito et al., 2002, Liu et al., 2014).
In these models, it is assumed that the liquid cell interior or cytoplasm plays little role in
resisting mechanical forces. In contrast, some believe the cortical layer does not play a
significant role in resisting force and that cells follow a more ‘homogenous solid state’ model
which assumes the whole cell is a homogeneous, viscoelastic solid material and that the
internal cytoplasmic cytoskeleton is the dominant structure resisting mechanical load. In
this model, the contribution of the cortical layer is considered negligible. The ‘cortical shell -
liquid core’ model is widely applied to model suspended cells that are found as spheres in
suspension in the body i.e. blood cells. The ‘homogenous solid state’ model is generally
applied to more adherent cells (Stamenović and Ingber, 2002, Lim et al., 2006, Bansod and
Bursa, 2015). Previous studies conducted by Zhang’s group also demonstrated that adhered
cells, e.g. chondrocytes, ruptured when compressed by micromanipulation (Nguyen et al.,
2009). Therefore, the different mechanical models may not necessarily be responsible for
Chapter 3 Mechanical Characterisation of Cells Using Micromanipulation and AFM
108
the rupture behaviours of cells, and it is still debated whether cells behave more similarly to
a ‘cortical shell - liquid core’ structure or to a ‘homogeneous solid state’ structure. However,
we demonstrated two different force responses in this chapter, which indicated that it is
possible that the tested cells follow one or the other of the two models described above
regarding their in vivo functions. Although HSCs are adherent cells within the BM, they can
exit the BM following trauma and travel via the circulation, similarly to blood neutrophils, to
sites of injury. Hence both these cell types probably follow the ‘cortical shell - liquid core’
model applied to spherical cells found in suspension. The clear rupture force of neutrophils
and HSCs, most likely resulted from the breakage of their cortical shell. The subsequent
compression of the liquid interior after shell rupture induced the rapid measured decrease
in the force in the force-displacement curves. In contrast to suspended cells, MSCs are
primarily classed as adherent that do not generally exit their niche (e.g. BM) and circulate in
peripheral blood under physiological conditions. Hence for MSCs the ‘homogenous solid
state’ model may be more relevant as this is applied to adherent cells (Stamenović and
Ingber, 2002). The homogenous, viscous nature of the whole cell most likely explained their
ability to withstand force and therefore not undergo rupture. Indeed, in culture MSCs can
readily assume a flattened appearance.
These mechanical properties therefore mirror the in vivo functional distinctions of these cell
types. For neutrophils, which naturally exisit in the circulation as spherical entities, and HSCs
which can be made to do so, the ‘cortical shell - liquid core’ model is an advantageous
strategy as their free circulation may be attributed to the self-rotation of individual cells in
response to shear stress, similar to liquid drops under a driving flow (Abkarian and Viallat,
2005, Hur et al., 2011, Chau et al., 2013). MSCs, not naturally designed to circulate in the
peripheral blood, generally adhere to each other or to their substrate throughout their
lifetime, and so the ‘homogenous solid state’ cellular structure plays an important role in
transmitting and distributing mechanical stress within the cell (Stamenović and Ingber,
2002).
Chapter 3 Mechanical Characterisation of Cells Using Micromanipulation and AFM
109
3.7.3 Mechanical Properties as Determined by AFM Studies
Micromanipulation (micro-Newton forces) data were used to generate parameters of
stiffness and mechanical strength at large deformations on the whole cell scale. However,
AFM, which provides forces at a nano-Newton level, was used to probe cell mechanics at
small deformations. For the same HSC cell type, the Young’s modulus calculated from
micromanipulation data at deformations up to 60% was about 40 times bigger than that
calculated at smaller deformations up to 10% using AFM. Similar force-dependence of the
Young’s elastic modulus has been seen previously - the mechanical stiffness can vary by
several decades from surfaces and crosslinked cytoskeletal networks, which can be
explained in part by the actin concentration in the network at large deformation (Xu et al.,
2000, Gardel et al., 2004, Storm et al., 2005). Previous studies using AFM being mounted
with a spherical tip to measure different types of mammalian cell modulus gave values of
0.3 ~ 6.5 kPa at small deformations (~15%) (Darling et al., 2008, Vargas-Pinto et al., 2013),
elastic values of HSCs obtained in this study also fall into this range. The modulus of single
chondrocytes and chondrons tested with micromanipulation at large deformations (30-60%)
have been presented as 15 to 29 kPa, which are similar to the values (14 – 18 kPa) in the
present study (Nguyen et al., 2010).
3.7.4 Mechanical Properties of Pre-treated Cells
Mechanical properties of pre-treated HSCs were comprehensively characterised at different
deformations. Micromanipulation and AFM studies were conducted on HSCs pre-treated
with well known inflammatory factors, namely SDF-1, H2O2 and KC. These non-genetically
modified approaches to increase SC retention provide the potential of them being used
clinically as an adjuvant therapy to enhance the stem cell efficiency. The Kalia lab have
previously shown that such pre-treatment strategies improve the recruitment of HSCs
within sites of injury, which was postulated to be due, partly, to their ability to improve cell
deformability and thus prevent non-specific microvascular mechanical entrapment.
Chapter 3 Mechanical Characterisation of Cells Using Micromanipulation and AFM
110
The Young’s modulus calculated from micromanipulation data at deformations up to 60%
decreased when HSCs were pre-treated with SDF-1α and H2O2. Similarly, the nominal
rupture stress/tension of these pre-treated HSCs also decreased. This collectively suggested
the cells as a whole became weaker and more deformable after pre-treatment with SDF-1α
and H2O2. This ‘softening’ after pre-treatment is in accordance with a previously published
work using a more basic micropipette aspiration method. White and colleagues showed that
when 10 m HPC-7 cells were sucked into 5 m (inner diameter) micropipettes, and were
thus squeezed to large deformations, the time it took to fully aspirate them was reduced
following SDF-1 pre-treatment (White et al., 2013). This may be due to the re-
organization/disruption of actin filaments from highly-ordered 3-D structure to a more
diffuse pattern. Although this improved deformability may well enhance SC homing to sites
of injury, it is important to state at this stage that additional effects included modifying the
clustering of HSC surface integrins and increasing their affinity for endothelial
counterligands can also explain the improved recruitment of pre-treated cells (Kavanagh et
al., 2013a; Kavanagh et al., 2013b).
In contrast to the micromanipulation data, the values of the Young’s modulus calculated
from the AFM experiments increased with similar pre-treatments which suggested that the
HSC surface stiffened after pre-treating with SDF-1α and H2O2. This stiffening of the cell
surface after pre-treatment can potentially be explained by the expansion and
polymerization of F-actin to the plasma membrane. Indeed, the increased immunostaining
of F-actin filaments noted (higher component concentration) in the cortical membrane after
pre-treatment may allow for the observed increase in the elasticity modulus at small
deformations. It is well established that one of the earliest effects (within 1 minute) of
inflammatory mediators on neutrophils is to cause them to become stiffer and less
deformable. Most often these effects are short-lived and disappear after ~30 minutes
(Hajime et al., 2002; Wai et al., 2005). These changes have been extensively studied in vitro
by measuring the pressure required to aspirate them into a narrow micropipette. This
Chapter 3 Mechanical Characterisation of Cells Using Micromanipulation and AFM
111
enhanced stiffness is thought to be due to the polymerisation of G-actin to F-actin that
forms a subcortical shell beneath the membrane. Actin is a key component of the neutrophil
cytoskeleton and contributes to the cell stiffness. Polymerization from a globular
monomeric G-actin form to a filamentous form F-actin form leads to neutrophil stiffening.
This increased stiffness enhances the margination of neutrophils in inflamed regions and
delays their transit which encourages binding through integrin activation. On the downside,
this increased stiffening can lead to neutrophil sequestration within the pulmonary
microvessels. Similar F-actin observations were made in the current study in which HSCs
also showed sub-membrane localisation of F-actin after pre-treatment with SDF-1 and
H2O2. This would suggest the pre-treated HSCs were stiffer in their cortical region than PBS
treated cells because of the increased F-actin beneath the plasma membrane. This may
explain why AFM studies generated Young’s modulus values under small deformations that
were higher for the pre-treated cells.
Interestingly, it has previously been shown that the mechanical properties of cells are
anisotropic in the axial direction with respect to actin concentration – ie. the architecture of
the actin network in the cell surface/lamellipodia determines the elasticity of that region
(Fleischer et al., 2007). However, the mechanical property parameters derived in this study
may not be able to perfectly reflect the inherent architectural structure of the cells’ actin
networks. Nevertheless, the calculations of Young’s modulus derived from the data can still
be used to evaluate the stiffness of individual cells. Due to the complex contributions of
various cellular components (actin, nucleus, cytoskeleton etc.) in response to different
applied load, more complex mathematical modelling methods such as finite element
analysis (FEA) would be an ideal approach to completely quantify the data. FEA is a
computerized method for predicting how different components within cells would
specifically react to physical forces applied to them. However, this is beyond the scope of
this study. Briefly, it is assumed that at small deformations (< 10%), the membrane
contributes to force resistance which is largely elastic. At large deformations ( 60%), the
Chapter 3 Mechanical Characterisation of Cells Using Micromanipulation and AFM
112
membrane stretching and cytoskeleton contribute to the mechanical strength. When the
deformation increases further, the nucleus participates in mechanical resistance, and the
membrane is burst at a certain deformation. In this chapter, only simpler equations were
used to extract some important mechanical property parameters from the measurements
collected using micromanipulation and AFM.
3.8 Conclusions
Improving the retention efficiency of circulating stem cells within sites of injury may depend
on manipulating the mechanical properties of these cells or isolating smaller and more
deformable sub-populations for infusion. Microfluidic systems have been shown to separate
cells based on their mechanical properties, such as shape, size and stiffness (Gossett et al.,
2010, McFaul et al., 2012). Prior to conducting such separation studies, some information
on the mechanical properties of different therapeutic cells was required. This was obtained
using micromanipulation and AFM methods for HSCs and MSCs. To summarize, it has been
demonstrated that mechanical distinctions exist amongst different therapeutic cells with
regards their size, deformability and also their rupture response to applied stress. Although
distinct differences were observed between these two SC populations, this study also
suggests intra-population variation exists within naïve and pre-treated HSCs. These different
mechanical parameters can potentially be utilized as label-free markers in cell sorting
systems to separate different sub-populations of stem cells. Mechanical properties of
individual HSCs are force/deformation-dependent and highly non-linear from the cell
surface to the internal cytoskeleton regarding the structure and concentration of actin
filaments. This mechanical heterogeneity of HSCs confirms the possibility of isolating sub-
populations from a mixed population of cells using the physical markers found in this
chapter, followed by fabrication and optimization of microfluidic sorting--systems.
Chapter 4 HSC Sorting with Microfluidic Systems
113
Chapter 4
HSC Sorting with Microfluidic Systems
Chapter 4 HSC Sorting with Microfluidic Systems
114
4.1 Introduction
To improve the recruitment of circulating HSCs, a number of different strategies have been
employed including genetically modifying the adhesion molecule expression on the stem
cell surface, pre-treating them with inflammatory stimuli or increasing the presence of
soluble stem and endothelial activators within the injured mileu (Kumar and Ponnazhagan,
2007, White et al., 2013). To be effective, all of these strategies require the HSCs to actually
traffick through the tissue or organ of interest so that stem cell-endothelial interactions can
take place. Although adhesive events are indeed increased when stem cells are passing
through, none of these strategies necessarily increases the actual trafficking process. Indeed,
most injected cells are lost after ‘first pass’ to non-specific sites by entrapment. Therefore,
in addition to manipulating the adhesive molecules through genetic, biological or chemical
manipulations, additional strategies are required to maintain a pool of circulating cells in the
peripheral blood.
A promising approach to achieve this would be to separate sub-populations of cells with
smaller size and/or less stiffness from a blend of HSC cells and using them for infusion. The
previous chapter demonstrates HSCs are actually more deformable than blood neutrophils,
but importantly, not all HSCs share the same mechanical properties and that there is a
broad range of deformabilities within a single heterogenous population. Therefore it may be
possible to utilise this to separate out the more deformable cells. This should theoretically
avoid the ‘first pass only’ problem and ensure HSCs are retained in the circulation. Current
strategies for cell separation depend on biochemical modification or labeling of the cells,
such as fluorescent activated cell sorting (FACS) and magnetic-activated cell sorting (MACS)
(Herzenberg et al., 1976, Schmitz et al., 1994, Fong et al., 2009). Recently, a number of
intrinsic biomarkers have been discovered to separate cells, including mechanical properties
(size, deformability and shape). There has been an increased interest in using techniques
that make use of separation chips/microfluidic channels and the intrinsic physical or
mechanical properties of cells for sorting purposes. Different microfluidic channels are
Chapter 4 HSC Sorting with Microfluidic Systems
115
available including straight and curved which use different forces to separate cells into
‘equilibrium positions’ within the fluid. In straight channels, inertial lift forces depending on
particle / cell size are able to focus them as they migrate across different streamlines to
different equilibrium positions, for example the periphery (Martel and Toner, 2013).
However, the accuracy can be low as the length of the channel may not give sufficient time
for particles to migrate to these equilibrium positions (Gossett et al., 2010).
Inertial lift forces used to separate cells, which depend on their sizes, can be combined with
deformability-dependent forces for separation purposes. The rotational Dean drag force
generated the secondary flow type exits in spiral or curved channel geometries that can be
balanced with inertial forces to focus cells in streams into a particular channel of a
separating device. In spiral rectangular channel devices, the counter-rotating Dean vortices,
induced due to the curvature, disrupt the balance of the inertial forces and the particles are
refocused in different positions. In the present study, the inertial lift in straight
microchannels and the secondary flow in curved channels were made use of to sort HSCs.
The principles by which these channels work have been described in detail in Chapter 1,
Section 1.5.3. Briefly, it is hypothesized that it should be possible to separate sub-
populations of HSCs with different sizes and deformability when passing them through
microchannels by controlling the channel geometries and flow conditions.
To further assess whether injection of a sub-population of more deformable HSCs isolated
by microfluidics can indeed actually improve the homing and subsequent adhesion within
injury sites, potentially by avoiding pulmonary entrapment, fluorescent intravital
microscopy was utilised. This technique allows direct imaging of the microcirculation of
various organs in vivo in anaesthetised mice. Indeed, recent advances in intravital imaging
methods have allowed the successful monitoring of infused cells in living animals
(Rodriguez-Porcel, 2010). This study investigated the ability of HSCs to home to the
ischaemia-reperfusion (IR) injured small intestine. IR injury induces a significant cellular and
Chapter 4 HSC Sorting with Microfluidic Systems
116
microvascular damage to tissues and organs resulting from the return / reperfusion of blood
flow to previously ischemic tissues or organs. This injury often occurs during a wide array of
routine surgical procedures, such as organ transplantation which inevitably hampered the
blood supply (King et al., 2000), as well as many clinical pathologies including stroke,
myocardial infarction and limb ischaemia (Collard and Gelman, 2001). The return of the
blood supply or reperfusion produces a number of inflammatory responses that both
heighten local tissue and microvascular damage and lead to a systemic insult as well
(Dorweiler et al., 2007). The clinical outcomes of IR injury can be severe and diverse
including direct organ dysfunction, breakdown of the gastrointestinal barrier, systemic
inflammatory response syndrome and multi-organ dysfunction syndrome (Collard and
Gelman, 2001).
Modulating the physical properties of transplanted cells through isolating smaller and more
deformable cells is an option to overcome the mechanical obstacles in circulation and thus
enhance HSC retention at the site of injuried organs. The ability of a number of microfluidic
devices with different geometries to separate cells of interest based on their intrinsic
mechanical heterogeneity was developed and tested. Microfluidic and micromanipulation
results presented in this Chapter suggested Device C had a relatively higher separation
efficiency for HPC-7 cells with these specific mechanical property parameters than the
others deivces. To evaluate the potential clinical benefit of this cell sorting system, intravital
experiments were conducted. Following cell separation under the optimum conditions with
Device C, the changes of free flowing and adherent HPC-7 cells in the IR injured mouse small
intestine over time were assessed.
In this Chapter, five different microfluidic devices were tested to identify the one which
could most effectively and efficiently separate HSCs based on their size and deformability. In
order to evaluate and determine the performance of each device, several separation
performance metrics were utilized:

Chapter 4 HSC Sorting with Microfluidic Systems
117
1) degree of separation – which was defined by the size and deformability differences
between different sub-populations. The mean values and coefficients of variation
(CV) of these parameters, as well as the mechanical property distribution of
individual cells, were used to illustrate the separation efficiency at varying flow
conditions.
2) viability – defined as the percent of the number of viable cells in the total number of
cells before and after sorting. Cell viability was asssessed using trypan blue in which
those cells taking up this dyes were considered non-viable.
3) throughput – typically, the volumetric flow rate and cell density were used to
calculate the number of cells sorted per unit time.
Young’s Modulus (E) is a measure of cell stiffness and calculated as E =σ
ε , where σ
represents the stress applied on the material, and ε is the strain the material underwent.
It can be seen from this equation that the Young’s modulus is proportional to the stress,
suggesting that the deformability of different materials can be compared by the values of
stress when their deformations are similar. Therefore, in the present study nominal rupture
stress (σR) was used to assess the separation efficiency of microfluidic sorting systems due
to the simpler data processing procedure compared to the calculation of Young’s modulus.
Moreover, the possible underlying physics of the lateral migration of cells was revealed to
quantify the relative importance of the relevant physical phenomena in cell sorting.
The dimensionless numbers used in this study, namely hydraulic diameter of the
microfluidic device, its aspect ratio, Reynolds number, blockage ratio, Dean and inertial
force number and the curvature ratio, and how they were derived are shown in Table 4.1.
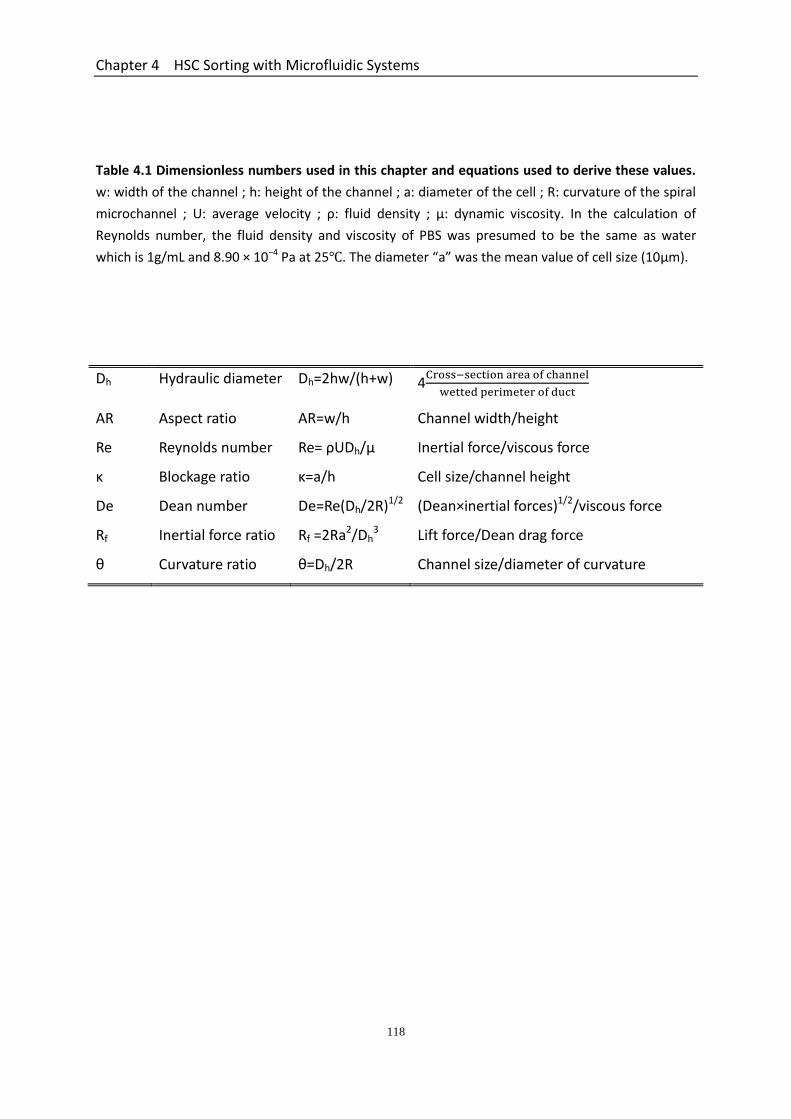
Chapter 4 HSC Sorting with Microfluidic Systems
118
Table 4.1 Dimensionless numbers used in this chapter and equations used to derive these values.
w: width of the channel ; h: height of the channel ; a: diameter of the cell ; R: curvature of the spiral
microchannel ; U: average velocity ; ρ: fluid density ; μ: dynamic viscosity. In the calculation of
Reynolds number, the fluid density and viscosity of PBS was presumed to be the same as water
which is 1g/mL and 8.90 × 10⁻⁴ Pa at 25℃. The diameter “a” was the mean value of cell size (10μm).
Dh Hydraulic diameter Dh=2hw/(h+w) 4Cross−section area of channel
wetted perimeter of duct
AR Aspect ratio AR=w/h Channel width/height
Re Reynolds number Re= ρUDh/µ Inertial force/viscous force
κ Blockage ratio κ=a/h Cell size/channel height
De Dean number De=Re(Dh/2R)1/2 (Dean×inertial forces)1/2/viscous force
Rf Inertial force ratio Rf =2Ra2/Dh3 Lift force/Dean drag force
θ Curvature ratio θ=Dh/2R Channel size/diameter of curvature
Chapter 4 HSC Sorting with Microfluidic Systems
119
4.2 Materials and Methods
4.2.1 Fabrication of Microfluidic Chips
The geometries of the five microfluidic chips or systems used in this chapter are shown in
Table 4.2. They were fabricated using soft lithography techniques based on standard
methods that have been described previously (Sun et al., 2010, Yuan et al., 2012). Soft
lithography uses soft, elastic and opaque materials, notably polydimethylsiloxane (PDMS),
to construct sealed structures on a nanometer scale. Briefly, a photolithography mask or
template of the microchannel device was drawn in AutoCAD, a commercial design software
package, and produced on a silicon substrate mold. A PDMS slab was peeled off from the
mold and bonded with a flat PDMS substrate. Plastic tubing was inserted through the inlet
port and connected to a syringe pump used to pump the cells through the channels. Further
plastic tubing was inserted in all the outlet ports to collect the cells. The curvature radius of
the spiral channel was from 8 mm to 24 mm and the mean value of the radius, 16 mm, was
used to calculate the curvature ratio θ.
4.2.2 Cell Sorting Procedures
4 mL of the HPC-7 cells in medium suspension with a cell density of 2 × 10⁶ /mL was initially
injected into a microchannel with various flow rates. Subpopulations harvested from the
two outlets were counted and processed for further mechanical studies.
4.2.3 Cell Viability Assay
The viability of HPC-7s before and after undergoing separation was assessed via the trypan
blue exclusion assay and the number of cells that excluded the dye counted.
Chapter 4 HSC Sorting with Microfluidic Systems
120
4.2.4 Mechanical Testing of Cells after Sorting Using Micromanipulation
The diameter of sorted HPC-7 cells was directly measured from the monitor screen of the
micromanipulation rig, and nominal rupture stress of sorted cells was calculated from the
force curves of micromanipulation compression, as described in detail in Section 2.4.2. The
mean values of size and nominal rupture stress, as well as their coefficient of variation were
calculated to represent the separation efficiency.
4.2.5 Surgical Preparation to Induce Intestinal IR Injury in Mice
Briefly, intravital procedures were performed on healthy male C57BL/6 wild type mice that
had been intestinal IR injured by atraumatic clamping of the superior mesenteric artery for
45 minutes followed by removal of the clamp to induce reperfusion.
4.2.6 Intravital Imaging of the Mucosal Surface of the IR Injured Small Intestine
To image the trafficking of HPC-7s in vivo within the small intestinal mucosal villous
mirocirculation, a fluorescent intravital microscopy study was performed. The animal was
anaesthetised and intestinal IR injury was induced. Microfluidic Device C was used to
conduct cell isolation with a flow rate of 10 mL/h and a cell density of 2 × 10⁶ /mL. HPC-7s
isolated from the inner (lower nominal rupture stress likely to correspond to deformable
cells) and outer outlets (higher nominal rupture stress therefore more rigid cells) were
harvested for intravital experiments. The isolated cells were washed with PBS, and then
labelled using the fluorescent dye CFDA-SE to enable them to be tracked in vivo, followed by
incubation at 37 C for 10 minutes. 2 × 10⁶ labelled cells were centrifuged and resuspended
in 200L warm StemPro media (37°C water bath) before infusion into mice as a bolus dose.
Isolated HPC-7 cells were injected after 30 min reperfusion. A single pre-selected field of
view was identified microscopically using a x10 objective and videos were taken every 5 min
for 1 hour. At each time point the numbers of freely flowing and adherent HPC-7s were
Chapter 4 HSC Sorting with Microfluidic Systems
121
quantitated. At the end of the experiment, the number of adherent HPC-7s present within
the lungs was also quantified. A total of 5 mice were used for each group i.e. 5 mice imaged
for the trafficking of the more deformable HPC-7s harvested from the inner outlet of Device
C and 5 mice receiving the more rigid HPC-7s isolated from the outer outlet.
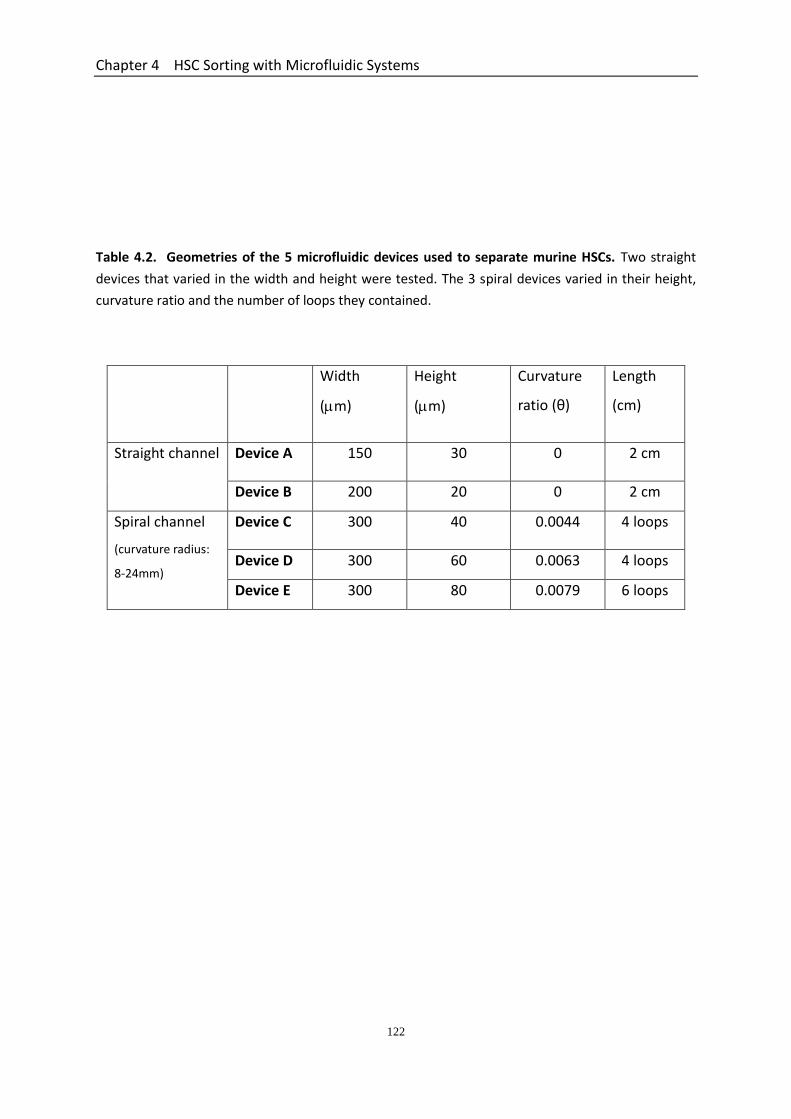
Chapter 4 HSC Sorting with Microfluidic Systems
122
Table 4.2. Geometries of the 5 microfluidic devices used to separate murine HSCs. Two straight
devices that varied in the width and height were tested. The 3 spiral devices varied in their height,
curvature ratio and the number of loops they contained.
Width
(m)
Height
(m)
Curvature
ratio (θ)
Length
(cm)
Straight channel Device A 150 30 0 2 cm
Device B 200 20 0 2 cm
Spiral channel
(curvature radius:
8-24mm)
Device C 300 40 0.0044 4 loops
Device D 300 60 0.0063 4 loops
Device E 300 80 0.0079 6 loops

Chapter 4 HSC Sorting with Microfluidic Systems
123
4.3 Results
4.3.1 Geometry Characterization of Microfluidic Devices
A cell suspension was injected into a single inlet in the microfluidic device being tested for
sorting purposes and potentially different subsets were harvested from either three
(straight device) or two (spiral device) outlets into a collecting tubing attached to the outlets.
Channel blockage is a serious problem that can affect the separation performance and must
be avoided throughout the experiments. This could be bought about by the formation of cell
aggregations becoming stuck within the various micro-channels. Therefore, the channels
were constantly monitored with the help of an EVOS optical microscope. If any blockage
was observed, the sorting system was stopped and the experiment repeated. Fortunately,
this was not a frequent occurrence. The optical images in Figure 4.1, taken using the EVOS
microscope, illustrate the downstream microchannel sections of each type of microfluidic
device. The three outlets of the straight microfluidic device were equally spaced (Figure
4.1a). The spiral microfluidic design had an initial radius of curvature of 8mm and consisted
of 4 or 6 loops, with the length of the two outlets being the same (Figure 4.1b).
4.3.2 Effect of Culture Condition on the Mechanical Strength of HPC-7s
The heterogeneity in the mechanical strength of cells due to the culture environment, cell
metabolism and proliferation stage, thus affecting the consistency and reproducibility of
subsequent separation experiments, was first investigated. Though there are many known
and unknown factors that can influence cells mechanics, the culture procedure is at least a
relatively controllable parameter that can be considered precisely. HPC-7s were cultured
with the standard procedure for 5 days (described in Section 2.2.2), which involved adding
fresh media daily but completely removing old media and replacing every other day (i.e. day
2 and 4). On days 6, 7 and 8, the old culture medium was not removed and cell density was
adjusted only through adding fresh medium daily.
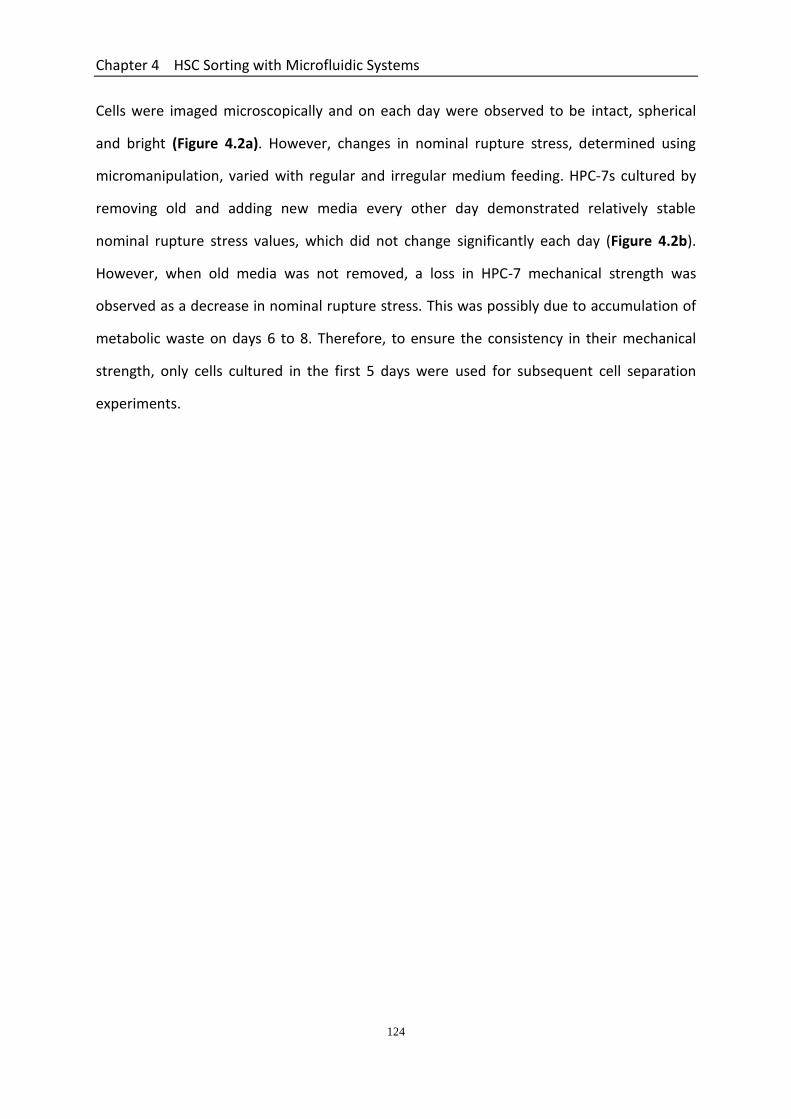
Chapter 4 HSC Sorting with Microfluidic Systems
124
Cells were imaged microscopically and on each day were observed to be intact, spherical
and bright (Figure 4.2a). However, changes in nominal rupture stress, determined using
micromanipulation, varied with regular and irregular medium feeding. HPC-7s cultured by
removing old and adding new media every other day demonstrated relatively stable
nominal rupture stress values, which did not change significantly each day (Figure 4.2b).
However, when old media was not removed, a loss in HPC-7 mechanical strength was
observed as a decrease in nominal rupture stress. This was possibly due to accumulation of
metabolic waste on days 6 to 8. Therefore, to ensure the consistency in their mechanical
strength, only cells cultured in the first 5 days were used for subsequent cell separation
experiments.

Chapter 4 HSC Sorting with Microfluidic Systems
125
Figure 4.1. Optical brightfield images illustrating the outlet section of the (a) straight and (b) spiral
microchannel. The three outlets of the straight trifurcated microchannel were equally spaced and
the spiral bifurcated design had an initial radius of curvature of 8 mm and consisted of 4 or 6 loops,
with the length of two outlets being the same. Images were aquired using an EVOS microscope with
a x 4 objective.
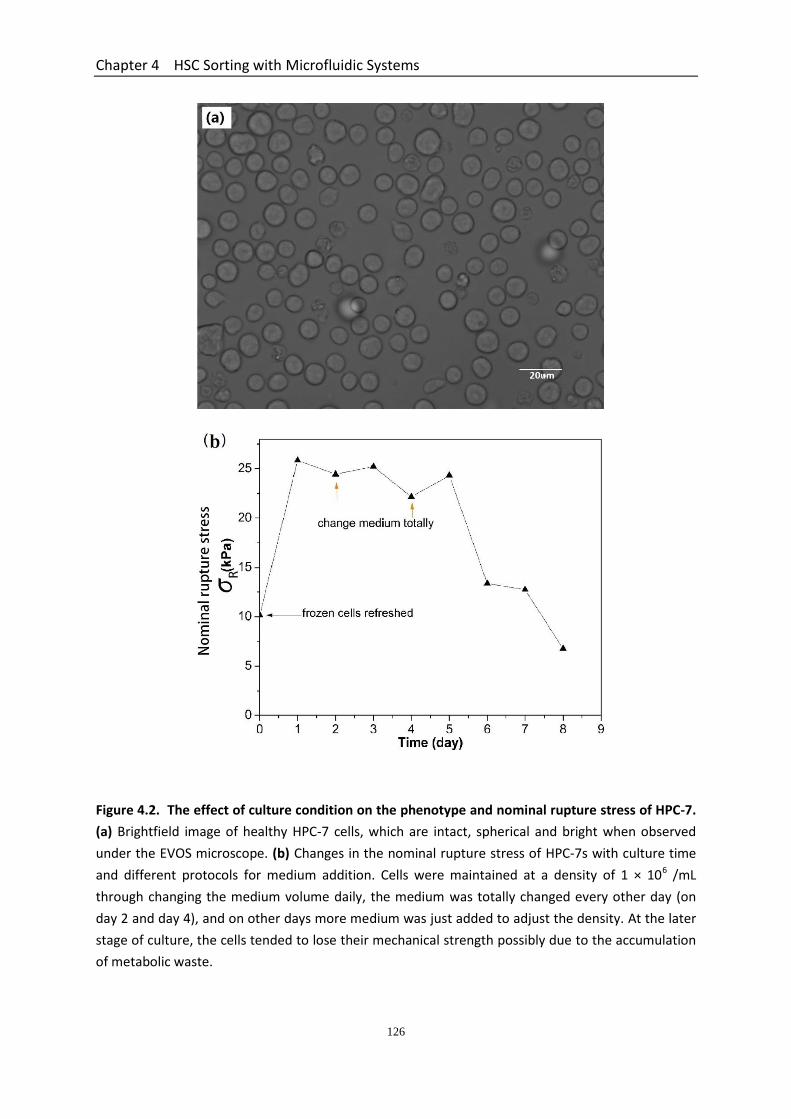
Chapter 4 HSC Sorting with Microfluidic Systems
126
Figure 4.2. The effect of culture condition on the phenotype and nominal rupture stress of HPC-7.
(a) Brightfield image of healthy HPC-7 cells, which are intact, spherical and bright when observed
under the EVOS microscope. (b) Changes in the nominal rupture stress of HPC-7s with culture time
and different protocols for medium addition. Cells were maintained at a density of 1 × 10⁶ /mL
through changing the medium volume daily, the medium was totally changed every other day (on
day 2 and day 4), and on other days more medium was just added to adjust the density. At the later
stage of culture, the cells tended to lose their mechanical strength possibly due to the accumulation
of metabolic waste.
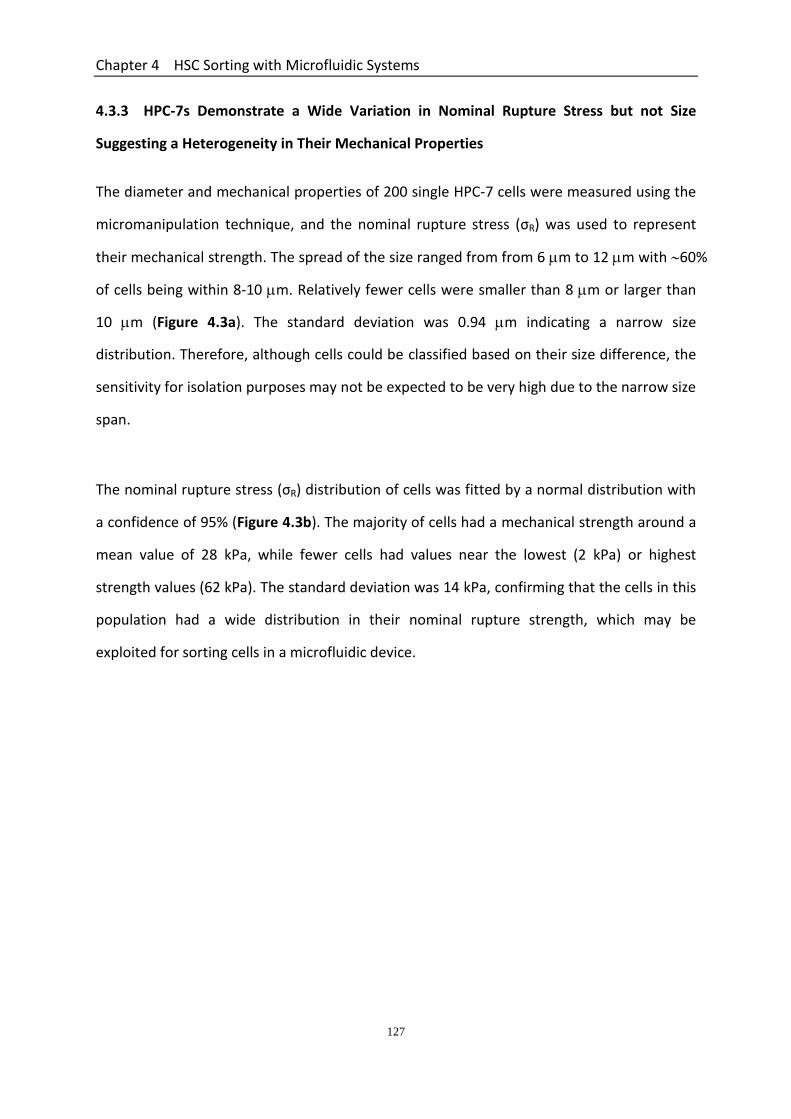
Chapter 4 HSC Sorting with Microfluidic Systems
127
4.3.3 HPC-7s Demonstrate a Wide Variation in Nominal Rupture Stress but not Size
Suggesting a Heterogeneity in Their Mechanical Properties
The diameter and mechanical properties of 200 single HPC-7 cells were measured using the
micromanipulation technique, and the nominal rupture stress (σR) was used to represent
their mechanical strength. The spread of the size ranged from from 6 m to 12 m with 60%
of cells being within 8-10 m. Relatively fewer cells were smaller than 8 m or larger than
10 m (Figure 4.3a). The standard deviation was 0.94 m indicating a narrow size
distribution. Therefore, although cells could be classified based on their size difference, the
sensitivity for isolation purposes may not be expected to be very high due to the narrow size
span.
The nominal rupture stress (σR) distribution of cells was fitted by a normal distribution with
a confidence of 95% (Figure 4.3b). The majority of cells had a mechanical strength around a
mean value of 28 kPa, while fewer cells had values near the lowest (2 kPa) or highest
strength values (62 kPa). The standard deviation was 14 kPa, confirming that the cells in this
population had a wide distribution in their nominal rupture strength, which may be
exploited for sorting cells in a microfluidic device.
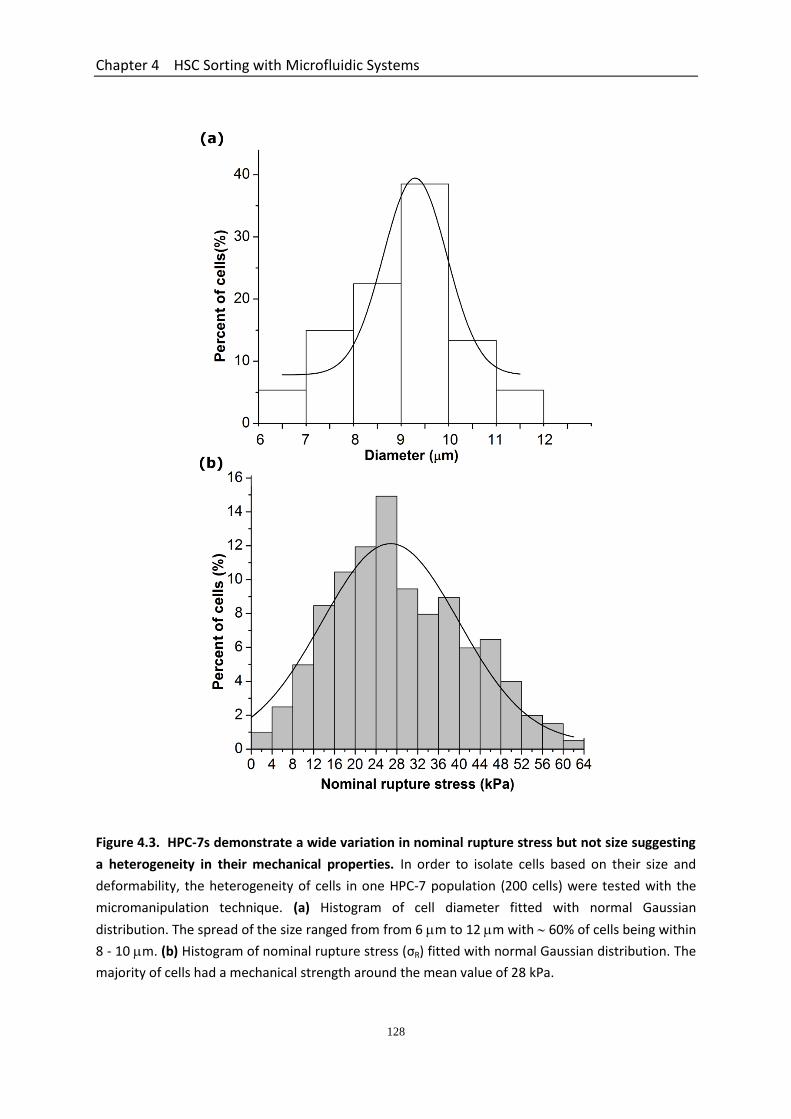
Chapter 4 HSC Sorting with Microfluidic Systems
128
Figure 4.3. HPC-7s demonstrate a wide variation in nominal rupture stress but not size suggesting
a heterogeneity in their mechanical properties. In order to isolate cells based on their size and
deformability, the heterogeneity of cells in one HPC-7 population (200 cells) were tested with the
micromanipulation technique. (a) Histogram of cell diameter fitted with normal Gaussian
distribution. The spread of the size ranged from from 6 m to 12 m with 60% of cells being within
8 - 10 m. (b) Histogram of nominal rupture stress (σR) fitted with normal Gaussian distribution. The
majority of cells had a mechanical strength around the mean value of 28 kPa.

Chapter 4 HSC Sorting with Microfluidic Systems
129
4.3.4 Performance of the Two Straight Microchannel Devices
4.3.4.1 Separation Efficiency Using the Straight Microchannel Device A with AR = 5
The dimensional parameters of the straight trifurcated Device A have been described
previously in Table 4.2. A cell suspension was injected into the channel at different flow
rates, namely 0.5 mL/h, 2 mL/h, 5 mL/h and 10 mL/h. This was associated with an increase
in Reynolds number (Re) from 3.4, 13.4, 33.6 to 67.1 respectively. Sub-populations
harvested from the three outlets were counted and mechanically tested by
micromanipulation. Since the channel is symmetrical about the centre in the axial direction,
cells collected from the two side outlets should obtain similar properties. Therefore cells
were categorized into two populations, i.e. those from the two side outlets and those from
centre outlet.
Generally, as flow rate was increased, the cells migrated from the centre channel to being
collected from the outer side outlets (Figure 4.4a). Hence the percentage cell number
harvested from the centre outlet decreased with the increasing Re. Accordingly, the number
of cells from the side channels followed an opposite tendency. When the flow rate was low
(0.5 mL/h; Re = 3.4), the majority of cells focused near the channel centre and only 5% of
the cells migrated near the outer side walls. This indicates that cells were barely separated
at this flow rate. At intermediate flow rates, 2 mL/h and 5 mL/h, better separation was
observed. When the flow rate was hightest, ~ 80% of the cells reached the side outlets,
again indicating poor separtaion. Since effective cell separation with a high throughput was
required, the lowest flow rate was no longer used in the following experiments.
The separated cells were then evaluated by micromanipulation, which demonstrated there
was no significant difference in the nominal rupture stress between the two populations
collected from the centre and side outlets (p > 0.05; Figure 4.4b). Similarly, the diameter of
the cells collected from centre and outer side outlets did not show significant difference

Chapter 4 HSC Sorting with Microfluidic Systems
130
either (p > 0.05; Figure 4.4c). Collectively, these results suggest that this device was not
effective for sorting cells by considering the big mechanical difference between sub-
populations required for application use.
4.3.4.2 Separation Efficiency Using the Straight Microchannel Device B with AR =10
To achieve better separations, another straight trifurcated microchannel with a modified
geometry was fabricated. The dimensional parameters of the modified straight trifurcated
Device B have been described previously in Table 4.2. Device B was wider and less tall than
Device A (AR = 5) and thus had an aspect ratio (AR: width/height) of 10. A cell suspension
was injected into the channel at different flow rates, namely 0.5 mL/h, 2 mL/h, 5 mL/h and
10 mL/h. This was associated with an increase in Re from 5.1, 20.2, 50.6 to 101.2
respectively. Generally, in this device, as flow rate was increased, the cell number
distributions shifted in the opposite direction compared with the performance of Device A
i.e. the cells migrated to the centre channel with the increase of flow rate up to 10mL/h (Re
= 101.2) (Figure 4.5a). Unlike Device A, the separated cell populations significantly differed
in their nominal rupture stress, particularly at 10 mL/h (Figure 4.5b). At this flow rate, the
cells from the outer side outlets were significantly (p < 0.05) less stiff or more deformable
(lower nominal rupture stress) than those collected from the centre outlet (higher nominal
rupture stress). Although good separation based on the cell stiffness was observed at 5
mL/h, it was not dramatic. The diameter of cells from centre and side outlets did not show
significant difference even at the high flow rate (Figure 4.5c).
The percentage of cells collected from the side and centre outlets at a flow rate of 10 mL/h
was further plotted against a distribution range for nominal rupture stress. HPC-7s collected
from the side outlets had a narrower distribution (coefficient of variation = 0.31) than cells
collected from the centre outlet (coefficient of variation = 0.46), suggesting side outlets
collected mostly deformable cells. However, HPC-7s collected in the centre outlet covered a

Chapter 4 HSC Sorting with Microfluidic Systems
131
wider spread of nominal rupture stresses with both deformable and more stiff cells being
collected. Overall, it can be concluded that the straight microchannel Device B is relatively
more effective than the straight microchannel Device A in terms of the observed difference
in nominal rupture stress between the cells from the centre and side outlets.
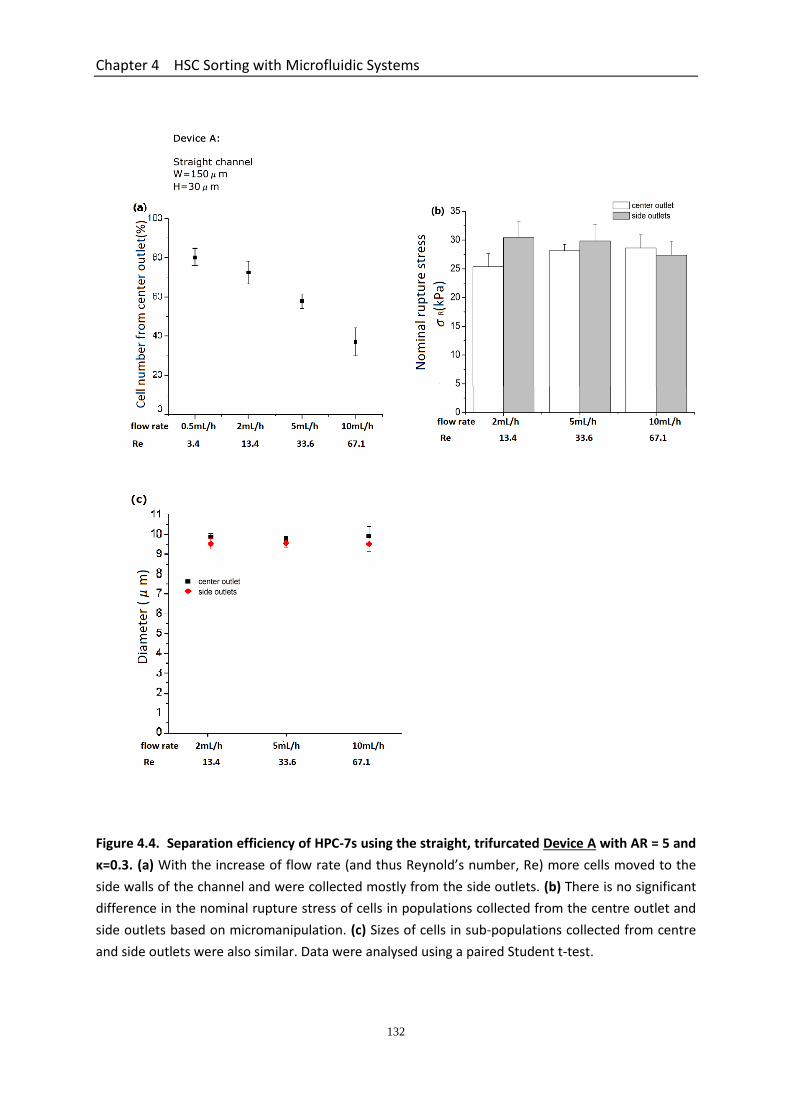
Chapter 4 HSC Sorting with Microfluidic Systems
132
Figure 4.4. Separation efficiency of HPC-7s using the straight, trifurcated Device A with AR = 5 and
κ=0.3. (a) With the increase of flow rate (and thus Reynold’s number, Re) more cells moved to the
side walls of the channel and were collected mostly from the side outlets. (b) There is no significant
difference in the nominal rupture stress of cells in populations collected from the centre outlet and
side outlets based on micromanipulation. (c) Sizes of cells in sub-populations collected from centre
and side outlets were also similar. Data were analysed using a paired Student t-test.
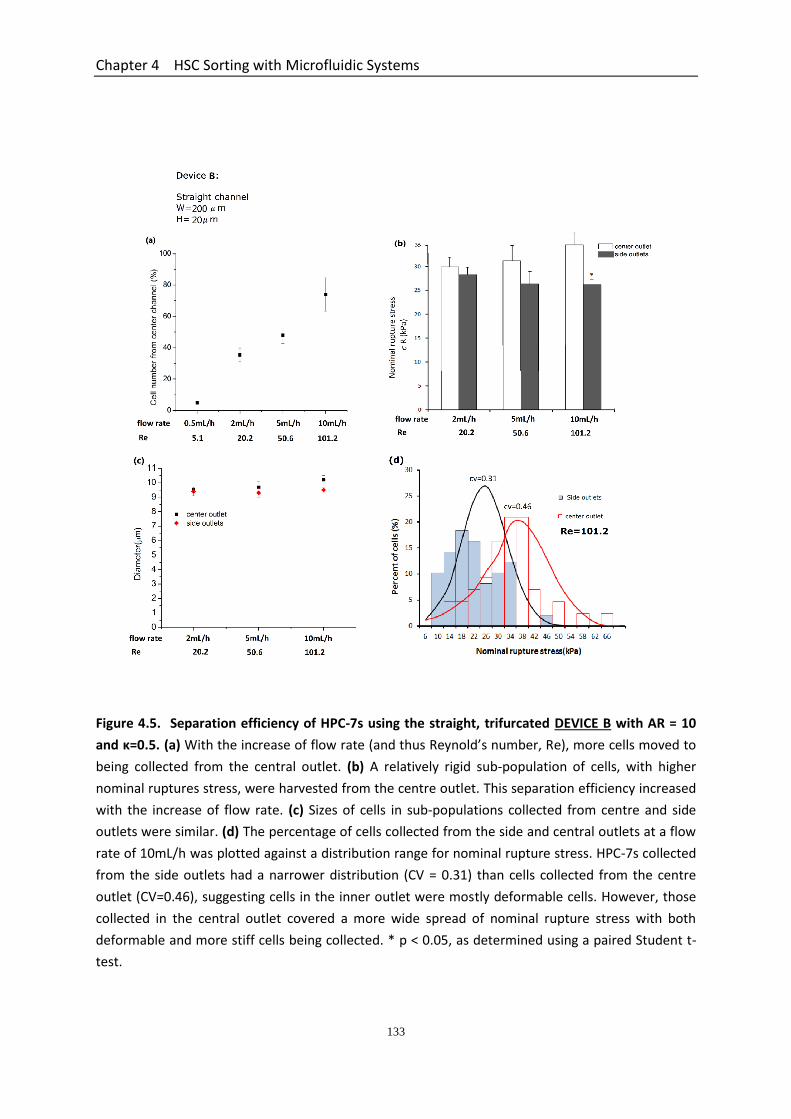
Chapter 4 HSC Sorting with Microfluidic Systems
133
Figure 4.5. Separation efficiency of HPC-7s using the straight, trifurcated DEVICE B with AR = 10
and κ=0.5. (a) With the increase of flow rate (and thus Reynold’s number, Re), more cells moved to
being collected from the central outlet. (b) A relatively rigid sub-population of cells, with higher
nominal ruptures stress, were harvested from the centre outlet. This separation efficiency increased
with the increase of flow rate. (c) Sizes of cells in sub-populations collected from centre and side
outlets were similar. (d) The percentage of cells collected from the side and central outlets at a flow
rate of 10mL/h was plotted against a distribution range for nominal rupture stress. HPC-7s collected
from the side outlets had a narrower distribution (CV = 0.31) than cells collected from the centre
outlet (CV=0.46), suggesting cells in the inner outlet were mostly deformable cells. However, those
collected in the central outlet covered a more wide spread of nominal rupture stress with both
deformable and more stiff cells being collected. * p < 0.05, as determined using a paired Student t-
test.
Chapter 4 HSC Sorting with Microfluidic Systems
134
4.3.5 Performance of The Three Spiral Microchannel Devices
4.3.5.1 Determination of Velocity Limit and Cell Number Distribution for Spiral Devices
The effects of the channel Re, the curvature ratio, θ (corresponding Dean number, De = R
θ1/2), and the cell blockage ratio,κon the cell separation efficiency were investigated. Re
was controlled by changing the flow rate. The flow rate limits in the three bifurcated spiral
microchannels were determined by visualizing cell motions near the downstream region of
the channel. Qualitatively, it was observed from the EVOS microscope that changing the
flow rates focused the cells to different lateral positions in the channel. At lower flow rates
(0.5 mL/h; Re = 1.8), most cells moved closer to the outer wall of the channel and were
collected from the outer outlet. However, at the higest flow rate (15 mL/h; Re = 55), the
majority of cells shifted to the opposite direction and were harvested from the inner outlet
(Figure 4.6a). This suggests that when the Re was smaller than 1.8 or bigger than 55, there
was a loss of separation. Thus intermediate flow rates (2.5 mL/h, 5 mL/h, 7.5 mL/h and 10
mL/h), corresponding to Re between 8 - 35, were chosen for further experiments.
For all three bifurcated spiral devices tested, namely Devices C, D and E, as the flow rate and
thus Re increased, the percentage of HPC-7s collected from the inner outlet also increased.
Correspondingly, the percentage cell number collected from the outer outlet decreased
(Figure 4.6b). Considering that a high throughput device is required and that cell
sedimentation within the syringe needs to be reduced, 2.5 mL/h was no longer used. It can
also be seen that for Device D and E, when the flow rate was 10 mL/h, more than 80% of
cells migrated near the inner side wall, resulting in a lower separation. Therefore, in these
two devices, flow rates of 5 mL/h and 7.5 mL/h were used for cell separation, and the
isolated cells were mechanically tested.

Chapter 4 HSC Sorting with Microfluidic Systems
135
4.3.5.2 Separation Efficiency Using the Spiral Microchannel Device C with AR=7.5 and
Curvature Ratio θ=0.0044
For successful isolation of stem cells in curved channels, the ideal performance is for cells of
different mechanical properties to focus in the channel as far as possible from each other.
This will increase the separation efficiency, as well as allow us to infuse a sufficient number
of the cells of a specific nominal rupture stress into mice when conducting intravital studies
to image their trafficking in vivo. Hence, the mean values of nominal rupture stress, as well
as their coefficient of variation (CV), were used to compare the separation efficiency of
three different microfluidic systems at varying Re.
The dimensional parameters of the spiral bifurcated Device C have been described
previously in Table 4.2. A cell suspension was injected into the channel at different flow
rates, namely 5 mL/h, 7.5 mL/h and 10 mL/h. This was associated with an increase in Re
from 17.8, 26.7 to 35.6 respectively. In this device, the separated cell populations
significantly differed in their mechanical strength or nominal rupture stress, particularly at
the higher flow rates (Figure 4.7a). At 7.5 mL/h and 10 mL/h, the cells from the inner outlet
were significantly (p < 0.05) less stiff or more deformable (lower nominal rupture stress)
than those collected from the outer outlet (higher nominal rupture stress). Interestingly, at
these flow rates, cells collected in the inner outlet were not only weaker/more deformable
but also significantly (p < 0.05) smaller (Figure 4.7b). Nominal rupture stress distribution of
cells for these two flow rates indicated that the mechanical strength of single cells from the
inner outlet was more dispersed at 7.5mL/h (Re = 26.7; CV = 0.35; Figure 4.7c) than with
10mL/h (Re = 35.6; CV = 0.26; Figure 4.7d). This indicates that this device achieved more
effective separation at 10mL/h (Re = 35.6). Cell throughput at this flow rate was 2.3×10⁵
cells/min. Thus, this flow rate can be desirable for cell separation in the system of Device C.
Chapter 4 HSC Sorting with Microfluidic Systems
136
4.3.5.3 Separation Efficiency Using the Spiral Microchannel Device D with AR=5 and
Curvature Ratio θ=0.0063
The dimensional parameters of the spiral bifurcated Device D have been described
previously in Table 4.2. A cell suspension was injected into the channel at either 5mL/h or
7.5mL/h. This was associated with an increase in Re from 16.8 to 25.2 respectively. In this
device, the separated cell populations significantly differed in their nominal rupture stress at
both flow rates (Figure 4.8a). At both 5 mL/h and 7.5 mL/h, the cells from the inner outlet
were significantly (p < 0.05) less stiff or more deformable (lower nominal rupture stress)
than those collected from the outer outlet (higher nominal rupture stress). Interestingly,
only at 7.5 mL/h, were cells collected in the inner outlet significantly (p < 0.05) smaller
(Figure 4.8b). Nominal rupture stress distribution of cells for these two flow rates indicated
that the mechanical strength of single cells from the inner outlet was more dispersed at
5mL/h (Re = 16.8; CV = 0.49; Figure 4.8c) than with 7.5mL/h (Re = 25.2; CV = 0.41; Figure
4.8d). This indicates that this device achieved more effective separation at 7.5 mL/h (Re =
25.2). Cell throughput at this flow rate was 1.5 × 10⁵ cells/min. Thus, the flow rate of 7.5
mL/h can be desirable for cell separation in the system of Device D.
4.3.5.4 Separation Efficiency Using the Spiral Microchannel Device E with AR=3.75 and
Curvature Ratio θ=0.0079
The dimensional parameters of the spiral bifurcated Device E have been described
previously in Table 4.2. A cell suspension was injected into the channel at either 5mL/h or
7.5mL/h. This was associated with an increase in Re from 15.9 to 23.8 respectively. In this
device, the separated cell populations significantly differed in their mechanical strength or
nominal rupture stress at both flow rates (Figure 4.9a). At both 5 mL/h and 7.5 mL/h, the
cells from the inner outlet were significantly (p < 0.05) less stiff or more deformable (lower
nominal rupture stress) than those collected from the outer outlet (higher nominal rupture
stress). Interestingly, at both flow rates, cells collected from the inner outlet were not only

Chapter 4 HSC Sorting with Microfluidic Systems
137
weaker / more deformable but also significantly (p < 0.05) smaller (Figure 4.7b). Nominal
rupture stress distribution of cells for these two flow rates indicated that this device
achieved more effective separation at 7.5 mL/h (Re = 23.8), as shown in Figure 4.9c and
Figure 4.9d. This indicates. Cell throughput at this flow rate was 1.6×10⁵ cells/min. Thus,
the flow rate of 7.5 mL/h can be desirable for cell separation in the system of Device D.

Chapter 4 HSC Sorting with Microfluidic Systems
138
Figure 4.6. Determination of the velocity limit and cell number distribution at varying flow rate for
the 3 SPIRAL devices. Differential cell number distribution of cells in spiral channels with cross
sections 300 μm × 40 μm (Device C), 300 μm × 60 μm (Device D) and 300 μm × 80 μm (Device E). (a)
0.5 mL/h and 15 mL/h were determined as the lowest and highest flow rate for cell separation
experiments. When imaged microscopically, it was noted that at the lower limit of flow rate, all the
cells moved to the outer outlet, while the majority of cells focused to the inner outlet at the highest
limit of flow rate. (b) Intermediate flow rates were used for separation, and cells gradually shifted to
the inner outlet with the increase of flow rate.
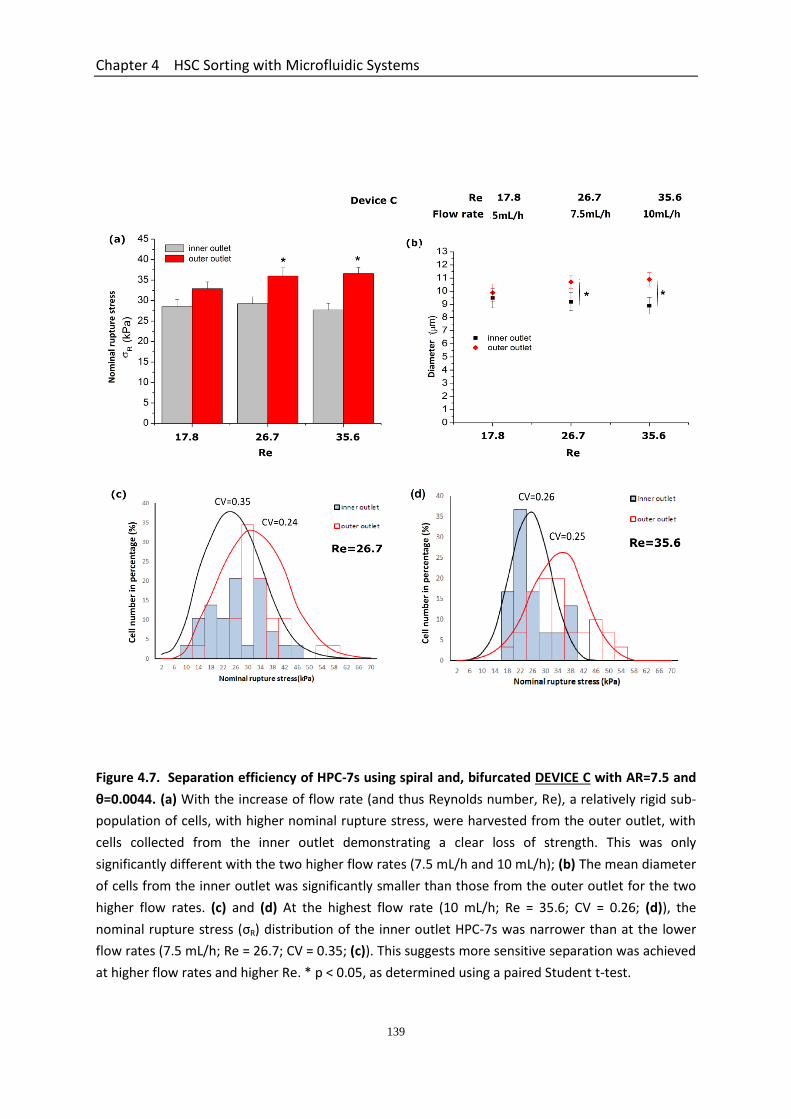
Chapter 4 HSC Sorting with Microfluidic Systems
139
Figure 4.7. Separation efficiency of HPC-7s using spiral and, bifurcated DEVICE C with AR=7.5 and
θ=0.0044. (a) With the increase of flow rate (and thus Reynolds number, Re), a relatively rigid sub-
population of cells, with higher nominal rupture stress, were harvested from the outer outlet, with
cells collected from the inner outlet demonstrating a clear loss of strength. This was only
significantly different with the two higher flow rates (7.5 mL/h and 10 mL/h); (b) The mean diameter
of cells from the inner outlet was significantly smaller than those from the outer outlet for the two
higher flow rates. (c) and (d) At the highest flow rate (10 mL/h; Re = 35.6; CV = 0.26; (d)), the
nominal rupture stress (σR) distribution of the inner outlet HPC-7s was narrower than at the lower
flow rates (7.5 mL/h; Re = 26.7; CV = 0.35; (c)). This suggests more sensitive separation was achieved
at higher flow rates and higher Re. * p < 0.05, as determined using a paired Student t-test.
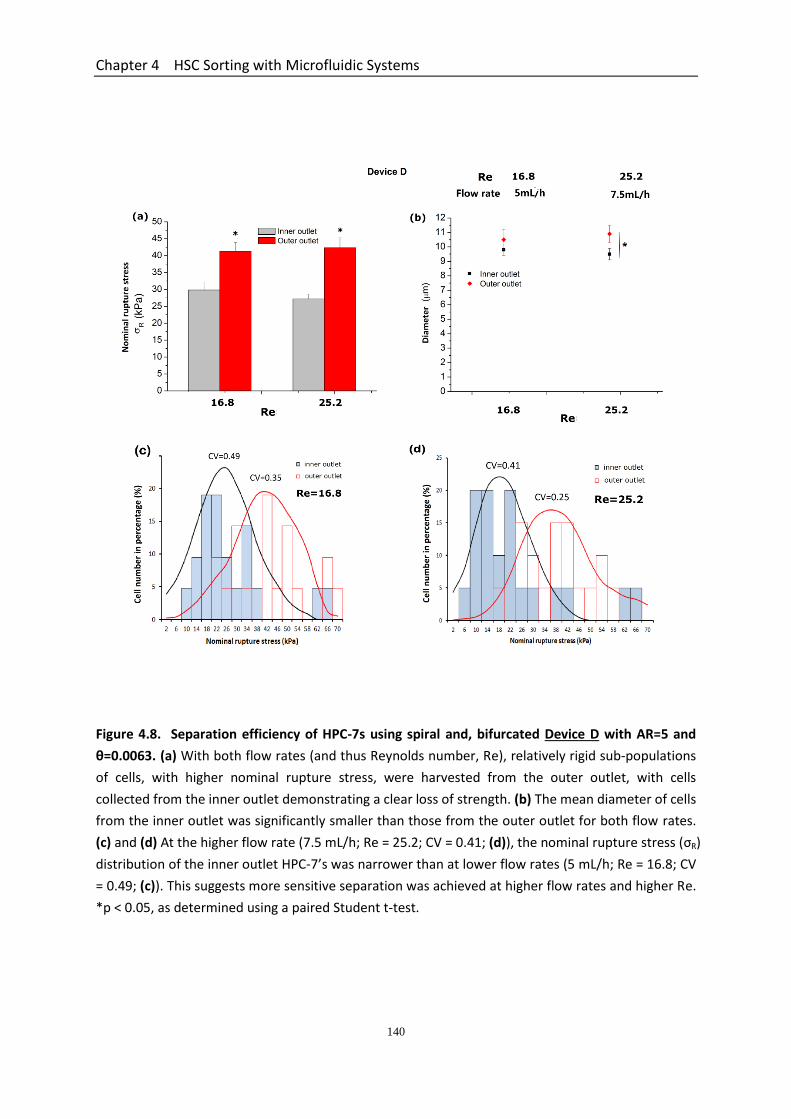
Chapter 4 HSC Sorting with Microfluidic Systems
140
Figure 4.8. Separation efficiency of HPC-7s using spiral and, bifurcated Device D with AR=5 and
θ=0.0063. (a) With both flow rates (and thus Reynolds number, Re), relatively rigid sub-populations
of cells, with higher nominal rupture stress, were harvested from the outer outlet, with cells
collected from the inner outlet demonstrating a clear loss of strength. (b) The mean diameter of cells
from the inner outlet was significantly smaller than those from the outer outlet for both flow rates.
(c) and (d) At the higher flow rate (7.5 mL/h; Re = 25.2; CV = 0.41; (d)), the nominal rupture stress (σR)
distribution of the inner outlet HPC-7’s was narrower than at lower flow rates (5 mL/h; Re = 16.8; CV
= 0.49; (c)). This suggests more sensitive separation was achieved at higher flow rates and higher Re.
*p < 0.05, as determined using a paired Student t-test.
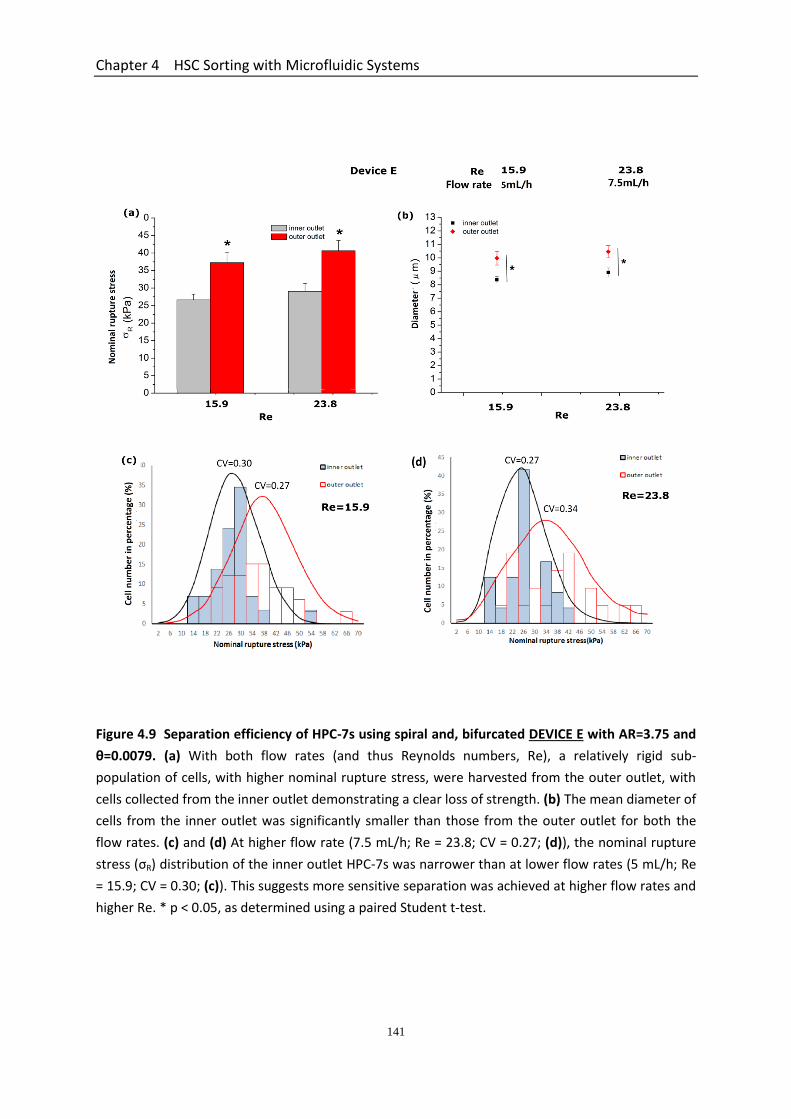
Chapter 4 HSC Sorting with Microfluidic Systems
141
Figure 4.9 Separation efficiency of HPC-7s using spiral and, bifurcated DEVICE E with AR=3.75 and
θ=0.0079. (a) With both flow rates (and thus Reynolds numbers, Re), a relatively rigid sub-
population of cells, with higher nominal rupture stress, were harvested from the outer outlet, with
cells collected from the inner outlet demonstrating a clear loss of strength. (b) The mean diameter of
cells from the inner outlet was significantly smaller than those from the outer outlet for both the
flow rates. (c) and (d) At higher flow rate (7.5 mL/h; Re = 23.8; CV = 0.27; (d)), the nominal rupture
stress (σR) distribution of the inner outlet HPC-7s was narrower than at lower flow rates (5 mL/h; Re
= 15.9; CV = 0.30; (c)). This suggests more sensitive separation was achieved at higher flow rates and
higher Re. * p < 0.05, as determined using a paired Student t-test.

Chapter 4 HSC Sorting with Microfluidic Systems
142
4.3.6 Summary of Separation Efficiency of all Devices
The performance of the 5 different microfluidic systems under optimum conditions is
summarized in Table 4.3 below. It highlights that the straight channel Device B with a higher
AR (10) achieved relatively more significant cell separation based on cell stiffness than the
straight channel Device A with a lower AR (5). A significant difference in nominal rupture
stress (σR) between the sub- populations of cells was observed at a high flow rate (10 mL/h;
Re = 101.2), although no significant difference in cell size was observed between the subsets
in this straight channel device. For spiral channels at intermediate flow rates (Device C at 7.5
mL/h & 10 mL/h; Device D at 5 mL/h & 7.5 mL/h; Device E at 5 mL/h & 7.5 mL/h) , all three
devices showed similar results of the mean values of σR and size with significantly
weaker/more deformable and smaller cells being separated from the inner outlet of the
channels.
Although it has been demonstrated that HPC-7s are indeed heterogeneous, the mean values
of σR only are not sufficient to compare their separation efficiency. Thus, the data of σR
distribution of cells were used to present the separation efficiency of different designs,
shown as values of coefficient of variation (CV). Of all the five microfluidic devices, the spiral
microchannel Device C (AR = 7.5 and θ = 0.0044) was able to focus weaker / more
deformable and smaller cells near the inner channel wall at a flow rate of 10mL/h, with a
relatively higher separation efficiency (lowest CV value of 0.26) and throughput than the
other devices. Hence this device was utilized for further intravital experiments at a flow rate
of 10 mL/h (Re = 35.6).

Chapter 4 HSC Sorting with Microfluidic Systems
143
Table 4.3. Summary of the performance of the 5 different microfluidic systems in separating cells based on the mechanical strength and size. Only data
from flow rates that demonstrated significant differences in the nominal rupture stress (σR) of the sub-populations of HPC-7 cells collected from the
different outlets are summarised above. Of all the five microfluidic devices, the spiral microchannel Device C (AR = 7.5 and θ = 0.0044) was able to focus
weaker / more deformable and smaller cells near the inner channel wall at a flow rate of 10mL/h , with relatively higher separation efficiency (lowest CV
value of 0.26) and throughput than the other devices. Hence this device was utilized for further intravital experiments at a flow rate of 10mL/h (Re = 35.6).
Abbreviations : θ = curvature ratio; Re = Reynold’s number; σR = nominal rupture stress, CV = coefficient of variation, SE = standard error of the mean.
θ Flow
rate
mL/h
Re Nominal rupture stress - σR (kPa) Size (m) Throughput of
weaker cells Weaker cells Stronger cells Small cells Large cells
Mean ± SE CV Mean ± SE CV Mean ± SE Mean ± SE
Device A 0 - - - - - - - No significant difference
between subsets
Device B 0 10.0 101.2 26.4 ± 1.9 0.31 34.9 ± 3.7 0.46 9.7±0.4 10.5±0.3 1.9×10⁵ cells/min
Device C 0.0044 7.5 26.7 26.9 ±2.1 0.35 35.6 ±2.0 0.24 9.4±0.3 10.6 ±0.5 1.2×10⁵/min
10.0 35.6 23.7 ±1.5 0.26 37.1 ±2.2 0.25 9.1 ±0.5 10.5 ±0.4 2.3×10⁵/min
Device D 0.0063 5.0 16.8 29.1 ±3.2 0.49 40.4 ±3.2 0.35 9.9 ±0.3 10.4 ±0.5 0.7×10⁵/min
7.5 25.2 26.0 ±2.5 0.41 39.8 ±2.2 0.25 9.2 ±0.3 10.8 ±0.5 1.5×10⁵/min
Device E 0.0079 5.0 15.9 26.3 ±1.8 0.30 37.0 ±2.3 0.27 8.4 ±0.2 10.1 ±0.4 1.0×10⁵/min
7.5 23.8 27.7 ±1.8 0.27 39.6 ±3.1 0.34 9.0 ±0.3 10.5 ±0.4 1.6×10⁵/min

Chapter 4 HSC Sorting with Microfluidic Systems
144
4.3.7 Relationship Between Size and Nominal Rupture Stress (σR) for Cell Populations
before and after Separation Using Device C
The mechanical properties of HPC-7 cells, isolated using the various devices, suggest
that weaker sub-populations also possess the smaller size with stronger sub-populations
being larger. In order to reveal the underlying mechanisms by which cells were isolated
based on their variation in size and deformability, the relationship between cell size and
their mechanical strength (σR) before and after separation was correlated and analyzed.
A typical trend for σR versus diameter, generated from mechanical testing of 100 single
cells before separation, was generated (Figure 4.10a). As can be seen from the
correlation coefficient (R2 = 0.19), σR is weakly and negatively correlated with the cell
diameter.
To discriminate between cells harvested from the inner (I) and outer (O) outlets of sprial
Device C, size and σR of 50 single cells from each sub-population were plotted (Figure
4.10b). Generally, 4 separate areas could be identified (named I1, I2, O1, O2). Cells
harvested from the outer outlet were located mostly at the top and right of this panel
with cells harvetsed from the inner panel located mostly at the bottom and left. Cells
with significant size difference (i.e. those in the left-most and right-most of the size
distribution), migrated in opposite directions with smaller cells focusing to the inner
channel walls (I1) and larger cells in the outer channel walls (O1) regardless of their
deformability. In this case, the size may play a dominant role in cell migration. However,
the majority of the cells were of similar sizes i.e. between 8-10 m, and were separated
primarily based on their mechanical strength variation. This was responsible for the
smaller σR value for cells collected in the inner channel (I2) compared to the higher σR
value for cells collected in the outer channel (O2).
Chapter 4 HSC Sorting with Microfluidic Systems
145
4.3.8 Viability of Cells
The most deformable cell sub-population will be used for subsequent in vivo studies.
However, it should be confirmed that cells isolated using Device C were still viable post-
collection. To verify the viability of HPC-7s after they passed through the microfluidic
system, cells that were collected from the channel outlets were dyed with Trypan blue.
The number of cells that excluded the dye was counted. No significant difference was
seen in the number of viable cells passing through Device C when compared to those
which did not undergo separation (Figure 4.11a). Separated cells can therefore be used
for further studies and expansion studies. Additionally, the isolated cells still maintained
their mechanical strength as those before isolation (Figure 4.11b).
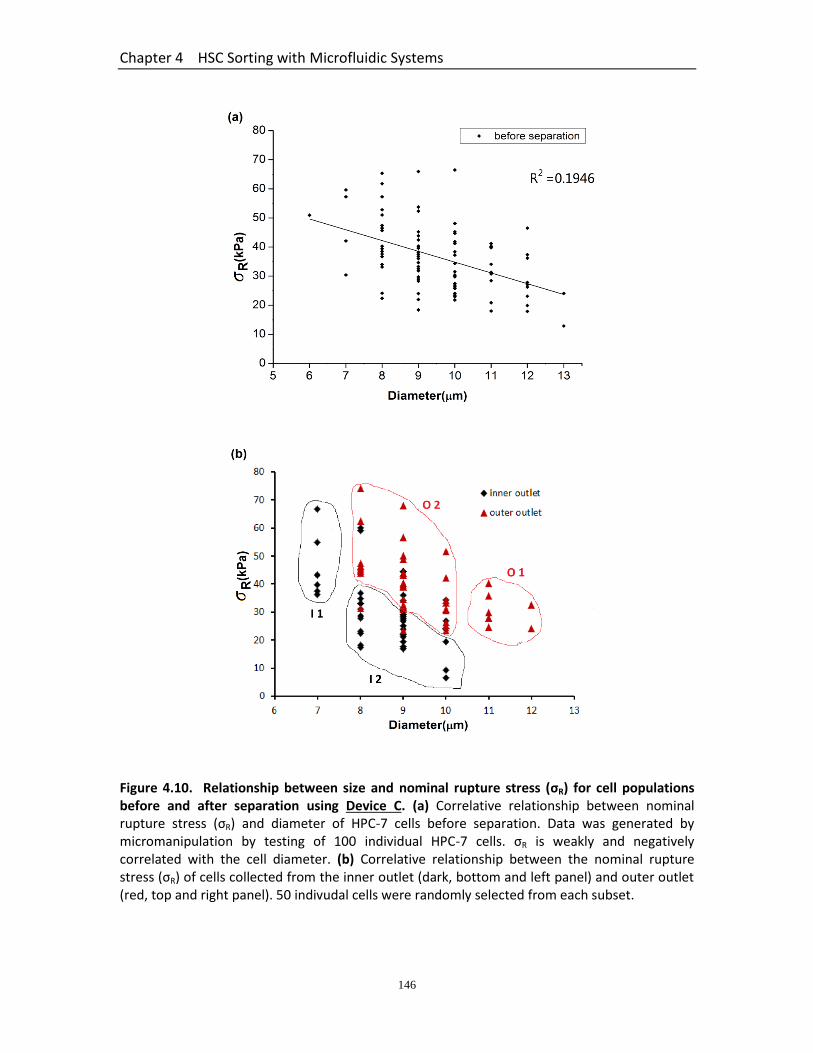
Chapter 4 HSC Sorting with Microfluidic Systems
146
Figure 4.10. Relationship between size and nominal rupture stress (σR) for cell populations before and after separation using Device C. (a) Correlative relationship between nominal rupture stress (σR) and diameter of HPC-7 cells before separation. Data was generated by micromanipulation by testing of 100 individual HPC-7 cells. σR is weakly and negatively correlated with the cell diameter. (b) Correlative relationship between the nominal rupture stress (σR) of cells collected from the inner outlet (dark, bottom and left panel) and outer outlet (red, top and right panel). 50 indivudal cells were randomly selected from each subset.
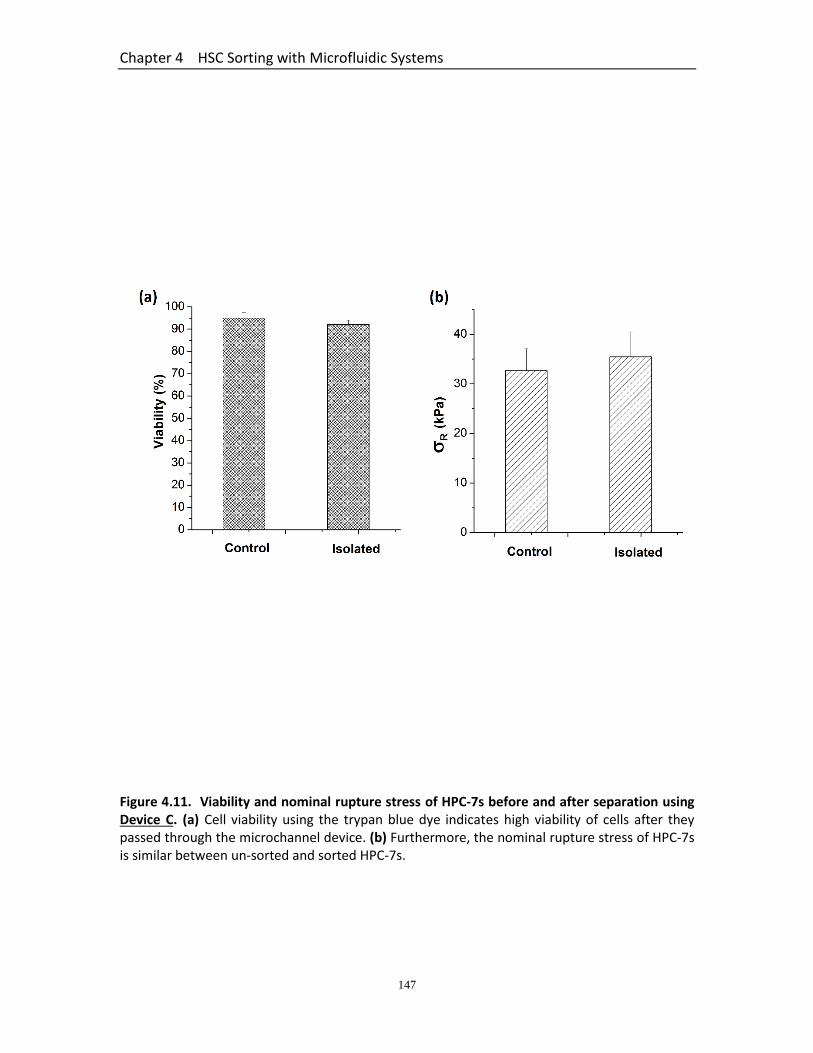
Chapter 4 HSC Sorting with Microfluidic Systems
147
Figure 4.11. Viability and nominal rupture stress of HPC-7s before and after separation using Device C. (a) Cell viability using the trypan blue dye indicates high viability of cells after they passed through the microchannel device. (b) Furthermore, the nominal rupture stress of HPC-7s is similar between un-sorted and sorted HPC-7s.

Chapter 4 HSC Sorting with Microfluidic Systems
148
4.3.9 Intravital Micorscopy to Assess the Trafficking of HPC-7 Isolated Using Device C
4.3.9.1 More Free Flowing HPC-7s Harvested from the Inner Outlet Observed than
from the Outer Outlet
HPC-7s were infused as a single dose at 30 minutes post-reperfusion. The numbers of
freely flowing Device C separated inner outlet / deformable cells and outer outlet / rigid
cells were highest at this point but for both cell types the numbers rapidly decreased at
later observation times after administration (Figure 4.12a). However, immediately upon
infusion, significantly (p < 0.001) more free flowing cells from the inner outlet cell
population were observed passing through the mucosal microcirculation than from the
outer outlet cell population. Indeed, the number of freely circulating cells from the inner
outlet cell population counted at 30 minutes was almost double the number of freely
circulating cells from the outer outlet cell population (Figure 4.13 a - b). This number is
most likely an underestimation of actual trafficking cells as many had a velocity too high
to allow them to be counted. This difference decreased with time until there was no
significant difference between the cells from the two outlets at the end of the
observation period. However, at all time points, HPC-7s could still be observed
trafficking through the mucosal microcirculation, thus demonstrating that there were
always cells able to continually re-circulate through the injured gut.
4.3.9.2 Adhesion of HPC-7s Harvested from the Inner and Outer Outlets was not
Different
The numbers of firmly adhesion HPC-7 cells were also counted in the same field of view
every 5 minutes. There was a general trend to observe more HPC-7s (that had been
harvested from inner outlet of Device C and were more deformable) adherent within
the mucosal microcirculation, particularly within 24 - 65 minutes post-reperfusion
(Figures 4.12b and 4.13c-d). However, this did not attain statistical significance when
compared to outer outlet/more rigid cells.
Chapter 4 HSC Sorting with Microfluidic Systems
149
4.3.9.3 Presence of HPC-7s Harvested from the Inner and Outer Outlets was not
Different in the Lungs
After the endof the intravital experiment, the lungs were removed and four fields of
view were randomly selected and imaged for HPC-7 presence. The mean numbers of
HPC-7s present in the lungs were 44.5 ± 2.9 and 47.8 ± 3.1 for the cells from inner and
outer outlet groups respectively separated by Device C, which were not significantly
different (Figure 4.14). It should be noted that since this quantification was conducted
on static tissue from culled mice, it was not possible to state whether the counted cells
were actively adherent, trapped or trafficking through at the time of tissue imaging.
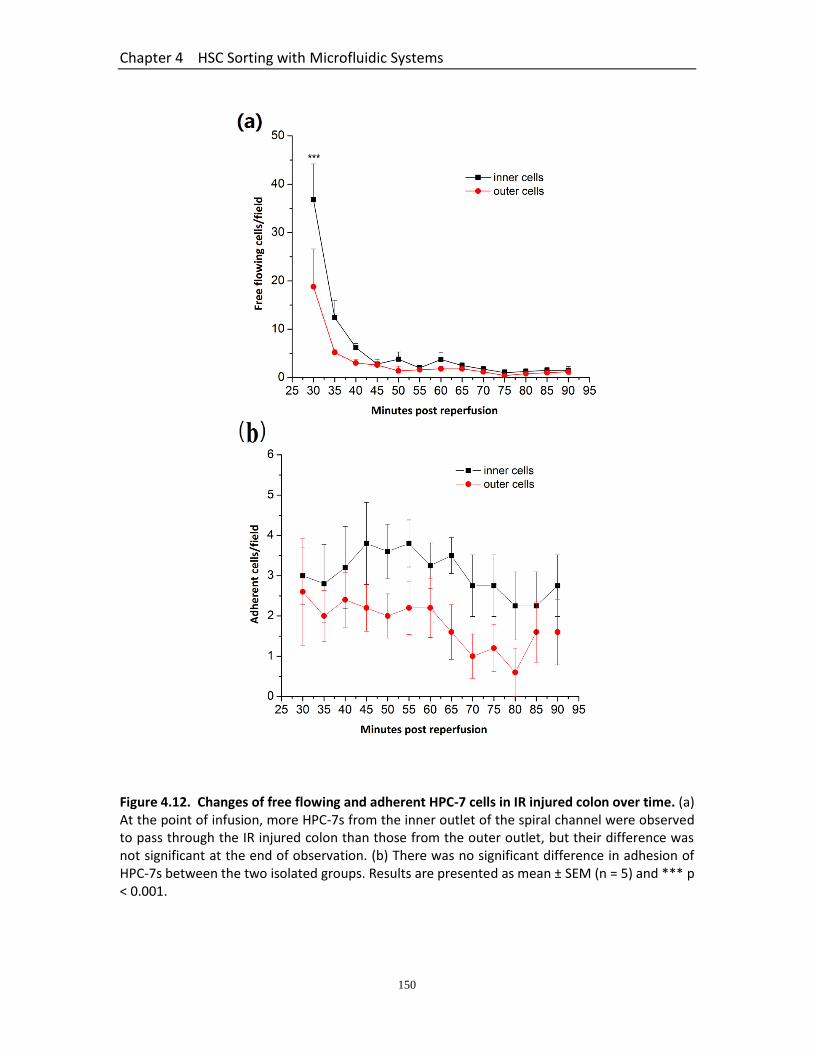
Chapter 4 HSC Sorting with Microfluidic Systems
150
Figure 4.12. Changes of free flowing and adherent HPC-7 cells in IR injured colon over time. (a) At the point of infusion, more HPC-7s from the inner outlet of the spiral channel were observed to pass through the IR injured colon than those from the outer outlet, but their difference was not significant at the end of observation. (b) There was no significant difference in adhesion of HPC-7s between the two isolated groups. Results are presented as mean ± SEM (n = 5) and *** p ˂ 0.001.

Chapter 4 HSC Sorting with Microfluidic Systems
151
Figure 4.13. Intravital microscopy images of fluorescent CFSE-labelled HPC-7 cells either freely circulating or adherent within IR injured murine small intestinal mucosal villi. Numbers of (a-b) freely flowing HPC-7s harvested from the inner outlet of Device C trafficking through the mucosal microcirculation was significantly (p < 0.001) higher than the numbers of (c) freely flowing cells from outer outlet. The velocity of some circulating HPC-7s was very high and thus resulted in them appearing as streaks in the gut mucosal microcirculation (arrowheads). It appears in theses static images as if there are similar numbers of free flowing cells from the inner and outer outlet sources. However, over a continuous recording period of 1 minute more circulating cells would have been quantitated in dynamic videos. The numbers actually quantitated is most likely an underestimation due to the velcocity of many trafficking cells being too high to enable individual cells to be counted. Numbers of (d) adherent HPC-7s from the inner outlet within the mucosal microcirculation was not significantly different from those of (e) adherent cells from the outer outlet. In some images the outline of mucosal vilous capillaries can be seen (arrows).

Chapter 4 HSC Sorting with Microfluidic Systems
152
Figure 4.14. The number of cells present with lungs removed from mice undergoing intestinal IR injury was similar between the sub-poulations tested. Since this quantification was conducted on static tissue from culled mice, it was not possible to state whether the counted cells were actively adherent, trapped or trafficking through at the time of tissue imaging. Results are presented as mean ± SEM (n = 5) and after performing a Student-test, no significant difference was observed.

Chapter 4 HSC Sorting with Microfluidic Systems
153
4.4 Discussion
In this chapter, straight and curved microchannels with different geometries were
utilized to separate sub-populations of smaller and/or more deformable HPC-7s for
future use in in vivo studies. To attain the most efficient separation, five microfluidic
devices with different designs were fabricated and the effects of Reynold’s number (Re),
aspect ratio (AR) and curvature ratio (θ) were investigated. The underlying mechanisms
by which size and deformability-based cell separation was achieved will be discussed. In
order to isolate cells based on their varying deformability, it was firstly demonstrated
that a heterogenous population of cells existed even in an immortalised cell line of HSCs.
Therefore a sample of 200 individual HPC-7 cells were tested with regards to their size
and nominal rupture stress. Although the size variation was not large (6 – 12 m), the
stiffness of cells varied greatly. Nominal rupture stress values between 2 – 64 kPa were
obtained which fitted a normal Gaussian distribution. This broad range clearly
underscores the need to identify microfluidic isolation methods that can enrich for a
more homogenous sub-population of more deformable cells.
4.4.1 Separation of HSCs Using Straight Channels
Two straight rectangular microchannels which had a curvature ratio of 0 and varying
height, width, AR and Re, were mechanically tested. Generally, rectangular
microchannels are more widely employed in cell focusing and separation methods than
square or circular channels as they appear to more effectively separate particles (Liu et
al., 2015). Results demonstrated that the focusing of cells in straight microchannels
behaved in a very complex manner. In Device A, cells harvested from the two side
outlets and the centre outlet did not show any significant difference in their nominal
rupture stress or size, regardless of changing the flow rate. This therefore resulted in no
effective separation of HSCs based on the mechanical properties. However, in Device B,
increasing the flow rate resulted in the migration of the more rigid cells, with higher
nominal rupture stress, away from the channel walls, towards the channel centre hence

Chapter 4 HSC Sorting with Microfluidic Systems
154
increasing their collection from the centre outlet. Conversely, the side outlets primarily
collected softer or more deformable cells with lower noiminal rupture stresses. In this
respect, Device B is generally a good microchannel device for separating HSCs for
subsequent use in vivo.
These differential cell focusing behaviours in straight channels could be explained by
taking into account the two competing ‘lift forces’ (FL) acting on the cells perpendicular
to the direction of Poiseuille flow: the shear-gradient lift force (FLS) directing cells to the
channel walls and the wall-induced lift force (FLW) moving cells in the direction of the
channel centreline (see Figure 4.15). It is accepted that both of the two forces increase
with increasing flow rate or Re (Asmolov, 1999, Gossett et al., 2012). In Device A with a
smaller aspect ratio (AR=5), as the flow rate is increased, the FLS may increase more
greatly than the FLW. As the FLS becomes more dominant, it consequently leads to more
cells moving towards the channel wall (Figure 4.4). This was indeed observed as the
number of cells being collected from the centre outlet decreased with increased flow
rate. The net FL is also proportional to the cell size. For bigger cells, the magnitude of
the net FL grows faster with the flow rate. Therefore, smaller cells move more slowly
than the bigger ones and become entrained near the centreline of the channel.
Interestingly, no difference in the size of cells was observed from the side or centre
outlets with either Device A or B, but this may be due to the small variation in HPC-7
size.
Cells are not solid or rigid structures but are deformable. This deformability will also
induce additional lift forces. Similar to FLS and FLW, deformability-induced lift force
(FLDeformation) also acts perpendicular to flow (Zhang et al., 2016). Therefore, theoretically
for cells with similar diameter, the more deformable HSCs could be displaced by
FLDeformation away from the migration direction of relatively rigid cells, resulting in them
being directed to the channel centreline – similar to smaller cells (Zhang et al., 2016).
However, since no effective mechanical separation was observed with Device A, it is
possible that the channel length was not sufficiently long enough to enable cell
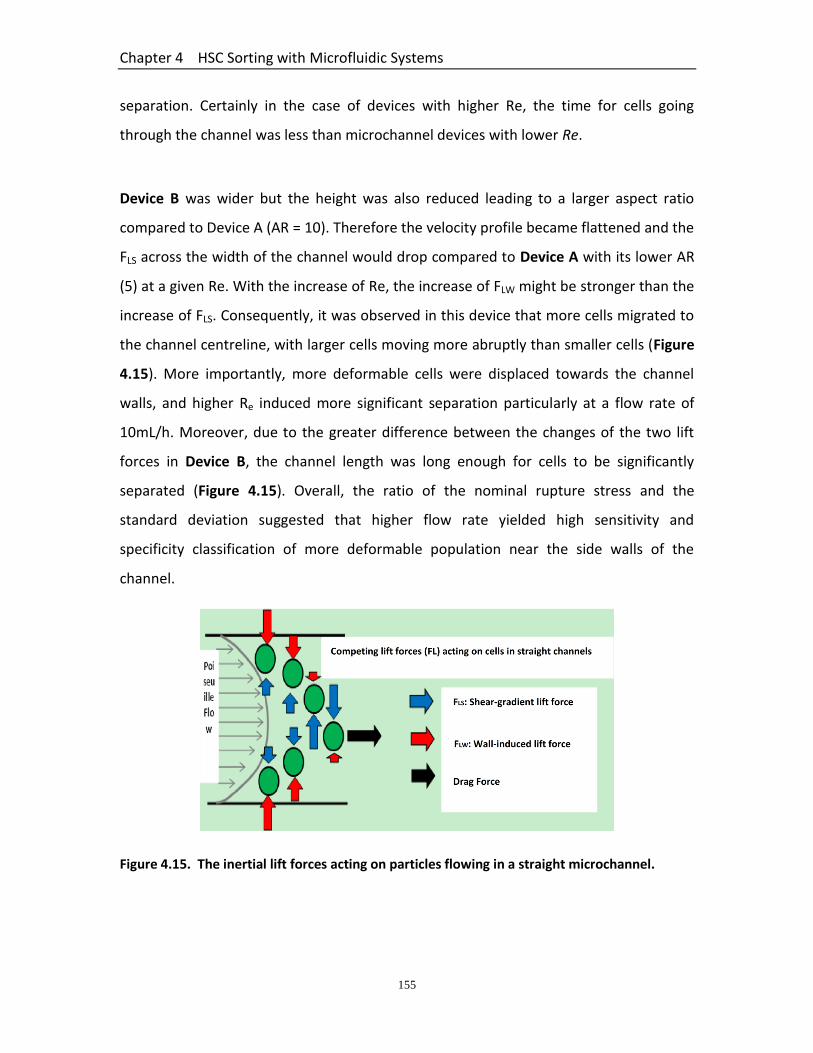
Chapter 4 HSC Sorting with Microfluidic Systems
155
separation. Certainly in the case of devices with higher Re, the time for cells going
through the channel was less than microchannel devices with lower Re.
Device B was wider but the height was also reduced leading to a larger aspect ratio
compared to Device A (AR = 10). Therefore the velocity profile became flattened and the
FLS across the width of the channel would drop compared to Device A with its lower AR
(5) at a given Re. With the increase of Re, the increase of FLW might be stronger than the
increase of FLS. Consequently, it was observed in this device that more cells migrated to
the channel centreline, with larger cells moving more abruptly than smaller cells (Figure
4.15). More importantly, more deformable cells were displaced towards the channel
walls, and higher Re induced more significant separation particularly at a flow rate of
10mL/h. Moreover, due to the greater difference between the changes of the two lift
forces in Device B, the channel length was long enough for cells to be significantly
separated (Figure 4.15). Overall, the ratio of the nominal rupture stress and the
standard deviation suggested that higher flow rate yielded high sensitivity and
specificity classification of more deformable population near the side walls of the
channel.
Figure 4.15. The inertial lift forces acting on particles flowing in a straight microchannel.

Chapter 4 HSC Sorting with Microfluidic Systems
156
Figure 4.16. The effects of increasing flow rate on the movement of HSCs within the two STRAIGHT trifurcated microfluidic devices with varying aspect ratios. Since more cells were collected from the side outlets in Device A, it is likely that the increase in flow rate led to shear-gradient lift forces dominating which directed cells towards the sides of the channel. This resulted in more cells being harvested from the side outlets. However, with this device, no differences in the nominal rupture stress or cell size was observed when cells collecting in side and centre outlets were tested mechanically. Since more cells were collected from the centre outlet in Device B, it is likely that the increase in flow rate led to wall-induced lift forces dominating which directed cells towards the centreline of the channel. With this device, at high flow rates, the nominal rupture stress of cells in the side outlets was significantly reduced indicating these cells were softer/more deformable than those in the centre outlet when tested mechanically. No significant differences in the cell size was observed.
Chapter 4 HSC Sorting with Microfluidic Systems
157
For the smaller κ (0.3; blockage ratio) in Device A, the number of stable equilibrium
positions might have increased at the short walls (height direction), cells would have
migrated in a more complex manner and the difference between subsets became
narrower than that in Device B (κ = 0.5). This is in accordance with the very recent study
of the effect of AR, Re and κ on particle migration in rectangular channels (Liu et al.,
2015).
4.4.2 Separation of HSCs Using Spiral Channels
For curved channels, similar trends in cell number and nominal rupture stress
distribution were observed in the three channels with different curvature ratios (Device
C, θ = 0.0044; Device D, θ = 0.0063; Device E, θ = 0.0079). Firstly, it was observed that
most cells were dragged towards the outer wall of the channel when the flow rate was
0.5mL/h (Re =1.78) or less. Alternatively, it could be said that at the highest flow rates of
15mL/h or when Re was the highest, all cells were dragged to the inner wall and hence
collected from the inner outlet of the spiral devices. This suggests that when the Re was
very small or very large, there was a loss of separation efficiency. Thus intermediate
flow rates were chosen for further experiments. This shifting of cells to the inner half of
the channel was most likely the result of competition between FL and a secondary force
called Dean’s drag force (FD). In the intermediate flow rates, more effective separation
was achieved at relatively faster flow rates. The separation efficiency under the
optimized parameters of each channel was slightly different in terms of the mean values
and CV of cell diameter and σR, and their throughput, as summarized in Table 4.3. Of all
the devices tested, Device C was able to separate cells of interest i.e. those with low
nominal ruptures stress and hence high deformability, with higher efficiency at a flow
rate of 10 mL/h, and can be desirable for subsequent in vivo studies.

Chapter 4 HSC Sorting with Microfluidic Systems
158
Though the exact mechanism responsible for cell sorting in curved channels is still
unclear and requires further investigations, some hypothesis based on experiments and
simulation have been proposed and could help improve our understanding of the cell
migration (Gossett and Carlo, 2009, Martel and Toner, 2012, Guan et al., 2013). When
fluid flows through a curved channel, a secondary flow called Dean drag, centrifugal or
vortex flow (FD) arises due to the velocity mismatch in the downstream direction
between fluid in the central and near-wall regions. In curved channels, Dean drag
follows the underlying secondary velocity field. It is characterised by two counter-
rotating vortices in the height direction and perpendicular to the primary flow direction.
As such, flow is directed outwards near the channel centre and inwards near the up and
bottom walls (Hille et al., 1985). In addition to adding Dean drag force, the curvature
can also change the FLS through redistributing the velocity profile which can change the
vertical position of particles. This redistribution becomes significant with the increase of
θ values (De Vriend, 1981).
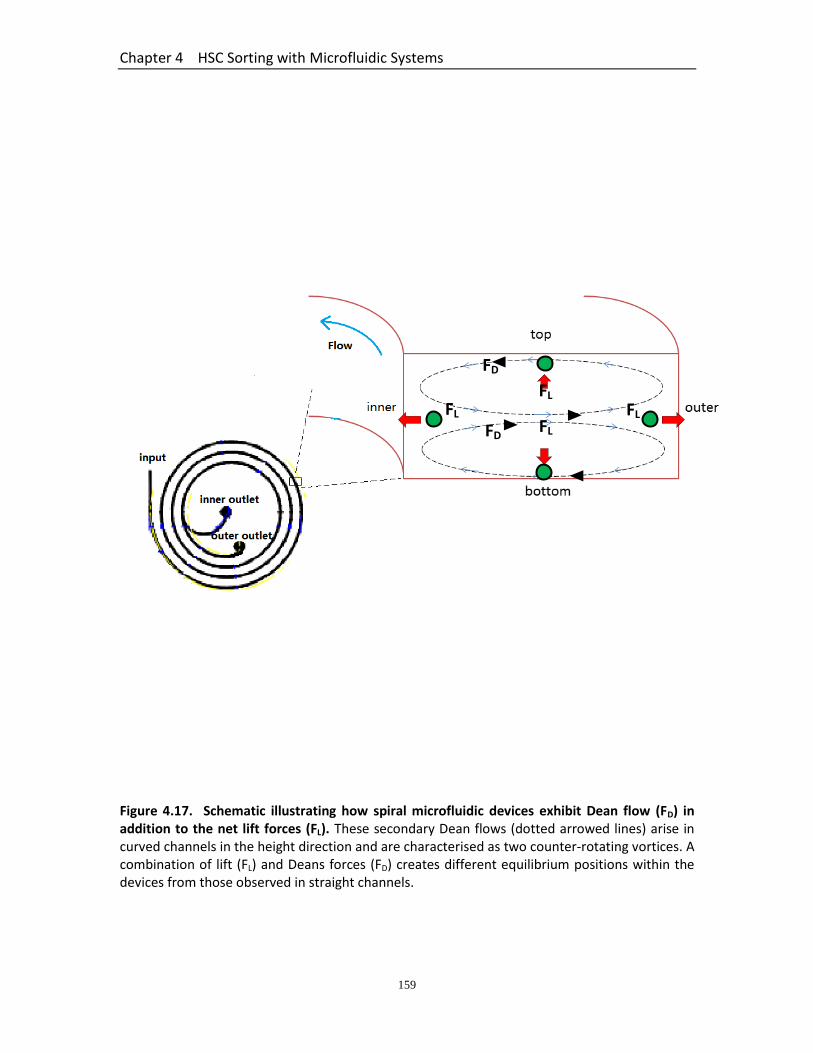
Chapter 4 HSC Sorting with Microfluidic Systems
159
Figure 4.17. Schematic illustrating how spiral microfluidic devices exhibit Dean flow (FD) in addition to the net lift forces (FL). These secondary Dean flows (dotted arrowed lines) arise in curved channels in the height direction and are characterised as two counter-rotating vortices. A combination of lift (FL) and Deans forces (FD) creates different equilibrium positions within the devices from those observed in straight channels.
FD
FD
FL
FL FL FL

Chapter 4 HSC Sorting with Microfluidic Systems
160
Based on this hypothesis, the cell migration in one spiral channel at varying flow rate is
discussed here. The FLS in the height direction in the inner half of the channel decreases
compared to the parabolic profile in the θ =0 case, and FLW or wall-induced inertial
becomes more dominant which allows cells to take vertical equilibrium positions near
the channel centre (Martel and Toner, 2013). By crossing the vertical position, the
bigger and/or rigid cells move faster towards the centre and experience a switch in the
direction of Dean flow, moving outwards of the channel. Smaller and/or more
deformable cells near top or bottom walls move inwards, thus separation can be
achieved. Indeed, this was observed for all the three spiral devices whereby smaller cells
with lower nominal rupture stresses (deformable) were harvested from the inner
outlets and larger cells with larger nominal rupture stresses (rigid) were collected from
the outer outlets. This separation was observed to be significant at higher flow rates.
The FL and FD act as counter balancing forces, and a ratio of 𝑅𝑓 = 𝐹𝐿 𝐹𝐷⁄ = 𝑎2R/
𝐻3𝑓(𝑅𝑒 , 𝑥 𝑤⁄ , 𝑦 ℎ, ℎ 𝑤)⁄⁄ can be used to predict the particle behavior: Rf → 0,
secondary flow plays the dominate role, and particles remain entrained in it, and Rf →
∞, for sufficiently high flow rate, particles would focus to inertial focusing equilibrium
positions independent of the secondary flow (Hasabnis, 2015). With the increasing Re,
the shear gradient becomes high enough to counter FD and so more cells tend to move
away from the channel centre and are directed towards the inner half. Eventually, all
the cells were dragged inwards. This proposed hypothesis can explain the behaviors of
cell migration with the increase of flow rate in each spiral device.
The mechanism that can lead to 100% cell migration to the outer half of the channel at
lower flow rate could be due to the density mismatch between the cells and fluid as
proposed by Amini and colleagues (Amini et al., 2014). In this regime, the fluid inertia
becomes less significant because the Re is close to 0 (Re ≤ 1.78) due to low flow velocity.
If the fluid suddenly changes direction due to addition of curvature, the cells which have

Chapter 4 HSC Sorting with Microfluidic Systems
161
larger density than the fluid may continue for a time on a straight trajectory due to its
inertia, resulting in focusing outwards. This relatively simple physical mechanism of
particle migration in spiral channels can often be understood as an effect of centrifugal
force due to density mismatch rather than Dean flow (Di Carlo et al., 2007, Hou et al.,
2013).
In this study, the nominal rupture stress of cells was calculated from the
micromanipulation data, which took into account the initial cross-sectional area and
diameter of the cells. It should be pointed out that the initial cross-sectional area may
be different from the real contact area between the force probe or bottom substrate
and cell at rupture, and the latter depends on the deformation at rupture.
Micromanipulation results demonatrated that all the tested HPC-7 cells were ruptured
at similar deformations (~ 80% - See Section 3.3). Moreover, at similar deformation, E is
proportional to σ, thus the choice of using nominal rupture stress (σR) was valid to make
comparisons between the mechanical properties of isolated sub-populations. The
viability and mechanical strength of isolated HPC-7s indicate that the majority of cells
(≥ 90%) survived the complex hydrodynamic force generated in the fluidic device, and
the physical structures of cells were not affected during sorting in microchannels which
is crucial to maintain cell viability. The microfluidic system is therefore able to isolate
cells based on mechanical property variations without introducing any additional
changes of the cells.
4.4.3 Intravital Studies
Previous in vivo studies have reported that the systemic infusion of stem cells did not
yield a large number of cells reaching the organ of interest primarily due to the majority
of cells being trapped in remote capillaries (Schrepfer et al., 2007, Gao et al., 2001).
Therefore, it was hypothesized that after systemic injection, the smaller and more
deformable HPC-7 cells harvested from the spiral channel Device C would avoid non-
Chapter 4 HSC Sorting with Microfluidic Systems
162
specific entrapment and thus lead to increased numbers in the peripheral circulation.
This would subsequently enhance cell numbers available for adhesion within injured
tissues as they trafficked through it. To test this, the homing and adhesion of HPC-7s
from the inner outlet of Device C, which were more deformable, was investigated in a
mouse model of intestinal inflammatory injury. Results were compared to Device C
harvested outer outlet/more rigid HPC-7s. This particular model of intestinal injury was
used as inflammatory gut injuries such as Crohn’s and colitis which are difficult to treat,
with current treatment regimens rapidly losing effectiveness (Singh et al., 2010,
Lichtenstein et al., 2009). Theoretically, it should be pointed that the comparison would
have been performed between mixture HSCs and inner outlet HSCs, however, no
significant difference in mechanical properties was observed between isolated HSCs and
un-isolated HSCs (data not shown). Therefore, in this study, the clinical benefit of
smaller and more deformable HSCs was investigated by comparing to the performance
of larger and less deformable isolated cells. It was hypothesised that mechanical based
isolation would not affect the biological properties of HSCs, especially their adhesion
molecules which regulate cell recruitment, to make the comparison reasonable. Sub-
populations from either inner or outer outlet that obtained significant mechanical
difference were intravitally compared, Likewise, there are also difficulties in the
treatment of acute intestinal inflammatory injuries such as IR injury. Ultimately,
inefficient therapies occurred in both acute and chronic bowel injuries, and result in
high morbidity rates. Thus, new, effective therapeutic options are needed. It has been
suggested experimentally and clinically that HSCs are capable of directly repairing
gastrointestinal tissue as well as combating the excessive immune responses triggered
by these inflammatory injuries. Therefore, cellular therapy, especially HSC-based
therapy, could offer this required alternative but only if their delivery to inflamed sites
can be improved.
Intravital studies clearly demonstrated that the cells harvested from the inner outlet of
Device C resulted in significantly more free flowing cells (almost double the number)
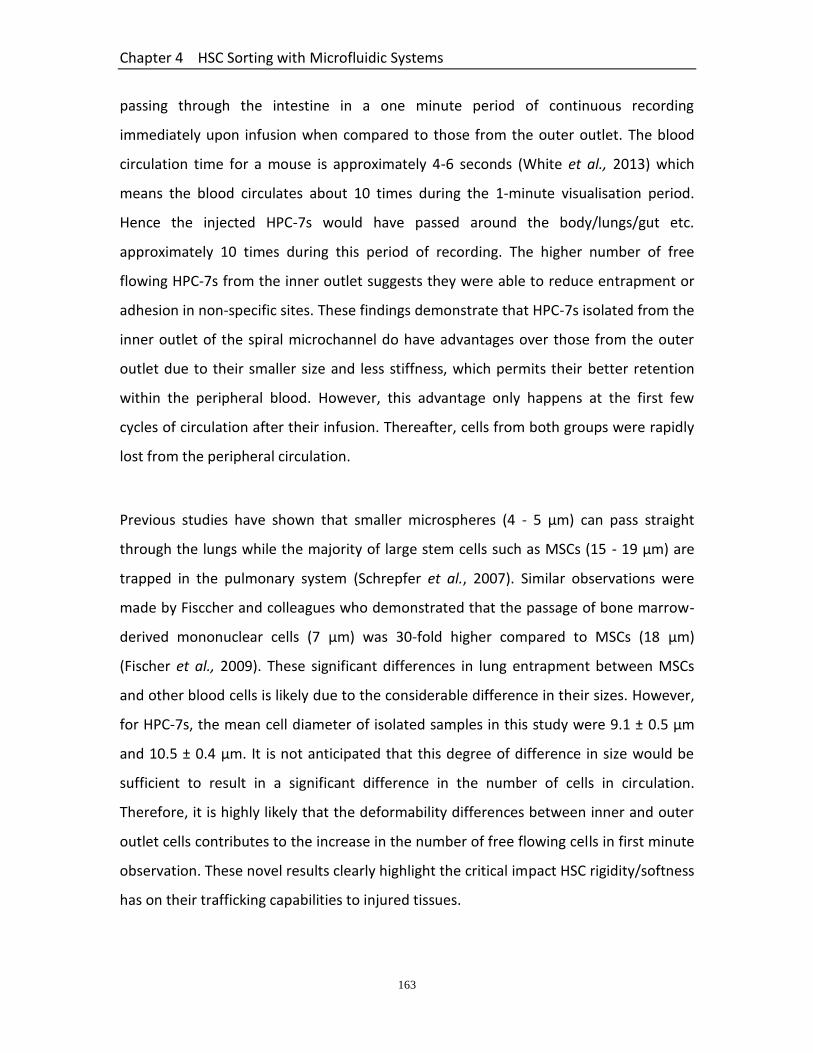
Chapter 4 HSC Sorting with Microfluidic Systems
163
passing through the intestine in a one minute period of continuous recording
immediately upon infusion when compared to those from the outer outlet. The blood
circulation time for a mouse is approximately 4-6 seconds (White et al., 2013) which
means the blood circulates about 10 times during the 1-minute visualisation period.
Hence the injected HPC-7s would have passed around the body/lungs/gut etc.
approximately 10 times during this period of recording. The higher number of free
flowing HPC-7s from the inner outlet suggests they were able to reduce entrapment or
adhesion in non-specific sites. These findings demonstrate that HPC-7s isolated from the
inner outlet of the spiral microchannel do have advantages over those from the outer
outlet due to their smaller size and less stiffness, which permits their better retention
within the peripheral blood. However, this advantage only happens at the first few
cycles of circulation after their infusion. Thereafter, cells from both groups were rapidly
lost from the peripheral circulation.
Previous studies have shown that smaller microspheres (4 - 5 μm) can pass straight
through the lungs while the majority of large stem cells such as MSCs (15 - 19 μm) are
trapped in the pulmonary system (Schrepfer et al., 2007). Similar observations were
made by Fisccher and colleagues who demonstrated that the passage of bone marrow-
derived mononuclear cells (7 μm) was 30-fold higher compared to MSCs (18 μm)
(Fischer et al., 2009). These significant differences in lung entrapment between MSCs
and other blood cells is likely due to the considerable difference in their sizes. However,
for HPC-7s, the mean cell diameter of isolated samples in this study were 9.1 ± 0.5 μm
and 10.5 ± 0.4 μm. It is not anticipated that this degree of difference in size would be
sufficient to result in a significant difference in the number of cells in circulation.
Therefore, it is highly likely that the deformability differences between inner and outer
outlet cells contributes to the increase in the number of free flowing cells in first minute
observation. These novel results clearly highlight the critical impact HSC rigidity/softness
has on their trafficking capabilities to injured tissues.

Chapter 4 HSC Sorting with Microfluidic Systems
164
Although increased homing to and trafficking through the injured gut was observed,
disappointingly, this did not result in significantly enhanced adhesion and thus intestinal
retention. The absence of a significant difference in adhesion between the two isolated
sub-populations of HSCs may be due to the fact that although more cells homed to the
gut, they did not become activated on transit to actually adhere. HSC adhesion to
endothelial cells lining microvessels is regulated by the interplay of a whole host of
soluble inflammatory factors including cytokines and chemokines that activate both cell
types to express adhesion molecules (Kumar and Ponnazhagan, 2007, White et al.,
2013). This adhesion cascade is very similar to that observed for inflammatory
leukocytes. Recent evidence has shown that modulating the expression of adhesion
molecules and/or activatory chemokines is able to enhance the adhesion of many types
of stem cells including HSC and MSC recruitment (Kavanagh et al., 2013). It was
postulated that increasing the numbers of free flowing HPC-7s circulating through the
gut using microfluidic systems combined with other cell pre-treatment strategies to
activate surface adhesion molecules would be an effective dual strategy to enhance the
efficiency of stem cell therapy.
Interestingly, this increased trafficking at 30 minutes post-reperfusion was despite the
fact that the numbers of cells observed within the pulmonary microvasculature was not
significantly different between the two groups. It could be that less cells became
entrapped in sites other than the lungs and this would need to be investigated further.
Certainly entrapment with the small diameter capillaries of the spleen is also routinely
observed. It may be that the deformable cells have avoided physical entrapment in
these sites rather than the pulmonary capillaries. Many studies, including those from
the Kalia lab, have aimed to improve HSC homing and retention via over-expression of
chemotactic factors or pre-conditioning of cells with inflammatory compounds, but
interfering with their entrapment in these non-specific sites may provide the most
significant therapeutic benefit.
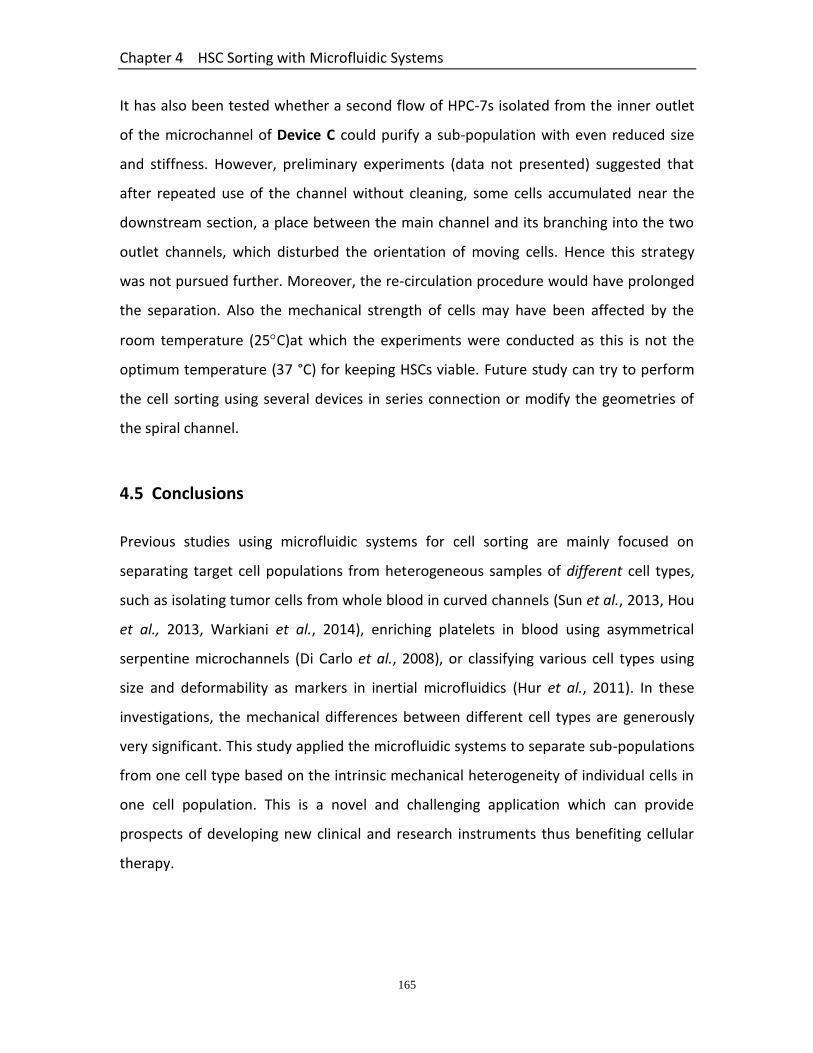
Chapter 4 HSC Sorting with Microfluidic Systems
165
It has also been tested whether a second flow of HPC-7s isolated from the inner outlet
of the microchannel of Device C could purify a sub-population with even reduced size
and stiffness. However, preliminary experiments (data not presented) suggested that
after repeated use of the channel without cleaning, some cells accumulated near the
downstream section, a place between the main channel and its branching into the two
outlet channels, which disturbed the orientation of moving cells. Hence this strategy
was not pursued further. Moreover, the re-circulation procedure would have prolonged
the separation. Also the mechanical strength of cells may have been affected by the
room temperature (25C)at which the experiments were conducted as this is not the
optimum temperature (37 °C) for keeping HSCs viable. Future study can try to perform
the cell sorting using several devices in series connection or modify the geometries of
the spiral channel.
4.5 Conclusions
Previous studies using microfluidic systems for cell sorting are mainly focused on
separating target cell populations from heterogeneous samples of different cell types,
such as isolating tumor cells from whole blood in curved channels (Sun et al., 2013, Hou
et al., 2013, Warkiani et al., 2014), enriching platelets in blood using asymmetrical
serpentine microchannels (Di Carlo et al., 2008), or classifying various cell types using
size and deformability as markers in inertial microfluidics (Hur et al., 2011). In these
investigations, the mechanical differences between different cell types are generously
very significant. This study applied the microfluidic systems to separate sub-populations
from one cell type based on the intrinsic mechanical heterogeneity of individual cells in
one cell population. This is a novel and challenging application which can provide
prospects of developing new clinical and research instruments thus benefiting cellular
therapy.
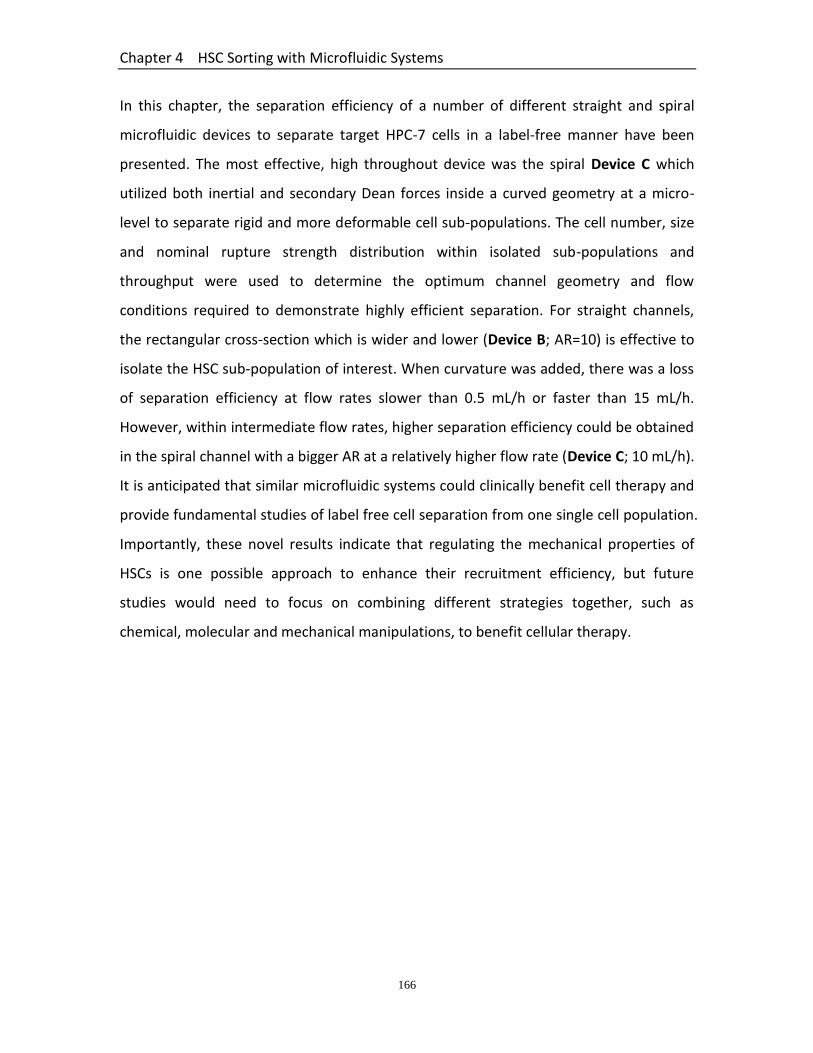
Chapter 4 HSC Sorting with Microfluidic Systems
166
In this chapter, the separation efficiency of a number of different straight and spiral
microfluidic devices to separate target HPC-7 cells in a label-free manner have been
presented. The most effective, high throughout device was the spiral Device C which
utilized both inertial and secondary Dean forces inside a curved geometry at a micro-
level to separate rigid and more deformable cell sub-populations. The cell number, size
and nominal rupture strength distribution within isolated sub-populations and
throughput were used to determine the optimum channel geometry and flow
conditions required to demonstrate highly efficient separation. For straight channels,
the rectangular cross-section which is wider and lower (Device B; AR=10) is effective to
isolate the HSC sub-population of interest. When curvature was added, there was a loss
of separation efficiency at flow rates slower than 0.5 mL/h or faster than 15 mL/h.
However, within intermediate flow rates, higher separation efficiency could be obtained
in the spiral channel with a bigger AR at a relatively higher flow rate (Device C; 10 mL/h).
It is anticipated that similar microfluidic systems could clinically benefit cell therapy and
provide fundamental studies of label free cell separation from one single cell population.
Importantly, these novel results indicate that regulating the mechanical properties of
HSCs is one possible approach to enhance their recruitment efficiency, but future
studies would need to focus on combining different strategies together, such as
chemical, molecular and mechanical manipulations, to benefit cellular therapy.

Chapter 4 HSC Sorting with Microfluidic Systems
167
Chapter 5
Biomechanical Properties of Human T Cells
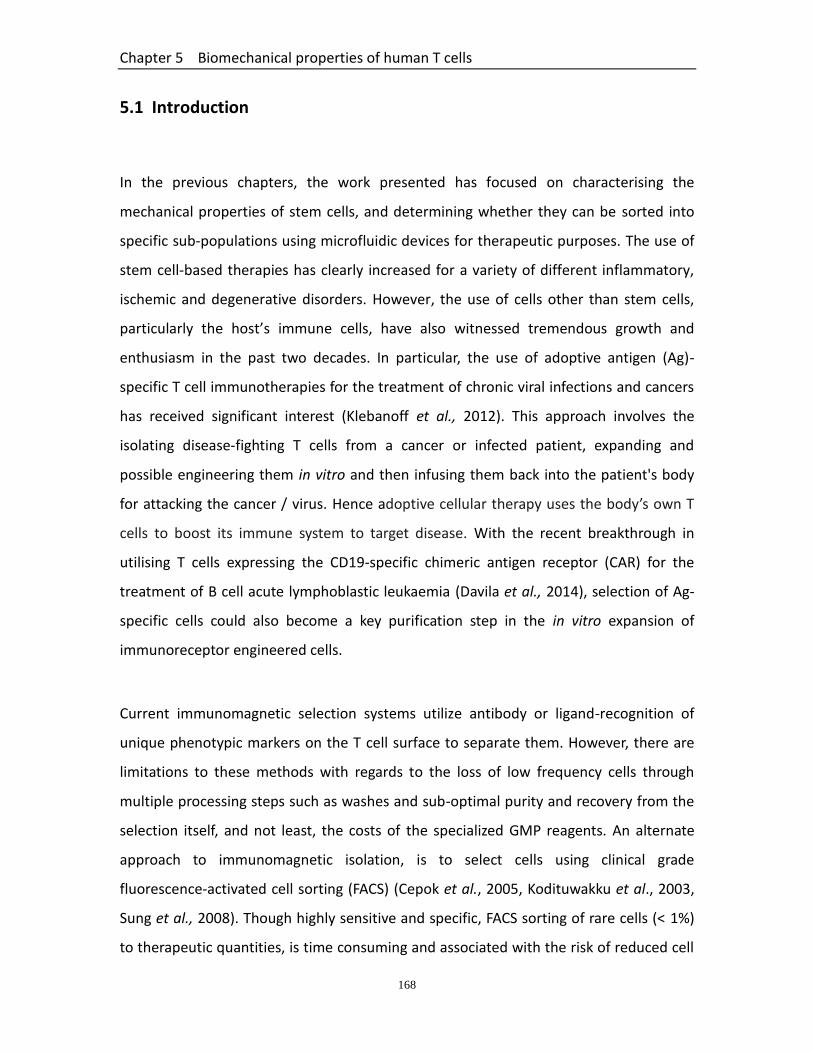
Chapter 5 Biomechanical properties of human T cells
168
5.1 Introduction
In the previous chapters, the work presented has focused on characterising the
mechanical properties of stem cells, and determining whether they can be sorted into
specific sub-populations using microfluidic devices for therapeutic purposes. The use of
stem cell-based therapies has clearly increased for a variety of different inflammatory,
ischemic and degenerative disorders. However, the use of cells other than stem cells,
particularly the host’s immune cells, have also witnessed tremendous growth and
enthusiasm in the past two decades. In particular, the use of adoptive antigen (Ag)-
specific T cell immunotherapies for the treatment of chronic viral infections and cancers
has received significant interest (Klebanoff et al., 2012). This approach involves the
isolating disease-fighting T cells from a cancer or infected patient, expanding and
possible engineering them in vitro and then infusing them back into the patient's body
for attacking the cancer / virus. Hence adoptive cellular therapy uses the body’s own T
cells to boost its immune system to target disease. With the recent breakthrough in
utilising T cells expressing the CD19-specific chimeric antigen receptor (CAR) for the
treatment of B cell acute lymphoblastic leukaemia (Davila et al., 2014), selection of Ag-
specific cells could also become a key purification step in the in vitro expansion of
immunoreceptor engineered cells.
Current immunomagnetic selection systems utilize antibody or ligand-recognition of
unique phenotypic markers on the T cell surface to separate them. However, there are
limitations to these methods with regards to the loss of low frequency cells through
multiple processing steps such as washes and sub-optimal purity and recovery from the
selection itself, and not least, the costs of the specialized GMP reagents. An alternate
approach to immunomagnetic isolation, is to select cells using clinical grade
fluorescence-activated cell sorting (FACS) (Cepok et al., 2005, Kodituwakku et al., 2003,
Sung et al., 2008). Though highly sensitive and specific, FACS sorting of rare cells (< 1%)
to therapeutic quantities, is time consuming and associated with the risk of reduced cell

Chapter 5 Biomechanical properties of human T cells
169
viability (Wulff et al., 2006).
In the previous chapters, it has been demonstrated that microfluidic cell sorting systems
can be used to isolate cells based on their size and stiffness. Studies reporting cell
sorting based on size or stiffness also demonstrate the potential applications of the
microfluidic cell sorting technique for separating tumour cells, erythrocytes as well as
activated Ag-specific T cells (Chwee Teck Lim, 2014, Hou et al., 2010, Hur et al., 2011,
Preira et al., 2013). It should therefore be possible to use natural or induced variations in
biomechanical properties to separate activated lymphocytes from non-activated
lymphocytes and other cell types. However, before we can utilise microfluidic assays to
separate lymphocytes for clinical therapeutic purposes, a precise study of their
biomechanical properties is needed. Circulating lymphocytes experience significant
repeated hydrodynamic and mechanical stresses in blood vessels, which are applied
along their entirety leading to large deformations in the microcirculation. These are
particularly seen following lymphocyte activation when they transmigrate out of blood
vessels into the surrounding interstitial tissue. Therefore, it is important to understand
the mechanical properties of lymphocytes under large, as well as small, deformations.
The micromanipulation technique was therefore used to measure the temporal
biomechanical changes of T cells following Ag-induced stimulation. Moreover, the
studies were conducted on live cells rather than fixed cells. The mechanical strength
parameters such as rupture force, rupture deformation and nominal rupture stress /
tension for resting (unactivated) and activated T cells compressed to rupture were
determined. The data of T cells reversibly compressed to smaller deformations were
modelled to obtain a measure of the elasticity, defined as the Young’s modulus, of the
whole cell. This work provides important new data on the biomechanics of activated T
cells which can be used for future development of microfluidic separation of cells that
have selectively responded to specific antigen stimulation. The results from this chapter
have been published as an original manuscript (Du et al., 2016).
Chapter 5 Biomechanical properties of human T cells
170
5.2 Methods
5.2.1 Isolation, Culture and in vitro Activation of T Lymphocytes
Peripheral blood was collected from three healthy drug-free human donors after
informed consent, and untouched CD8+ T cells were isolated by negative
immunomagnetic selection as described in detail in Section 2.2.6. Some cells were
activated by culturing in the presence of 30 ng/mL anti-CD3 antibody OKT3. For control
samples, the non-activated CD8+ T cells were cultured in the medium for up to 4 days.
All the cell samples were mechanically tested on Day 0, Day 2 and Day 4.
5.2.2 Diametric Compression with Micromanipulation Technique
The mechanical properties of resting or unactivated T cells were measured either
immediately after harvesting (day 0) or tested 2 days or 4 days post-activation. Cells
were diluted with PBS to reduce cell density in suspension and mechanical testing was
completed within 3 hours using micromanipulation. Suspended single cells were allowed
to settle to the bottom of the chamber, and images were captured with a side-view high-
speed digital camera. A probe with a 25 µm diameter, connected to a force transducer,
was driven down by a stepping motor towards the single cells at a probe speed of 2
µm/s in order to collect the data of instantaneous force imposed on single cells at a
frequency of 50 Hz.
5.2.3 Determination of Activation-related Changes in Cell Size
The diameter of CD8+ T cells was directly measured from the screen of a TV monitor

Chapter 5 Biomechanical properties of human T cells
171
which was connected with the side view camera on the micromanipulation rig. The cell
size was also evaluated by flow cytometry. Enriched T cells from different samples were
stained with anti CD3/PE and 7AAD (BD). The forward scatter (FSC-A) value of the 7AAD-
/CD3+ cells was recorded using the FacsCanto II flow cytometer (BD, San Jose, CA, USA).
5.2.4 Determination of Mechanical Property Parameters
Briefly, 20 single cells from each of the 3 donor samples were selected randomly and
compressed to large deformations until they were ruptured. The force (N) imposed on
the cell was plotted against the distance (m) the probe moved towards the glass
chamber until the cell was ruptured (force versus displacement). These graphs were
then used to determine the mean rupture force and the percentage (%) deformation at
rupture for resting and activated cells. Two additional parameters, which took into
account the actual size of the tested cells and allowed meaningful comparisons between
groups to be made, were also determined using relevant calculation equations, namely
nominal rupture stress (R) and nominal rupture tension (TR). The Hertz model was
involved to calculate the Young’s Modulus of T cells at small deformations as described
in Chapter 3.
5.2.5 Statistical Analysis
Values for the mechanical property parameters of the lymphocytes were presented as
mean ± standard error. Paired Student t-tests were conducted to determine significant
differences among the mechanical properties of different samples, with statistical
significance reported at the 95% confidence level (p<0.05).

Chapter 5 Biomechanical properties of human T cells
172
5.3 Results
5.3.1 Activation of CD8+ T Lymphocytes Increases their Cell Size
The diameter of resting CD8+ T cells (day 0) was 6.1 ± 0.6 µm as determined using
micromanipulation. This increased significantly (p < 0.05) upon activation to 9.7 ± 1.1 µm
on day 2 post-activation and remained significantly (p < 0.05) greater on day 4 post-
activation when compared to resting cell values (Figure 5.1a). There was no significant
difference between the activated samples at day 2 and day 4 post-activation. Changes in
cell diameter are also shown by the data generated using flow cytometry (Figure 5.1b).
The FSC-A values of resting T cells are again significantly greater on day 2 (p<0.05) and
day 4 post-activation (p<0.05). Interestingly, it was noted that CD8+ T cells that had been
activated and tested on day 2 post-activation tended to ‘stick’ to the force transducer
probe, possibly indicating some change in their adhesive nature in the early stages of
activation.
5.3.2 Compression Curves of T lymphocytes to Rupture
Micromanipulation studies demonstrated that the individual CD8+ T cells tested in the
same sample were heterogeneous in their diameter and their force versus displacement
curves even for single cells of same diameter. However, all tested single cells showed
common characteristics in their compression curves. Typical curves showing the
relationship between the force and displacement during continuous diametrical
compression of a single lymphocyte to rupture at day 0, 2 and 4 days post-activation are
shown (Figures 5.2 a-c). At point A, the probe started to touch the cell, and the resistant
force increased until point B where the cell ruptured. As a result of rupture, the force
decreased rapidly to point C, followed by curve CD where the force increased
continuously which represents the compression of cell debris until the probe touched
bottom of the glass chamber.
Chapter 5 Biomechanical properties of human T cells
173
5.3.3 Rupture Force Increases at 4 days Post-activation
The mean cell rupture force (N) was determined from the force vs displacement curves
(y-axis value at point B). The rupture force was similar between the resting (day 0) and
activated cells at 2 days post-activation with mean values of 2.3 ± 0.8 µN and 2.6 ± 0.9
µN respectively. However, when activated cells were analyzed at 4 days, the rupture
force significantly (p < 0.05) increased to 4.6 ± 1.6 µN (p < 0.05) when compared to
resting cells (Figure 5.3a). The % rupture deformations of resting T lymphocytes and
activated lymphocytes at 2 and 4 days post-activation were not significantly different
with mean values of 78.3 ± 1.3%, 79.7 ± 1.6% and 77.5 ± 1.5% obtained respectively
(Figure 5.3b).
5.3.4 Nominal rupture stress / tension Decreases at 2 days Post-activation
The nominal rupture tension significantly (p < 0.05) decreased from 0.58 ± 0.07 N/m for
resting cells to 0.45 ± 0.07 N/m for cells at 2 days post-activation. This increased to 0.62
± 0.10 N/m on day 4 post-activation, a value not significantly different from resting cells
(Figure 5.4). A similar pattern was observed for nominal rupture stress (Figure 5.4).
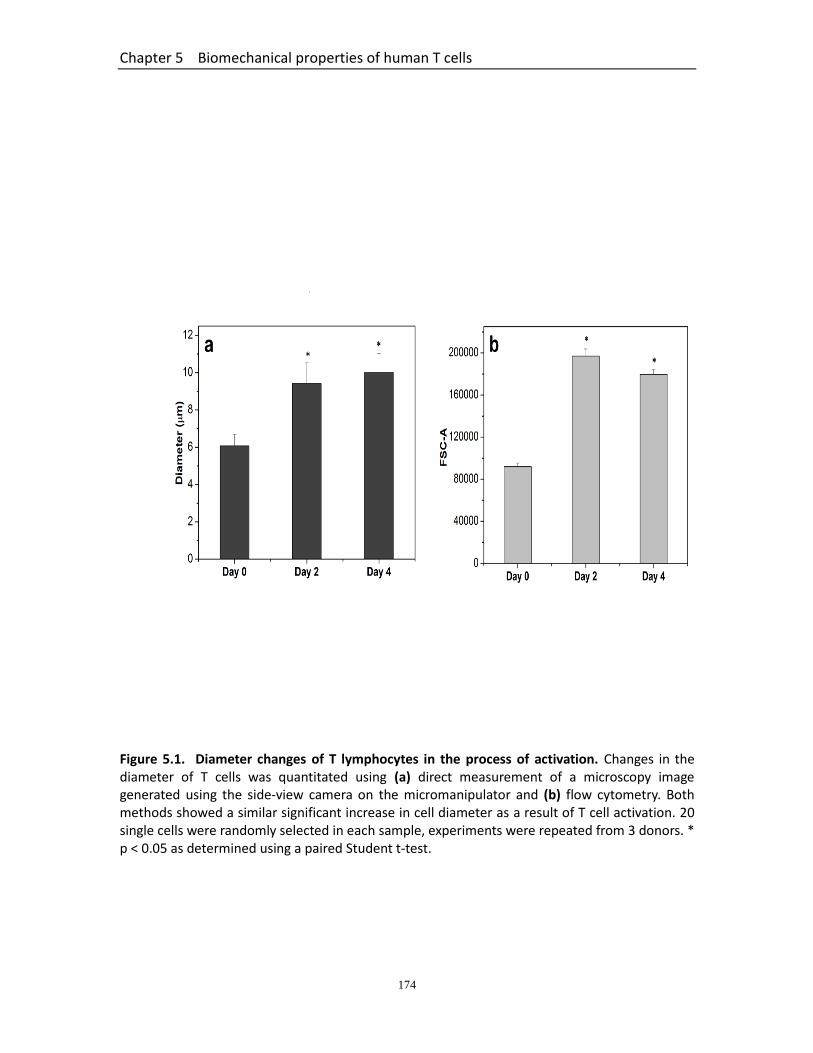
Chapter 5 Biomechanical properties of human T cells
174
Figure 5.1. Diameter changes of T lymphocytes in the process of activation. Changes in the diameter of T cells was quantitated using (a) direct measurement of a microscopy image generated using the side-view camera on the micromanipulator and (b) flow cytometry. Both methods showed a similar significant increase in cell diameter as a result of T cell activation. 20 single cells were randomly selected in each sample, experiments were repeated from 3 donors. * p < 0.05 as determined using a paired Student t-test.
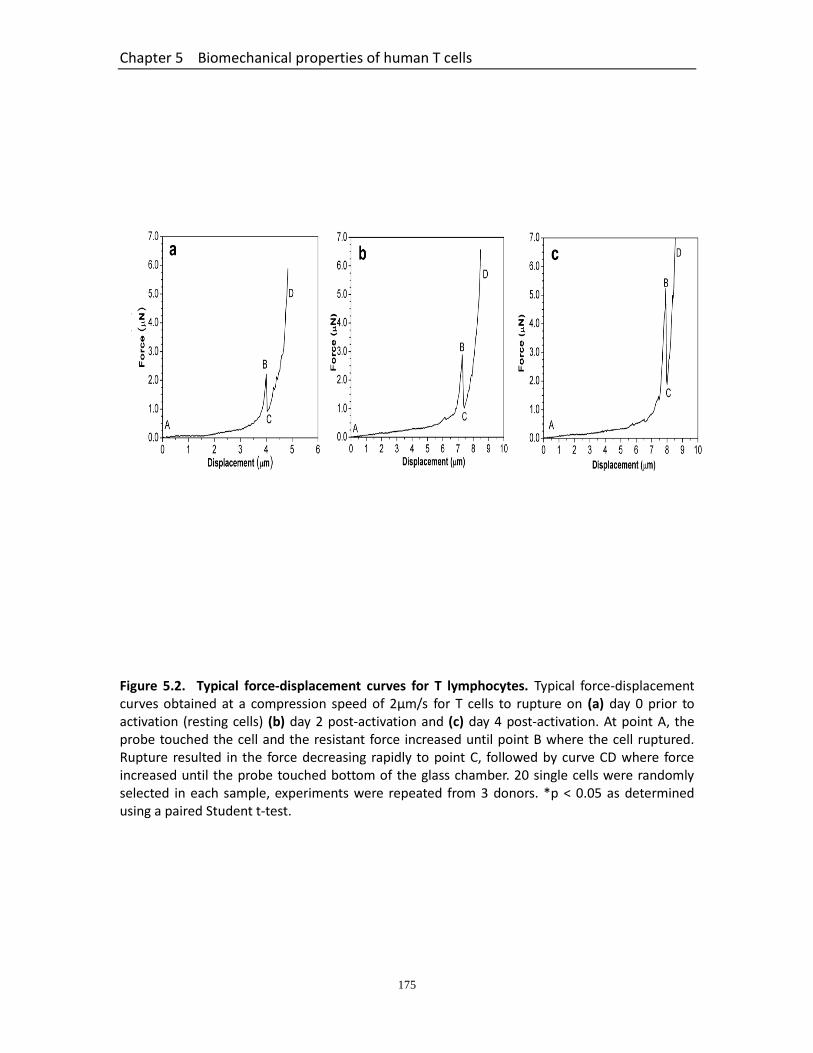
Chapter 5 Biomechanical properties of human T cells
175
Figure 5.2. Typical force-displacement curves for T lymphocytes. Typical force-displacement curves obtained at a compression speed of 2µm/s for T cells to rupture on (a) day 0 prior to activation (resting cells) (b) day 2 post-activation and (c) day 4 post-activation. At point A, the probe touched the cell and the resistant force increased until point B where the cell ruptured. Rupture resulted in the force decreasing rapidly to point C, followed by curve CD where force increased until the probe touched bottom of the glass chamber. 20 single cells were randomly selected in each sample, experiments were repeated from 3 donors. *p < 0.05 as determined using a paired Student t-test.

Chapter 5 Biomechanical properties of human T cells
176
Figure 5.3. Rupture parameters of T lymphocytes in the process of activation. The (a) mean rupture force and (b) mean rupture deformation of T cells on day 0 prior to activation (resting cells), day 2 post-activation and day 4 post-activation. The force required to rupture cells was larger for activated cells at 4 days post-activation. All cells were ruptured when they reached a % deformation close to 80%. 20 single cells were randomly selected in each sample, experiments were repeated from 3 donors. *p < 0.05 as determined using a paired Student t-test.
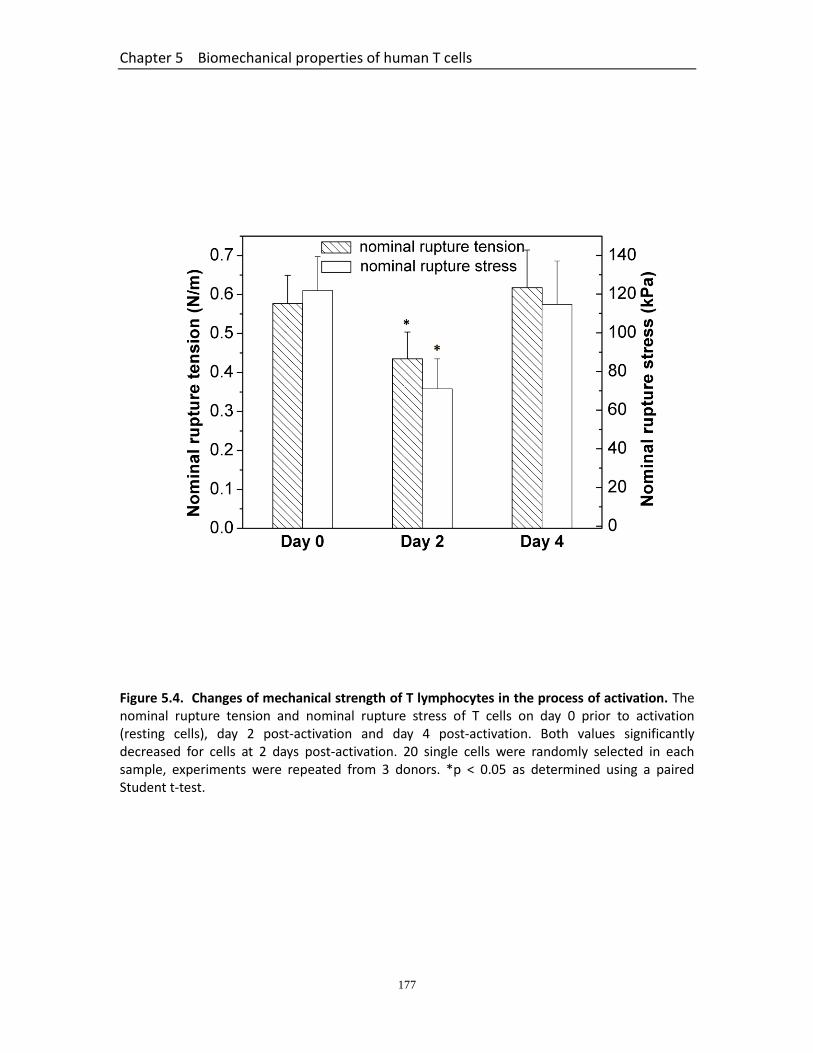
Chapter 5 Biomechanical properties of human T cells
177
Figure 5.4. Changes of mechanical strength of T lymphocytes in the process of activation. The nominal rupture tension and nominal rupture stress of T cells on day 0 prior to activation (resting cells), day 2 post-activation and day 4 post-activation. Both values significantly decreased for cells at 2 days post-activation. 20 single cells were randomly selected in each sample, experiments were repeated from 3 donors. *p < 0.05 as determined using a paired Student t-test.

Chapter 5 Biomechanical properties of human T cells
178
5.3.5 Young’s Modulus Decreases in Activated CD8+ T Lymphocytes
The Young’s modulus was calculated from data obtained corresponding to small
deformations of T cells. Typical force versus displacement data with a linear fit based on
the Hertz model for cells at day 0, 2 and 4 days post-activation are shown (Figures 5.5 a-
c). Mean correlation coefficient values of 0.84 ± 0.05, 0.85 ± 0.04 and 0.85 ± 0.06 were
obtained for resting cells at day 0 and cells at 2 days post-activation and 4 days post-
activation respectively. The values of Young’s modulus decreased significantly at both 2
days post-activation (p < 0.05) and 4 days post-activation (p < 0.05) when compared to
resting cells at day 0 (Figure 5.5d). Actual calculated mean values for the Young’s
modulus were 58.0 ± 6.3 kPa, 43.7± 5.0 kPa, and 43.0± 6.3 kPa for T lymphocytes at day
0, day 2 post-activation and day 4 post-activation respectively. There was no significant
difference in the mean Young’s modulus between T cells activated for 2 days and 4 days
(p > 0.05).
5.3.6 No Change in the Mechanical Properties of Non-activated CD8+ T Lymphocytes for up to 4 days
The diameter of non-activated T cells did not change significantly upon incubation on
day 2 and day 4 when cultured in the medium (Figure 5.6a). There was also no
significant difference in the nominal rupture tension/stress between the resting samples,
as shown in Figure 5.6b.

Chapter 5 Biomechanical properties of human T cells
179
Figure 5.5. Force-displacement data fitted with Hertz model. The typical linear fit (line) of the
Hertz model to the obtained force-displacement data (o) for T cells compressed to small deformations on (a) day 0 prior to activation (resting cells) (b) day 2 post-activation and (c) day 4 post-activation. The mean values of the correlation coefficient are 0.84 ± 0.05, 0.85 ± 0.04 and 0.85 ± 0.06 respectively with an overall range of 0.7 to 0.9. (d) The Young’s modulus was calculated from these data, which decreased significantly as a results of activation. 20 single cells were randomly selected in each sample, experiments were repeated from 3 donors. *p < 0.05 as determined using a paired Student t-test.
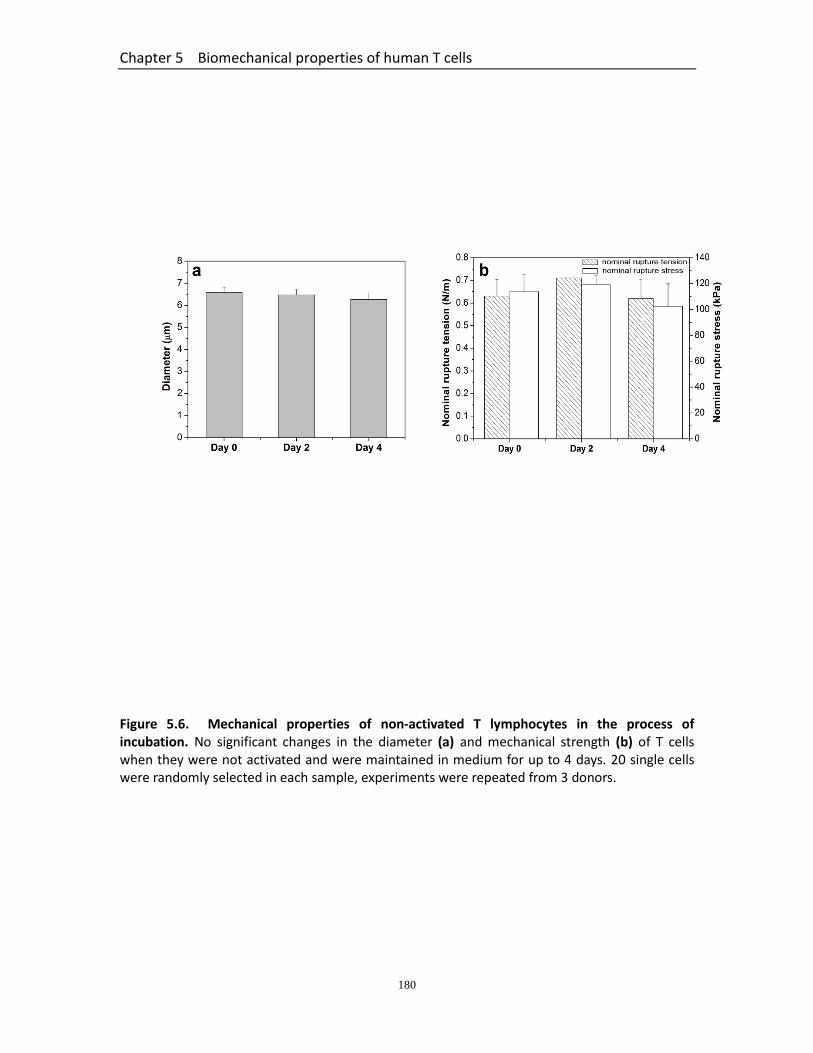
Chapter 5 Biomechanical properties of human T cells
180
Figure 5.6. Mechanical properties of non-activated T lymphocytes in the process of incubation. No significant changes in the diameter (a) and mechanical strength (b) of T cells when they were not activated and were maintained in medium for up to 4 days. 20 single cells were randomly selected in each sample, experiments were repeated from 3 donors.

Chapter 5 Biomechanical properties of human T cells
181
Table 5.1. Summary of the changes in the mechanical properties of human T lymphocytes at 2
days and 4 days post-activation. An increase in cell volume was observed as a result of activation at both 2 and 4 days post-activation. Rupture force increased at day 4 but no changes in ruptre deformation was observed. Rupture stress/tension decreased at 2 days post-activation indicating decreased mechanical strength which increased at dat 4. The Young’s modulus at small deformations (up to 10%), decreased at both 2 and 4 days post-activation suggesting the cells became and remained flexible.
All values compared to resting cells
Cell size Rupture force % Rupture
deformation Rupture stress
and tension Young’s modulus
2 days post-activation
4 days post-activation

Chapter 5 Biomechanical properties of human T cells
182
5.4 Discussion
This novel study analysed the biomechanical properties of live lymphocytes undergoing
activation using a micromanipulation technique, without the need for fixing the cells. An
increase in cell volume was observed as a result of activation at both 2 and 4 days post-
activation. An initial fall in whole cell mechanical strength was observed at 2 days post-
activation as indicated by the decreased rupture stress/tension values. Thereafter,
although lymphocytes remained bigger, they regained their mechanical strength at day 4
post-activation, possibly reflecting the tailing off of activation and cellular recovery.
However, the Young’s modulus at small deformations (up to 10%), decreased at both 2
and 4 days post-activation suggesting the cells became and remained flexible. This is the
first time, to my best knowledge, that a micromanipulation technique has been used to
directly analyze the biomechanical properties including rupture strength of human T
cells at various time points post-activation. A summary of the data obtained is provided
in Table 5.1.
Rupture forces can be used as an important parameter to compare the mechanical
strength of cells. Although all cells ruptured when their compressive displacement
reached almost 80% of their original diameter, activated lymphocytes were larger than
unactivated cells, as demonstrated by both micromanipulation and flow cytometry
techniques. Increases in CD8+ T cell size at similar time points have previously been
described microscopically post-OKT3 activation (Wu et al., 2009, Teague et al., 1993) and
occurs so that activated lymphocytes can duplicate their contents and divide. The
rupture force for activated cells at 4 days post-activation was significantly greater than
resting and activated cells at 2 days post-activation. At first glance, this suggested these
cells were “stronger”, thus requiring the greater force to rupture. However, this data did
not take into account that the size of the cells was different for the three groups which
could explain their differing rupture force / deformabilities. To make comparisons
meaningful, the cells need to have similar diameters and also possess similar

Chapter 5 Biomechanical properties of human T cells
183
deformation at rupture.
To make comparisons between the mechanical properties of resting and activated cells,
nominal rupture stress and tension was calculated, which took into account the initial
cross-sectional area and diameter of the cells. It should be pointed out that the initial
cross-sectional area may be different from the real contact area between the force
probe or bottom substrate and cell at rupture, and the latter depends on the
deformation at rupture. The deformation at rupture did not change significantly up to 4
days and so the choice of using nominal rupture stress for comparison is still valid. Once
corrected for size, it became apparent that resting cells (day 0) and cells at 4 days post-
activation were equally strong but more than cells at 2 days post-activation. Hence the
nominal stress/tension data indicated that CD8+ T cells became weaker early during
activation, while their mechanical strength was regained 4 days later. The higher
mechanical strength of the resting lymphocytes is essential functionally to maintain
sufficient integrity and thus protect them from damage by the significant hydrodynamic
and mechanical stresses exerted on them in the circulation (Brown et al., 2001).
Following stimulation by Ag-presenting cells in vivo, CD8+ T cells move out of the
circulation to the site of infection where they acquire cytolytic effector activity against
the pathogen. Therefore, the initial weakened cellular strength observed in this study
may functionally correlate with, and enable, the transmigration of circulating
lymphocytes between endothelial cells into tissue. After this event, lymphocytes regain
their original form and strength/stiffness for mediating effector activity and this
functionally correlates with the higher nominal rupture stress/tension observed at 4 day
post-activation than day 2. A similar pattern of increased deformability post-activation
associated with cellular exit from microvessels, and regaining stiffness once within the
surrounding tissue, has also been described for phagocytic granulocytes (unpublished
work).
Previous studies have shown that the nucleus of T cells is approximately 5 times stiffer
Chapter 5 Biomechanical properties of human T cells
184
than the cytoplasm and occupies about 80% of the cell (Friedl et al., 2011). This
characteristic makes T lymphocytes different from other eukaryocyte cells
(mesenchymal cells, endothelial cells, etc.) in which the cell nucleus only occupies 10%
of the cell volume (Tsien et al., 1982). When faced with higher compressive forces, the
lymphocyte cell nucleus therefore plays an increasingly significant role in resisting the
applied force for the whole cell. The reduced nominal rupture stress / tension at 2 days
post-activation indicates the cell nucleus, as well as the cell membrane and cytoskeleton
of these larger cells, may have become less strong/stiff. However, at the later stage of
activation (from day 2 to day 4), these structures regained their mechanical strength
while cell volume remained unchanged during this time.
At lower applied force, which compresses the cell to a smaller deformation, the
mechanical stiffness of T cells is governed primarily by the membrane which is
considered to be largely elastic. The Young’s modulus is a measure of the intrinsic
stiffness of an elastic material undergoing recoverable compression. The Hertz model
was able to determine the Young’s modulus of T cells at small deformations (up to 10%),
hence providing an indication of the elasticity of the outer region (cell membrane and
cytoskeleton) of the cell. Although the noise to signal ratio is relatively big corresponding
to small deformations, significant differences between samples were still demonstrated
from the values of Young’s modulus. The results indicate that depolymerization or
reorganization of cytoskeleton polymers probably happened when the cells were
activated, resulting in softness of the outer cortex during the 4 days. From the rupture
parameters at large deformation and the Young’s modulus calculated at small
deformation, it is hypothesized that the cytoskeleton remained less stiff post-activation,
while the nucleus regained rigidity during the 4 days activation, which remains to be
validated in future. In the calculation of Young’s modulus, for living cells, the Poisson
ratio () is typically between 0.4 and 0.5, which means they are mostly or fully
incompressible (Trickey et al., 2006). A value of 0.5 is chosen here since the Poisson ratio
of CD8+ T cells has not been studied. Moreover, from the Hertz model, it can be seen
Chapter 5 Biomechanical properties of human T cells
185
that has little effect on Young’s modulus that increases by only 12% when varies
from 0.4 to 0.5. For measuring the local Young’s modulus of the cell membrane with
greater sensitivity, and its spatial distribution, AFM may be used which can measure the
forces in the order of pico-Newton to nano-Newton.
5.5 Conclusion
Sorting cells in microfluidic devices based on their difference in mechanical properties is
increasingly recognized as a marker-free way to separate biological cells. With the
increasing interest in using CD8+ T cells for therapeutic purposes, a separation method
in which cells remain unperturbed is important if they are to be transplanted after
mechanical characterization and sorting. This study utilizes the micromanipulation
technique, a relatively straightforward method to evaluate the mechanical property
changes of activated CD8+ T cells. It has been found that there was no significant change
in the mechanical property parameters including cell size, nominal rupture stress and
rupture tension of non-activated CD8+ T cells in the culture medium for up to 4 days,
which is in clear contrast to those activated in vitro using anti-CD3. The activated cells
showed a significant increase in size and decrease in rupture stress/tension at day 2 but
the mechanical strength recovered at day 4. The data obtained on size and mechanical
properties post-activation may be utilized for developing microfluidic devices for their
separation. Furthermore, this work obtains complementary data for CD8+ T cells
circulating in vivo with respect to adapting to the mechanical barriers. The ability to
directly measure the biomechanical properties of live lymphocyte subsets not only
facilitates the development of a cell separation system based on defined physical
properties of cells but also provides a ‘biomarker’ for assessing the physical state of
lymphocytes, that could be used for assessing quality after bioprocessing of cells e. g.
cryopreservation.

Chapter 6 Overall Conclusions and Recommendations for Future Work
186
Chapter 6
Overall Conclusions and Recommendations for Future Work
Chapter 6 Overall Conclusions and Recommendations for Future Work
187
6.1 Summary of Main Findings
Cellular therapy has offered the basis for developing potentially powerful new
therapeutic strategies in the treatment of a broad spectrum of human diseases and
injuries (Kim and De Vellis, 2009, Jeevanantham et al., 2012). However, in vivo results
showed limited benefit due to the failure of sufficient homing of stem cells, even a large
number of cells were infused. The molecular adhesive factors regulating cell
engraftment have been investigated and pre-treatment methods with SDF-1α or
hydrogen dioxide were used to enhance HSC homing (Kavanagh, 2010, Yemm, 2014). In
addition to the adhesive molecules, the physical properties of cells may play an
important role in the in vivo circulation, particularly in the pulmonary first-pass effect
where the vast number of cells was stuck in the capillaries of the lung. The size and
deformability of cells are mechanical variables that may be manipulated to enhance cell
recruitment. Moreover, inertial focusing of particles in microfluidic channels has been
actively investigated for separation of animal cells, and diagnosis of diseases based on
their physical variations. Microfluidic devices have been demonstrated to be useful for
cellular handling as they can offer precise spatial and temporal control in a miniaturize
platform (Shields IV et al., 2015). Therefore, the aim of the research presented in this
thesis was to isolate relatively smaller and/or more deformable HSCs with the
expectation that the recruitment efficiency could be enhanced when cells of interest
were infused into injured mice. Prior to microfluidic cell separation, it is essential to
characterise the mechanical variations of individual cells in one cell population and
between different cell types with reliable methods. The major findings in this study
include the following:
For cell diameter, MSCs > HSCs > neutrophils, and pre-treatment with SDF-1α or
H2O2 did not affect the cell size of HSCs.
Neutrophils and HSCs showed rupture behavior when they were compressed to
large deformations, while MSCs did not show clear rupture under compression.

Chapter 6 Overall Conclusions and Recommendations for Future Work
188
The mechanical strength data obtained suggest that neutrophils were significantly
stronger than HSCs when the cells were exposed to forces which were sufficient to
induce disruption of the cell structure.
Values of Young’s modulus determined from the force versus data from
compression of cells to large deformations demonstrated that neutrophils were
significantly stiffer than MSCs and HPC-7’s, and MSCs showed similar stiffness to
HPC-7’s though the former were significantly bigger.
HSCs became weaker after pre-treating with SDF-1α or H2O2 when the cells were
compressed by a micromanipulation probe which induced large deformations on
the whole cell scale.
Values of Young’s modulus for cell membrane indicated that the surface of cells pre-
treated with SDF-1α or H2O2 became stiffer than those in the PBS control sample.
Moreover, H2O2 pre-treatment induced more significant change in stiffness
compared to SDF-1α’s effects.
Flow cytometry analyses showed that SDF-1α or H2O2 could induce F-actin
accumulation compared to PBS control group, H2O2 induced a more significant
change in F-actin content than SDF-1ɑ which is coordinated with the change of
nano-mechanics measured by AFM.
HSCs pre-treated with SDF-1ɑ or H2O2 appeared to lose their characteristic shapes
(more rounded morphologies in PBS control group) as F-actin network was
disrupted, replaced by a more diffuse pattern.
In one HSC population, the size and nominal rupture stress of individual cells
showed normal distributions, and this suggests that cells were able to be classified
based on their mechanical difference.
The straight microchannel with a higher AR (10) achieved relatively more effective
separation than lower AR (5), and a significant difference in σR between different
sub-populations after the separation was observed at the higher flow rate.
In a spiral channel, cells were initially dragged towards the outer wall of the channel
when the Re was low ( < 1.78); with increasing Re, a part of cells shifted to the
Chapter 6 Overall Conclusions and Recommendations for Future Work
189
inner half of the channel. In this segregate regime (15 < Re < 36), cells of interest
were isolated from the inner outlet; all cells eventually focused towards the inner
wall as Re further increased.
In spiral channels, at the intermediate flow conditions (5 mL/h, 7.5 mL/h and 10
mL/h), more effective separation was achieved at relatively faster flow rates.
Device C was able to separate cells of interest with higher efficiency at a flow rate
of 10 mL/h than 5 mL/h and 7.5 mL/h, and was utilized for subsequent in vivo
studies.
HSCs isolated from the inner outlet showed a significant increase of the free flowing
cells intravitally compared to those harvested from the outer outlet, but numbers of
the adherent cells were similar between the two groups.
Activation of CD8+ T-cells was accompanied by an increase in T cell volume, and a
concurrent decrease in the Young’s modulus value as determined by the force
versus displacement data up to a nominal deformation of 10% was observed.
Nominal rupture tension determined by compressing single T cells to large
deformation until rupture, decreased from day 0 to day 2, and then recovered on
day 4 post-activation.
The mechanical properties of different cell types mirror their in vivo functional
distinctions. For neutrophils, which naturally exisit in the circulation as spherical entities,
and HSCs which can be made to do so, the ‘cortical shell - liquid core’ model is an
advantageous strategy as their free circulation may be attributed to the self-rotation of
individual cells in response to shear stress, similar to liquid drops under a driving flow
(Abkarian and Viallat, 2005, Hur et al., 2011, Chau et al., 2013). MSCs, not naturally
designed to circulate in the peripheral blood, generally adhere to each other or to their
substrate throughout their lifetime, and so the ‘homogenous solid state’ cellular
structure plays an important role in transmitting and distributing mechanical stress
within the cell (Stamenović and Ingber, 2002).
Chapter 6 Overall Conclusions and Recommendations for Future Work
190
For pretreated HSCs, the cells as a whole became weaker and more deformable after
using micromanipulation, while the HSC surface stiffened after pre-treating with SDF-1α
and H2O2 in AFM test. The softening may be due to the re-organization/disruption of
actin filaments from highly-ordered 3-D structure to a more diffuse pattern. And the
stiffening of cell surface after pre-treatment can potentially be explained by the
expansion and polymerization of F-actin interacting with the plasma membrane. Indeed,
the increased immunostaining of F-actin filaments noted (higher component
concentration) in the cortical membrane after pre-treatment may allow for the
observed increase in the elasticity modulus at small deformations.
The relationships between between cell size / deformability and the inertial lift force in
straight channel and the ratio (Rf) of inertial lift force to Dean drag force in curved
microchannel were exploited to separate sub-populations of smaller and/or more
deformable HPC-7s for in vivo studies. The cell focusing behaviours in straight channels
could be explained by taking the two competing lift forces into account: the shear-
gradient lift force directing to the channel walls and the wall-induced lift force in the
direction of the channel centerline. At smaller AR, as increasing flow rate, the shear-
gradient lift force may increase more rapidly than the wall-induced lift force, becoming
more dominant, and consequently, dragging more cells towards the channel wall.
Smaller and softer cells are supposed to migrate more slowly and be entrained near the
channel centre. At higher AR, the velocity profile became flattened across the width,
with the increase of Re, the increase of wall-induced lift force might be more rapid than
that of shear-gradient lift force. Consequently, more cells migrated to the channel
centerline, with the bigger cells moved more abruptly than smaller ones.
For curved channels, Dean drag follows the underlying secondary velocity field, directing
outwards near the channel centre, and inwards near the up and bottom walls. The
curvature can also change the shear-gradient lift force through redistributing the
velocity profile which can change the vertical position of particles (De Vriend, 1981, Hille

Chapter 6 Overall Conclusions and Recommendations for Future Work
191
et al., 1985). It is hypothesized that at slow velocities wall-induced inertial became more
dominant than the shear gradient inertial in height direction, allowing cells to reach
vertical equilibrium positions near the channel centre. By crossing the vertical position,
the bigger and/or rigid cells moved faster towards the centre and then experienced a
switch in the direction of Dean flow, moving outwards of the channel. Smaller and/or
more deformable cells near top or bottom walls moved inwards, thus separation can be
achieved. As the increasing Re, the shear gradient may become high enough to counter
FD, more cells tended to move away from the channel centre and were directed towards
the inner half, eventually, 100% of cells were dragged inwards.
6.2 Future work
In this study, the mechanical properties of HSCs were characterized at different
deformations using both micromanipulation and AFM methods. Evidence has suggested
that MSCs can be protective in animal models of injury (Fang et al., 2004), though the
molecular mechanisms that govern the retention of these cells to injury sites are
unknown, and the physical obstacle is also a problem that needs to be addressed for
further investigations. It has been found that the micromanipulation technique based
on biometrical compression may not be appropriate to probe the mechanical strength
of MSCs which did not show clear rupture under compression, and AFM used was not
able to do force scanning on cells that are bigger than the greatest movement of the
cantilever (15 μm). Improvement of these techniques or using other techniques is
required to further study mechanics of MSCs, as well as their cytoskeletal structures
that distinguish them from HSCs in response to a wide range of mechanical loads.
This study has identified ranges of flowing and geometry parameters that allow for
deformability/ size-based cell separation and suggested physical principles and forces
that are likely responsible for it. Even though the microfluidic devices have been
Chapter 6 Overall Conclusions and Recommendations for Future Work
192
successfully utilized in sorting smaller and more deformable cells, some challenges will
exist in that they should be accurately operated, and more robust and reliable
microfluidic systems are required. For example, the limited lifespan of microfluidic chips,
which are typically shortened due to blocking or clogging, is a barrier to routine research.
The commercialization of cell sorting technologies may look for disposable chips to
overcome the short lifetimes and enable a sterile, user-friendly operation. Additionally,
these microfluidic cell sorting systems require complex sample preparation and channel
cleaning that reduce ease-of-use and can compromise sorting accuracies due to user
variations. Therefore, building microfluidic devices that require minimal sample
preparation is desirable. Finally, the heterogeneity and complexity of biological cells in
different proliferation stages could affect the repeatability and reproducibility of cell
sorting results. It is believed that these challenges are solvable, and given the great
interest and innovation in this area, microfluidic cell assay systems may soon become
irreplaceable in cellular biology.
In this study, since cells were sorted from the same population, the separation purity
and efficiency which were presented only by the values of size and nominal rupture
stress from each outlets may not be able to fully describe the performance of the device.
Thus a comparative table of performance metrics that accurately demonstrate the
degree of performance will be required. In addition, though some hypotheses on the
principle of cell migration have been made, the precise mechanisms by which the
cells/particles focus in microchannels still remain to be fully understood. Therefore,
further experimental and simulation studies are required to fully predict the behaviours
of deformable cells or liquid drops inside the microfluidic devices.
Despite the relative smaller and softer properties of isolated HPC-7 cells, they are still
significantly bigger than the capillaries, thus, most infused HPC-7’s were accumulated in
the lungs and were finally lost from circulation. In order to further augment the cell
recruitment, future work can be focused on increasing separation efficiency of cell in
microfluidic systems and combining microfluidic technologies with biological strategies,
Chapter 6 Overall Conclusions and Recommendations for Future Work
193
such as genetic modification and chemical pre-treatment, making more cells migrating
to injured sites. In this study, sub-populations of HSCs were isolated merely based on
their mechanical differences, followed by intravital study. Since the mechanical
properties can be determined by cytoskeletal structure, which is further affected by the
physiological condition of cells, therefore, the biological properties of isolated cells
should be tested in future work to confirm the contribution of mechanical properties on
cell circulation.
References
194
References
ABKARIAN, M. & VIALLAT, A. 2005. Dynamics of vesicles in a wall-bounded shear flow. Biophysical Journal, 89, 1055-1066.
AMINI, H., LEE, W. & DI CARLO, D. 2014. Inertial microfluidic physics. Lab on a Chip, 14, 2739-2761.
ÄHRLUND-RICHTER, L., DE LUCA, M., MARSHAK, D. R., MUNSIE, M., VEIGA, A. & RAO, M. 2009. Isolation and production of cells suitable for human therapy: challenges ahead. Cell Stem Cell, 4, 20-26.
ALENGHAT, F. J., FABRY, B., TSAI, K. Y., GOLDMANN, W. H. & INGBER, D. E. 2000. Analysis of cell mechanics in single vinculin-deficient cells using a magnetic tweezer. Biochemical and Biophysical Research Communications, 277, 93-99.
ALMEIDA-PORADA, G., FLAKE, A. W., GLIMP, H. A. & ZANJANI, E. D. 1999. Cotransplantation of stroma results in enhancement of engraftment and early expression of donor hematopoietic stem cells in utero. Experimental Hematology, 27, 1569-1575.
AMINI, H., LEE, W. & DI CARLO, D. 2014. Inertial microfluidic physics. Lab on a Chip, 14, 2739-2761.
ANKLESARIA, P., KASE, K., GLOWACKI, J., HOLLAND, C. A., SAKAKEENY, M. A., WRIGHT, J. A., FITZGERALD, T. J., LEE, C.-Y. & GREENBERGER, J. S. 1987. Engraftment of a clonal bone marrow stromal cell line in vivo stimulates hematopoietic recovery from total body irradiation. Proceedings of the National Academy of Sciences, 84, 7681-7685.
ANKRUM, J. & KARP, J. M. 2010. Mesenchymal stem cell therapy: two steps forward, one step back. Trends in molecular medicine, 16, 203-209.
ASMOLOV, E. S. 1999. The inertial lift on a spherical particle in a plane Poiseuille flow at large channel Reynolds number. Journal of Fluid Mechanics, 381, 63-87.
AURICH, I., MUELLER, L. P., AURICH, H., LUETZKENDORF, J., TISLJAR, K., DOLLINGER, M. M., SCHORMANN, W., WALLDORF, J., HENGSTLER, J. G. & FLEIG, W. E. 2007. Functional integration of hepatocytes derived from human mesenchymal stem cells into mouse livers. Gut, 56, 405-415.
BARANIAK P. R. & MCDEVITT T. C. 2010. Stem cell paracrine actions and tissue regeneration. Regen Med, 5(1), 121-43.
BANSOD, Y. D. & BURSA, J. 2015. Continuum-based modelling approaches for cell mechanics. World Academy of Science, Engineering and Technology,
References
195
International Journal of Biological, Biomolecular, Agricultural, Food and Biotechnological Engineering, 9, 921-932.
BERGER, S., TALBOT, L. & YAO, L. 1983. Flow in curved pipes. Annual review of Fluid Mechanics, 15, 461-512. BHAGAT, A. A. S., BOW, H., HOU, H. W., TAN, S. J., HAN, J. & LIM, C. T. 2010.
Microfluidics for cell separation. Medical & biological engineering & computing, 48, 999-1014.
BHAGAT, A. A. S., KUNTAEGOWDANAHALLI, S. S. & PAPAUTSKY, I. 2008a. Continuous particle separation in spiral microchannels using dean flows and differential migration. Lab on a Chip, 8, 1906-1914.
BHAGAT, A. A. S., KUNTAEGOWDANAHALLI, S. S. & PAPAUTSKY, I. 2008b. Enhanced particle filtration in straight microchannels using shear-modulated inertial migration. Physics of Fluids, 20, 101702.
BOYLE, A. J., SCHULMAN, S. P. & HARE, J. M. 2006. Stem cell therapy for cardiac repair ready for the next step. Circulation, 114, 339-352.
BROWN, M. J., HALLAM, J. A., COLUCCI-GUYON, E. & SHAW, S. 2001. Rigidity of circulating lymphocytes is primarily conferred by vimentin intermediate filaments. The Journal of Immunology, 166, 6640-6646.
BUCKLEY, R. H., SCHIFF, S. E., SCHIFF, R. I., MARKERT, M. L., WILLIAMS, L. W., ROBERTS, J. L., MYERS, L. A. & WARD, F. E. 1999. Hematopoietic stem-cell transplantation for the treatment of severe combined immunodeficiency. New England Journal of Medicine, 340, 508-516.
BUTCHER, E. 1991. Leukocyte-endothelial cell recognition: three (or more) steps to specificity and diversity. Cell, 67, 1033.
CALDWELL, K. D., CHENG, Z.-Q., HRADECKY, P. & GIDDINGS, J. C. 1984. Separation of human and animal cells by steric field-flow fractionation. Cell Biophysics, 6, 233-251.
CAI, X. XING, J. CAI, Q. CHEN, S. WU, F. HUANG. 2010. Connection between biomechanics and cytoskeleton structure of lymphocyte and jurkat cells: an AFM study. Micron, 41, 257-262. KLEBANOFF, C. A., GATTINONI, L., & RESTIFO, N. P. 2012. Sorting through subsets: which
T cell populations mediate highly effective adoptive immunotherapy? Journal of Immunotherapy, 35, 651-660.
CEPOK, S., ZHOU, D., SRIVASTAVA, R., NESSLER, S., STEI, S., BÜSSOW, K., SOMMER, N. & HEMMER, B. 2005. Identification of Epstein-Barr virus proteins as putative targets of the immune response in multiple sclerosis. The Journal of clinical investigation, 115, 1352-1360.
CHEN B. P., GALY A. M., & FRASER C. 1997. Delineation of the human hematolymphoid system: potential applications of defined cell populations in cellular therapy. Immunol Rev, 157, 41-51. CEPOK, S., ZHOU, D., SRIVASTAVA, R., NESSLER, S., STEI, S., BÜSSOW, K., SOMMER, N. &
HEMMER, B. 2005. Identification of Epstein-Barr virus proteins as putative targets of the immune response in multiple sclerosis. The Journal of clinical investigation, 115, 1352-1360.
References
196
CHAUDHURI, O., PAREKH, S. H. & FLETCHER, D. A. 2007. Reversible stress softening of actin networks. Nature, 445, 295-298.
CHAU, L.-H., LIANG, W., CHEUNG, F. W. K., LIU, W. K., LI, W. J., CHEN, S.-C. & LEE, G.-B. 2013. Self-rotation of cells in an irrotational AC E-field in an opto-electrokinetics chip. PloS one, 8, e51577.
CHUNG, J. STEFANSKI, O. BORQUEZ-OJEDA, M. OLSZEWSKA. Efficacy and toxicity management of 19-28z car t cell therapy in b cell acute lymphoblastic leukemia. Science Translational Medicine 6 (2014) 224RA225-224RA225.
COPELAN, E. A. 2006. Hematopoietic stem-cell transplantation. New England Journal of Medicine, 354, 1813-1826.
COLLARD, C. D. & GELMAN, S. 2001. Pathophysiology, clinical manifestations, and prevention of ischemia-reperfusion injury. The Journal of the American Society of Anesthesiologists, 94, 1133-1138.
DARLING, E. M., TOPEL, M., ZAUSCHER, S., VAIL, T. P. & GUILAK, F. 2008. Viscoelastic properties of human mesenchymally-derived stem cells and primary osteoblasts, chondrocytes, and adipocytes. Journal of biomechanics, 41, 454-464.
DAO, M., LIM, C. T. & SURESH, S. 2003. Mechanics of the human red blood cell deformed by optical tweezers. Journal of the Mechanics and Physics of Solids, 51, 2259-2280.
DE VRIEND, H. 1981. Velocity redistribution in curved rectangular channels. Journal of Fluid Mechanics, 107, 423-439.
DI CARLO, D., IRIMIA, D., TOMPKINS, R. G. & TONER, M. 2007. Continuous inertial focusing, ordering, and separation of particles in microchannels. Proceedings of the National Academy of Sciences, 104, 18892-18897.
DODSON, B. P. & LEVINE, A. D. 2015. Challenges in the translation and commercialization of cell therapies. BMC Biotechnology, 15, 70-85.
DORWEILER, B., PRUEFER, D., ANDRASI, T. B., MAKSAN, S. M., SCHMIEDT, W., NEUFANG, A. & VAHL, C. F. 2007. Ischemia-reperfusion injury. European Journal of Trauma and Emergency Surgery, 33, 600-612.
DI CARLO, D. 2009. Inertial microfluidics. Lab on a Chip, 9, 3038-3046. DI CARLO, D., EDD, J. F., IRIMIA, D., TOMPKINS, R. G. & TONER, M. 2008. Equilibrium
separation and filtration of particles using differential inertial focusing. Analytical chemistry, 80, 2204-2211.
Du M, KALIA N, FRUMENTO G, CHEN F, ZHANG Z. 2016. Biomechanical properties of human T cells in the process of activation based on diametric compression by micromanipulation. Med Eng Phys. 40, 20-27.
M.L. DAVILA, I. RIVIERE, X. WANG, S. BARTIDO, J. PARK, K. CURRAN, S.S. DOERSCHUK, C. M., BEYERS, N., COXSON, H., WIGGS, B. & HOGG, J. 1993. Comparison of
neutrophil and capillary diameters and their relation to neutrophil sequestration in the lung. Journal of Applied Physiology, 74, 3040-3045.
EGGLETON, C. D. & POPEL, A. S. 1998. Large deformation of red blood cell ghosts in a simple shear flow. Physics of Fluids, 10, 1834-1845.
EINSTEIN, O. & BEN-HUR, T. 2008. The changing face of neural stem cell therapy in neurologic diseases. Archives of neurology, 65, 452-456.
References
197
FANG, B., SHI, M., LIAO, L., YANG, S., LIU, Y. & ZHAO, R. C. 2004. Systemic infusion of FLK1+ mesenchymal stem cells ameliorate carbon tetrachloride-induced liver fibrosis in mice. Transplantation, 78, 83-88.
FEUCHTINGER, T., MATTHES‐MARTIN, S., RICHARD, C., LION, T., FUHRER, M., HAMPRECHT, K., HANDGRETINGER, R., PETERS, C., SCHUSTER, F. R. & BECK, R. 2006. Safe adoptive transfer of virus‐specific T‐cell immunity for the treatment of systemic adenovirus infection after allogeneic stem cell transplantation. British journal of haematology, 134, 64-76.
FERGUSON, L. A., MUDDAMALLAPPA, M. & WALTON, J. R. 2015. Numerical simulation of mode-III fracture incorporating interfacial mechanics. International Journal of Fracture, 192, 47-56.
FLETCHER, D. A. & MULLINS, R. D. 2010. Cell mechanics and the cytoskeleton. Nature, 463, 485-492.
FLEISCHER, F., ANANTHAKRISHNAN, R., ECKEL, S., SCHMIDT, H., KÄS, J., SVITKINA, T., SCHMIDT, V. & BEIL, M. 2007. Actin network architecture and elasticity in lamellipodia of melanoma cells. New Journal of Physics, 420, 1-17.
FONG, C. Y., PEH, G. S., GAUTHAMAN, K. & BONGSO, A. 2009. Separation of SSEA-4 and TRA-1–60 labelled undifferentiated human embryonic stem cells from a heterogeneous cell population using magnetic-activated cell sorting (MACS) and fluorescence-activated cell sorting (FACS). Stem Cell Reviews and Reports, 5, 72-80.
FRATICELLI, A., SERRANO, C. V., BOCHNER, B. S., CAPOGROSSI, M. C. & ZWEIER, J. L. 1996. Hydrogen peroxide and superoxide modulate leukocyte adhesion molecule expression and leukocyte endothelial adhesion. Biochimica et Biophysica Acta (BBA)-Molecular Cell Research, 1310, 251-259.
FRIEDL, P., WOLF, K. & LAMMERDING, J. 2011. Nuclear mechanics during cell migration. Current Opinion in Cell Biology, 23, 55-64.
GALLACHER, L., MURDOCH, B., WU, D. M., KARANU, F. N., KEENEY, M. & BHATIA, M. 2000. Isolation and characterization of human CD34− Lin− and CD34+ Lin− hematopoietic stem cells using cell surface markers AC133 and CD7. Blood, 95, 2813-2820.
GARBERN, J. C. & LEE, R. T. 2013. Cardiac stem cell therapy and the promise of heart regeneration. Cell stem cell, 12, 689-698.
GARDEL, M., SHIN, J., MACKINTOSH, F., MAHADEVAN, L., MATSUDAIRA, P. & WEITZ, D. 2004. Elastic behavior of cross-linked and bundled actin networks. Science, 304, 1301-1305.
GE, J., GUO, L., WANG, S., ZHANG, Y., CAI, T., ZHAO, R. C. & WU, Y. 2014. The size of mesenchymal stem cells is a significant cause of vascular obstructions and stroke. Stem Cell Reviews and Reports, 10, 295-303.
GOODELL, M. A., BROSE, K., PARADIS, G., CONNER, A. S. & MULLIGAN, R. C. 1996. Isolation and functional properties of murine hematopoietic stem cells that are replicating in vivo. The Journal of experimental medicine, 183, 1797-1806.

References
198
GOSSETT, D. R., WEAVER, W. M., MACH, A. J., HUR, S. C., TSE, H. T. K., LEE, W., AMINI, H. & DI CARLO, D. 2010. Label-free cell separation and sorting in microfluidic systems. Analytical and bioanalytical chemistry, 397, 3249-3267.
GOSSETT, D. R. & CARLO, D. D. 2009. Particle focusing mechanisms in curving confined flows. Analytical chemistry, 81, 8459-8465.
GUNSILIUS, E., GASTL, G. & PETZER, A. 2001. Hematopoietic stem cells. Biomedicine & pharmacotherapy, 55, 186-194.
GAO, J., DENNIS, J. E., MUZIC, R. F., LUNDBERG, M. & CAPLAN, A. I. 2001. The dynamic in vivo distribution of bone marrow-derived mesenchymal stem cells after infusion. Cells Tissues Organs, 169, 12-20.
GOSSETT, D. R., TSE, H. T. K., DUDANI, J. S., GODA, K., WOODS, T. A., GRAVES, S. W. & DI CARLO, D. 2012. Inertial manipulation and transfer of microparticles across laminar fluid streams. Small, 8, 2757-2764.
GUAN, G., WU, L., BHAGAT, A. A., LI, Z., CHEN, P. C., CHAO, S., ONG, C. J. & HAN, J. 2013. Spiral microchannel with rectangular and trapezoidal cross-sections for size based particle separation. Scientific reports, 3, 1475.
HIASA, K.-I., ISHIBASHI, M., OHTANI, K., INOUE, S., ZHAO, Q., KITAMOTO, S., SATA, M., ICHIKI, T., TAKESHITA, A. & EGASHIRA, K. 2004. Gene Transfer of Stromal Cell–Derived Factor-1α Enhances Ischemic Vasculogenesis and Angiogenesis via Vascular Endothelial Growth Factor/Endothelial Nitric Oxide Synthase–Related Pathway Next-Generation Chemokine Therapy for Therapeutic Neovascularization. Circulation, 109, 2454-2461.
HOCHMUTH, R. M. 2000. Micropipette aspiration of living cells. Journal of biomechanics, 33, 15-22.
HOLM, S. H., BEECH, J. P., BARRETT, M. P. & TEGENFELDT, J. O. 2011. Separation of parasites from human blood using deterministic lateral displacement. Lab on a Chip, 11, 1326-1332.
HOOD, K., LEE, S. & ROPER, M. 2015. Inertial migration of a rigid sphere in three-dimensional Poiseuille flow. Journal of Fluid Mechanics, 765, 452-479.
HOULIHAN, D. D., MABUCHI, Y., MORIKAWA, S., NIIBE, K., ARAKI, D., SUZUKI, S., OKANO, H. & MATSUZAKI, Y. 2012. Isolation of mouse mesenchymal stem cells on the basis of expression of Sca-1 and PDGFR-α. Nature protocols, 7, 2103-2111.
HOULIHAN, D. D. & NEWSOME, P. N. 2008. Critical review of clinical trials of bone marrow stem cells in liver disease. Gastroenterology, 135, 438-450.
HORWITZ, E. M., PROCKOP, D. J., FITZPATRICK, L. A., KOO, W. W., GORDON, P. L., NEEL, M., SUSSMAN, M., ORCHARD, P., MARX, J. C. & PYERITZ, R. E. 1999. Transplantability and therapeutic effects of bone marrow-derived mesenchymal cells in children with osteogenesis imperfecta. Nature medicine, 5, 309-313.
HUR, S. C., HENDERSON-MACLENNAN, N. K., MCCABE, E. R. & DI CARLO, D. 2011. Deformability-based cell classification and enrichment using inertial microfluidics. Lab on a Chip, 11, 912-920.
SWEET, R. G. & HERZENBERG, L. A. 1976. Fluorescence-activated cell sorting. Sci Am, 234, 108-117.
References
199
HILLE, P., VEHRENKAMP, R. & SCHULZ-DUBOIS, E. 1985. The development and structure of primary and secondary flow in a curved square duct. Journal of Fluid Mechanics, 151, 219-241.
HOU, H. W., WARKIANI, M. E., KHOO, B. L., LI, Z. R., SOO, R. A., TAN, D. S.-W., LIM, W.-T., HAN, J., BHAGAT, A. A. S. & LIM, C. T. 2013. Isolation and retrieval of circulating tumor cells using centrifugal forces. Scientific reports, 3, 1259.
INGLIS, D. W., LORD, M. & NORDON, R. E. 2011. Scaling deterministic lateral displacement arrays for high throughput and dilution-free enrichment of leukocytes. Journal of Micromechanics and Microengineering, 21, 054024.
JANMEY, P. A. & MCCULLOCH, C. A. 2007. Cell mechanics: integrating cell responses to mechanical stimuli. Annu. Rev. Biomed. Eng., 9, 1-34.
JEEVANANTHAM, V., BUTLER, M., SAAD, A., ABDEL-LATIF, A., ZUBA-SURMA, E. K. & DAWN, B. 2012. Adult bone marrow cell therapy improves survival and induces long-term improvement in cardiac parameters: a systematic review and meta-analysis. Circulation, 111.086074.
JI, H. M., SAMPER, V., CHEN, Y., HENG, C. K., LIM, T. M. & YOBAS, L. 2008. Silicon-based microfilters for whole blood cell separation. Biomedical microdevices, 10, 251-257.
JOHNSTONE, B., HERING, T. M., CAPLAN, A. I., GOLDBERG, V. M. & YOO, J. U. 1998. In vitrochondrogenesis of bone marrow-derived mesenchymal progenitor cells. Experimental cell research, 238, 265-272.
KARNIS, A., GOLDSMITH, H. & MASON, S. 1966. The flow of suspensions through tubes: V. Inertial effects. The Canadian Journal of Chemical Engineering, 44, 181-193.
KARP, J. M. & TEO, G. S. L. 2009. Mesenchymal stem cell homing: the devil is in the details. Cell stem cell, 4, 206-216.
KAVANAGH, D. P., YEMM, A. I., ALEXANDER, J. S., FRAMPTON, J. & KALIA, N. 2013a. Enhancing the adhesion of hematopoietic precursor cell integrins with hydrogen peroxide increases recruitment within murine gut. Cell transplantation, 22, 1485-1499.
KAVANAGH, D. P., YEMM, A. I., ZHAO, Y., FRAMPTON, J. & KALIA, N. 2013b. Mechanisms of adhesion and subsequent actions of a haematopoietic stem cell line, HPC-7, in the injured murine intestinal microcirculation in vivo. PloS one, 8, e59150.
KAVANAGH, D. P. J. & KALIA, N. 2011. Hematopoietic stem cell homing to injured tissues. Stem Cell Reviews and Reports, 7, 672-682.
KAVANAGH, D. P., SURESH, S., NEWSOME, P. N., FRAMPTON, J. & KALIA, N. 2015. Pretreatment of Mesenchymal Stem Cells Manipulates Their Vasculoprotective Potential While Not Altering Their Homing Within the Injured Gut. Stem Cells, 33, 2785-2797.
KILIMNIK, A., MAO, W. & ALEXEEV, A. 2011. Inertial migration of deformable capsules in channel flow. Physics of Fluids (1994-present), 23, 123302.
KIRMIZIS, D. & LOGOTHETIDIS, S. 2010. Atomic force microscopy probing in the measurement of cell mechanics. Int J Nanomedicine, 5, e45.
References
200
KLEBANOFF, C. A., GATTINONI, L. & RESTIFO, N. P. 2012. Sorting through subsets: Which T cell populations mediate highly effective adoptive immunotherapy? Journal of immunotherapy (Hagerstown, Md.: 1997), 35, 651-660.
KOBAYASHI, M., IMAMURA, M., SAKURADA, K., MAEDA, S., IWASAKI, H., TSUDA, Y., MUSASHI, M., MIYAZAKI, T. & UEDE, T. 1994. Expression of adhesion molecules on human hematopoietic progenitor cells at different maturational stages. Stem Cells, 12, 316-321.
KOÇ, O. N., GERSON, S. L., COOPER, B. W., DYHOUSE, S. M., HAYNESWORTH, S. E., CAPLAN, A. I. & LAZARUS, H. M. 2000. Rapid hematopoietic recovery after coinfusion of autologous-blood stem cells and culture-expanded marrow mesenchymal stem cells in advanced breast cancer patients receiving high-dose chemotherapy. Journal of Clinical Oncology, 18, 307-316.
KODITUWAKKU, A. P., JESSUP, C., ZOLA, H. & ROBERTON, D. M. 2003. Isolation of antigen-specific B cells. Immunology and cell biology, 81, 163-170.
KOLACZKOWSKA, E. & KUBES, P. 2013. Neutrophil recruitment and function in health and inflammation. Nature Reviews Immunology, 13, 159-175.
KUZNETSOVA, T. G., STARODUBTSEVA, M. N., YEGORENKOV, N. I., CHIZHIK, S. A. & ZHDANOV, R. I. 2007. Atomic force microscopy probing of cell elasticity. Micron, 38, 824-833.
KING, R. C., BINNS, O. A., RODRIGUEZ, F., KANITHANON, R. C., DANIEL, T. M., SPOTNITZ, W. D., TRIBBLE, C. G. & KRON, I. L. 2000. Reperfusion injury significantly impacts clinical outcome after pulmonary transplantation. The Annals of thoracic surgery, 69, 1681-1685.
KIM, S. U. & VELLIS, J. 2009. Stem cell‐based cell therapy in neurological diseases: A review. Journal of neuroscience research, 87, 2183-2200.
KUMAR, S. & PONNAZHAGAN, S. 2007. Bone homing of mesenchymal stem cells by ectopic α4 integrin expression. The FASEB Journal, 21, 3917-3927.
LAZARUS, H. M., KOC, O. N., DEVINE, S. M., CURTIN, P., MAZIARZ, R. T., HOLLAND, H. K., SHPALL, E. J., MCCARTHY, P., ATKINSON, K. & COOPER, B. W. 2005. Cotransplantation of HLA-identical sibling culture-expanded mesenchymal stem cells and hematopoietic stem cells in hematologic malignancy patients. Biology of Blood and Marrow Transplantation, 11, 389-398.
LI, Y., CHEN, J., CHEN, X., WANG, L., GAUTAM, S., XU, Y., KATAKOWSKI, M., ZHANG, L., LU, M. & JANAKIRAMAN, N. 2002. Human marrow stromal cell therapy for stroke in rat neurotrophins and functional recovery. neurology, 59, 514-523.
LIM, C., ZHOU, E. & QUEK, S. 2006. Mechanical models for living cells—a review. Journal of biomechanics, 39, 195-216.
LIU, C., HU, G., JIANG, X. & SUN, J. 2015. Inertial focusing of spherical particles in rectangular microchannels over a wide range of Reynolds numbers. Lab on a Chip, 15, 1168-1177.
LIU, M. 2010. Understanding the mechanical strength of microcapsules and their adhesion on fabric surfaces. University of Birmingham.
References
201
LIU, F., WU, D. & CHEN, K. 2014. A Zebrafish Embryo Behaves both as a “Cortical Shell–Liquid Core” Structure and a Homogeneous Solid when Experiencing Mechanical Forces. Microscopy and Microanalysis, 20, 1841-1847.
LIU, Z., HUANG, F., DU, J., SHU, W., FENG, H., XU, X. & CHEN, Y. 2013. Rapid isolation of cancer cells using microfluidic deterministic lateral displacement structure. Biomicrofluidics, 7, 011801.
LYDEN, D., HATTORI, K., DIAS, S., COSTA, C., BLAIKIE, P., BUTROS, L., CHADBURN, A., HEISSIG, B., MARKS, W. & WITTE, L. 2001. Impaired recruitment of bone-marrow–derived endothelial and hematopoietic precursor cells blocks tumor angiogenesis and growth. Nature Medicine, 7, 1194-1201.
LICHTENSTEIN, G. R., HANAUER, S. B. & SANDBORN, W. J. 2009. Management of Crohn's disease in adults. Am J Gastroenterol, 104, 465-483.
MACKAY, A. M., BECK, S. C., MURPHY, J. M., BARRY, F. P., CHICHESTER, C. O. & PITTENGER, M. F. 1998. Chondrogenic differentiation of cultured human mesenchymal stem cells from marrow. Tissue Engineering, 4, 415-428.
MCFAUL, S. M., LIN, B. K. & MA, H. 2012. Cell separation based on size and deformability using microfluidic funnel ratchets. Lab on a chip, 12, 2369-2376.
MARTENS, J. C. & RADMACHER, M. 2008. Softening of the actin cytoskeleton by inhibition of myosin II. Pflügers Archiv-European Journal of Physiology, 456, 95-100.
MASHMOUSHY, H., ZHANG, Z. & THOMAS, C. 1998. Micromanipulation measurement of the mechanical properties of baker's yeast cells. Biotechnology Techniques, 12, 925-929.
MERCADÉ-PRIETO, R. & ZHANG, Z. 2012. Mechanical characterization of microspheres–capsules, cells and beads: a review. Journal of microencapsulation, 29, 277-285.
MIZGERD, J. P. 2002. Molecular mechanisms of neutrophil recruitment elicited by bacteria in the lungs. Seminars in immunology, 123-132.
MILTENYI, S., MÜLLER, W., WEICHEL, W. & RADBRUCH, A. 1990. High gradient magnetic cell separation with MACS. Cytometry, 11, 231-238.
BROWN M. J., HALLAM, J. A., COLUCCI-GUYON, E. & SHAW. S. 2001. Rigidity of circulating lymphocytes is primarily conferred by vimentin intermediate filaments. The Journal of Immunology, 166, 6640-6646.
MOOSMANN, A., BIGALKE, I., TISCHER, J., SCHIRRMANN, L., KASTEN, J., TIPPMER, S., LEEPING, M., PREVALŠEK, D., JAEGER, G. & LEDDEROSE, G. 2010. Effective and long-term control of EBV PTLD after transfer of peptide-selected T cells. Blood, 115, 2960-2970.
MORRISON, S. J., UCHIDA, N. & WEISSMAN, I. L. 1995. The biology of hematopoietic stem cells. Annual review of cell and developmental biology, 11, 35-71.
MARTEL, J. M. & TONER, M. 2012. Inertial focusing dynamics in spiral microchannels. Physics of Fluids, 24, 032001.
MARTEL, J. M. & TONER, M. 2013. Particle focusing in curved microfluidic channels. Scientific Reports, 3, 3340-3348.
NAUSEEF, W. M. 2007. Isolation of human neutrophils from venous blood. Neutrophil Methods and Protocols, 15-20.

References
202
NGUYEN, B. V., WANG, Q. G., KUIPER, N. J., EL HAJ, A. J., THOMAS, C. R. & ZHANG, Z. 2010. Biomechanical properties of single chondrocytes and chondrons determined by micromanipulation and finite-element modelling. Journal of The Royal Society Interface, 7, 1723-1733.
NGUYEN, B. V., WANG, Q., KUIPER, N. J., EL HAJ, A. J., THOMAS, C. R. & ZHANG, Z. 2009a. Strain-dependent viscoelastic behaviour and rupture force of single chondrocytes and chondrons under compression. Biotechnol Lett, 31, 803-9.
NGUYEN, B. V., WANG, Q., KUIPER, N. J., EL HAJ, A. J., THOMAS, C. R. & ZHANG, Z. 2009b. Strain-dependent viscoelastic behaviour and rupture force of single chondrocytes and chondrons under compression. Biotechnology letters, 31, 803-809.
PARK, I.-H., ZHAO, R., WEST, J. A., YABUUCHI, A., HUO, H., INCE, T. A., LEROU, P. H., LENSCH, M. W. & DALEY, G. Q. 2008. Reprogramming of human somatic cells to pluripotency with defined factors. nature, 451, 141-146.
PARKS, D., HERZENBERG, L. & HERZENBERG, L. 1989. Flow cytometry and fluorescence-activated cell sorting. Fundamental Immunology, William Paul, Ed. Raven Press, Ltd, New York.
REINHERZ, E. L., KUNG, P. C., GOLDSTEIN, G. & SCHLOSSMAN, S. F. 1979. Separation of functional subsets of human T cells by a monoclonal antibody. Proceedings of the National Academy of Sciences, 76, 4061-4065.
PEGGS, K. S., VERFUERTH, S., PIZZEY, A., KHAN, N., GUIVER, M., MOSS, P. A. & MACKINNON, S. 2003. Adoptive cellular therapy for early cytomegalovirus infection after allogeneic stem-cell transplantation with virus-specific T-cell lines. The Lancet, 362, 1375-1377.
RENNERT, R. C., SORKIN, M., GARG, R. K. & GURTNER, G. C. 2012. Stem cell recruitment after injury: lessons for regenerative medicine. Regenerative medicine, 7, 833-850.
PINTO DO Ó P, RICHTER K, & CARLSSON L. 2002. Hematopoietic progenitor/stem cells immortalized by Lhx2 generate functional hematopoietic cells in vivo. Blood, 99, 3939-3946.
PINTO DO Ó P, KOLTERUD Å, & CARLSSON L. 1998. Expression of the LIM-homeobox gene LH2 generates immortalized Steel factor-dependent multipotent hematopoietic precursors. EMBO Journal, 17, 5744-5756.
POTTER, R. & GROOM, A. 1983. Capillary diameter and geometry in cardiac and skeletal muscle studied by means of corrosion casts. Microvascular Research, 25, 68-84.
RODRIGUEZ, M. L., MCGARRY, P. J. & SNIADECKI, N. J. 2013. Review on cell mechanics: experimental and modeling approaches. Applied Mechanics Reviews, 65, 060801.
ROJAS, M., XU, J., WOODS, C. R., MORA, A. L., SPEARS, W., ROMAN, J. & BRIGHAM, K. L. 2005. Bone marrow–derived mesenchymal stem cells in repair of the injured lung. American journal of respiratory cell and molecular biology, 33, 145-152.
RODRIGUEZ-PORCEL, M. 2010. In vivo imaging and monitoring of transplanted stem cells: clinical applications. Current Cardiology Reports, 12, 51-58.
References
203
RÜSTER, B., GÖTTIG, S., LUDWIG, R. J., BISTRIAN, R., MÜLLER, S., SEIFRIED, E., GILLE, J. & HENSCHLER, R. 2006. Mesenchymal stem cells display coordinated rolling and adhesion behavior on endothelial cells. Blood, 108, 3938-3944.
SATO, Y., ARAKI, H., KATO, J., NAKAMURA, K., KAWANO, Y., KOBUNE, M., SATO, T., MIYANISHI, K., TAKAYAMA, T. & TAKAHASHI, M. 2005. Human mesenchymal stem cells xenografted directly to rat liver are differentiated into human hepatocytes without fusion. Blood, 106, 756-763.
SAITO, H., LAI, J., ROGERS, R. & DOERSCHUK, C. M. 2002. Mechanical properties of rat bone marrow and circulating neutrophils and their responses to inflammatory mediators. Blood, 99, 2207-2213.
SCHREPFER, S., DEUSE, T., REICHENSPURNER, H., FISCHBEIN, M., ROBBINS, R. & PELLETIER, M. Stem cell transplantation: the lung barrier. Transplantation proceedings, 2007. Elsevier, 573-576.
SEGERS, V. F. & LEE, R. T. 2008. Stem-cell therapy for cardiac disease. Nature, 451, 937-942.
SEGRE, G. & SILBERBERG, A. 1961. Radial Particle Displacements in Poiseuille Flow of Suspensions. Nature, 189, 209-210.
SHAMBLOTT, M. J., AXELMAN, J., WANG, S., BUGG, E. M., LITTLEFIELD, J. W., DONOVAN, P. J., BLUMENTHAL, P. D., HUGGINS, G. R. & GEARHART, J. D. 1999. Derivation of Pluripotent Stem Cells From Cultured Human Primordial Germ Cells. Obstetrical & gynecological survey, 54, 177-178.
SIA, S. K. & WHITESIDES, G. M. 2003. Microfluidic devices fabricated in poly (dimethylsiloxane) for biological studies. Electrophoresis, 24, 3563-3576.
SOHNI, A. & VERFAILLIE, C. M. 2013. Mesenchymal Stem Cells Migration Homing and Tracking. Stem Cells International, 1-8 SPANGRUDE, G. J. 1991. Hematopoietic stem-cell differentiation. Current opinion in
immunology, 3, 171-178. STAN, C. A., ELLERBEE, A. K., GUGLIELMINI, L., STONE, H. A. & WHITESIDES, G. M. 2013.
The magnitude of lift forces acting on drops and bubbles in liquids flowing inside microchannels. Lab on a Chip, 13, 365-376.
STAMENOVIĆ, D. & INGBER, D. E. 2002. Models of cytoskeletal mechanics of adherent cells. Biomechanics and modeling in mechanobiology, 1, 95-108.
STORM, C., PASTORE, J. J., MACKINTOSH, F. C., LUBENSKY, T. C. & JANMEY, P. A. 2005. Nonlinear elasticity in biological gels. Nature, 435, 191-194.
SUNG, J., YANG, H.-M., PARK, J., CHOI, G.-S., JOH, J.-W., KWON, C., CHUN, J., LEE, S.-K. & KIM, S.-J. Isolation and characterization of mouse mesenchymal stem cells. Transplantation proceedings, 2008. Elsevier, 2649-2654.
SUMMERS, C., RANKIN, S. M., CONDLIFFE, A. M., SINGH, N., PETERS, A. M. & CHILVERS, E. R. 2010. Neutrophil kinetics in health and disease. Trends in immunology, 31, 318-324.
SINGH, U. P., SINGH, N. P., SINGH, B., MISHRA, M. K., NAGARKATTI, M., NAGARKATTI, P. S. & SINGH, S. R. 2010. Stem cells as potential therapeutic targets for inflammatory bowel disease. Front Biosci (Schol Ed), 2, 993-1008.

References
204
SUN, J., LIU, C., LI, M., WANG, J., XIANYU, Y., HU, G. & JIANG, X. 2013. Size-based hydrodynamic rare tumor cell separation in curved microfluidic channels. Biomicrofluidics, 7, 011802.
SUN, J., STOWERS, C. C., BOCZKO, E. M. & LI, D. 2010. Measurement of the volume growth rate of single budding yeast with the MOSFET-based microfluidic Coulter counter. Lab on a Chip, 10, 2986-2993.
SCHMITZ, B., RADBRUCH, A., KÜMMEL, T., WICKENHAUSER, C., KORB, H., HANSMANN, M., THIELE, J. & FISCHER, R. 1994. Magnetic activated cell sorting (MACS)-a new immunomagnetic method for megakaryocytic cell isolation: comparison of different separation techniques. European Journal of Haematology, 52, 267-275.
TAKAHASHI K, YAMANAKA S. 2006. Induction of pluripotent stem cells from mouse
embryonic and adult fibroblast cultures by defined factors. Cell. 126,663-676. TAKAHASHI, K., TANABE, K., OHNUKI, M., NARITA, M., ICHISAKA, T., TOMODA, K. &
YAMANAKA, S. 2007. Induction of pluripotent stem cells from adult human fibroblasts by defined factors. cell, 131, 861-872.
TEAGUE, T. K., MUNN, L., ZYGOURAKIS, K. & MCINTYRE, B. W. 1993. Analysis of lymphocyte activation and proliferation by video microscopy and digital imaging. Cytometry, 14, 772-782.
TRELEAVEN, J. & BARRETT, A. J. 2009. Hematopoietic Stem Cell Transplantation: In
Clinical Practice, Churchill Livingstone/Elsevier, 44,271. TREPAT, X., DENG, L., AN, S. S., NAVAJAS, D., TSCHUMPERLIN, D. J., GERTHOFFER, W. T.,
BUTLER, J. P. & FREDBERG, J. J. 2007. Universal physical responses to stretch in the living cell. Nature, 447, 592-595.
TSE, W. Y., NASH, G. B., HEWINS, P., SAVAGE, C. O. & ADU, D. 2005. ANCA-induced neutrophil F-actin polymerization: implications for microvascular inflammation. Kidney international, 67, 130-139.
TSIEN, R., POZZAN, T. & RINK, T. 1982. Calcium homeostasis in intact lymphocytes: cytoplasmic free calcium monitored with a new, intracellularly trapped fluorescent indicator. The Journal of Cell Biology, 94, 325-334.
TURNER, M. L., ANTHONY, R. S., PARKER, A. C. & MCILWAINE, K. 1995. Differential expression of cell adhesion molecules by human hematopoietic progenitor cells from bone marrow and mobilized adult peripheral blood. Stem Cells, 13, 311-316.
TRICKEY, W. R., BAAIJENS, F. P., LAURSEN, T. A., ALEXOPOULOS, L. G. & GUILAK, F. 2006. Determination of the Poisson's ratio of the cell: recovery properties of chondrocytes after release from complete micropipette aspiration. Journal of biomechanics, 39, 78-87.
UCCELLI, A., MORETTA, L. & PISTOIA, V. 2008. Mesenchymal stem cells in health and disease. Nature Reviews Immunology, 8, 726-736.
VARGAS-PINTO, R., GONG, H., VAHABIKASHI, A. & JOHNSON, M. 2013. The effect of the endothelial cell cortex on atomic force microscopy measurements. Biophysical journal, 105, 300-309.
WARKIANI, M. E., GUAN, G., LUAN, K. B., LEE, W. C., BHAGAT, A. A. S., CHAUDHURI, P. K., TAN, D. S.-W., LIM, W. T., LEE, S. C. & CHEN, P. C. 2014. Slanted spiral

References
205
microfluidics for the ultra-fast, label-free isolation of circulating tumor cells. Lab on a Chip, 14, 128-137.
WHETTON, A. D. & GRAHAM, G. J. 1999. Homing and mobilization in the stem cell niche. Trends in cell biology, 9, 233-238.
WHITE, R. L., NASH, G., KAVANAGH, D. P., SAVAGE, C. O. & KALIA, N. 2013. Modulating the adhesion of haematopoietic stem cells with chemokines to enhance their recruitment to the ischaemically injured murine kidney. PloS one, 8, e66489.
WIGGS, B. R., ENGLISH, D., QUINLAN, W. M., DOYLE, N. A., HOGG, J. C. & DOERSCHUK, C. M. 1994. Contributions of capillary pathway size and neutrophil deformability to neutrophil transit through rabbit lungs. Journal of Applied Physiology, 77, 463-470.
WULFF, S., MARTIN, K., VANDERGAW, A., BOENISCH, T., BROTHERICK, I., HOY, T., HUDSON, J., JESPERSGAARD, C., LOPEZ, P. & ORFAO, A. 2006. Guide to flow cytometry, Dako Cytomation.
WU, Y., LU, H., CAI, J., HE, X., HU, Y., ZHAO, H. & WANG, X. 2009. Membrane surface nanostructures and adhesion property of T lymphocytes exploited by AFM. Nanoscale research letters, 4, 942-947.
XU, J., TSENG, Y. & WIRTZ, D. 2000. Strain Hardening of actin filament networks regulation by the dynamic cross-linking protein α-actinin. Journal of Biological Chemistry, 275, 35886-35892.
YAN, Y., ZHANG, Z., STOKES, J. R., ZHOU, Q.-Z., MA, G.-H. & ADAMS, M. J. 2009. Mechanical characterization of agarose micro-particles with a narrow size distribution. Powder Technology, 192, 122-130.
YAP, B. & KAMM, R. D. 2005. Mechanical deformation of neutrophils into narrow channels induces pseudopod projection and changes in biomechanical properties. Journal of Applied Physiology, 98, 1930-1939.
YANG, J., HUANG, Y., WANG, X.-B., BECKER, F. F. & GASCOYNE, P. R. 1999. Cell separation on microfabricated electrodes using dielectrophoretic/gravitational field-flow fractionation. Analytical Chemistry, 71, 911-918.
YEMM, A. I. 2014. Enhancing haematopoeitic stem cell recruitment to injured murine colon. University of Birmingham.
YU, J., VODYANIK, M. A., SMUGA-OTTO, K., ANTOSIEWICZ-BOURGET, J., FRANE, J. L., TIAN, S., NIE, J., JONSDOTTIR, G. A., RUOTTI, V. & STEWART, R. 2007. Induced pluripotent stem cell lines derived from human somatic cells. Science, 318, 1917-1920.
YUAN, B., JIN, Y., SUN, Y., WANG, D., SUN, J., WANG, Z., ZHANG, W. & JIANG, X. 2012. A strategy for depositing different types of cells in three dimensions to mimic tubular structures in tissues. Advanced Materials, 24, 890-896.
ZHANG, Z., FERENCZI, M., LUSH, A. & THOMAS, C. 1991. A novel micromanipulation technique for measuring the bursting strength of single mammalian cells. Applied microbiology and biotechnology, 36, 208-210.
ZHAO, L.-R., DUAN, W.-M., REYES, M., KEENE, C. D., VERFAILLIE, C. M. & LOW, W. C. 2002. Human Bone Marrow Stem Cells Exhibit Neural Phenotypes and

References
206
Ameliorate Neurological Deficits after Grafting into the Ischemic Brain of Rats. Experimental Neurology, 174, 11-20.
ZON, L. I. 1995. Developmental biology of hematopoiesis. Blood, 86, 2876-2891. ZSEBO, K. M., WYPYCH, J., MCNIECE, I. K., LU, H. S., SMITH, K. A., KARKARE, S. B.,
SACHDEV, R. K., YUSCHENKOFF, V. N., BIRKETT, N. C. & WILLIAMS, L. R. 1990. Identification, purification, and biological characterization of hematopoietic stem cell factor from buffalo rat liver-conditioned medium. Cell, 63, 195-201.