mechanical deformation of dendrites by fluid flow …users.ox.ac.uk/~engs0829/md.pdfmechanical...
TRANSCRIPT

Acta Materialia 50 (2002) 3743–3755www.actamat-journals.com
Mechanical deformation of dendrites by fluid flow duringthe solidification of undercooled melts
Kalin Dragnevski, Andrew M. Mullis∗, Daniel J. Walker, Robert F. CochraneDepartment of Materials, University of Leeds, Leeds LS2 9JT, UK
Received 21 February 2002; received in revised form 29 April 2002; accepted 14 May 2002
Abstract
Mechanical interactions between growing dendrites and their parent melt are normally considered to be of littlesignificance. During conventional solidification processing this is undoubtedly true. However, during the solidificationof undercooled melts the twin conditions required to produce mechanical damage to dendrites, high flow velocities andvery fine dendrites, may exist. This is most likely in strongly partitioning alloy systems where the tip radius experiencesa local minimum at undercoolings in the range of 50–100 K. In this paper we present a model for the skin stressresulting from fluid flow around a family of realistically shaped dendrites. We find that within a narrow undercoolingrange about the minimum in the tip radius, mechanical deformation of the growing dendrite is likely. Experimentalevidence is presented from the Cu–3wt%Sn and Cu–O alloy systems that appear to show evidence of extensivelydeformed dendritic structures consistent with mechanical damage. Other mechanisms for causing dendritic bendingduring growth are considered and shown to be unlikely in this case. 2002 Acta Materialia Inc. Published by ElsevierScience Ltd. All rights reserved.
Keywords: Rapid solidification; Alloys: copper; Microstructure; Theory and modelling
1. Introduction
It is widely accepted within the metallurgicalcommunity that fluid flow during solidification canhave no mechanical effect on growing dendrites,although thermo-solutal effects may be significant.Indeed, Pilling & Hellawell [1], writing in 1996,stated that ‘there are no reports of which we areaware of dendritic arms being mechanically bent’.During conventional solidification processing the
∗ Corresponding author. Fax:+44-113-242-2531.E-mail address: [email protected] (A.M. Mullis).
1359-6454/02/$22.00 2002 Acta Materialia Inc. Published by Elsevier Science Ltd. All rights reserved.PII: S1359 -6454(02 )00186-6
evidence, both experimental and theoretical, insupport of this view is compelling. However, dur-ing the solidification of undercooled melts thecombined conditions of very fine dendrites andhigh flow velocities for mechanically damageddendrites may be satisfied.
As a pure metal solidifies from its undercooledparent melt the radius of curvature at the dendritetip, R, will decrease monotonically with increasingundercooling, �T. However, in alloy systems,particularly those in which one component isstrongly partitioning, the situation is more com-plex. In this case,R will experience a local mini-mum, typically at undercoolings in the range of
3744 K. Dragnevski et al. / Acta Materialia 50 (2002) 3743–3755
50–100 K. This local minimum is indicative of thetransition from solutally controlled at low growthvelocity to coupled thermo-solutal growth at inter-mediate growth velocity. Typical growth velocitiesfor this transition are of the order 1 m s�1�V�3m s�1. It is in the vicinity of this local minimumin R that the greatest likelihood of observing mech-anically damaged dendrites exists.
Many of the techniques for processingundercooled melts also provide the high fluid velo-cities that are required if mechanical damage is tooccur. During the growth phase significant shrink-age induced flow will occur. Shrinkage voids arerare in samples processed at low undercooling andconsequently it would seem reasonable to assumethat shrinkage flow is such that continuity is main-tained at the solid–liquid interface. For a dendritegrowing at velocity V the maximum shrinkage flowvelocity Vs is given by
Vs � Vd (1)
where d is the volume change upon melting. Tak-ing a typical value [2] of d�0.05 for an FCC metalwith V�2 m s�1 we have Vs=0.01 m s�1.
Heating of metallic melts by electromagneticinduction is known to produce potentially vigorousstirring of the melt. The likely magnitude of thisstirring has been studied in detail for processingby electromagnetic levitation, where flow rates ofthe order of 0.3 m s�1 are expected [3–5], but ismuch less well characterised when induction heat-ing is utilised in other containerless processingtechniques. In the work reported here we use afluxing technique to produce undercooled melts.Heating of the melt is by means of an inductionheated graphite susceptor, with a 2 mm wall thick-ness. At the working frequency of the inductionheater used (450 kHz) a solid susceptor of this wallthickness would transmit around 50% of the elec-tromagnetic power directly to the sample. How-ever, as the susceptor actually used in the experi-ments had two viewing slots cut in line-of-sightwith the sample, the actual power transmitted dur-ing experiments probably exceeded this level.Consequently, taking 0.3 m s�1 as typical of theflow velocity expected during electromagnetic levi-tation (in which the sample experiences no electro-magnetic screening) we believe that an estimate of
the flow velocity in our samples of the order 0.1m s�1 may not be unreasonable during experimentswith �50% screening.
A number of other effects common in the pro-cessing of undercooled melts may, however, tendto mask the observation of deformed dendriticstructures. In particular, many alloys will tend toundergo a spontaneous transition from a coarsecolumnar structure to a fine grained equiaxed struc-ture and then back to a columnar structure as theundercooling is progressively increased. Unfortu-nately this region of equiaxed grain structurecoincides with the local minimum in R, making theobservation of any potential deformation imposs-ible in these systems. This transition is unlikelyhowever to be related to any mechanical defor-mation taking place during the growth phase [6,7].However, by use of an appropriate model of spon-taneous grain refinement [8], suitable alloy systemsthat do not grain refine can be identified.
In a recent paper, Battersby et al. [9] presentedthe results of a comparative study of the solidifi-cation of undercooled Cu, Cu–O and Cu–Sn melts.In one of these samples, a Cu–3wt%Sn alloyundercooled by 73 K, there was evidence of adeformed dendritic structure which, we believe,may have resulted from mechanical damage to thegrowing dendrites. In this paper we present furtherevidence from the study of the Cu–3wt%Sn sys-tem, together with a new system, Cu–O, whichseems to provide compelling evidence of bent den-dritic structures. We then present a detailed mech-anical model which shows that mechanical bendingof dendrites is possible. Finally, we consider thepossibility that an alternative mechanism, thermo-solutal advection, could have given rise to theobserved bending and find this to be unlikely.
2. Experimental procedure
Melt fluxing was chosen as the most suitablemeans to study the alloy systems under consider-ation, as the melting point of Cu-based alloys isgenerally too low for significant undercoolings tobe achieved by electromagnetic levitation. Themethod allows high undercoolings to be achievedas nucleation on the container walls is prevented

3745K. Dragnevski et al. / Acta Materialia 50 (2002) 3743–3755
by isolating the melt from these surfaces. The fluxcan also aid the removal of oxide impurities fromthe melt by dissolution in the flux and protects thesurface from oxidation.
Undercooling experiments were performedwithin a stainless steel vacuum chamber evacuatedto a pressure of 10�6 mbar and backfilled to 500mbar with N2 gas. Samples were heated, in silicacrucibles, by induction heating of a graphite sus-ceptor contained within an alumina radiation shi-eld. Viewing slots were cut in the susceptor andalumina to allow the sample to be viewed duringthe experiment. A commercial soda-lime glass wasemployed as the flux to reduce the number ofpotential sites for heterogeneous nucleation. Thetemperature was monitored by means of a k-typethermocouple positioned at the base of the cru-cible, which had been thinned, thus reducing thethermal lag between the sample and the thermo-couple. Heating and cooling curves were obtainedby using a chart recorder. A schematic diagram ofthe fluxing apparatus is shown in Fig. 1. By usingthis method it was possible to achieve temperaturesof up to 1473 K, thus easily accommodating melt-ing and superheating of the alloy systems that wereto be investigated, ensuring that the samples werecompletely contained within the glass flux.
Copper samples of 99.9999% purity (metalbasis) were obtained from ALFA (JohnsonMatthey). However, these samples contain aresidual level of oxygen. Based on the work of pre-
Fig. 1. Schematic diagram of the fluxing apparatus.
vious researchers, we have defined Cu–O alloys asCu containing at least 200 ppm of oxygen afterundercooling and oxygen free copper as containingless than 200 ppm of oxygen.
A Cu–3wt%Sn alloy was prepared by arc melt-ing under argon. All starting materials wereobtained from ALFA (Johnson Matthey) and wereof 99.9999% purity. In order to ensure completemixing of the elements and to eliminate any segre-gation the alloy was re-melted and finally annealedat 1023 K for 30 min.
After undercooling, the as-solidified dropletswere mounted in Bakelite, then polished andfinally etched in an appropriate solution to revealstructure and substructure. Optical microscopy wascarried out on a Nikon Optiphot microscope usingbright field (BF), differential interference contrast(DIC) mode and polarized light. Scanning electronmicroscopy was performed on a CamScan Series 4SEM. Vickers microhardness measurements werecarried out on the polished specimens using a Pho-toplan microhardness tester, applying a load of 100gf for 30 s.
3. Experimental results
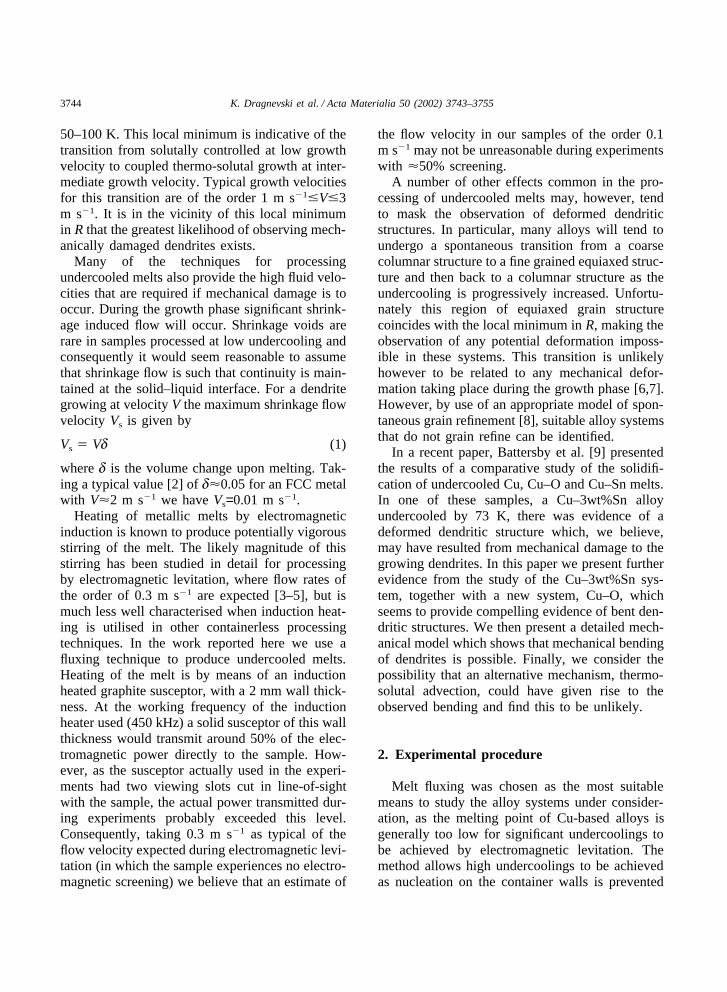
The first system chosen for study was Cu–O.Fig. 2a reveals the microstructure of a sampleundercooled by 47 K. The dendritic substructure ishighly irregular and consists of a large number ofbent primary and secondary dendrite arms. Anotherinteresting feature within the microstructure of thesample can be seen at the bottom left hand cornerof the micrograph. The grain that separates thedendrites via a faceted grain boundary is thoughtto be an inter-penetrant grain. It has been suggestedthat the formation of such grains during non-equi-librium solidification is caused by the growth ofdendrites in different directions [10]. If dendritearms are bent by randomly directed flows duringgrowth, the formation of such grains is notunlikely. Fig. 2b shows the microstructure of thesame sample under polarized light: a more con-trasting topography of the dendritic structure is dis-played. At higher magnifications (Fig. 2c, DICmode) an array of deformed secondary arms can beseen, together with the inter-penetrant grain, which
3746 K. Dragnevski et al. / Acta Materialia 50 (2002) 3743–3755
Fig. 2. Optical micrographs of a Cu–O sample undercooledby 47 K prior to nucleation: (a) bright field image; (b) underpolarized light; (c) under DIC mode (etched in acidified potass-ium dichromate).
provides strong evidence that the dendritic struc-ture has been mechanically damaged.
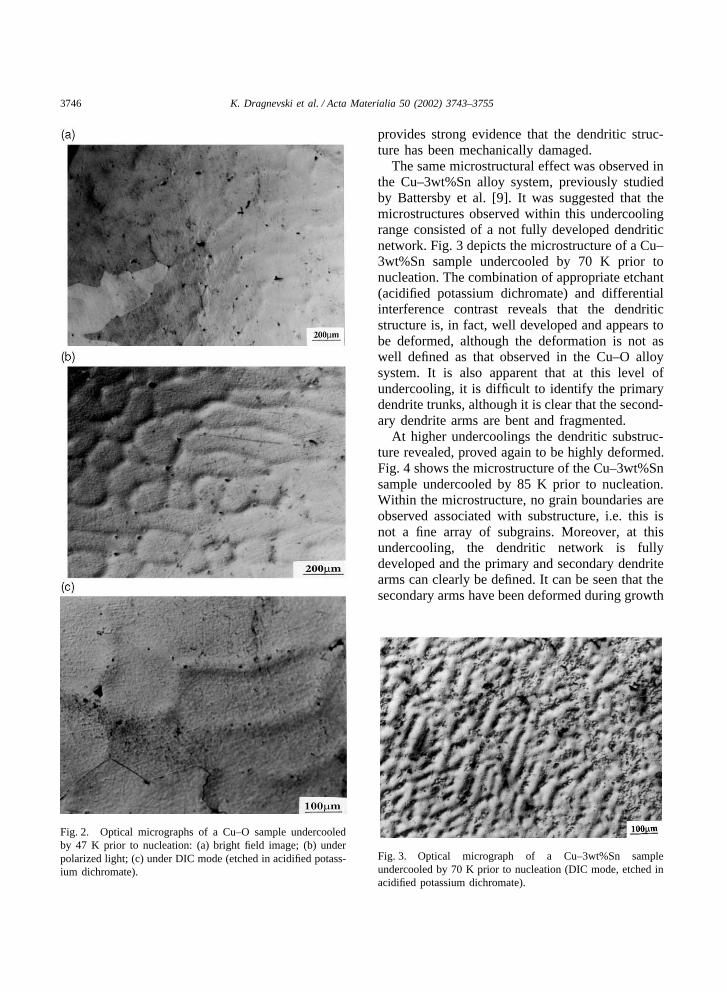
The same microstructural effect was observed inthe Cu–3wt%Sn alloy system, previously studiedby Battersby et al. [9]. It was suggested that themicrostructures observed within this undercoolingrange consisted of a not fully developed dendriticnetwork. Fig. 3 depicts the microstructure of a Cu–3wt%Sn sample undercooled by 70 K prior tonucleation. The combination of appropriate etchant(acidified potassium dichromate) and differentialinterference contrast reveals that the dendriticstructure is, in fact, well developed and appears tobe deformed, although the deformation is not aswell defined as that observed in the Cu–O alloysystem. It is also apparent that at this level ofundercooling, it is difficult to identify the primarydendrite trunks, although it is clear that the second-ary dendrite arms are bent and fragmented.
At higher undercoolings the dendritic substruc-ture revealed, proved again to be highly deformed.Fig. 4 shows the microstructure of the Cu–3wt%Snsample undercooled by 85 K prior to nucleation.Within the microstructure, no grain boundaries areobserved associated with substructure, i.e. this isnot a fine array of subgrains. Moreover, at thisundercooling, the dendritic network is fullydeveloped and the primary and secondary dendritearms can clearly be defined. It can be seen that thesecondary arms have been deformed during growth
Fig. 3. Optical micrograph of a Cu–3wt%Sn sampleundercooled by 70 K prior to nucleation (DIC mode, etched inacidified potassium dichromate).

3747K. Dragnevski et al. / Acta Materialia 50 (2002) 3743–3755
Fig. 4. Optical micrographs of the Cu–3wt%Sn sampleundercooled by 85 K prior to nucleation: (a) DIC-mode; (b)under polarized light at higher magnifications (etched in acidi-fied potassium dichromate).
from the undercooled melt, most probably due tofluid flow effects.
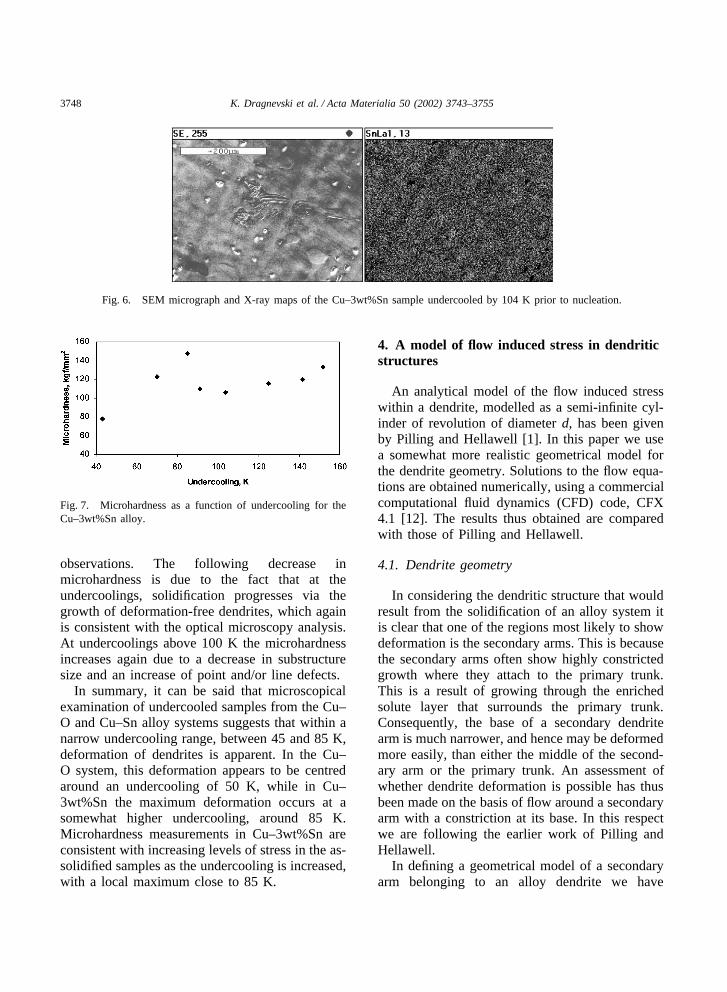
As the undercooling is increased, growth ofdeformation-free dendrites takes place, yielding astructure of well-developed columnar dendrites, asshown in Fig. 5 for the Cu–3wt%Sn alloy system.At undercoolings above 100 K, a columnar den-dritic structure is revealed with no evidence of bentdendrites. The primary and secondary dendritearms can clearly be seen and the microsegregtionpattern is very well defined (Fig. 6).
The structure of the Cu–3wt%Sn alloy remainsessentially unchanged up to �T=183 K. Above thisundercooling Battersby et al. showed that grainrefinement by recrystallisation takes place. The
Fig. 5. Optical micrograph of a Cu–3wt%Sn sampleundercooled by 91 K prior to nucleation (DIC-mode, etched inacidified potassium dichromate).
same applies for the Cu–O alloy system, wheregrain refined microstructures were observed atundercoolings above 90 K[9].
Previous studies [11] on the Cu–Sn system (withup to 6 wt% Sn) showed that at very lowundercoolings, solidification proceeded via thegrowth of columnar dendrites that exhibited a verywell defined microsegregation pattern. It was sug-gested that this was due to the large intervalbetween the solidus and liquidus lines and the lowdiffusion coefficient of Sn in Cu. For the Cu–Osystem it was shown that at undercoolings below40 K the grain size was very coarse and the sub-structure consisted of well developed dendriteswith coarse secondary arm spacing and no evi-dence of bending and the presence of inter-penetr-ant grains.
To further understand the microstructure–undercooling relationship, microhardness measure-ments were made on the Cu–3wt%Sn samples sol-idified at various undercoolings. Results from thesemeasurements are shown in Fig. 7. The microhard-ness increases to a maximum value of 148 kgf/mm2
at an undercooling of 85 K, then decreases withfurther increases in undercooling, to 106 kgf/mm2
at an undercooling of 104 K and then increasesagain with further increases in undercooling up toa value of 133 kgf/mm2. The increase inmicrohardness at low undercoolings strongly sug-gests that the microstructure has been deformed,which is consistent with the optical microscopy
3748 K. Dragnevski et al. / Acta Materialia 50 (2002) 3743–3755
Fig. 6. SEM micrograph and X-ray maps of the Cu–3wt%Sn sample undercooled by 104 K prior to nucleation.
Fig. 7. Microhardness as a function of undercooling for theCu–3wt%Sn alloy.
observations. The following decrease inmicrohardness is due to the fact that at theundercoolings, solidification progresses via thegrowth of deformation-free dendrites, which againis consistent with the optical microscopy analysis.At undercoolings above 100 K the microhardnessincreases again due to a decrease in substructuresize and an increase of point and/or line defects.
In summary, it can be said that microscopicalexamination of undercooled samples from the Cu–O and Cu–Sn alloy systems suggests that within anarrow undercooling range, between 45 and 85 K,deformation of dendrites is apparent. In the Cu–O system, this deformation appears to be centredaround an undercooling of 50 K, while in Cu–3wt%Sn the maximum deformation occurs at asomewhat higher undercooling, around 85 K.Microhardness measurements in Cu–3wt%Sn areconsistent with increasing levels of stress in the as-solidified samples as the undercooling is increased,with a local maximum close to 85 K.
4. A model of flow induced stress in dendriticstructures
An analytical model of the flow induced stresswithin a dendrite, modelled as a semi-infinite cyl-inder of revolution of diameter d, has been givenby Pilling and Hellawell [1]. In this paper we usea somewhat more realistic geometrical model forthe dendrite geometry. Solutions to the flow equa-tions are obtained numerically, using a commercialcomputational fluid dynamics (CFD) code, CFX4.1 [12]. The results thus obtained are comparedwith those of Pilling and Hellawell.
4.1. Dendrite geometry
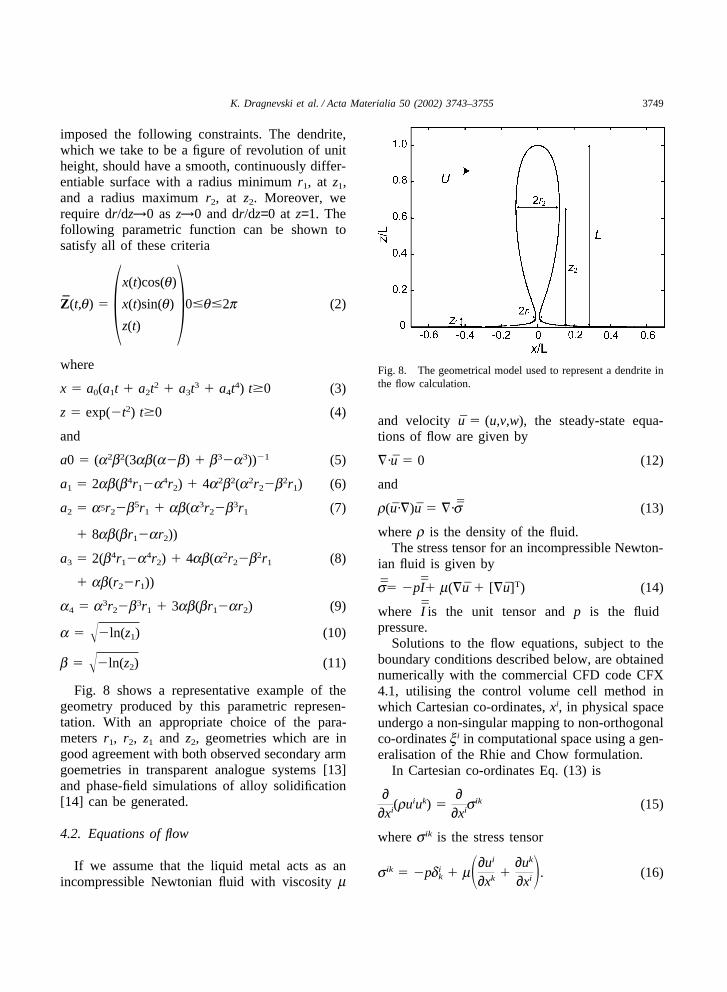
In considering the dendritic structure that wouldresult from the solidification of an alloy system itis clear that one of the regions most likely to showdeformation is the secondary arms. This is becausethe secondary arms often show highly constrictedgrowth where they attach to the primary trunk.This is a result of growing through the enrichedsolute layer that surrounds the primary trunk.Consequently, the base of a secondary dendritearm is much narrower, and hence may be deformedmore easily, than either the middle of the second-ary arm or the primary trunk. An assessment ofwhether dendrite deformation is possible has thusbeen made on the basis of flow around a secondaryarm with a constriction at its base. In this respectwe are following the earlier work of Pilling andHellawell.
In defining a geometrical model of a secondaryarm belonging to an alloy dendrite we have
3749K. Dragnevski et al. / Acta Materialia 50 (2002) 3743–3755
imposed the following constraints. The dendrite,which we take to be a figure of revolution of unitheight, should have a smooth, continuously differ-entiable surface with a radius minimum r1, at z1,and a radius maximum r2, at z2. Moreover, werequire dr/dz→0 as z→0 and dr/dz=0 at z=1. Thefollowing parametric function can be shown tosatisfy all of these criteria
Z(t,q) � �x(t)cos(q)
x(t)sin(q)
z(t) �0�q�2p (2)
where
x � a0(a1t � a2t2 � a3t3 � a4t4) t�0 (3)
z � exp(�t2) t�0 (4)
and
a0 � (a2b2(3ab(a�b) � b3�a3))�1 (5)
a1 � 2ab(b4r1�a4r2) � 4a2b2(a2r2�b2r1) (6)
a2 � a5r2�b5r1 � ab(a3r2�b3r1 (7)
� 8ab(br1�ar2))
a3 � 2(b4r1�a4r2) � 4ab(a2r2�b2r1 (8)
� ab(r2�r1))
a4 � a3r2�b3r1 � 3ab(br1�ar2) (9)
a � ��ln(z1) (10)
b � ��ln(z2) (11)
Fig. 8 shows a representative example of thegeometry produced by this parametric represen-tation. With an appropriate choice of the para-meters r1, r2, z1 and z2, geometries which are ingood agreement with both observed secondary armgoemetries in transparent analogue systems [13]and phase-field simulations of alloy solidification[14] can be generated.
4.2. Equations of flow
If we assume that the liquid metal acts as anincompressible Newtonian fluid with viscosity m
Fig. 8. The geometrical model used to represent a dendrite inthe flow calculation.
and velocity u � (u,v,w), the steady-state equa-tions of flow are given by
�·u � 0 (12)
and
r(u·�)u � �·s (13)
where r is the density of the fluid.The stress tensor for an incompressible Newton-
ian fluid is given by
s� �pI� m(�u � [�u]T) (14)
where I is the unit tensor and p is the fluidpressure.
Solutions to the flow equations, subject to theboundary conditions described below, are obtainednumerically with the commercial CFD code CFX4.1, utilising the control volume cell method inwhich Cartesian co-ordinates, xi, in physical spaceundergo a non-singular mapping to non-orthogonalco-ordinates xi in computational space using a gen-eralisation of the Rhie and Chow formulation.
In Cartesian co-ordinates Eq. (13) is
∂∂xi(ru
iuk) �∂
∂xisik (15)
where sik is the stress tensor
sik � �pdik � m�∂ui
∂xk �∂uk
∂xi�. (16)

3750 K. Dragnevski et al. / Acta Materialia 50 (2002) 3743–3755
This implies that
∂∂xi�ruiuk�m
∂uk
∂xi� � �∂r∂xk �
∂∂xi�m∂ui
∂xk� (17)
∂∂xiJ
iuk � Suk (18)
where the total flux vectors and source terms aregiven by
Jiuk � ruiuk�m
∂uk
∂xi (19)
and
Suk � �∂r∂xk �
∂∂xi�m∂ui
∂xk� (20)
Eq. (20) is the general form of the scalar advec-tion-diffusion equation. Keeping the velocitycomponents, ui, in the fixed Cartesian directionsthe transformation into computational space pro-ceeds as
∂∂xiJ
iuk � �gSuk (21)
with
Jiuk � ruiuk��ij
∂uk
∂xi (22)
�ij � m�ggij (23)
where gij is the metric tensor for the control volumecell and �g is the volume of the corresponding cell.Full details of the computational scheme are givenin Ref. [15]
4.3. Flow boundary conditions
For a dendrite of unit height, as described byEq. (2), the computational domain extends from�6�x�6, �6�y�6 and 0�z�6. The maximumdiameter of the dendrite used in any of the simula-tions was 0.3. Boundary conditions are specifiedwithin the computational domain as follows. Onthe upstream boundary (y–z plane at x=�6) weapply a constant flux condition, which is equivalentto fluid entry at constant velocity U aligned along
the x-direction (i.e. orthogonal to the principal axisof the dendrite)
u(x � �6,y,z) � �U
0
0 � (24)
while on the downstream boundary (y–z plane atx=6) fluid exit is via a zero pressure boundary
p(x � 6,y,z) � 0. (25)
No slip conditions are applied at all solid sur-faces, that is
u(Z) � 0 (26)
where Z is the locus defined by Eq. (2). All otherdomain walls are zero flux boundaries.
4.4. Calculation of the bending moment
Values for the shear stress acting along the tan-gent to the surface of the dendrite due to drag, trqand hydrostatic pressure, Prq, are obtained from thestress tensor s for the converged solution. Follow-ing Pilling and Hellawell we may write the forceacting in the x-direction, Fx, as
Fx(z,q) � trq(z)sin(q) � Prq(z)cos(q) (27)
wherein the total force, F(z), acting on the dendriteat height z is given by
F(z) � �2p
0
F(z,q)r(z)dq (28)
The skin stress in the dendrite arm, as a functionof position, is given by
s(z) �M(z)r(z)I[r(z)]
(29)
where M(z) is the bending moment and I(z) themoment of inertia of the section at z. Assumingthe dendrite bends about its narrowest point, r1,these are
M(z1) � �1
z1
�F(z)(z�z1)dz (30)
3751K. Dragnevski et al. / Acta Materialia 50 (2002) 3743–3755
and
I[r(z1)] �p[r(z1)4]
4. (31)
4.5. Dendrite radius as a function ofundercooling
No well-defined route exists for calculating theradius of a secondary dendrite arm as a functionthe undercooling at which it grew. However, wheredendritic growth has been observed directly, intransparent analogue casting systems such as suc-cinonitrile [16] and xenon [17], the evidence is thatthe morphology of dendrites grown at differentundercoolings is probably self-similar when scaledagainst the tip radius, R. Consequently, many ofthe more obvious length scales of the dendrite aresimple multiples of R, and this technique has pre-viously been used by a number of authors to esti-mate the dimensions of various dendritic features[8,18]. Here we assume our secondary dendritearms are a fixed multiple of R, which we estimatefrom marginal stability theory.
If we assume that the thermal conductivities inthe solid and liquid, l and s, are equal we maywrite
R ��
s∗�ThypPtF(Ac)(32)
where Ac and F(Ac) are two dimensionless quan-tities first suggested by Lipton et al. [19]
Ac �1
1�(1�k)Iv(Pc)(33)
F(Ac) � xl �2xcDtmCocpAc(1�k)
HDl
(34)
with
� �gTl
rH(35)
where g is the interfacial energy between the solidand liquid phases, Tl the liquidus temperature, Dl
is the thermal diffusivity in the liquid phase, m theslope of the liquidus line, Co the alloy concen-tration and k the partition coefficient. Pt is the ther-mal Peclet number in the liquid
Pt �VR2Dl
. (36)
The equivalent solutal Peclet number is givenby
Pc �VR2Dc
(37)
where Dc is the solutal diffusivity in the liquid.Due to solute trapping at the interface at high
growth rates, k will be related to the equilibriumpartition coefficient, ke, by [20]
k(V) �ke � aV /Dl
1 � aV /Dl
(38)
where a is the Aziz solute trapping parameter andke is defined such that m(1�ke) 0. s∗ is a stab-ility constant which, for a plane interface, Mullinsand Sekerka [21] give as 1/4p2. The dimensionlessquantities xl and xc are given by
xl � 1�1
�1 �1s∗Pt2
(39)
and
xc � 1 �2ke
1�2ke��1 �1s∗Pc2
. (40)
Iv is the Ivantsov function [22]
Iv(Pt) � Pt exp (Pt)Ei(�Pt) (41)
where Ei is the exponential integral function.
4.6. Estimation of the yield stress for Cu–3at%Sn at its melting point
The flow shear stress, as a function of the hom-ologous temperature, T/Tl, has been obtained fromthe deformation maps of Frost and Ashby [23]. Atthe low undercoolings at which dendritic defor-mation was observed, the plateau time, that is thetime between recalescence and complete solidifi-cation of the sample, was of the order of a fewseconds. For bending sufficient to be evident in theas-solidified sample (say �30°) to have occurred
3752 K. Dragnevski et al. / Acta Materialia 50 (2002) 3743–3755
within the available time the shear strain ratewould have been of the order 10�1�10�2 s�1. Atthese strain rates the required shear stress for purecopper at its melting temperature is estimated as(2.3–3.5)×10�4 ms(Tl), where ms(Tl) is the shearmodulus at the liquidus temperature.
Over most of the homologous temperature rangems decreases linearly with T. Certainly this appearsto be a very good approximation up to T/Tl=0.6.As far as we are aware the shear modulus of copperhas not been measured close to its melting point.If the linear trend from low temperature data werecontinued, we estimate, from the data of Frost andAshby that ms(Tl)�24 GPa. However, in manymaterials the elastic moduli decrease rapidly as themelting temperature is approached and this valuemay thus be considerably in excess of the truevalue. Using this value we deduce that an upperbound on the flow stress for pure copper at its melt-ing point may be of the order of 7 MPa. In theabsence of experimental data we have assumed thatthe value for the dilute Cu–O and Cu–Sn alloyswill be of the same order.
5. Results
5.1. Comparison of the numerical model with theanalytical model of Pilling and Hellawell
For a semi-infinite cylinder Pilling and Hellaw-ell found the force per unit length due to the flowof a fluid with velocity U orthogonal to the princi-pal axis of the dendrite to be
F � 3pmU (42)
which is independent of the radius of the cylinder.This gives a bending moment for a cylinder oflength L of
M �FL2
2�
32pmUL2 (43)
In Fig. 9 we present the results of our numericalcalculation of M as a function of the Reynoldsnumber, Re, for the flow
Re �Vfrlm
(44)
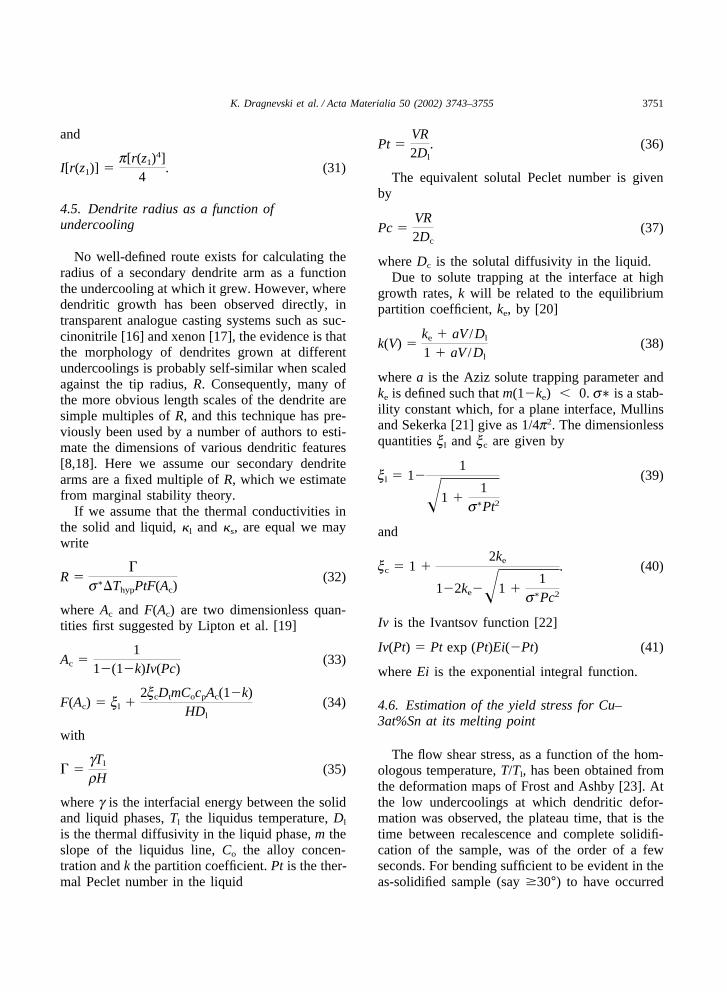
Fig. 9. Comparison of the results of the numerical flow modelwith the analytical model of Pilling and Hellawell as a functionof the Reynolds number for the flow. Good agreement betweenthe two is apparent, particularly at high Reynolds number. Thenumerical model exceeds the analytical model due to the factthat the analytical model considers flow around a semi-infinitebody and thus ignores drag around the end of the dendrite.
where l is a characteristic length scale for the prob-lem. Pilling and Hellawell chose the diameter ofthe cylinder as their characteristic length scale sofor the purposes of direct comparison with the ana-lytical model we have chosen to take the diameterof the dendrite at its widest point, 2r2, as thecharacteristic length scale.
It is apparent from the figure that agreementbetween the relatively simple analytical model ofPilling and Hellawell and the numerical modelpresented here is generally very good, particularlyat higher Reynolds numbers, where the modelsagree to within 10%. We suspect that the smalldiscrepancy that does exist between the modelsarises largely due to the fact that we are consider-ing flow around a body of finite length, whichincludes drag effects around the end of the den-drite. The location and size of the maximum andminimum radius were found to have virtually noeffect on the calculated value of M. Parameterswere varied within the limits 0.02�r1� 0.055 and0.05�z1� 0.09, the effect of this variation beingindicated by the error bars in Fig. 9.
3753K. Dragnevski et al. / Acta Materialia 50 (2002) 3743–3755
5.2. Flow stress as a function of undercooling inCu melts
To estimate the skin stress in a dendrite growingfrom an undercooled melt we have adopted the fol-lowing procedure. The tip radius as a function ofundercooling is estimated from Eq. (32), and thisis used to set the length scale for the problem, withr1, r2 and L all being fixed multiples of R. Schwarzet al.[8] found that the ratio of calculated tip radiusto measured dendrite trunk radius was approxi-mately 20 with a standard deviation of 10, thisresult being independent of undercooling. Here wehave assumed r2 � 20R. Analysis of images of rip-ened dendrites grown from transparent analoguecasting systems indicates that r1 � r2 /4 and L �10r2 would not be unreasonable [13]. While we
have not undertaken a full sensitivity analysis ofhow s will vary with these parameters, we con-sider that they are generally conservative and willserve to give an indication of the likely stress lev-els present. Most of the other parameters in themodel can be obtained in a fairly straightforwardmanner. m and ke can be obtained from the equilib-rium phase diagrams for Cu–O and Cu–Sn andhave been taken here as Co � 0.08 at.%, m �46.2 K at.%�1 and ke � 0.013 for Cu–O and
Co � 3.0 wt%, m � 6.1 K wt%�1 and ke � 0.145for Cu–Sn. All other material parameters have beenassumed to be typical of elemental Cu and arereadily available in the literature [2], with theexception of g and a, which we have taken asg � 0.223 J m�2 and a � 2 × 10�10 m. The gen-eral validity of the parameter set has been checkedby comparing the predicted growth velocities withthe measured recalescence velocities reported byBattersby et al. [9] for the same systems.
The bending moment on the dendrite is esti-mated from
M �32y(Re)pmUL2 (45)
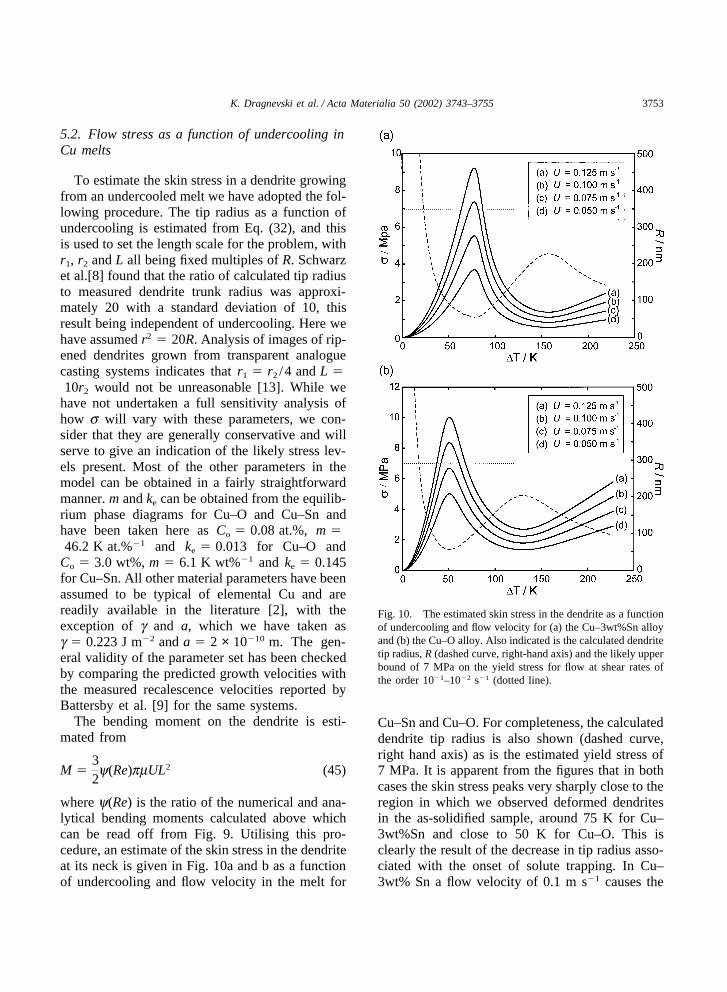
where y(Re) is the ratio of the numerical and ana-lytical bending moments calculated above whichcan be read off from Fig. 9. Utilising this pro-cedure, an estimate of the skin stress in the dendriteat its neck is given in Fig. 10a and b as a functionof undercooling and flow velocity in the melt for
Fig. 10. The estimated skin stress in the dendrite as a functionof undercooling and flow velocity for (a) the Cu–3wt%Sn alloyand (b) the Cu–O alloy. Also indicated is the calculated dendritetip radius, R (dashed curve, right-hand axis) and the likely upperbound of 7 MPa on the yield stress for flow at shear rates ofthe order 10�1–10�2 s�1 (dotted line).
Cu–Sn and Cu–O. For completeness, the calculateddendrite tip radius is also shown (dashed curve,right hand axis) as is the estimated yield stress of7 MPa. It is apparent from the figures that in bothcases the skin stress peaks very sharply close to theregion in which we observed deformed dendritesin the as-solidified sample, around 75 K for Cu–3wt%Sn and close to 50 K for Cu–O. This isclearly the result of the decrease in tip radius asso-ciated with the onset of solute trapping. In Cu–3wt% Sn a flow velocity of 0.1 m s�1 causes the
3754 K. Dragnevski et al. / Acta Materialia 50 (2002) 3743–3755
peak skin stress to exceed our estimated upperbound of the stress required to cause deformationin a narrow window centered around �T � 77 K.For higher flow velocities, or conversely a lowervalue of the yield stress, this window in whichdeformation may occur is enlarged. In Cu–O, thepeak skin stress corresponding to a flow velocityof 0.1 m s�1 is much higher, 12 MPa. This is con-sistent with the experimental results in that thedeformation observed in the Cu–O samplesappears much more severe and extensive than inthe Cu–3wt%Sn samples. We also note the veryclose correspondence in the shape of the skin stressand microhardness curves for Cu–3wt%Sn (Figs.10a and 7, respectively) which would suggest themicrohardness is a direct record of the stress thesample was subject to during solidification.
6. Alternative bending mechanisms
Finally, we should consider the possibility thatthe deformed structures observed arise as the resultof some other mechanism. The most likely suchmechanism is thermo-solutal advection, in whichperturbation of the isotherms (or isoconcentratelines) by the flow field results in bending of thegrowing dendrite arms. The effects of flow on den-dritic growth by thermo-solutal advection havebeen studied by Mullis [24], for the case in whichthe principal growth and flow directions arealigned orthogonally. This analysis revealed thatthermal/solutal advection did indeed cause arotation of the principal growth direction into theflow. Moreover, for small deflections of the tip,the deflection, �x, is proportional to �t2. This isconsistent with the angle of the outward normal tothe tip, q, being rotated at a constant rate. As thegrowth velocity is also constant, �x is proportionalto �z2, that is q is proportional to �z. This is mostconveniently expressed as
�x � �(�z)2 (46)
where � gives the rotation of the principal growthdirection per unit length of growth. Mullis foundthat � is a function of two variables, � ��(Ptf, Ptg), where Ptg and Ptf are the are the
Peclet numbers for growth and flow, with Ptg asdefined by Eq. (36) and Ptf given by
Ptf �UR2Dl
(47)
� was found to vary linearly with Ptf and as (Ptg)b,with b��1.85. Using the measured growth velo-cities reported by Battersby et al. [9[9]] and thecalculated values of the tip radii we estimate thegrowth and flow Peclet numbers for Cu–O at 50K to be of the order of 5×10�3 and 4×10�4,respectively. The equivalent values for Cu–3wt%Sn at 73 K are of the same order. Extrapolatingfrom the data of Mullis [24] we obtain a value for� of 7.5×10�3 rad m�1. As the features reportedare typically 500 µm or less, this corresponds to amaximum deflection of the principal growth direc-tion of 2×10�4 degrees. Consequently we concludethat the effect of flow induced bending due tothermo-solutal advection during solidification isnegligible and that consequently any deformationobserved is likely to be mechanical.
7. Summary and conclusions
Under most conditions encountered within sol-idification processing the likelihood of dendritesexperiencing mechanical damage due to flow of theparent melt is remote. However, during the pro-cessing of undercooled melts the conditions of bothvery fine dendrites and potentially high flow velo-cities required to initiate such damage may exist.Using the example systems, Cu–O and Cu–3wt%Sn, we have shown that conditions couldexist wherein mechanical damage may occur.Damage is likely to be confined within a narrowundercooling range, centered on the undercoolingwhere the dendrite tip radius passes through a localminimum. This is around 50 K in Cu–O and some-what higher at 75–85 K in Cu–3wt%Sn. Micro-structural evidence is presented from both of thesesystems which appear to show deformed dendriticstructures. The deformation is confined to the pre-dicted low undercooling window and is generallyrather more extensive in the Cu–O system than inCu–3wt%Sn, again in line with model predictions.In Cu–3wt%Sn microhardness measurements have

3755K. Dragnevski et al. / Acta Materialia 50 (2002) 3743–3755
been made on samples solidified at different levelsof undercooling. These show an increase inmicrohardness with undercooling up to a localmaximum around 85 K, wherein the microhardnessfalls abruptly before increasing again slowly withundercooling. The general shape of this curve isremarkably similar to the calculated stress curvefor Cu–3wt%Sn and is suggestive that microhard-ness acts as a direct record of the solidificationstress induced in the sample.
References
[1] Pilling J, Hellawell A. Metall Mater Trans1996;27A:229–32.
[2] Iida T, Guthrie RIL. The physical properties of liquid met-als. Oxford: Clarendon, 1988.
[3] El-Kaddah N, Szekely J. Metall. Trans. 1983;14B:401–10.[4] El-Kaddah N, Szekely J. Metall. Trans. 1984;15B:183–6.[5] Schwartz E, Szekely J, Ilegbusi O, Zong JH, Egry I. In:
Szekely J, editor. Magnetohydrodynamics in process met-allurgy. Warrendale, PA: Metallurgical Society of AIME;1992. p. 81–7.
[6] Mullis AM, Cochrane RF. J Appl Phys 1997;82:3783–90.[7] Mullis AM, Cochrane RF. J Appl Phys 1998;84:4905–10.[8] Schwarz M, Karma K, Eckler K, Herlach DM. Phys Rev
Lett 1994;73:1380–3.
[9] Battersby SE, Cochrane RF, Mullis AM. J Mater Sci2000;35:1365–73.
[10] Battersby SE. PhD thesis, University of Leeds; 1997.[11] Rashkov N. In: Metallography and heat treatment of met-
als. Sofia: Technika; 1988. p. 7-2.[12] Computational Fluid Dynamics Services, AEA Tech-
nology, Harwell, UK.[13] Hellawell AI. In: Kirkwood DH, Kapranos P, editors. Pro-
ceedings of the 4th International Conference on Semi-Solid Processing of Alloys and Composites; Sheffield,UK. 1996. p. 60–5.
[14] Warren JA, Boettinger WJ. Acta metall. mater.1995;43:689–703.
[15] CFX 4.1 Flow solver guide. Harwell, UK: AEA Tech-nology; 1995.
[16] Corrigan DP, Koss MB, La Combe JC, DeJager KD,Tennenhouse LA, Glicksman ME. Phys. Rev. E1999;60:7217–23.
[17] Bisang U, Bilgram JH. Phys. Rev. E 1996;54:5309–26.[18] Pan QY, Huang WD, Lin X, Zhou YH. J. Cryst. Growth
1997;181:109–16.[19] Lipton J, Kurz W, Trivedi R. Acta metall. 1987;35:957–
64.[20] Aziz MJ. J Appl Phys 1982;53:1158–68.[21] Mullins WW, Sekerka RF. J Appl Phys 1964;33:444–51.[22] Ivantsov GP. Doklady Akademii Nauk SSSR
1947;58:567–9.[23] Frost HJ, Ashby MF. In: Deformation-mechanism maps.
Oxford, UK: Pergamon; 1982. p. 24–5.[24] Mullis AM. Acta mater 1999;47:1783.