rapid fluid flow and mixing induced in microchannels...
TRANSCRIPT

OFFPRINT
Rapid fluid flow and mixing induced inmicrochannels using surface acoustic waves
M. K. Tan, L. Y. Yeo and J. R. Friend
EPL, 87 (2009) 47003
Please visit the new websitewww.epljournal.org

Europhysics Letters (EPL) has a new online home atwww.epljournal.org
Take a look for the latest journal news and information on:
• reading the latest articles, free!
• receiving free e-mail alerts
• submitting your work to EPL
TAKE A LOOK ATTHE NEW EPL
www.epl journal.org

August 2009
EPL, 87 (2009) 47003 www.epljournal.org
doi: 10.1209/0295-5075/87/47003
Rapid fluid flow and mixing induced in microchannels using
surface acoustic waves
M. K. Tan, L. Y. Yeo and J. R. Friend(a)
Micro/Nanophysics Research Laboratory, Department of Mechanical Engineering, Monash UniversityMelbourne, Victoria 3800 Australia
received 26 March 2009; accepted in final form 29 July 2009published online 4 September 2009
PACS 77.65.Dq – Acoustoelectric effects and surface acoustic waves (SAW) in piezoelectricsPACS 47.61.-k – Micro- and nano- scale flow phenomenaPACS 43.25.+y – Nonlinear acoustics
Abstract – Very-high-frequency surface acoustic waves, generated and transmitted along single-crystal lithium niobate, are used to drive homogeneous aqueous suspensions of polystyrenenanoparticles along microchannels. At a few hundred milliwatts, uniform and mixing flows withspeeds of up to 10mm/s were obtained in centimetres-long rectangular channels with cross-sectional dimensions of tens to a few hundreds of microns. A transition from uniform to mixingflow occurs as the channel width grows beyond the wavelength of sound in the fluid at the chosenexcitation frequency. At far lower input powers, the suspension agglomerates into equally spaced,serpentine lines coincident with nodal lines in the acoustic pressure field. We expose the physicsunderlying these disparate phenomena with experimental results aided by numerical models.
Copyright c© EPLA, 2009
Introduction. – The dominance of surface tension andviscous forces at small scales enormously complicates effi-cient transport and mixing in microfluidic technologies.In searching for solutions to this problem, we describeand explain three physical aspects peculiar to very-high-frequency (VHF) surface acoustic wave (SAW) excita-tion of fluids in a microchannel: an ability to drive fluidsalong the channel at 1–10mm/s [1], the appearance ofvortices and concomitant mixing under specific conditions,and the collection and transport of particle suspensions.The first two phenomena offer —by merely changing theSAW frequency— controlled switching between uniformflow for fluid delivery and vortex-laden flows for mixing inthe same microchannel, eliminating the complex architec-tures [2] required to induce mixing. In a similar vein, themanipulation of particle-laden flows is directly applicableto sorting or patterning.The SAW is a Rayleigh wave [3] generated by a
sinusoidal electric potential applied to an interdigitaltransducer (IDT) on the surface of a 127.68 y–x cut,x-propagating lithium niobate (LN) single-crystal piezo-electric substrate (fig. 1) formed using standard UVphotolithography. While the SAW is confined in itspropagation from the transducer along the anisotropic
(a)E-mail: [email protected]
Fig. 1: (Color online) The cut channel, indicating the differ-ent planes used to obtain experimental images. The dot at thecorner of the channel indicates the origin of the coordinates: x1,x2, and, x3 point along the channel’s length Lch, width Wch,and into the substrate along the channel’s depth Dch, respec-tively.
substrate’s x-axis at a velocity vSAW ≈ 3990m/s, contactwith a fluid medium atop the substrate causes someof the SAW’s energy to be radiated into the fluid.With sufficient intensity, this acoustic energy propa-gates as finite amplitude sound radiation traveling ata speed c0 < vSAW (c0 ≈ 1450m/s in water at roomtemperature) in a direction defined by the Rayleighangle θSAW = sin
−1(c0/vSAW). This forms an (Eckart [4])acoustic streaming force in the fluid due to the nonzeroand temporally phase-shifted distribution of the pressureand velocity [5] over centimetre-order length scales.Boundary layer streaming [5] may also arise due to the
47003-p1

M. K. Tan et al.
transmission of shear from the substrate to the fluid and—in contrast to Eckart streaming— is confined to a thinviscous boundary layer of thickness δv ≡
√
2μ/ρfω [6],where μ and ρf are the fluid viscosity and density,respectively, and ω is the angular frequency. Thoughthis form of streaming exists only in the boundary layer,its effects extend outside the layer, driving motion inthe bulk of the fluid [7] as Stokes drift [8]. For particlessuspended in such fluids, one must consider the combinedeffect of Stokesian drag forces (Fdrag) from the adjacentfluid driven by acoustic streaming and the direct acousticforces (Frad) on the particles themselves [9].The acoustic radiation force Frad on an isolated
small rigid spherical particle (Rp≪ λf) in a standing-wave acoustic radiation field in an ideal fluid may beapproximated as Frad ∼ ρf(ω/c0)R
3p|u1|
2 sin (2ωx/c0)F(ρf/ρp) [10,11], where Rp is the radius of the particle,ρp is the density of the particle, x is the distance,and u1 is the acoustic particle velocity in the fluid,essentially the velocity fluctuation produced by thepassage of the wave. The relative density factor isF(ρf/ρp) =
(
1+ 23 (1− ρf/ρp))
/ (2+ ρf/ρp) = 0.328 [10]for ρf = 1000 kg/m
3 and ρp = 1050 kg/m3 for water and
polystyrene, respectively, used throughout this study. Instationary waves, the particles with ρp > ρf must moveto the velocity antinodes at x=± 12πc0/ω,±
32πc0/ω . . . .
With the nonlinear velocity correction (acoustic stream-ing velocity udc), the particle is subjected to a dragforce, Fdrag ∼ μπRpudc [11,12], due to the net motionof the fluid. The suspended particles therefore followthe streamlines when Fdrag Frad is satisfied. Notethat particle compressibility and second-order acousticwave forces due to scattering from nearby particles areinsignificant in the regime under study here, as describedby Doinikov’s work [13].The interaction of SAW with sessile droplets has been
explored [14], thoroughly analysed, and exploited fordroplet transport [15], chaotic convection [16], micropar-ticle concentration [17], and atomisation [18,19]. Curi-ously, the same interaction in microchannels remains unex-plored, where the potential number of applications isarguably far greater due to the ubiquity of such channels inmicrofluidics. Here we examine SAW-fluid interactions insuch channels, combining experimental observations andnumerical modelling to explain the diverse phenomena.
Channel flow induced by SAW. – We cut rectan-gular microchannels Lch = 10mm long and Dch = 180μmdeep with widths of Wch = 30, 50, 150, 200 and 280μminto the LN substrates of devices designed to operate inthe VHF range at 20 and 30MHz using a KrF 248 nmexciplex laser (Extech Ltd., Oxford, England) as shownin fig. 1. The SAW wavelength λSAW is approximately200μm and 133μm, respectively. The microchannel wasthen filled with a deionized aqueous, homogeneous suspen-sion of either φp = 500 nm or 1μm diameter spherical fluo-rescent polystyrene particles (BioScientific, Gymea NSW)
Fig. 2: (Color online) Images (a)–(d) showing typical flowbehavior along plane B-B in Wch = 50, 150, 200, and 280µmwide microchannels while driven by 20MHz SAW. Note thetransition from (a) uniform flow to (d) mixing flow as the widthof the channel is increased while the frequency and input powerare held constant at 20MHz and 400mW, respectively. Thebehavior along plane C-C is rather different: 500 nm particlescollect into either one or six lines in a (e) 30µm or (f) 200µmwide channel, respectively, under 30MHz SAW excitation.
both selected to ensure that φp≪ λf and φp≪Wch: atroom temperature, λf ≈ 73 and 48μm for the 20MHz and30MHz sound waves in water, respectively. The differ-ent planes in fig. 1 are sections along the channel whereexperimental observations were made. A damping material(α-gel, Geltec Ltd., Yokohama, Japan) was used to mini-mize wave reflection from the ends of the substrate andthus suppress wave interference throughout. The flowbehaviour in the channel was determined using micro-scopic flow visualization (BXFM stereomicroscope andiSpeed camera, Olympus, Japan) at 60 frames/second.In a 50μm wide channel, the fluid uniformly flows in
the same direction as the SAW radiation at approximately3.5mm/s along plane B-B (fig. 2(a)) while the SAWdevice is driven at 20MHz and 400mW (see supplemen-tary video effectofchannelwidth 1.mov). As the widthof the channel in the 20MHz device is increased fromWch = 150, 200, to 280μm, the flow becomes progressivelyirregular in figs. 2(b)–(d) while holding the input powerconstant at 400mW. Similarly, the uniform flow transi-tions through oscillatory to vortex-rich, mixing flow inthe 30MHz device when Wch increases beyond 30μm. Inboth cases flow irregularities appear when Wch >λf , indi-cating a frequency-dependent transition between uniformand mixing flow that presents interesting possibilities formixing through using higher harmonics or a second inter-digital electrode in a SAW device. At plane C-C anddeeper in the channel, however, the streaming flow veloc-ity is lower and particles are therefore able to collect alongequally spaced lines roughly parallel to the x-axis as shownin figs. 2(e), (f).
Numerical model. – To analyse the problem, atwo-dimensional numerical model of the phenomena wasconstructed for the (x1, x2)-plane illustrated in figs. 1and 3, including the linear piezoelectric coupling equa-tions [20] and hydrodynamic equations [5,6,21].
47003-p2
Rapid fluid flow and mixing induced in microchannels using surface acoustic waves
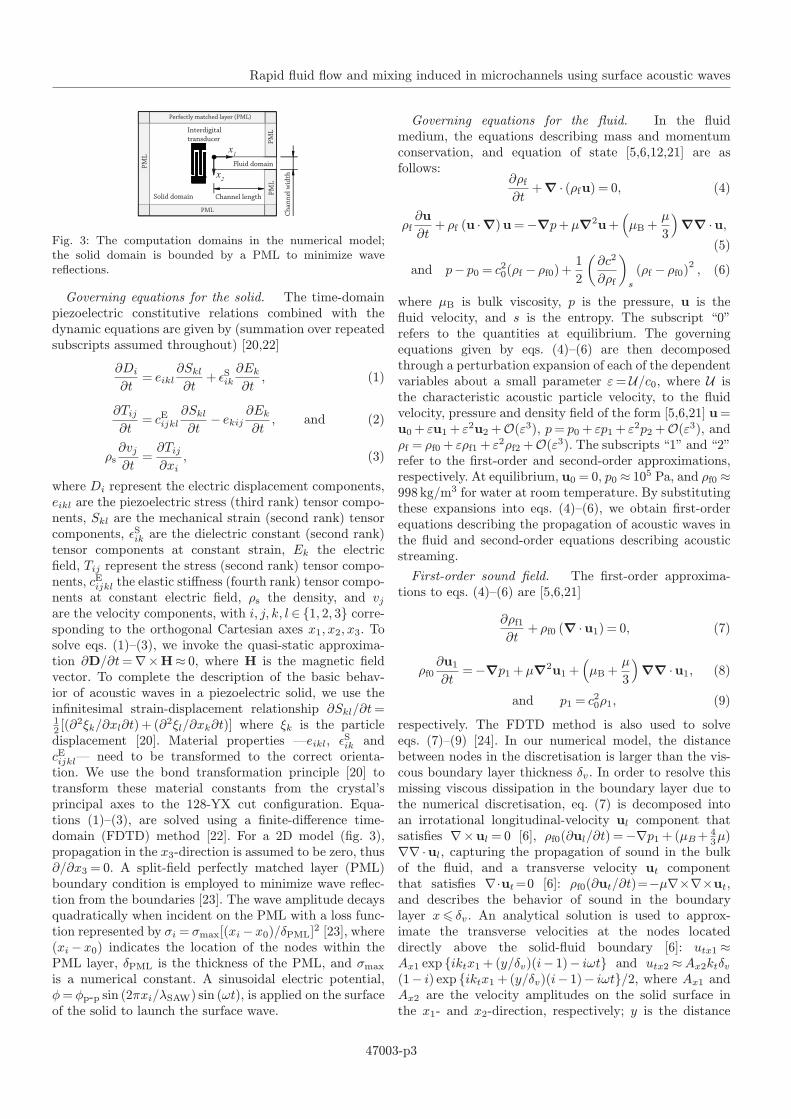
Fig. 3: The computation domains in the numerical model;the solid domain is bounded by a PML to minimize wavereflections.
Governing equations for the solid. The time-domainpiezoelectric constitutive relations combined with thedynamic equations are given by (summation over repeatedsubscripts assumed throughout) [20,22]
∂Di∂t= eikl
∂Skl∂t+ ǫSik
∂Ek∂t, (1)
∂Tij∂t= cEijkl
∂Skl∂t− ekij
∂Ek∂t, and (2)
ρs∂vj∂t=∂Tij∂xi, (3)
where Di represent the electric displacement components,eikl are the piezoelectric stress (third rank) tensor compo-nents, Skl are the mechanical strain (second rank) tensorcomponents, ǫSik are the dielectric constant (second rank)tensor components at constant strain, Ek the electricfield, Tij represent the stress (second rank) tensor compo-nents, cEijkl the elastic stiffness (fourth rank) tensor compo-nents at constant electric field, ρs the density, and vjare the velocity components, with i, j, k, l ∈ 1, 2, 3 corre-sponding to the orthogonal Cartesian axes x1, x2, x3. Tosolve eqs. (1)–(3), we invoke the quasi-static approxima-tion ∂D/∂t=∇×H≈ 0, where H is the magnetic fieldvector. To complete the description of the basic behav-ior of acoustic waves in a piezoelectric solid, we use theinfinitesimal strain-displacement relationship ∂Skl/∂t=12 [(∂
2ξk/∂xl∂t)+ (∂2ξl/∂xk∂t)] where ξk is the particle
displacement [20]. Material properties —eikl, ǫSik and
cEijkl— need to be transformed to the correct orienta-tion. We use the bond transformation principle [20] totransform these material constants from the crystal’sprincipal axes to the 128-YX cut configuration. Equa-tions (1)–(3), are solved using a finite-difference time-domain (FDTD) method [22]. For a 2D model (fig. 3),propagation in the x3-direction is assumed to be zero, thus∂/∂x3 = 0. A split-field perfectly matched layer (PML)boundary condition is employed to minimize wave reflec-tion from the boundaries [23]. The wave amplitude decaysquadratically when incident on the PML with a loss func-tion represented by σi = σmax[(xi−x0)/δPML]
2 [23], where(xi−x0) indicates the location of the nodes within thePML layer, δPML is the thickness of the PML, and σmaxis a numerical constant. A sinusoidal electric potential,φ= φp-p sin (2πxi/λSAW) sin (ωt), is applied on the surfaceof the solid to launch the surface wave.
Governing equations for the fluid. In the fluidmedium, the equations describing mass and momentumconservation, and equation of state [5,6,12,21] are asfollows:
∂ρf∂t+∇ · (ρfu) = 0, (4)
ρf∂u
∂t+ ρf (u ·∇)u=−∇p+μ∇
2u+(
μB+μ
3
)
∇∇ ·u,
(5)
and p− p0 = c20(ρf − ρf0)+
1
2
(
∂c2
∂ρf
)
s
(ρf − ρf0)2, (6)
where μB is bulk viscosity, p is the pressure, u is thefluid velocity, and s is the entropy. The subscript “0”refers to the quantities at equilibrium. The governingequations given by eqs. (4)–(6) are then decomposedthrough a perturbation expansion of each of the dependentvariables about a small parameter ε= U/c0, where U isthe characteristic acoustic particle velocity, to the fluidvelocity, pressure and density field of the form [5,6,21] u=u0+ εu1+ ε
2u2+O(ε3), p= p0+ εp1+ ε
2p2+O(ε3), and
ρf = ρf0+ ερf1+ ε2ρf2+O(ε
3). The subscripts “1” and “2”refer to the first-order and second-order approximations,respectively. At equilibrium, u0 = 0, p0 ≈ 10
5 Pa, and ρf0 ≈998 kg/m3 for water at room temperature. By substitutingthese expansions into eqs. (4)–(6), we obtain first-orderequations describing the propagation of acoustic waves inthe fluid and second-order equations describing acousticstreaming.
First-order sound field. The first-order approxima-tions to eqs. (4)–(6) are [5,6,21]
∂ρf1∂t+ ρf0 (∇ ·u1) = 0, (7)
ρf0∂u1∂t=−∇p1+μ∇
2u1+(
μB+μ
3
)
∇∇ ·u1, (8)
and p1 = c20ρ1, (9)
respectively. The FDTD method is also used to solveeqs. (7)–(9) [24]. In our numerical model, the distancebetween nodes in the discretisation is larger than the vis-cous boundary layer thickness δv. In order to resolve thismissing viscous dissipation in the boundary layer due tothe numerical discretisation, eq. (7) is decomposed intoan irrotational longitudinal-velocity ul component thatsatisfies ∇×ul = 0 [6], ρf0(∂ul/∂t) =−∇p1+(μB+
43μ)
∇∇·ul, capturing the propagation of sound in the bulkof the fluid, and a transverse velocity ut componentthat satisfies ∇·ut=0 [6]: ρf0(∂ut/∂t)=−μ∇×∇×ut,and describes the behavior of sound in the boundarylayer x δv. An analytical solution is used to approx-imate the transverse velocities at the nodes locateddirectly above the solid-fluid boundary [6]: utx1 ≈Ax1 exp iktx1+(y/δv)(i− 1)− iωt and utx2 ≈Ax2ktδv(1− i) exp iktx1+(y/δv)(i− 1)− iωt/2, where Ax1 andAx2 are the velocity amplitudes on the solid surface inthe x1- and x2-direction, respectively; y is the distance
47003-p3

M. K. Tan et al.
from the solid-fluid boundary, and kt ≈ ω/c0. At thesolid-fluid interface, continuity between the substrate andfluid velocities is maintained using linear interpolationbetween the meshes while preserving the interface profile.Since the equations for the solid and fluid are solvedsimultaneously, at each time step the fluid pressure iscoupled back into the solid through conservation of forceat the interface;
∑i=nfi=1 p1 =
∑i=nsi=1 T2 at x2 = 0 and Wch,
where ns and nf are the total number of nodes for thesolid and fluid at the interface.
Second-order fluid streaming. In the second-ordersystem, the fluid motion consists of a superposition ofthe steady-state and the time-oscillating harmonic flows.Substituting expanded variables into eqs. (4) and (5),collecting terms of second-order, and subsequently time
averaging (〈a〉= 1/T∫ T
0a(t) dt) all second-order terms,
the following equations are obtained [5,21]:
Fdc ≡ ρf0udc
∂t+∇pdc−μ∇
2udc−(
μB+μ
3
)
∇∇ ·udc,
(10)where the body force density Fdc (N/m
2) is given by
Fdc =−
⟨
ρf1∂u1∂t
⟩
− ρf0〈(u1 ·∇)u1〉, (11)
wherein the parenthesis 〈·〉 refers to time averaging andthe subscript “dc” refers to the steady state. The first-order fluid velocity u1 is then substituted into eq. (11) toobtain the body force distribution, while the streamingvelocity udc, is obtained by solving eq. (10) using theconventional finite-difference approach [25]. Through themethod of perturbation expansions, the quantities of theexpanded variables in the second-order system are muchsmaller than their first-order counterparts, i.e., udc≪ u1and pdc≪ p1, therefore the second-order system is notcoupled with the solid.Our numerical model described above is considerably
more detailed than has been considered in the past [26],capturing fluid-structural coupling, including the effectsof oscillating boundary conditions with temporally vary-ing phase as required with Rayleigh waves, viscosity andthe concomitant formation of a viscous boundary layer,and the attenuation of the SAW as it propagates alongthe channel due to the presence of the fluid within. Thatsaid, the numerical analysis does not directly include theparticles used in the experimental work to characterise theflow. Doing so would greatly complicate the analysis forlittle benefit, since the particle density in the experimentsis purposely kept low to avoid affecting the fluid’s behav-iour, i.e., to keep it newtonian, and to allow us to seewhat is happening without being overwhelmed with anexcessive number of particles. We do consider, however,how the particles that are present are affected by the fluidflow and acoustic field in the following part of the paper.
Underlying physical mechanisms. – We now turnour attention to understanding the physical mechanisms
Fig. 4: (Color online) The channel’s fluid velocity magnitude,viewed top-down, with x1 from left to right. Over time —(a)4 and (b) 10 cycles of 20MHz signal input, respectively—the SAW refracts into the channel. At far left, the SAW isdirectly transmitted into the fluid from the solid at the end ofthe channel, while slightly farther to the right, the radiationfrom the end of the channel interferes with the radiation beingemitted from the channel sides at the Rayleigh angle. Farther tothe right, especially at the center in (b), the acoustic radiationfrom the channel’s sides dominate because the SAW is farfaster in the solid than the fluid, outrunning the radiationpropagating in the fluid along the channel in the x1-direction.
responsible for three interesting characteristics of the flowand particle behavior in the microchannel: particle collec-tion in serpentine lines parallel to the channel walls,transition between uniform and vortical flow, and parti-cle motion opposing the SAW propagation. Results fromthe numerical model are provided in fig. 4 onward. Thequalitative agreement between analysis and experimentprovides coherent insight into the counterintuitive phys-ical phenomena. The computed magnitude of the soundvelocity |u1| is shown in fig. 4 after 4 and 10 cycles of20MHz signal input in a 280μm wide channel. We observethe emergence of a transverse standing acoustic wave ata distance approximately 560μm (2×Wch) downstreamfrom the leading edge of the channel (x1 = 0), outsidethe domain influenced by direct SAW irradiation fromthe channel end at left. Given that the two side wallsof the microchannel at x2 = 0,Wch act as parallel radia-tors, the transmitted acoustic waves superimpose to forma transverse standing-wave across the channel width. It isthis standing wave that appears to cause agglomeration ofparticles along lines parallel to the walls of the channel.Numerical and experimental results in fig. 5 indicate
500 nm particles are trapped at the nodes of the pressurefield. A 280μm wide channel under 20MHz SAW excita-tion forms six lines of particles aligned to the quiescentregions in the pressure field in the fluid. This is consistentwith past results [10–12] since the density of the parti-cles (ρp ≈ 1050 kg/m
3) is slightly higher than the densityof the fluid, i.e., ρp > ρf . Figure 5(a) shows the solutioncorresponding to fig. 4(b) for the first-order fluid pressurefield, p1, in the 280μm wide channel at the end of thetenth cycle. Also shown are 500 nm particles as they collectalong lines in plane C-C (fig. 5(b)); the separation betweenthe particle collection lines is approximately 36μm forthe 20MHz device and 24μm for a 30MHz device (notshown), corresponding to λf/2 for both the computation
47003-p4

Rapid fluid flow and mixing induced in microchannels using surface acoustic waves
Fig. 5: (Color online) Calculated (a) first-order pressure distrib-ution, p1, in the fluid in a 280µmwide channel shows the stand-ing wave formed by cross-channel interference between wavespropagating from either side of the channel after 10 cycles.Experimental image (b) shows the collection of 500 nm particlesat matching locations across the 280µm channel along planeC-C when driven by 20MHz SAW. Comparison (c) between thenumerical and experimental results indicate that the particlescollect along the nodes of the pressure field.
Fig. 6: Velocity contour plots (a) and (b) of v2 for 4 and 8 cycles,respectively, of waves propagating in the 128-YX LN whena sinusoidal electric potential is applied on one interdigitaltransducer electrode pair (see fig. 1); the fluid-filled channelis represented by the white slot at the right of each image.The motions of the solid elements (v2) along the side walls atx2 = 0,Wch are 180
out of phase.
and experiment. The number of collection lines is alwaysan integer number of nodal lines with separation λf/2that fit within the given channel width, consistent withpast studies [27,28] and our results in fig. 2(e), (f). Thedifferent number of collection lines in these results is due tothe different channel widths. Similar behavior is observedif 1μm particles are used.The motion of the solid elements v2 along the side
walls at x2 = 0,Wch as shown in fig. 6, are 180 out of
phase. As the sound waves emanate from these side walls,they form an interference pattern in the fluid, shownclearly in figs. 4 and 5. Therefore, asymmetry in theinstantaneous transverse velocity, v2, of the standing wavemay occur only if Wch >λf and Wch = nλf where n=1, 2, . . . . Since the transition from uniform flow in fig. 2(a)to the oscillatory behavior exhibited in figs. 2(b)–(d) canbe attributed to symmetry breaking of the instantaneoustransverse velocity field, it then becomes clear why thetransition is observed when Wch >λf .These particles counterintuitively move along the lines
in a direction opposing the propagation direction of theSAW (figs. 7(a)–(d)), though in agreement with thenumerically obtained velocity field shown in fig. 7(e).
δυ
Fig. 7: (Color online) The (a) accumulation of 500 nm particlesat the nodes of the pressure field in a 150µm wide channelappear to be moving right to left along the nodal lines inopposition to the SAW propagating from left to right, as shownin the magnified sequence (b), (c), (d). A computed vectorplot (e) of the acoustic streaming velocity after 12 cycles ofsignal input indicates the flow in the 280µm wide channelopposes the SAW propagation. The reason for the serpentinedeformation of the nodal lines is (f) illustrated to be aconsequence of the channel wall motion and the vortical flowin the viscous boundary layer of thickness δv, giving rise totransverse streaming forces (g) calculated in the x1 (
) andx2 (×) directions at x1 = 1.48mm.
Figure 7(f) depicts the trajectories of the elements inthe solid wall adjacent to the fluid at x2 = 0,Wch; notethe retrograde trajectory of the wall to the direction ofSAW propagation [5]. The large acceleration of theseelements gives rise to a large streaming force in thex1-direction within the viscous boundary layer of thicknessδv ≈ 4.9× 10
−7m due to the large dissipative effects there.Note the sharp increase in Fx1 near the wall in fig. 7(g).Consequently, strong clockwise vortical flow arises in theboundary layer in fig. 7(f). Outside the boundary layer,the effects of fluid compression become insignificant, anda net fluid flow develops in opposition to the direction ofthe SAW radiation [5]. The clockwise vortices generate atime-averaged inertial force in the bulk of the fluid. Thiscan be shown by recasting eq. (11) in terms of the vorticityΩ= 12∇×u1:
Fdc=−1
c20
⟨
p1∂u1∂t
⟩
−ρ02〈∇ (u1 ·u1)〉+2ρ0〈u1×Ω〉. (12)
47003-p5
M. K. Tan et al.
The last term on the right-hand side of the equation aboveresembles the effective slip [5] or Stokes’ drift [8] boundarycondition at x2 = δv,Wch− δv, and gives rise to flow in thebulk opposing the propagation direction of the SAW acrossthe entire width of the channel (fig. 7(e)). This is predictedby the small but net negative values of Fx1 in fig. 7(g)averaged across the channel cross-section, and is furtherconsistent with the experimentally observed direction inwhich the particles move (figs. 7(b)–(d)).A closer experimental examination of the particle
“lines” exposes serpentine-like undulations of particletrajectories in figs. 7(b)–(d). This is consistent with thelocal variation of the numerically predicted transversevelocity along x2, illustrated in fig. 7(e). The undulationof the channel walls as a consequence of the SAW radi-ation, depicted in fig. 7(f), generates a streaming forcein the transverse direction Fx2 . It is much stronger inthis direction than in the axial direction Fx1 in fig. 7(f),suggesting why the serpentine-like particle trajectoriesin figs. 7(b)–(d) appear. Essentially, these suspendedparticles in aqueous solution are subjected to two domi-nant forces: Frad and Fdrag. The particles are drivenby the first-order standing wave field to accumulateat nodal lines of the pressure field and drawn alongthe lines by the acoustic streaming in opposition to thepropagation direction of the SAW. By using the quantitiesRp ≈ 5× 10
−7m, f ≈ 20× 106Hz, and μ≈ 0.789× 10⁻³
kg/(m·s), we find Frad ∼ 10−11u21 and Fdrag ∼ 10
−9udc.We measured u1 ∼ 10
−1 m/s on the surface of thesolid substrate using laser Doppler vibrometry (PolytecMSA-400, Waldbrunn, Germany) and determined thestreaming fluid flow speed for the plane C-C (see fig. 1)to be udc ∼ 10
−4m/s by high-speed microvideography,giving Fdrag ∼ 10
−13N while Frad ∼ 10−13N, suggesting
the particles trapped along the pressure node lines willtend to stay, though they do experience a drag forceFdrag as a result of the acoustic streaming responsiblefor their motion along these lines. Along plane B-B, onthe other hand, the fluid flow is faster; we measuredudc ∼ 10
−3m/s, giving Fdrag ∼ 10−12N, greater than
Frad ∼ 10−13N. The acoustic streaming overwhelms the
acoustic radiation forces on the particles, dragging theparticles out of the nodal lines and into the vortex mixingflow seen in fig. 2(b)–(d).With these features, the two-dimensional model offers
sufficient veracity to describe the behavior of the experi-mentally observed flow even with a free surface along thetop of the fluid channel absent in the numerical treatment.Capillary waves that may appear as a consequence of VHFSAW excitation and which are so vital to other configura-tions for atomisation [18] or droplet motion [29] are weakhere. We speculate the undulating flow patterns appear-ing in channels of widths larger than the wavelengthof sound, Wch >λf , in fig. 2(b)–(d) arise from the samevortical streaming patterns observed in fig. 7(e), since theconfiguration and characteristic length scales of these patt-erns, 50–100μm, are similar in both the experiments
and numerical results. The reversal in the net flowdirection in plane B-B occurs due to flow conservationwhich requires the fluid to recirculate within the closedmicrochannel, perhaps extending to closed microchannelpumps [30].
REFERENCES
[1] Laser D. and Santiago J., J. Micromech. Microeng., 14(2004) R35.
[2] Stone H., Stroock A. andAjdari A.,Annu. Rev. FluidMech., 36 (2004) 381.
[3] White R. and Voltmer F., Appl. Phys. Lett., 7 (1965)314.
[4] Eckart C., Phys. Rev., 73 (1948) 68.[5] Bradley C., J. Acoust. Soc. Am., 100 (1996) 1399.[6] Morse P. and Ingard K., Theoretical Acoustics(MacGraw-Hill) 1968.
[7] Riley N., Annu. Rev. Fluid Mech., 33 (2001) 43.[8] Bertelsen A., Svardal A. and Tjøtta S., J. FluidMech., 59 (1973) 493.
[9] Aboobaker N., Blackmore D. andMeegoda J., Appl.Math. Model., 29 (2005) 515.
[10] King L., Proc. R. Soc. London, Math. Phys. Sci., 861(1934) 212.
[11] Qi Q. and Brereton G., IEEE Trans. Ultrason. Ferro-electr. Freq. Control, 42 (1995) 619.
[12] Rozenberg L., High-Intensity Ultrasonic Fields (PlenumPress) 1971.
[13] Doinikov A., Phys. Rev. E, 54(6) (1996) 6297.[14] Yeo L. and Friend J., Biomicrofluidics, 3 (2009) 012002.[15] Tan M., Friend J. and Yeo L., Lab Chip, 7 (2007) 618.[16] Frommelt T., Kostur M., Schafer M., Talkner P.,
Hanggi P. and Wixforth A., Phys. Rev. Lett., 100(2008) 034502.
[17] Li H., Friend J. and Yeo L., Biomed. Microdevices, 9(2007) 647.
[18] Qi A., Yeo L. and Friend J., Phys. Fluids, 20 (2008)074103.
[19] Friend J., Yeo L., Arifin D. and Mechler A.,Nanotechnology, 19 (2008) 145301.
[20] Auld B., Acoustic Fields and Waves in Solids (Wiley)1973.
[21] Nyborg W., Acoustic Streaming (Academic Press) 1965.[22] Chagla F. and Smith P., IEEE Trans. Ultrason. Ferro-
electr. Freq. Control, 53 (2006) 1895.[23] Schroder C. and Scott W., IEEE Trans. Geosci.
Remote Sens., 38 (2000) 1505.[24] Bottledooren D., J. Acoust. Soc. Am., 102 (1997)
170.[25] Anderson J., Computational Fluid Dynamics: The
Basics with Application (McGraw-Hill) 1995.[26] Secomb T., J. Fluid Mech., 88 (1978) 273.[27] Vainshtein P., Fichman M., Shuster K. and
Gutfinger C., J. Fluid Mech., 306 (1996) 31.[28] Spengler J., Coakley W. and Christensen K.,
AIChE J., 49 (2003) 2773.[29] Tan M., Friend J. and Yeo L., Appl. Phys. Lett., 91
(2007) 224101.[30] Girardo S., Cecchini M., Beltram F., Cingolani R.
and Pisignano D., Lab Chip, 8 (2008) 1557.
47003-p6