mechanism of electrocardiographic t … · mechanism of electrocardiographic t-wave flattening in...
TRANSCRIPT

MECHANISM OF ELECTROCARDIOGRAPHIC T-WAVE FLATTENING IN
DIABETES MELLITUS: EXPERIMENTAL AND SIMULATION STUDY
Ksenia A. Sedova1,2*
, Jan E. Azarov2,3
, Natalia V. Arteyeva
2, Alexey O. Ovechkin
2,5, Marina
A. Vaykshnorayte2, Vladimir A. Vityazev
2,4, Olesya G. Bernikova
2,5, Dmitry N. Shmakov
2,
Peter Kneppo1
1Department of Biomedical Technology, Faculty of Biomedical Engineering, Czech Technical
University in Prague, Kladno, Czech Republic, 2
Laboratory of Cardiac Physiology, Institute of
Physiology, Komi Science Center, Ural Branch, Russian Academy of Sciences, Syktyvkar,
Russia, 3Department of Cardiology, Lund University, Lund, Sweden,
4Department of
Physiology, Medical Institute of Pitirim Sorokin Syktyvkar State University, Syktyvkar, Russia,
5Department of Internal Diseases Medical Institute of Pitirim Sorokin Syktyvkar State
University, Syktyvkar, Russia
*Correspondence: Ksenia A. Sedova, Department of Biomedical Technology, Faculty of
Biomedical Engineering, Czech Technical University in Prague. Sítná sq. 3105, 27201, Kladno,
Czech Republic. E-mail: [email protected] Tel: +420775535282
Short title: T-wave in diabetes mellitus

2
Summary
In the present study we investigated the contribution of ventricular repolarization time (RT)
dispersion (the maximal difference in RT) and RT gradients (the differences in RT in apicobasal,
anteroposterior and interventricular directions) to T-wave flattening in a setting of experimental
diabetes mellitus.
In 9 healthy and 11 diabetic (alloxan model) open-chest rabbits, we measured RT in ventricular
epicardial electrograms. To specify the contributions of apicobasal, interventricular and
anteroposterior RT gradients and RT dispersion to the body surface potentials we determined
T-wave voltage differences between modified upper- and lower-chest precordial leads (T-wave
amplitude dispersions, TWAD). Expression of RT gradients and RT dispersion in the
correspondent TWAD parameters was studied by computer simulations.
Diabetic rabbits demonstrated flattened T-waves in precordial leads associated with increased
anteroposterior and decreased apicobasal RT gradients (P<0.05) due to RT prolongation at the
apex. For diabetics, simulations predicted the preserved T-vector length and altered sagittal and
longitudinal TWAD proven by experimental measurements.
T-wave flattening in the diabetic rabbits was not due to changes in RT dispersion, but reflected
the redistributed ventricular repolarization pattern with prolonged apical repolarization resulting
in increased anteroposterior and decreased apicobasal RT gradients.
Key words: Diabetes; Dispersion of repolarization; Repolarization gradients; T-vector; T-wave

3
Introduction
Diabetes mellitus (DM) is a recognized public health burden, characterized, among other
complications, by increased risk of life-threatening ventricular arrhythmias and sudden cardiac
death (Spooner 2008). An underlying functional arrhythmic substrate requires the presence of
several conditions, including an increased dispersion of repolarization (DOR) defined as a
maximal difference between repolarization times (RT) irrespective of lead sites within the
ventricular myocardium. Relationship between RT differences and T-wave generation on the
body surface ECG provides a rationale for using electrocardiographic T-wave indices to estimate
heterogeneities of repolarization as well as arrhythmia susceptibility.
Diabetic patients demonstrate changes in both QT interval duration and T-wave
amplitude (Kittnar 2016). However, the electrophysiological basis for these alterations is not
fully established. The mechanism of prolongation of rate-corrected QT intervals is relatively
clear and is attributed to lengthening of action potential durations (Magyar et al. 1992).
However, the mechanism of T-wave voltage changes in DM has not been directly studied. As
T-wave genesis is usually attributed to ventricular repolarization gradients (RT differences on
definite axes, such as apicobasal, interventricular, anteroposterior and transmural) (Meijborg et
al. 2014), it is reasonable to suggest that flattening of the T-wave in diabetics results from RT
redistribution within heart ventricles. However, such repolarization pattern could correspond to
two conditions: either 1) DOR decreases but the proportion between RT gradients is the same; or
2) a predominant repolarization gradient changes but the DOR magnitude preserves.
Distinguishing between these two alternatives is important, as the former is expected to affect the
reentrant arrhythmogenesis, while the latter could reflect involvement of specific myocardial
regions. Therefore, elaborating on how the different ventricular repolarization gradients and
DOR contribute to the DM-related T-wave changes is needed for a comprehensive ECG
interpretation.

4
T-wave amplitude parameters have been studied less extensively than temporal markers;
however, evaluating T-wave amplitude could be a promising approach for assessing
repolarization heterogeneity. Our previous study (Sedova et al. 2015) demonstrated that DOR
changes were associated with T-wave amplitude dispersion (TWAD), defined as the difference
in the T-wave peak voltages between upper- and lower-chest precordial leads. However, a
concept of T-wave generation in a given condition is required for clearly interpretating its
amplitude changes.
An objective of the present study was to determine the contribution of apicobasal,
interventricular and anteroposterior repolarization gradients and DOR to body surface T-wave
parameters in an experimental rabbit DM model. Previous investigations (Arteyeva et al. 2013,
Meijborg et al. 2014, Arteyeva et al. 2015) suggested that transmural gradient contribution to
generating T waves was much less pronounced, if at all present, as compared to the contribution
of other gradients. Therefore, here we did not address the transmural gradient, instead focusing
studying the epicardial repolarization pattern.
Methods
Overview
We (i) experimentally recorded cardiac potentials on body and epicardial surfaces in control and
diabetic rabbits; (ii) described differences between the two groups in apicobasal, interventricular
and anteroposterior RT gradients; (iii) constructed x-, y-, and z- components of T-vector for the
diabetics and controls on the basis of experimentally-measured RT gradients; (iv) simulated
body surface potential distributions using these constructed T-vector components; (v) compared
computed and measured body surface potentials in both groups; (vi) compared T-vector
components derived from measured body surface potentials between control and diabetic groups;
and (vii) tested if a relationship between these measured T-vector components is similar to the
relationship between experimentally-determined RT gradients.
5
Experimental study
The experiments were performed on Chinchilla breed rabbits of either sex, age of 6-8
months and body mass of 2.5-4.0 kg. The procedures conformed to the Guide for the Care and
Use of Laboratory Animals, 8th Edition published by the National Academies Press (US) 2011
and to the Declaration of Helsinki and were approved by the ethical committee of the Institute of
Physiology of the Komi Science Centre, Ural Branch of the Russian Academy of Sciences. Type
1 DM was induced in 11 animals (7 males) by a single dose of alloxan (120 mg/kg body weight,
i.v.) and 9 (6 males) animals served as controls.
After one month, DM and control rabbits were anesthetized with Zoletil (15 mg/kg body
weight, i.m.) and put on mechanical ventilation. ECGs were recorded with subcutaneous needle
electrodes from conventional limb leads and six modified precordial leads described elsewhere
(Sedova et al. 2015). In short, there were three upper-chest leads (J1-J3) shifted to the jugular
notch level, and three lower-chest leads (J4-J6) positioned at the inferior costal margin level. J1
and J6 leads and J3 and J4 leads were placed in the right and left anterior axillary lines,
respectively; while J2 and J5 leads were in the midline. After ECG recording, the heart was
exposed via midline incision, and heart temperature was maintained at 37-38C by irrigation
with warm saline and warmed indoor air. At spontaneous sinus rhythm, unipolar ventricular
electrograms were registered from a 64-lead epicardial sock array (3-5 mm interelectrode
distance) in reference to Wilson’s central terminal with a custom-designed mapping system (16
bits; bandwidth 0.05 to 1000 Hz; sampling rate 4000 Hz).
In each epicardial unipolar electrogram, activation time (AT) and repolarization time
(RT) were measured as the instants of the minimum of first time derivative of potential (dV/dt
min) during QRS complex and the maximum of the first time derivative of potential (dV/dt max)
during T wave, respectively, in relation to QRS complex onset in the II limb lead (Coronel, et al.
2006). The activation-recovery interval (ARI) serving as a measure of local repolarization
duration was taken as the difference between RT and AT. Apicobasal, interventricular and
6
anteroposterior RT gradients were calculated using average RT values in the appropriate
epicardial leads (for example, apicobasal RT gradient equaled to the difference between the
average basal RT and the average apical RT, etc, Fig. 1). Total DOR was determined as the
difference between maximal and minimal RT values on the ventricular epicardium (Fig. 1).
T-wave amplitude dispersion (TWAD) parameters were measured as the difference between
T-wave voltages in body surface ECG leads (J1-J6) using formulas suggested for calculating T-
vector components (see below).
Statistical analysis was performed using SPSS 11.5. Data are given as medians and
interquartile intervals. The Mann-Whitney U-test was used to compare control and diabetic
groups of animals. Student’s paired and unpaired t-tests were used to assess intra- and
interobserver variabilities, and agreement between measurements was evaluated with the Bland-
Altman plot. Differences were considered significant at P<0.05.
T-vector components
Direct determination. In order to relate ventricular repolarization gradients to body
surface ECG, we simulated the electrical vector of ventricular repolarization (T-vector) as a
single dipole located in the center of the heart ventricles. T-vector direction was based on
experimentally measured ventricular repolarization gradients: the component Tx was
proportional to the interventricular gradient, the component Ty was proportional to the
apicobasal gradient, and the component Tz was proportional to the anteroposterior gradient (in
vectorcardiographic coordinate system X, Y, Z). A potential distribution produced by this
T-vector was calculated for an elliptical cylinder imitating the torso of a rabbit, taking into
account the heart’s realistic position within the rabbit torso, using the following formula:
φ = (R · T) / R3 (1),

7
where φ is a potential value in an observation point, T is T-vector, R is a vector directed from the
observation point to the T-vector origin, R is the length of R. The computed potentials were
compared with measured body surface ECGs.
Inverse determination. T-vector components were then also inversely calculated from
body surface potentials. Since there is no generally accepted method of calculating VCG from
ECG for the rabbit, we used the following empirical formulas based on differences in potential
magnitude in modified precordial leads J1-J6 taking into account their mutual positions on the
torso.
Longitudinal: Ty = ((J6-J1) + (J4-J3)) / 2 (2),
Left-to-Right: Tx = ((J3-J1) + (J4-J6)) / 2 (3),
Sagittal: Tz = 10 ((J2-J1) + (J2-J3) + (J5-J4) + 2 (J5-J6)) / 4 (4).
Results
Fasting plasma glucose concentration was significantly higher in the diabetic animals
than in controls [26.6 (17.8; 27.5) mmol/l and 5.7 (4.9; 6.0) mmol/l, P < 0.05, respectively],
although both groups were of the same sex, age, body mass and heart mass.
Body surface ECGs
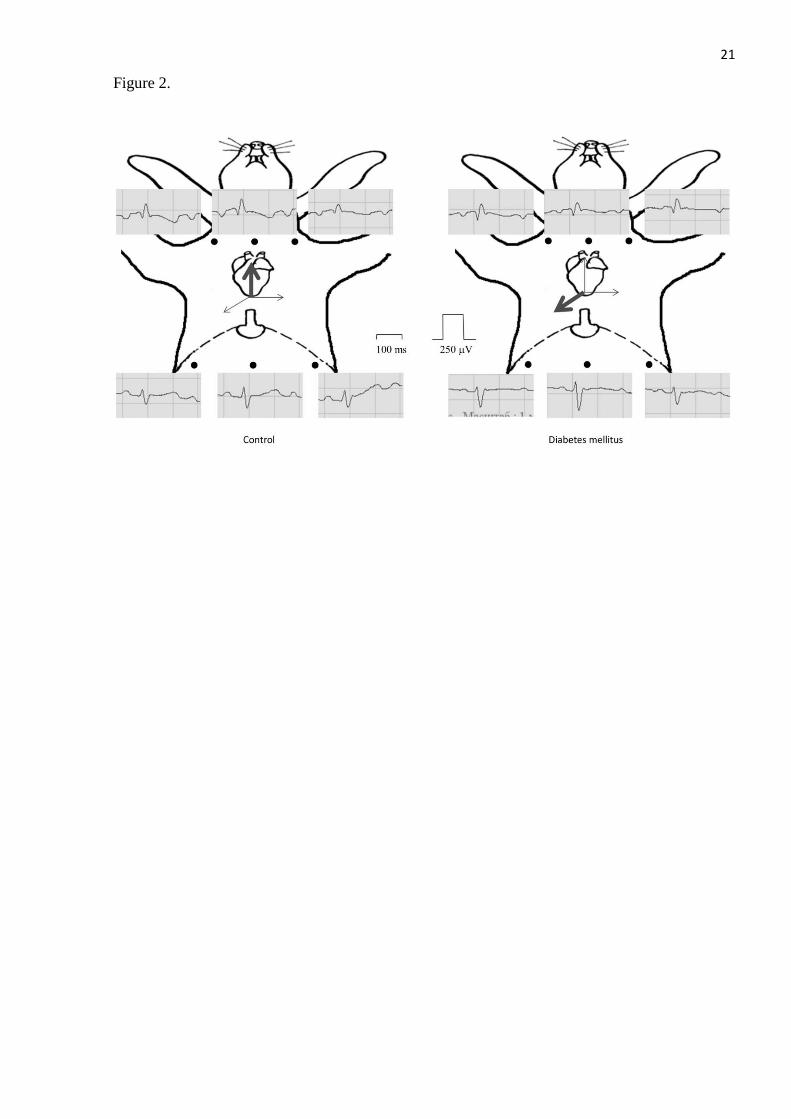
The diabetic rabbits demonstrated flattened T-waves in modified upper-chest and lower-
chest precordial leads (Fig. 2). T-wave amplitudes in individual precordial leads were lower in
the DM group than in the control group (Table 1). Longitudinal, left-to-right and sagittal TWAD
indices calculated using formulas (2-4) (suggested for the corresponding T-vector components)
differed between the control group and the DM group. The diabetic rabbits had greater
TWADsagittal and lower TWADlongitudinal than controls (Table 1).

8
Epicardial potential mapping
AT measurements were done automatically, while determining RTs included inspection
by experienced observers (AOO, MAV). Therefore, the data were tested for inter- and
intraobserver reproducibility. Sample measurements (n=83) done by the same observer on
different days demonstrated no significant differences in RT interval (values are given for the
combined group of healthy and diabetic animals): 186.6 ± 32.1 vs. 185.42 ± 32.9 ms, p=0.91 and
S.D. of the difference was 18.6 ms or 9.9 % of the mean. The difference between the first and the
second observer’s data was also insignificant: 186.1 ± 38.8 vs. 187.0 ± 40.6 ms, p=0.44 and S.D.
of the difference 10.8 ms or 5.8 % of the mean.
At one-month follow-up, rabbits with DM and controls had similar sequences and
durations of ventricular epicardial activation, but the epicardial repolarization pattern differed
between the two groups (Fig. 3). In control animals, repolarization durations (measured as ARIs)
were shorter at the apex and longer at the base manifesting in a dominant apicobasal RT gradient
in respect to interventricular and anteroposterior gradients (Table 1). In diabetic animals,
repolarization durations were redistributed with an area of prolonged ARIs development mainly
on the anterior apical portion (mainly, the heart apex and the adjacent right ventricular area).
This effect resulted in a pattern with decreased apicobasal and increased anteroposterior RT
gradients in the diabetic hearts (Table 1). Despite the differences in ventricular repolarization
gradients, there was no difference in total DOR between the control and DM groups.
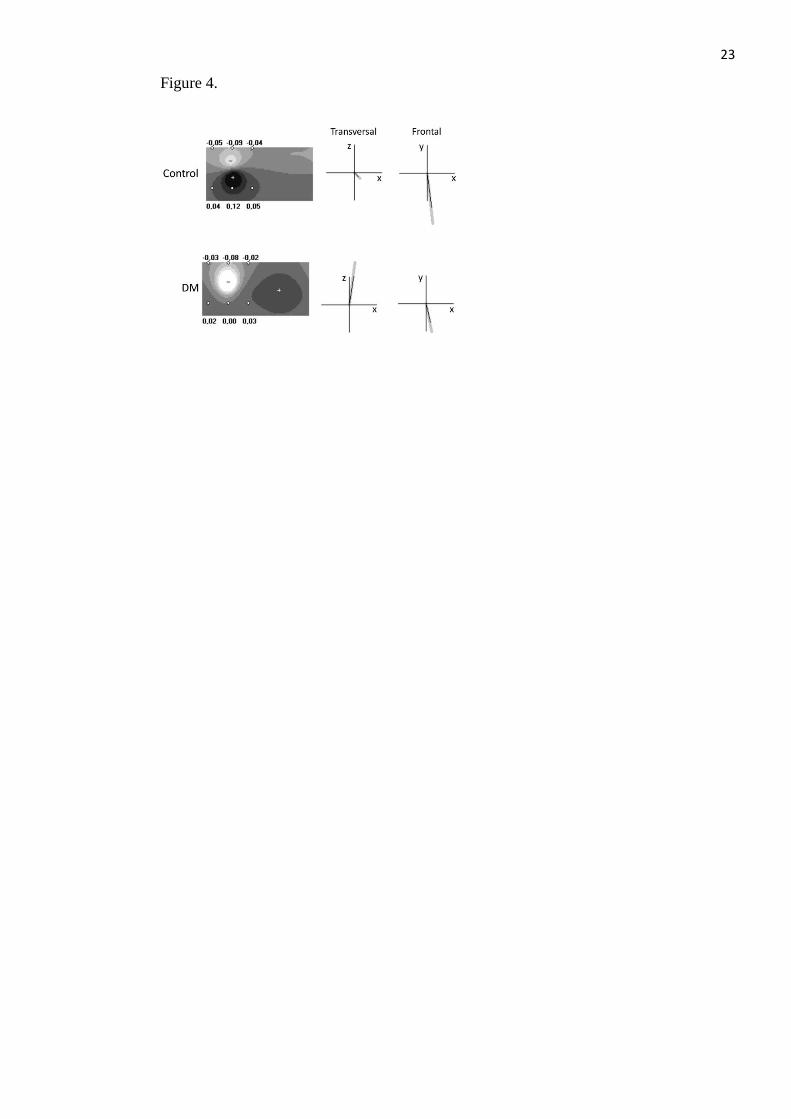
Computer simulations
We simulated body surface potential distributions for both non-diabetic and diabetic
rabbits (Fig. 4) according to experimentally-measured epicardial RT gradients. For the control
rabbit, the T-vector was oriented forward, downward and to the left, with a dominant
longitudinal component. For the diabetic rabbit, T-vector was oriented backward, downward and
to the left, the longitudinal component was decreased, and the anteroposterior component was

9
dominant. T-vector length was the same because total RT dispersion in DM was found to be
close to that of non-diabetic rabbits.
The different T-vector directions in non-diabetic and diabetic animal models resulted in
different simulated body surface potential distributions (Fig. 4). In the points corresponding to
leads J1-J6, potential magnitudes decreased, but their polarity remained unchanged. These
changes were similar to the changes observed in leads J1-J6 in diabetic rabbits (Fig. 2). T-vector
directions calculated from the differences in measured potential magnitude in leads J1-J6 were
similar to T-vector directions set in the model on the basis of measured RT gradients (Fig. 4).
Discussion
In order to explain the T-wave changes in DM, we first studied the spatial patterns of
ventricular repolarization, then reconstructed the expression of these cardiac repolarization
patterns in body surface potentials using computer simulations. Finally, we tested the predictions
of simulations by comparing measured body surface potential distributions in non-diabetic and
diabetic animals.
Our primary objective was to find out the DM-related T-wave flattening mechanisms as
they relate to changing ventricular gradients of repolarization. We found that the decrease in
T-wave amplitudes in modified precordial leads was associated with altering two repolarization
gradients, namely: 1) increase in the anteroposterior gradient with early posterior and late
anterior RTs, and 2) decrease in the apicobasal gradient. These two differences between
non-diabetic and diabetic rabbits were accounted for by repolarization duration prolongation at
the RV apex, located mostly anteriorly. The specific involvement of RV in diabetic
cardiomyopathy was reported earlier (Karamitsos et al. 2007, van den Brom et al. 2010,
Vaykshnorayte et al. 2012, Olsen et al. 2013, Axelsen et al. 2015). Our study suggests that
T-wave flattening was the electrocardiographic expression of the RV electrophysiological
alteration, at least in the present DM model. The repolarization prolongation in DM is usually
10
ascribed to the down-regulation of potassium currents (Zhang et al. 2007, Lengyel et al. 2008,
Gallego et al. 2009); however, the exact mechanism of such spatially specific
electrophysiological effect is largely unknown. Previous studies (Palova et al. 2010, Ovechkin et
al. 2014) showed that an abnormal sympathetic tone possibly plays a role.
Thus, a redistributed spatiotemporal ventricular repolarization pattern in diabetic rabbits
was associated with flattened body surface T-waves. Theoretically, the observed changes in body
surface T-wave voltages associated with DM could be ascribed to three different myocardial
alterations, namely: 1) decrease of the apicobasal RT gradient; 2) increase of the anteroposterior
RT gradient; and 3) replacement of the apicobasal RT gradient by the anteroposterior RT
gradient as a dominant RT gradient. In the context of arrhythmogenesis, it is important to note
that these scenarios implied decreased, increased or unchanged DOR, respectively. Thus, further
specification of the contribution of the different repolarization gradients to body surface
potentials is required. As the next step of the present study, we performed computer simulations
in order to test if T-wave voltage parameters could distinguish between the different variants of
ventricular repolarization changes in DM.
Despite the de facto disappearance of vectorcardiography from routine clinical practice,
vectorial characteristics of the repolarization cardiac electric field derived from ECG records are
considered useful for diagnosis and prognosis (Man et al. 2015). Such indices could be obtained
by reconstructing a vectorcardiogram from ECGs (Schreurs et al. 2010, Engels et al. 2015). The
resultant T-vector is a characteristic related to the vectorcardiographic loop, and is considered to
be a simple and useful representation of the ventricular repolarization process (Waks et al. 2015,
Cortez et al. 2016), where its direction reflects the gross repolarization sequence, its length
(magnitude) is proportional to the resultant intensity of electric generators in the heart ventricles
(indirectly total DOR), and its apicobasal, interventricular and anteroposterior components are
related to the apicobasal, interventricular and anteroposterior RT gradients, respectively. The
modified precordial leads J1-J6 were positioned on the body surface so that the heart was the

11
center of symmetry, which allowed us to easily obtain the relationship between the apicobasal
and interventricular T-vector components and the correspondent longitudinal and left-to-right
TWAD indices. Since the heart is located within the thorax anteriorly, and the distance between
the medial and lateral leads on the sagittal projection axis is small, scaling coefficients were
required for estimating the sagittal T-vector component.
As the diabetic rabbits had the redistributed ventricular repolarization pattern with the
increased anteroposterior and decreased apicobasal RT gradients, and, consequently altered T-
vector components, we were able to test our approach to estimating the T-vector components.
We found that the longitudinal TWAD was lower and the sagittal TWAD was higher in the DM
group than in the control group, suggesting that TWADs reflected the RT gradients in the
correspondent directions, and could therefore be used for assessing the electrophysiological
properties in specific myocardial regions. Our data suggest that T-wave changes in DM rabbits
reflected RV involvement. However, our epicardial measurements showed similar total DOR in
non-diabetic and diabetic animals; accordingly, the TWADsum, which was suggested as an
estimate for T-vector length, and indirectly for total DOR, was no different for the DM and
control groups.
Our findings demonstrated that precordial T-wave voltage decrease could be associated
with unchanged DOR and oppositely changed different RT gradients. Measuring temporal ECG
indices of ventricular repolarization, such as QT and Tpeak-Tend intervals or their dispersions for
assessing DOR and predicting arrhythmic events often give unsatisfactory results (Zabel et al.
1998, Porthan et al. 2013), due at least in part to technical problems with determining T-wave
end. In our study, we could not measure QT and Tpeak-Tend intervals in a number of animals
because of overlapped P and T-waves. However, T-vector components specifically express the
corresponding repolarization gradients, contain useful information on DOR, and may thus be
tested as predictors of ventricular arrhythmias.

12
Limitations
We intended to establish the relationship between diabetic electrical myocardial
remodeling and T-wave changes in body surface ECGs quantified as magnitudes of T-vector
components to be further used as a noninvasive predictor of functional disturbances. From this
point of view, several issues should be taken into account. Where there is attenuation of T-wave
signals due to subcutaneous fat, a correction procedure may be required. It is also expected that
TWADsum (T-vector magnitude) may differ somewhat, with DOR remaining unchanged, in
settings where action potential durations uniformly prolong or shorten, such as in electrolyte
disturbances. We demonstrated that TWAD reflected the magnitude of the RT gradients being
the differences in RTs between the definite ventricular regions, such as the apex and the base,
etc. However, we did not test local electrophysiological heterogeneities, which may affect the
DOR, but perhaps not affect the RT gradients.
Conclusion
Our study suggests that T-wave flattening in modified precordial leads in diabetic rabbits was
associated with repolarization prolongation in the apical portion of the RV myocardium,
resulting in decreased apicobasal gradient and increased anteroposterior gradient of RTs. These
findings provide the basis for assessing RV functional changes in DM. The contribution of
apicobasal, interventricular and anteroposterior repolarization gradients could be estimated by
calculating the correspondent TWAD parameters. In diabetic rabbits, we found two
associations: 1) the augmented anteroposterior RT gradient and the increased sagittal TWAD; 2)
the diminished apicobasal RT gradient and the decreased longitudinal TWAD. The obtained
results show that T-wave flattening does not necessarily imply changes in DOR, which in turn
could be assessed by T-vector length and TWADsum.
Conflict of Interest
There is no conflict of interest.

13
Acknowledgements
The study was supported by a scholarship awarded to Dr. Azarov by The Swedish Institute’s
Visby Programme (No. 00073/2015, Sweden) and the RFBR grant (14-04-31070, young_a).
Funding agencies were not involved in designing, conducting or submitting the study.
14
REFERENCES
ARTEYEVA NV, AZAROV JE, VITYAZEV VA, SHMAKOV DN: Action potential duration
gradients in the heart ventricles and the cardiac electric field during ventricular repolarization (a
model study). J Electrocardiol 48: 678-685, 2015.
ARTEYEVA NV, GOSHKA SL, SEDOVA KA, BERNIKOVA OG, AZAROV JE: What does
the T(peak)-T(end) interval reflect? An experimental and model study. J Electrocardiol 46:
296.e291-298, 2013.
AXELSEN LN, CALLOE K, BRAUNSTEIN TH, RIEMANN M, HOFGAARD JP, LIANG B,
JENSEN CF, OLSEN KB, BARTELS ED, BAANDRUP U, JESPERSEN T, NIELSEN LB,
HOLSTEIN-RATHLOU NH, NIELSEN MS: Diet-induced pre-diabetes slows cardiac
conductance and promotes arrhythmogenesis. Cardiovasc Diabetol 14: 87, 2015.
CORONEL R, DE BAKKER JMT, WILMS-SCHOPMAN FJG, OPTHOF T, LINNENBANK
AC, BELTERMAN CN, JANSE MJ: Monophasic action potentials and activation recovery
intervals as measures of ventricular action potential duration: experimental evidence to resolve
some controversies. Heart Rhythm 3: 1043-1050, 2006.
CORTEZ D, PATEL SS, SHARMA N, LANDECK BF, MCCANTA AC, JONE PN:
Repolarization vector magnitude differentiates kawasaki disease from normal children. Ann
Noninvasive Electrocardiol 21: 493-499, 2016.
ENGELS EB, ALSHEHRI S, VAN DEURSEN CJM, WECKE L, BERGFELDT L, VERNOOY
K, PRINZEN FW: The synthesized vectorcardiogram resembles the measured vectorcardiogram
in patients with dyssynchronous heart failure. J Electrocardiol 48: 586-592, 2015.
GALLEGO M, ALDAY A, URRUTIA J, CASIS O: Transient outward potassium channel
regulation in healthy and diabetic hearts. Can J Physiol Pharmacol 87: 77-83, 2009.
KARAMITSOS TD, KARVOUNIS HI, DALAMANGA EG, PAPADOPOULOS CE,
DIDANGELLOS TP, KARAMITSOS DT, PARHARIDIS GE, LOURIDAS GE: Early diastolic

15
impairment of diabetic heart: The significance of right ventricle. Int J Cardiol 114: 218-223,
2007.
KITTNAR O: Electrocardiographic changes in diabetes mellitus. Physiol Res 64 (Suppl 5):
S559-566, 2016.
LENGYEL C, VIRÁG L, KOVÁCS PP, KRISTÓF A, PACHER P, KOCSIS E, KOLTAY ZM,
NÁNÁSI PP, TÓTH M, KECSKEMÉTI V, PAPP JG, VARRÓ A, JOST N: Role of slow
delayed rectifier K+-current in QT prolongation in the alloxan-induced diabetic rabbit heart. Acta
Physiol (Oxf) 192: 359-368, 2008.
MAGYAR J, RUSZNÁK Z, SZENTESI P, SZÛCS G, KOVÁCS L: Action potentials and
potassium currents in rat ventricular muscle during experimental diabetes. J Mol Cell Cardiol
24: 841-853, 1992.
MAN S, MAAN AC, SCHALIJ MJ. SWENNE CA: Vectorcardiographic diagnostic &
prognostic information derived from the 12‐lead electrocardiogram: Historical review and
clinical perspective. J Electrocardiol 48: 463-475, 2015.
MEIJBORG VM, CONRATH CE, OPTHOF T, BELTERMAN CN, DE BAKKER JM,
CORONEL R: Electrocardiographic T wave and its relation with ventricular repolarization along
major anatomical axes. Circ Arrhythm Electrophysiol 7: 524-531, 2014.
OLSEN KB, AXELSEN LN, BRAUNSTEIN TH, SORENSEN CM, ANDERSEN CB, PLOUG
T, Holstein-Rathlou NH, Nielsen MS: Myocardial impulse propagation is impaired in right
ventricular tissue of Zucker diabetic fatty (ZDF) rats. Cardiovasc Diabetol 12: 19, 2013.
OVECHKIN AO, VAYKSHNORAYTE MA, SEDOVA KA, SHMAKOV DN, SHUMIKHIN
KV, MEDVEDEVA SY, DANILOVA IG, AZAROV JE: Esmolol abolishes repolarization
gradients in diabetic rabbit hearts. Exp Clin Cardiol 20: 3780-3793, 2014.
PALOVÁ S, SZABO K, CHARVÁT J, SLAVÍCEK J, MEDOVÁ E, MLCEK M, KITTNAR O:
ECG body surface mapping changes in type 1 diabetic patients with and without autonomic
neuropathy. Physiol Res 59: 203-209, 2010.
16
PORTHAN K, VIITASALO M, TOIVONEN L, HAVULINNA AS, JULA A, TIKKANEN JT,
VÄÄNÄNEN H, NIEMINEN MS, HUIKURI HV, NEWTON-CHEH C, SALOMAA V,
OIKARINEN L: Predictive value of electrocardiographic T-wave morphology parameters and T-
wave peak to T-wave end interval for sudden cardiac death in the general population. Circ
Arrhythm Electrophysiol 6: 690-696, 2013.
SCHREURS CA, ALGRA AM, MAN S-C, CANNEGIETER SC, VAN DER WALL EE,
SCHALIJ MJ, KORS JA, SWENNE CA: The spatial QRS-T angle in the Frank
vectorcardiogram: accuracy of estimates derived from the 12-lead electrocardiogram. J
Electrocardiol 43: 294-301, 2010.
SEDOVA K, BERNIKOVA O, AZAROV J, SHMAKOV D, VITYAZEV V, KHARIN S:
Effects of echinochrome on ventricular repolarization in acute ischemia. J Electrocardiol 48:
181-186, 2015.
SPOONER PM: Sudden cardiac death: influence of diabetes. Diabetes Obes Metab 10: 523-532,
2008.
VAN DEN BROM CE, BOSMANS JW, VLASBLOM R, HANDOKO LM, HUISMAN MC,
LUBBERINK M, MOLTHOFF CF, LAMMERTSMA AA, OUWENS MD, DIAMANT M,
BOER C: Diabetic cardiomyopathy in Zucker diabetic fatty rats: the forgotten right ventricle.
Cardiovasc Diabetol 9: 25, 2010.
VAYKSHNORAYTE MA, OVECHKIN AO, AZAROV JE: The effect of diabetes mellitus on
the ventricular epicardial activation and repolarization in mice. Physiol Res 61: 363-370, 2012.
WAKS JW, SOLIMAN EZ, HENRIKSON CA, SOTOODEHNIA N, HAN L, AGARWAL SK,
ARKING DE, SISCOVICK DS, SOLOMON SD, POST WS, JOSEPHSON ME, CORESH J,
TERESHCHENKO LG: Beat-to-beat spatiotemporal variability in the T vector is associated with
sudden cardiac death in participants without left ventricular hypertrophy: the Atherosclerosis
Risk in Communities (ARIC) Study. J Am Heart Assoc 4: e001357, 2015.

17
ZABEL M, KLINGENHEBEN T, FRANZ MR, HOHNLOSER SH: Assessment of QT
dispersion for prediction of mortality or arrhythmic events after myocardial infarction: results of
a prospective, long-term follow-up study. Circulation 97: 2543-2550, 1998.
ZHANG Y, XIAO J, LIN H, LUO X, WANG H, BAI Y, WANG J, ZHANG H, YANG B,
WANG Z: Ionic mechanisms underlying abnormal QT prolongation and the associated
arrhythmias in diabetic rabbits: a role of rapid delayed rectifier K+ current. Cell Physiol Biochem
19: 225-238, 2007.
18
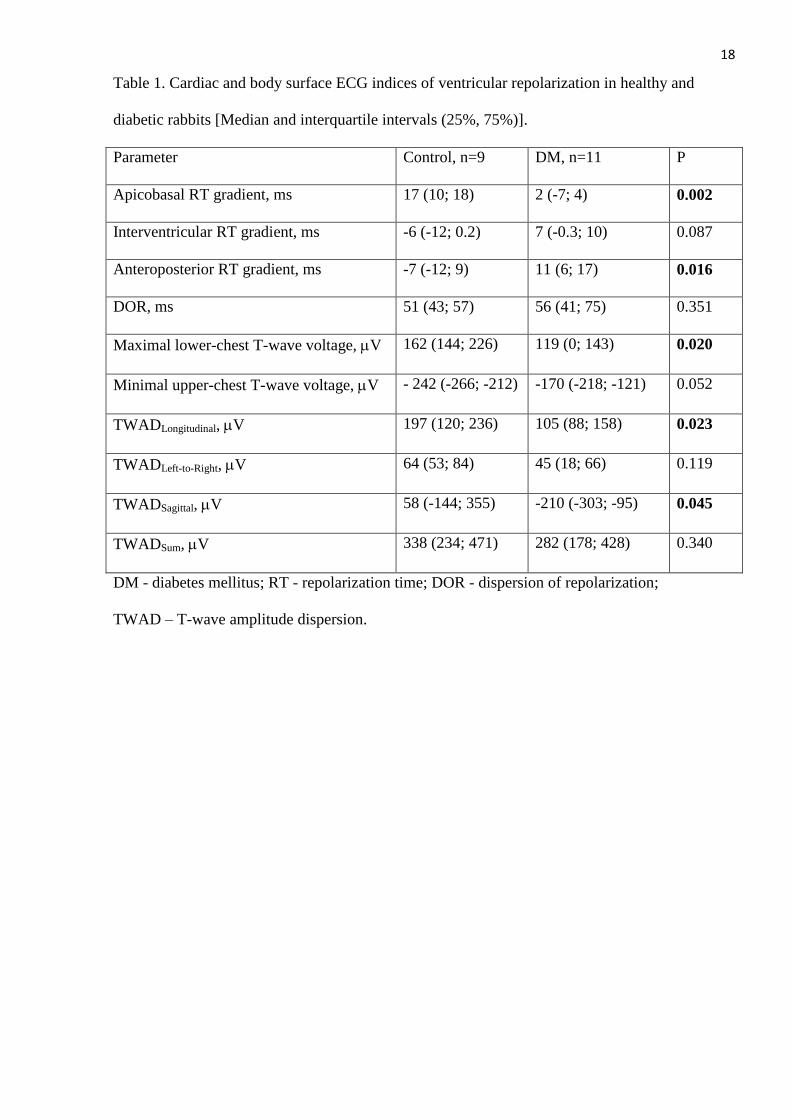
Table 1. Cardiac and body surface ECG indices of ventricular repolarization in healthy and
diabetic rabbits [Median and interquartile intervals (25%, 75%)].
Parameter Control, n=9 DM, n=11 P
Apicobasal RT gradient, ms 17 (10; 18) 2 (-7; 4) 0.002
Interventricular RT gradient, ms -6 (-12; 0.2) 7 (-0.3; 10) 0.087
Anteroposterior RT gradient, ms -7 (-12; 9) 11 (6; 17) 0.016
DOR, ms 51 (43; 57) 56 (41; 75) 0.351
Maximal lower-chest T-wave voltage, V 162 (144; 226) 119 (0; 143) 0.020
Minimal upper-chest T-wave voltage, V - 242 (-266; -212) -170 (-218; -121) 0.052
TWADLongitudinal, V 197 (120; 236) 105 (88; 158) 0.023
TWADLeft-to-Right, V 64 (53; 84) 45 (18; 66) 0.119
TWADSagittal, V 58 (-144; 355) -210 (-303; -95) 0.045
TWADSum, V 338 (234; 471) 282 (178; 428) 0.340
DM - diabetes mellitus; RT - repolarization time; DOR - dispersion of repolarization;
TWAD – T-wave amplitude dispersion.
19
FIGURE LEGENDS
Figure 1. Schematic presentation of determining epicardial repolarization parameters. Each map
displays anterior (left part) and posterior (right part) aspects of the heart. The margins between
left and right ventricles (anterior and posterior interventricular grooves) are depicted by thin
solid lines. (A) Lead distribution on epicardial surface. Dispersion of repolarization is calculated
as the difference between the earliest and the latest repolarization times on the overall surface.
Apicobasal (B), interventricular (C) and anteroposterior (D) repolarization gradients are
determined as differences between the average RT values obtained from areas designated by
small and large lead points.
Figure 2. Representative ECG tracings in modified precordial leads J1-J6 (solid black points) in
control and diabetic rabbits. The heart position is indicated by thick arrows depicting
predominant apicobasal and anteroposterior RT gradients for non-diabetic and diabetic animals,
respectively.
Figure 3. Representative maps of epicardial ventricular distribution of ARIs in control and
diabetic (DM) rabbits. See the prolonged repolarization area on the anterior apical portion in the
diabetic rabbit heart.
Figure 4. Simulated body surface potential maps during T-wave peak for the control and diabetic
rabbits. Simulated voltages in J1-J6 leads are shown. The transversal and frontal projections of
the T-vectors set directly (bold gray) and calculated from the TWAD (black) are displayed to the
right of each map.

20
Figure 1.
21
Figure 2.

22
Figure 3.
23
Figure 4.