mechanismof glycogen repletion magnetic resonance …
TRANSCRIPT

Mechanism of Liver Glycogen Repletion In Vivo by NuclearMagnetic Resonance SpectroscopyGerald 1. Shulman, Douglas L. Rothman, Douglas Smith, Carolyn M. Johnson, James B. Blair,Robert G. Shulman, and Ralph A. DeFronzoDepartment of Molecular Biophysics and Biochemistry, and Department of Medicine, Yale University, NewHaven, Connecticut 06511;Department of Biochemistry, West Virginia University Medical Center, Morgantown, West Virginia 26506;and Diabetes Unit, Massachusetts General Hospital, Boston, Massachusetts 02114
Abstract
In order to quantitate the pathways by which liver glycogen isrepleted, we administered 11-'3Cjglucose by gavage into awake24-h fasted rats and examined the labeling pattern of 'IC inhepatic glycogen. Two doses of i1-'3Cjglucose, 1 and 6 mg/gbody wt, were given to examine whether differences in the plasmaglucose concentration altered the metabolic pathways via whichliver glycogen was replenished. After 1 and 3 h (high-dose group)and after 1 and 2 h (low-dose group), the animals were anesthe-tized and the liver was quickly freeze-clamped. Liver glycogenwas extracted and the purified glycogen hydrolyzed to glucosewith amyloglucosidase. The distribution of the "3C-label wassubsequently determined by "C-nuclear magnetic resonancespectroscopy. The percent 'IC enrichment of the glucosyl unitsin glycogen was: 15.1±0.8%(C-1), 1.5±0.1%(C-2), 1.2±0.1%(C-3), 1.1±0.1%(C-4), 1.6±0.1%(C-5), and 2.2±0.1%(C-6) for thehigh-dose study (n = 4, at 3 h); 16.5±0.5%(C-1),2.0±0.1%(C-2), 1.3±0.1%(C-3), 1.1±0.1%(C4), 2.2±0.1%(C-5), and 2.4±0.1%(C-6) in the low-dose study (n = 4, at 2 h). Theaverage "3C-enrichment of C-1 glucose in the portal vein wasfound to be 43±1 and 40±2% in the high- and low-dose groups,respectively. Therefore, the amount of glycogen that was syn-thesized from the direct pathway (i.e., glucose - glucose-6-phosphate - glucose-l-phosphate - UDP-glucose - glycogen)was calculated to be 31 and 36% in the high- and low-dose groups,respectively. The "C-enrichments of portal vein lactate and al-anine were 14 and 14%, respectively, in the high-dose group and11 and 8%, respectively, in the low-dose group. From these en-richments, the minimum contribution of these gluconeogenicprecursors to glycogen repletion can be calculated to be 7 and20% in the high- and low-dose groups, respectively. The maxi-mumcontribution of glucose recycling at the triose isomerasestep to glycogen synthesis (i.e., glucose - triose-phosphates -glycogen) was estimated to be 3 and 1% in the high- and low-dose groups, respectively.
In conclusion, our results demonstrate that (a) only one-thirdof liver glycogen repletion occurs via the direct conversion ofglucose to glycogen, and that (b) only a very small amount ofglycogen synthesis can be accounted for by the conversion ofglucose to triose phosphates and back to glycogen; this suggeststhat futile cycling between fructose-6-phosphate and fructose-1,6-diphosphate under these conditions is minimal. Our resultsalso show that (c) alanine and lactate account for a minimum of
Received for publication 22 February 1985.
between 7 and 20% of the glycogen synthesized, and that (d) thethree pathways through which the labeled flux is measured ac-count for a total of only 50% of the total glycogen synthesized.These results suggest that either there is a sizeable amount ofglycogen synthesis via pathway(s) that were not examined in thepresent experiment or that there is a much greater dilution oflabeled alanine/lactate in the oxaloacetate pool than previouslyappreciated, or some combination of these two explanations.
Introduction
Numerous studies have established that liver glycogen stores arerepleted after a carbohydrate meal. However, the widely acceptedmechanism of glycogen repletion by direct incorporation of glu-cose into glycogen (glucose - glucose-6-phosphate - glucose-1-phosphate - UDP-glucose -- glycogen) has recently beenquestioned by studies (1-4) which suggest that the majority (atleast half) of liver glycogen is formed by an indirect pathwaypossibly involving the sequence: glucose - lactate - oxaloac-etate - phosphoenolpyruvate -+ UDP-glucose - glycogen.
In the present study we have attempted to quantitate thecontribution of the direct and indirect pathways to liver glycogenrepletion in vivo by administering [ I-'3Cjglucose by gavage intoawake 24-h fasted rats and examining the '3C-labeling patternin hepatic glycogen by '3C-nuclear magnetic resonance (NMR).INMRspectroscopy has the unique capability to determine the'3C-enrichment at each position of the glucose molecule simul-taneously in the same sample. Each of the '3C-labeled precursorsof glycogen will produce a unique labeling pattern in the glucosylunit of glycogen. If the hepatic glycogen '3C-labeling pattern andthe portal vein '3C-enrichments of glucose, lactate, and alanineare known, the relative contributions of each of these precursorsto glycogen repletion can be calculated. Furthermore, since thestudies are performed in awake unstressed animals, an integratedpicture of whole body glucose homeostasis can be obtained.
Methods
Animals. Male Sprague-Dawley rats weighing between 250 and 300 gwere used. They were maintained on standard Ralston-Purina Co. (St.Louis, MO) rat chow and were housed in an environmentally controlledroom with a 12-h light/dark cycle. 1 wk before study they were fittedwith an internal jugular catheter extending to the right atrium. The cath-eter was filled with a heparin/polyvinylpolypyrrolidone solution, sealed,and tunneled subcutaneously around the side of the neck to the back ofthe head. The catheter was externalized through a skin incision andanchored to the skull with a dental cement cap. All rats were fasted for
1. Abbreviations used in this paper: NMR, nuclear magnetic resonancespectroscopy; OAA, oxaloacetate.
Hepatic Glycogen Formation 1229
J. Clin. Invest.© The American Society for Clinical Investigation, Inc.0021-9738/85/09/1229/08 $1.00Volume 76, September 1985, 1229-1236

24 h before study to deplete liver glycogen. At 8 a.m. on the day of study,eight rats were given an intragastric bolus of 33% glucose containing 6mg/g body wt, under light ether anesthesia which lasted <2 min. Theglucose was enriched by 50o with [ I-'3C]glucose. Four rats were sacrificedat 1 h after glucose ingestion and four after 3 h. A second group of eightrats received a lower dose of glucose, 1 mg/g body wt, that was 99%enriched with [ I-'3C]glucose. Four rats were sacrificed at 1 h post glucoseand four after 2 h. In all studies tracer amounts of [1-'4C]glucose wereadded to the ingested glucose to monitor constancy of the plasma glucosespecific activity. Following glucose ingestion, the animals were allowedto roam freely in their cages, while blood samples for plasma glucoseand ['4C]glucose specific activity were taken at 15-30-min time intervals.At the time of sacrifice, animals were injected with 2%sodium thiamylal(Biotal, Bio-Centic, St. Joseph, MO) (1 ml/kg body weight). The abdomenwas quickly opened, and a portal vein blood sample was taken. The liverwas then freeze-clamped with aluminum tongs precooled to -770C withliquid nitrogen and weighed. The time from the onset of anesthesia untilfreeze clamping of the liver was <90 s. Leg muscle samples were alsofreeze-clamped using the same method. All tissue samples were frozenat -30'C for subsequent analysis. The amount of the administered glu-cose load that was absorbed was determined by removing the entiregastrointestinal tract from the stomach to the end of the small intestine,mincing finely, and rinsing with a known volume of 0.9% saline. Fol-lowing centrifugation, the glucose concentration in the supernatant wasdetermined. Urine samples from the bladder were also obtained at theend of the study and found to contain negligible amounts of glucose.
A group of nine control animals was treated in an identical fashion(i.e., diet, housing, catheter insertion, sacrifice, etc.). In this group noglucose was administered and following a 24-h overnight fast liver andmuscle samples were obtained for determination of glycogen concentra-tion.
Analytical procedures. Glucose concentrations in plasma and tissueextracts were determined using a Beckman glucose analyzer (BeckmanInstruments, Inc., Fullerton, CA). ['4C]glucose in plasma was quantitatedas previously described (5). The glycogen was extracted from the liversamples utilizing the KOHextraction, ethanol precipitation method ofSomoygi (6). The extracted glycogen was dialyzed extensively againstdeionized Millipore-filtered water (Millipore Corp., Bedford, MA) con-taining 0.02% sodium azide and then degraded completely to glucosewith Rhizopus amyloglucosidase (20 units/ml) in potassium hydrogenphthalate buffer (50 mM, pH 4.5, at 25°C for 4-6 h). Samples wereIyophilized and brought up in 0.5 ml of 99.8% D20. The cold glycogenconcentration in liver and muscle samples was determined as previouslydescribed (7).
NMRmethodology. '3C-NMR spectra of glucose were taken at 90.55MHz in a Bruker WH360 wide-bore spectrometer or at 125.76 MHzin a Bruker WM500 spectrometer (Bruker Instruments, Inc., Billerica,MA). Multiple samples, run on both spectrometers, yielded identicalresults. The samples were placed in standard 5-mmNMRtubes and thespectra were obtained using standard 5 or 10 mm'3C-NMR probes. Inboth systems a 450 pulse was repeated every 3 s for 1-8 h (3,600-10,000scans). Spectra were acquired with 4,096 data points over a sweep widthof 10,000 Hz centered at 80 ppm (relative to fl-D-glucose C-1 at 96.8ppm) (0.205 ms acquisition time). Broad band proton noise decoupling(2-5 W) centered 1 ppm upfield from water was on only during theacquisition time to avoid the development of the nuclear Overhausereffect. The spectral parameters used allowed the intensities of glucoseresonance to be compared without T, (relaxation time) and nuclearOverhauser effect corrections. Resonance intensities were determined bycomputer integration and by manually cutting out and weighing plottedresonances; both methods yielded similar results.
The '3C-fractional enrichment of the C-l position of each glucosesample was determined from 'H-NMR spectra at 360.13 MHzin a stan-dard 'H-NMR probe. A 450 pulse angle (3 Ms) with a 10-s relaxationdelay was used. During the relaxation delay, the water and deuterium(HDO) resonance was saturated with a single radio frequency field of 50mW(8). Spectra were acquired with a sweep width of 5,000 Hz centeredat the HDOresonance in 8192 data points (0.819 ms acquisition time).
Samples were heated to 340'K to shift the HDOresonance upfield fromthe C-I proton resonance of a-D-glucose.
The '3C-fractional enrichment of plasma C-I glucose, C-3 alanine,and C-3 lactate were determined from 'H-NMR spectra using a ho-monuclear double resonance spin echo difference sequence (9, 10). A10-s relaxation delay was used for the glucose and a 15-s delay for lactateand alanine determinations. During the relaxation delay, the HDOres-onance was saturated with a 50 mWsingle radio frequency field (8).During the spin echo T delay (136 ms for glucose, 68 ms for lactate andalanine), single frequency 'H-decoupling was applied at 50 mW. Allother spectral parameters were as described above. The spectral param-eters used allowed the intensities of the proton resonances from protonsbonded to '3C- and '2C-nuclei to be compared without T, or T2 correc-tions.
Materials. [1-'3C]glucose (99% enriched) was purchased from Cam-bridge Isotope Laboratories (Cambridge, MA) and [1"C]glucose (1 mCi/10 ml) from New England Nuclear (Boston, MA). All other reagentswere of the highest quality that was commercially available.
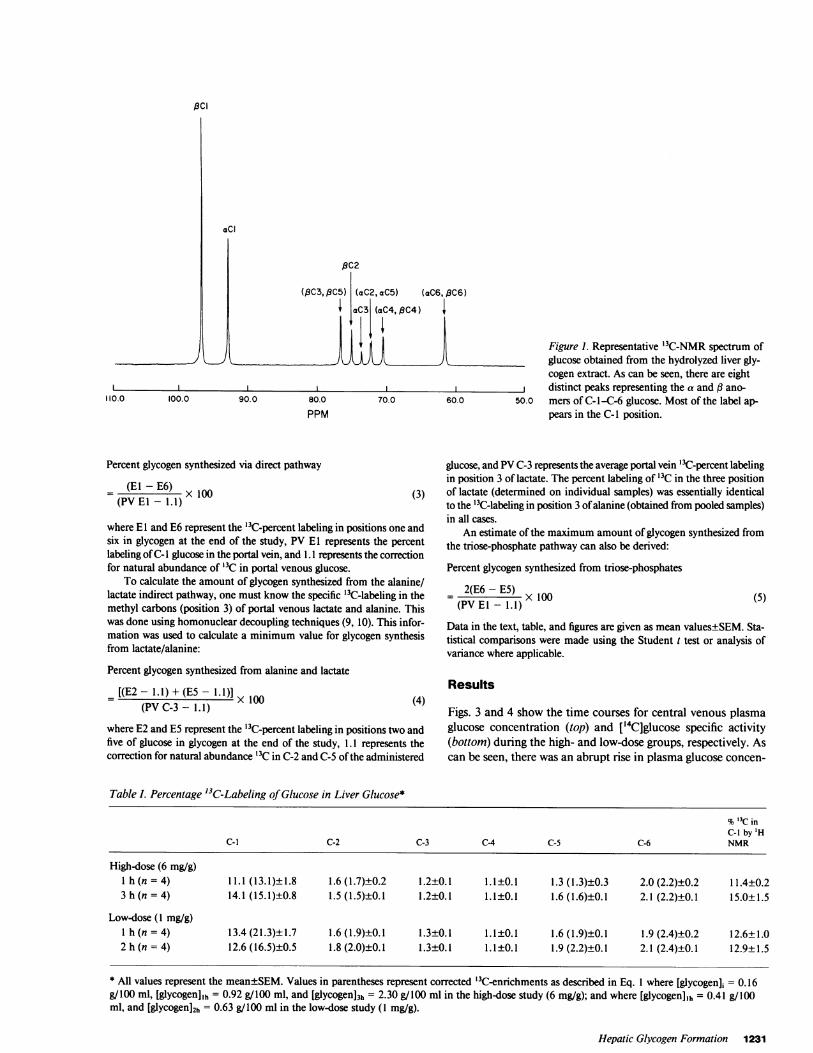
Calculations. A representative '3C-NMR spectrum of the extracted,hydrolyzed hepatic glycogen from a rat which received the high dose (6mg/g body wt) glucose study is shown in Fig. 1. Eight distinct peaks canbe identified and the carbon atoms of glucose have been labeled accordingto their alpha or beta position. The integrated area under each peak wascalculated by an Aspect 2000 computer using DISNMRP84 software(Bruker Instruments).
The percent labeling (E) for each of the six carbon peaks was computedas follows:
El = [,8-C-1 + a-C-i] X F
E2 = [(13-C-2XZ) + fl-C-2] X F = [a-C-2 + fl-C-2] X F
E3 = [(a-C-3)/(Z) + a-C-3] X F = [,B-C-3 + a-C-3] X F
E4 = [a-C-4, ,-C-4] X F = 1.1%
E5 = [(fl-C-3, f3-C-5) + ,B-C-2 + a-C-3
+ (a-C-2, a-C-5) - (a-C-4, #-C-4)] X 22
E6 = [a-C-6, f3-C-6] X F
a-C and (B-C are the resonance intensities of the a- and 13-C positionof glucose, Z represents the ratio of the a-anomer to the fl-anomer, andF represents the factor used to normalize the C-4 labeling to 1.1 %= E4(i.e., natural abundance).
All rats were fasted for 24 h to reduce the amount of liver glycogenpresent at the start of the study. However, a small amount of glycogenstill remained and a correction for the unenriched glycogen initially pres-ent was applied as follows:
Corrected '3 C-labeling =(E) X [glycogenJe - (1.1) X [glycogen],[glycogen] - [glycogen](
where [glycogen]. is the glycogen concentration at the end of the studyand [glycogensJ is the glycogen concentration at the start of the study.The above calculation was performed for C-1, C-2, C-5, and C-6 ofglucose (see Table I).
To calculate the amount of glycogen synthesized from the directpathway, the specific [l-'3C]glucose labeling of portal venous glucosemust be determined. This was accomplished by proton NMRspectros-copy as previously described by Rothman et al. (9). This separated thetwo smaller '3C-satellite peaks from the larger '2C-peak (Fig. 2). To avoidany overlap with neighboring peaks, the downfield '3C-satellite peak areawas used to calculate the percent '3C-labeling in position 1 as follows:
Percent 'IC-labeling = (2XC 1 3) + 100(2XC-13) + (C-12) (2)
The percent glycogen synthesized by the direct pathway can be de-termined by the following equation:
1230 Shulman et al.
,8C2
2, aC5) (aC6, RC6)(aC4, $C4) |
IIII100.0 90.0 80.0 70.0 60.0
PPM
Percent glycogen synthesized via direct pathway
(El - E6) X 100(PVElI 1. 1)
where El and E6 represent the '3C-percent labeling in positions one andsix in glycogen at the end of the study, PV El represents the percentlabeling of C-1 glucose in the portal vein, and 1.1 represents the correctionfor natural abundance of '3C in portal venous glucose.
To calculate the amount of glycogen synthesized from the alanine/lactate indirect pathway, one must know the specific '3C-labeling in themethyl carbons (position 3) of portal venous lactate and alanine. Thiswas done using homonuclear decoupling techniques (9, 10). This infor-mation was used to calculate a minimum value for glycogen synthesisfrom lactate/alanine:
Percent glycogen synthesized from alanine and lactate
= [(E2 - 1.1) + (ES - 1.1)] X 100
(PV C-3 1. 1)(4)
where E2 and E5 represent the '3C-percent labeling in positions two andfive of glucose in glycogen at the end of the study, 1.1 represents thecorrection for natural abundance '3C in C-2 and C-5 of the administered
Figure 1. Representative '3C-NMR spectrum ofglucose obtained from the hydrolyzed liver gly-cogen extract. As can be seen, there are eightdistinct peaks representing the a and (3 ano-
50.0 mers of C-1I-C-6 glucose. Most of the label ap-pears in the C-1 position.
glucose, and PVC-3 represents the average portal vein '3C-percent labelingin position 3 of lactate. The percent labeling of '3C in the three positionof lactate (determined on individual samples) was essentially identicalto the '3C-labeling in position 3 of alanine (obtained from pooled samples)in all cases.
An estimate of the maximum amount of glycogen synthesized fromthe triose-phosphate pathway can also be derived:
Percent glycogen synthesized from triose-phosphates
2(E6 - E5)~~~~XlOO (5)
(PV ElI 1. 1)
Data in the text, table, and figures are given as mean values±SEM. Sta-tistical comparisons were made using the Student t test or analysis ofvariance where applicable.
Results
Figs. 3 and 4 show the time courses for central venous plasmaglucose concentration (top) and ['4C]glucose specific activity(bottom) during the high- and low-dose groups, respectively. Ascan be seen, there was an abrupt rise in plasma glucose concen-
Table I. Percentage '3C-Labeling of Glucose in Liver Glucose*
% 3C inC-I by 'H
C-I C-2 C-3 C4 C-5 C-6 NMR
High-dose (6 mg/g)1 h (n = 4) 11.1 (13.1)±1.8 1.6 (1.7)±0.2 1.2±0.1 1.1±0.1 1.3 (1.3)±0.3 2.0 (2.2)±0.2 11.4±0.23 h (n = 4) 14.1 (15.1)±0.8 1.5 (1.5)±0.1 1.2±0.1 1.1±0.1 1.6 (1.6)±0.1 2.1 (2.2)±0.l 15.0±1.5
Low-dose (I mg/g)1 h (n = 4) 13.4 (21.3)±1.7 1.6 (1.9)±0.1 1.3±0.1 1.1±0.1 1.6 (1.9)±0.1 1.9 (2.4)±0.2 12.6±1.02 h (n = 4) 12.6 (16.5)±0.5 1.8 (2.0)±0.1 1.3±0.1 1.1±0.1 1.9 (2.2)±0.1 2.1 (2.4)±0.1 12.9±1.5
* All values represent the mean±SEM. Values in parentheses represent corrected '3C-enrichments as described in Eq. 1 where [glycogen], = 0.16g/100 ml, [glycogen]1h = 0.92 g/100 ml, and [glycogen]3h = 2.30 g/100 ml in the high-dose study (6 mg/g); and where [glycogen]lh = 0.41 g/100ml, and [glycogen]2h = 0.63 g/100 ml in the low-dose study (1 mg/g).
Hepatic Glycogen Formation 1231
Rci
aC'
110.0

c13satellite
cl3satellIitbe
II Figure 2. Representative 'H-NMR spectrum of5.50 5.40 5.30 5.20 5.10 5.00 4.90 the C-I position of the glucosyl unit obtained
PPM from hydrolyzed hepatic glycogen.
tration and ['4C]glucose specific activity within the first 30 min.Thereafter, both remained relatively constant until the end ofthe experiment.
In Fig. 5 it can be seen that the liver glycogen concentration(0. 16±0.03 g/ 100 ml) in nine control rats after a 24-h overnightfast was quite low. Following the oral glucose load, there was asignificant increase in liver glycogen at all time intervals in boththe low- and high-dose groups. The rates of glycogen synthesiswere linear in both groups and were 0.66 and 0.22 ,gmol/g liverper min in the high- and low-dose studies, respectively. At thetime of sacrifice 82% of the glucose load was absorbed in thehigh-dose group (at 3 h) while 94% was absorbed in the low-dose group (at 2 h). This was calculated by subtracting theamount of glucose given from the amount that was recoveredin the gut and then dividing by the amount of glucose given.The average liver weights at the end of the studies were 9.7±0.3g (n = 4) and 9.1±0.4 g (n = 4) in the high- and low-dose groups,
300 r
PlasmaGlucose
Concentration(mg/d I)
200 .
100 3
(I h)Q Pv
respectively. The product of the liver weight and the glycogensynthetic rates yields the total amount of glycogen synthesizedduring the study. Liver glycogen increased by 1,152 and 240ztmol in the high- and low-dose groups, respectively. From thesevalues, it could be calculated that the increase in liver glycogenin the high- and low-dose groups, respectively, accounted for 15and 18% of the administered glucose load.
Muscle glycogen concentration increased from 0.55±0.05g/100 ml (n = 9) in the postabsorptive state to 0.67±0.07 g/100ml (n = 4)(P < 0.05) at 1 h to 0.83±0.07 g/100 ml (n = 4)(P< 0.01) at 3 h in the high-dose group. There was no detectablechange in the muscle glycogen concentration in the low-dosegroup. Assuming that the muscle mass accounts for 40%of bodyweight in the rat, and the average rat weight was 284±4 g (n= 4), then -23% of the glucose load could be accounted for bythe increase in muscle glycogen in the high-dose group.
Table I shows the average percent labeling of C- through
- (3h)
Vi Pv
0 20 40 60 0 60 120 180
3000 r
[14c ]GlucoseSpecificActivity
(dpm/mg)
(I h)
2000 HPv
1000 p
60 0
(3 h)Figure 3. Time course of change in mixed ve-nous plasma glucose concentration (top) andmixed venous ['4Cjglucose specific activity(bottom) during the high-dose (6 mg/kg bodywt) glucose study. The values represent themean±SEMof four animals sacrificed at I h
0 PV after oral glucose (left) and of four animals sac-rificed 3 h after glucose (right). Portal venousglucose concentrations and specific activities
60 120 180 determined at the time of sacrifice are indicatedTime (min) by the open circles.
1232 Shulman et al.
0 20 40Time (min)
r

(I h)
Pv
20 40 60
(2h)
iF/ *--test § Pv
930 60 90 120
I000 r (I h)
500
0 20 40
Time (min)60
Pv
I 0
(2 h)
#I--,
30 60Time (min)
Figure 4. Time course of change in mixed ve-nous plasma glucose concentration (top) andmixed venous ('4C]glucose specific activity (bot-tom) during the low-dose (1 mg/kg body wt) glu-
O PV cose study. The values represent the mean±SEMof four animals sacrificed at 1 h (left) and 2 h af-ter oral glucose (right). Portal venous glucoseconcentrations and specific activities determined
90 120 at the time of sacrifice are indicated by the opencircles.
C-6 in both the high- and low-dose groups. In the calculations,as discussed above, the percent labeling in C-4 was set equal to1.1%. This assumed that an insignificant amount of label getsincorporated into C-3 or C-4 from the [1-'3C]glucose load. Totest this assumption, '3C-percent labeling in C- 1 position of glu-cose was independently measured using 'H-NMR. As can beseen in Table I, proton NMRyielded values that were in veryclose agreement to those obtained by assuming that the C-4position had 1.1% '3C.
To quantitate the contribution of the direct pathway to thesynthesis of glycogen, it is necessary to determine the '3C-percentlabeling of glucose in the portal vein. This was done in all animals
High glucose dose = 6 mg/ g body wt2.4
2.0
LiverGlycogen
Concentration(g/%)
I.6
1.2
0.8
0.4
n a
Low glucose dose = I mg/g body wt
U. bLiver
GlycogenConcentration
(g %)
0.4
I
0 2 3
Time (h)
Figure 5. Time course of increase in liver glycogen concentration fol-lowing the glucose load in the high (top)- and low (bottom)-dose stud-ies. (*P < 0.05, **P < 0.01, ***P < 0.001, compared with glycogenconcentration at t = 0.)
and found to be 43±1 and 42±2% at 1 and 3 h, respectively, inthe high-dose group, and 46±2 and 33±3% at I and 2 h, re-spectively, in the low-dose group (see Table II).
The average ['3C]glucose percent labeling over the 3 h of thehigh-dose study was 43%and over the 2 h of the low-dose studywas 40%. Using Eq. 3 it can be calculated that 31 and 36% ofthe liver glycogen was synthesized by the indirect pathway inthe high- and low-dose groups, respectively. Thus, approximatelytwo-thirds of the glycogen was synthesized by indirect pathway(s).
'3C-percent labeling of lactate and alanine in portal venousblood was determined by 'H-NMR (Table II). The average 13C-percent labeling for lactate was quite similar to that for alanineand the percent labeling for both was approximately one-thirdof that for glucose. Using these values, a minimum contributionof alanine and lactate to glycogen formation can be calculatedfrom Eq. 4. In the high- and low-dose studies, a minimum of7±2 and 20±1%, respectively, of newly synthesized glycogen
Table II. Percentage 13C-Labeling of C-I Glucose, C-3 Lactate,and C-3 Alanine in the Portal Vein*
Ih(n=4) 3 h(n =4)
High-dose (6 mg/g) (n = 8)Percent '3C C-1 glucose 43±1 42±2Percent '3C C-3 lactate 14±1 13±1Percent '3C C-3 alanine 17 12
I h(n=4) 2h(n =4)
Low-dose (I mg/g) (n = 8)Percent '3C C-i glucose 46±2 33±3Percent '3C C-3 lactate 12±2 10±1Percent '3C C-3 alanine 8 8
* All values represent the mean±SEM. The percentage of 13C in theC-3 position of alanine represents pooled samples from each group.The percentage of 13C in the C-3 position of lactate represents the-mean of individual values for each rat.
Hepatic Glycogen Formation 1233
300
200
100w
PlasmaGlucose
Concentration(mg/d 1)
[14C]GlucoseSpecificActivity
(dpm/mg)
was derived from alanine plus lactate. These represent minimumvalues because labeled oxaloacetate (OAA) derived from thesegluconeogenic precursors is diluted by unlabeled OAAderivedfrom the TCAcycle ( 1). In fed rats it has been determined thatthis dilution factor is 1.38 (12). Using this value the contributionof alanine/lactate to glycogen synthesis can be estimated to be10 and 28% in high- and low-dose groups, respectively.
The maximum contribution of glucose recycling at the trioseisomerase level to glycogen synthesis was also calculated fromEq. 5 and found to be very small, representing only 3 and 1%in the high- and low-dose groups, respectively.
Discussion
Following glucose ingestion or intravenous glucose administra-tion in both man and animals, liver glycogen concentration hasbeen shown to increase (13, 14). However, studies employingthe hepatic venous catheterization technique have demonstratedthat insufficient amounts of glucose are taken up by the splanch-nic region to account for the repletion of hepatic glycogen stores(2). The demonstration that fructose is a more efficient precursorthan glucose for liver glycogen synthesis (13) provided one ofthe earliest clues that the gluconeogenic pathway may be thepredominant mechanism via which hepatic glycogen is replen-ished. This simple sugar can be converted to glycogen only afterit has entered the cell, been phosphorylated, and cleaved to triose-phosphates (14). Several recent publications have further em-phasized the importance of gluconeogenic precursors in the for-mation of liver glycogen (1, 3, 4, 15-17).
In the present study we have employed NMRspectroscopyto provide a quantitative estimate of the pathways via whichhepatic glycogen is synthesized. The principle of this techniqueis based upon the ability to define the labeling pattern of '3C inthe various positions of glucose in glycogen following the ad-ministration of ['3C]glucose labeled in the C-l position. Thus,if glucose were converted directly to glycogen (glucose - glucose-6-P -- glucose- 1-P -- UDP-glucose -4 glycogen), all of the 'IC-label should appear in the C-l position. Alternatively, if glucoseis first catabolized to triose phosphates at the isomerase level,which are subsequently converted to glycogen, equal amountsof label would be found in the C- 1 and C-6 positions. Lastly, ifglucose were converted to lactate/alanine/pyruvate and thesethree carbon compounds served as the precursors for glycogenformation, one would expect equal amounts of '3C-label in po-sitions C-l, C-2, C-5, and C-6. Wehave referred to the lattertwo pathways by which glycogen is formed as the indirect orgluconeogenic pathways. Our results indicate that only one-thirdof liver glycogen is synthesized by the direct route, while theother two-thirds comes via the indirect pathways. These con-clusions, however, are based upon the following assumptions:(a) there is minimal hepatic pentose cycle activity under theexperimental conditions employed; (b) there is negligible incor-poration of the label into the C-3 and C-4 positions of the glucosylunits of glycogen; (c) there is rapid and complete equilibrationof label between dihydroxy-acetone phosphate and glyceralde-hyde-3-phosphate at the triosephosphate isomerase step; and (d)there is rapid and complete equilibration of label between theC-2 and C-3 positions of OAAcoming from equilibration be-tween malate and fumarate. Each of these assumptions will bediscussed below.
If glucose were to enter the pentose cycle, the '3C-label inC-l would be cleaved and "3CO2 would be formed. This would
lead to an underestimation of the amount of glucose that wasdirectly incorporated into glycogen. The activity of the pentosecycle has been examined both in vitro (18) and in vivo (19) andfound to represent no more than 10% of the total glucose fluxin both circumstances. Furthermore, other workers (4, 20) foundthat the ratio of the specific activities of ['4C]glucose in liverglycogen to administered [14C]glucose were nearly identicalwhether [1-'4C] or [6-'4C]glucose were administered. These datasupport the assumption that the activity of the pentose cycle inthe liver is small compared with the total glucogenic flux underthese circumstances.
Our analysis also assumed that the incorporation of '3C-label into the C-3 and C-4 positions of glucose in glycogen isnegligible. This was, in fact, checked by 'H-NMR analysis ofthe labeling of the C- glucose position. This value agreed closelywith the percent enrichment determined by '3C-NMR. Thisagreement implies that the amount of '3C-label in positions C-3 and C-4 must be close to 1.1% natural abundance enrichment.
With respect to assumption c, most studies have shown thatthere is a rapid and essentially complete equilibration betweendihydroxy-acetone phosphate and glyceraldehyde-3-phosphateat the triose isomerase reaction (21, 22). Furthermore, our owndata support the assumption in that the enrichment of C-2 wasequal to the enrichment of C-5. To the extent that isotopicequilibration is not complete, the amount of label in the C-position will be slightly overestimated while that in the C-6 po-sition will be slightly underestimated. The net result will be anunderestimation of the contribution of the "triose" pathway andan overestimation of the direct pathway to glycogen synthesis.
Lastly, to the extent that isotopic equilibration between theC-2 and C-3 positions of OAAis not complete, the contributionof the gluconeogenic pathway to liver glycogen repletion will beunderestimated. This underestimation would occur because C-2 and C-5 would have less label than if equilibration were com-plete. However, most studies that have examined this questionhave found almost complete equilibration of the label betweenthe C-2 and C-3 position of OAAwhen labeled lactate, alanine,or pyruvate is used as the precursor ( 18, 23, 24). Even if thereis incomplete equilibration, the maximum error would be <5%.Assuming incomplete equilibration, minimum percent glycogensynthesized from alanine/lactate equals (E5 - 1. 1) + (E6 - 1.1)/(PV C-3 - 1.1) X 100, or 12 and 24% vs. 7 and 20% (assumingcomplete equilibration) in the high- and low-dose groups, re-spectively.
Our observation that the direct pathway accounts for ap-proximately one-third of hepatic glycogen repletion is in agree-ment with the findings of Newgard et al. (3). They infused doublylabeled [3-3H, U-_4C]glucose into 20-h starved rats and foundthat the specific activity of 3H and 14C in newly synthesizedglycogen was 12 and 33%, respectively, of the blood glucose.The relative decrease in tritium compared with carbon specificactivity can only be explained if glucose was first metabolizedto the triose level, at which point the tritium label would be lost.From these results, they concluded that, at a maximum, only12-28% of hepatic glycogen synthesis could have been deriveddirectly from glucose. In a subsequent publication (4), these sameworkers examined the scrambling of the '4C-label between C- 1and the rest of the glucosyl units (C-2-C-5) in hepatic glycogenfollowing the intragastric administration of [I-;4C]glucose. Theyfound that 39-59% of the 14C-label was recovered in the C-1position of glucose. This is less than in the present study where82-87% of the '3C-label was found in C-1. The reason for this
1234 Shulman et al.

discrepancy is not clear but may be related to differences in thediet, age of the rats, method of glucose administration (bolus vs.continuous infusion), lighting conditions, or actual length offast. Newgard et al. (4) suggested that the dose of glucose mightplay an important role in determining the pathway via whichglycogen is replenished following feeding. Their results suggestedthat higher glucose loads (4 mg/g body weight), with resultanthigher portal venous glucose levels, preferentially favored thedirect pathway by activating the more sluggish, high capacity,low affinity glucokinase reaction. However, our results showedno significant difference in the amount of glycogen synthesizedby the direct pathway in the low (36%)- vs. high (3 1%)-dosestudies. Spence and Koudelka (20) also found no difference inthe percentage of glycogen synthesized by the direct pathwaywhen cultured liver cells were incubated with a high vs. lowmedium glucose concentration.
Several earlier studies have examined the labeling pattern ofglucose in glycogen following the administration of [1-'4C]-,[1-'3C]-, [2-'4C]-, or [6-'4C]glucose either intragastrically or in-travenously (19, 25-29). Our results agree with these data inthat most of the label in glycogen was found in the same positionas the administered glucose. While Newgard et al. (4) have shownthat anesthesia might explain the lack of randomization in someof these studies, it would not explain our results or those ofothers (25-28), who employed animals that were not anesthe-tized. Because of this observation, previous investigators haveconcluded that glycogen repletion occurs primarily via a directpathway (i.e., without passage through three carbon interme-diates). It should be emphasized, however, that without knowl-edge of the portal venous glucose specific activity, the actualamount of glycogen synthesized via the direct pathway cannotbe determined. Our study extends these earlier observations inthat the specific activity of glucose in the portal vein was mea-sured and found to be high relative to that of other glycogenprecursors (such as alanine and lactate). Therefore, the totalamount of glycogen derived from the direct pathway is small,amounting to no more than one-third of total glycogen forma-tion. Our results also point out another problem with prior stud-ies that have attempted to define the pathways via which glycogenis repleted. For alanine/lactate, the specific activity in portalvein is approximately one-third that of the administered glucoseand, consequently, the amount of 13C-label recovered in positionsC-2-C-6 is quite small and may be difficult to quantitate. Fur-thermore, if precursors other than alanine/lactate/pyruvate con-tribute to glycogen repletion, no label will be detected in positionsC-2-C-6.
The present study design allowed us to quantitate the min-imum contribution of lactate and alanine to glycogen synthesis(these can be considered together since their '3C-enrichmentsare approximately equal; Table II). This was found to be 7±2%in the high-dose group and increased significantly to 20±1%(P < 0.01) in the low-dose group. As pointed out earlier, thesenumbers represent an underestimate because of dilution of thelabel as it passes through the OAApool. Hetenyi (12) has ex-perimentally calculated a dilution factor of 1.38 in fed rats. Usingthis value, the contribution of lactate and alanine to glycogensynthesis becomes 10 and 28% in the high- and low-dose groups,respectively. However, caution is required in applying this factorto our calculations since the metabolic state of our animals wasdifferent from that of Hetenyi's. In addition, Hetenyi's correctionfactor is based on a model assuming a negligible amount ofpyruvate dehydrogenase (PDH) activity. This is likely to be an
untenable assumption, especially under the hyperinsulinemicconditions of our study.
Glycogen synthesis from the indirect pathway, involvingglucose conversion to triose-phosphates and subsequent con-version to glycogen, was also calculated and found to represent3 and 1% of hepatic glycogen synthesis in the high- and low-dose groups, respectively. This is a maximum estimate becausethe transaldolase reaction can exchange label between the triosepool and the bottom half of fructose-6-phosphate. The ratio 2X (E6 - E5)/(E 1 - E5) provides a maximum measure of futilecycling between fructose-6-phosphate and fructose-1,6-diphos-phate (30), and indicates that only a small amount of substrate(< 10%) cycling occurs at this step under the present experimentalconditions. This observed scrambling of label into C6 is in goodagreement with the results of Van Schaftingen et al. (31).
If one sums up the total amount of glycogen synthesis fromthe direct and indirect (both lactate/alanine and triose phos-phates) pathways, one can account for only 44 and 65% of thenewly synthesized glycogen in the high- and low-dose groups,respectively. Thus, in both groups, about half of glycogen syn-thesis cannot be accounted for. Two possibilities could explainthese results. First, the flux of unlabeled acetyl coenzyme A en-tering the TCAcycle following glucose ingestion may be muchgreater than estimated by Hetenyi ( 12). If the correction factorfor dilution in the OAApool were to increase to 4-8, lactate/alanine could explain the majority of the unaccounted for gly-cogen formation. In fact, in a recent theoretical analysis, Katz(32) has estimated that the correction factor is greater than the1.38 estimated by Hetenyi (12), but is unlikely to exceed 2-3.Another possible explanation is that a significant fraction of gly-cogen repletion is derived from unlabeled glycogen precursorsother than lactate/alanine/pyruvate, such as glycerol.
It is of interest to speculate upon the source of lactate/alaninethat is used for hepatic glycogen synthesis. In preliminary studies,we (Sillerud, L. O., J. B. Blair, R. Dumire, and R. G. Shulman,unpublished observations) have shown that when [1-'3C]glucoseis added to the isolated perfused liver preparation, the '3C-labelis found almost entirely in the C- 1 position of glucose in glycogen.Only a trivial amount of label was found in the C-6 positionand no label was detected in the C-2 and C-5 positions. Thepresent findings which demonstrate significant '3C-label inC-2-C-6 indicate that glucose must first be metabolized to lac-tate/alanine by peripheral (i.e., muscle) and gut tissues or perhapseven liver (20), and that these three carbon compounds thenserve as the precursors for glycogen formation. This may haveimportant implications for the diabetic patient in whom pe-ripheral resistance to the action of insulin is a characteristic fea-ture. If insulin-mediated glucose uptake by muscle is impaired,one might expect that this would secondarily lead to a defect inhepatic glycogen synthesis. Thus, the defects in muscle and he-patic glucose metabolism would be complementary and bothwould contribute to the insulin resistance observed in diabeticsubjects.
In summary, our results demonstrate that: (a) only one-thirdof liver glycogen repletion is derived from the direct pathway inwhich glucose is converted directly to glycogen; and that (b) onlya very small amount of newly synthesized glycogen would beaccounted for by the indirect pathway involving glucose - triose-P - glycogen; this suggests that futile cycling between fructose-6-phosphate and fructose- 1 ,6-diphosphate is quite small but yetdetectable under the present experimental conditions. Our re-sults, also, demonstrate that (c) alanine and lactate account for
Hepatic Glycogen Formation 1235

a minimum of between 10 and 28%of the glycogen synthesized;and that (d) the three pathways through which the labeled fluxwas measured accounted for a total of only 40-60% of the totalglycogen synthesized. The latter observation suggests that eitherthere is considerable glycogen synthesis from unlabeled precur-sors that were not measured in the present experiments or thatthe dilution of labeled lactate/alanine in the OAApool is muchgreater than previously appreciated, or some combination ofthese two explanations.
Acknowledgments
The authors would like to thank Betsy Hodgson for her technical assis-tance in performing the studies. Ms. Caryl Foote provided expert sec-retarial assistance.
This work was supported in part by National Institutes of Healthgrants AM01248 and AM27121 and a National Science Foundationgrant PCM8402670.
References
1. Radziuk, J. 1982. Sources of carbon in hepatic glycogen synthesisduring absorption of an oral glucose load in humans. Fed. Proc. 41: 110-116.
2. Katz, L. D., M. G. Glickman, S. Rapoport, E. Ferrannini, andR. A. DeFronzo. 1983. Splanchnic and peripheral disposal of oral glucosein man. Diabetes. 32:675-679.
3. Newgard, C. B., L. J. Hirsch, D. W. Foster, and J. D. McGarry.1983. Studies on the mechanism by which exogenous glucose is convertedinto liver glycogen in the rat. J. Biol. Chem. 258:8046-8052.
4. Newgard, C. B., S. V. Moore, D. W. Foster, and J. D. McGarry.1984. Efficient hepatic glycogen synthesis in refeeding requires continuedcarbon flow through the gluconeogenic pathway. J. Biol. Chem. 259:6958-6963.
5. Cherrington, A. D., W. W. Lacy, and J. L. Chiasson. 1978. Effectof glucagon on glucose production during insulin deficiency in the dog.J. Clin. Invest. 62:664-677.
6. Somogyi, M. 1934. The solubility and preparation of phosphorusand nitrogen-free glycogen. J. Biol. Chem. 104:245-253.
7. Keppler, D., and K. Decker. 1974. Glycogen: Determination withAmyloglucosidase. In Methods of Enzymatic Analysis. H. U. Bergmeyer,editor. Verlag Chemie Weinheim, Academic Press, New York. 1127-1131.
8. Campbell, I. D., C. M. Dobson, G. Jeminet, and R. J. P. William.1974. Pulsed NMRmethods for the observation and assignment of ex-changeable hydrogens: application to bacitracin. FEBS Lett. 49:115-119.
9. Rothman, D. L., F. Arias-Mendoza, G. I. Shulman, and R. G.Shulman. 1984. A pulse sequence for simplifying 'H NMRspectra ofbiological tissues. J. Magn. Reson. Medicine. 60:430-436.
10. Rothman, D. L., K. L. Behar, H. P. Hetherington, and R. G.Shulman. 1984. Homonuclear 'H double-resonance difference spec-troscopy of the rat brain in vivo. Proc. Natl. Acad. Sci. USA. 81:6330-6334.
11. Krebs, M. A., R. Hems, M. J. Weidemann, and R. N. Speake.1966. The fate of isotopic carbon in kidney cortex synthesizing glucosefrom lactate. Biochem. J. 10 1:242-249.
12. Hetenyi, G., Jr., and C. Ferrarotto. 1983. Correction for metabolic
exchange in the calculation of the rate of gluconeogenesis in rats. Biochem.Med. 29:372-378.
13. Nilsson, L. H., and E. Hultman. 1974. Liver and muscle glycogenin man after glucose and fructose infusion. Scand. J. Clin. Lab. Invest.33:5-10.
14. Hers, H. G. 1976. The control of glycogen metabolism in theliver. Annu. Rev. Biochem. 45:167-189.
15. Hems, 0. A., P. D. Whitton, and E. A. Taylor. 1972. Glycogensynthesis in the perfused liver in the starved rat. Biochem. J. 129:529-538.
16. Shikama, M., and M. Ui. 1978. Glucose diverts hepatic gluco-neogenic product from glucose to glycogen in vivo. Am. J. Physiol. 235:E354-E360.
17. Katz, J., and McGarry, J. D. 1984. The glucose paradox. Is glucosea substrate for liver metabolism? J. Clin. Invest. 74:1901-1909.
18. Cohen, S. M., P. Glynn, and R. G. Shulman. 1981. '3C NMRstudy of gluconeogenesis from labeled alanine in hepatocytes from eu-thyroid and hyperthyroid rats. Proc. Nati. Acad. Sci. USA. 78:60-64.
19. Hostler, K. Y., and B. R. Landau. 1967. Estimation of the pentosecycle contribution to glucose metabolism in tissue in vivo. Biochemistry.6:2961-2964.
20. Spence, J. T., and A. P. Koudelka. 1985. Pathway of glycogensynthesis from glucose in hepatocytes maintained in primary culture. J.Bio. Chem. 260:1521-1526.
21. Rose, I. A., R. Kellermeyer, R. Stjerholm, and H. G. Wood.1962. The distribution of `4C in glycogen from deuterated glycerol-'4Cas a measure of the effectiveness of triose phosphate isomerase in vivo.J. Biol. Chem. 237:3325-3331.
22. Cohen, S. M., S. Ogawa, and R. G. Shulman. 1979. 13C NMRstudies of gluconeogenesis in rat liver cells: utilization of labeled glycerolby cells from euthyroid and hyperthyroid cells. Proc. Natl Acad. Sci.USA. 76:1603-1607.
23. Rognstad, R., and J. Katz. 1972. Glucogenesis in the kidneycortex. Quantitative estimation of carbon flow. J. Biol. Chem. 247:6047-6054.
24. Walter, P., V. Paetkau, and H. A. Lardy. 1966. Paths of carbonin gluconeogenesis and lipogenesis. J. Biol. Chem. 241:2523-2532.
25. Hers, H. G. 1955. The conversion of fructose-1-'4C and sorbitol-1-'4C to liver and muscle glycogen in the rat. J. Biol. Chem. 214:373-381.
26. Cook, M., and Y. Lorber. 1952. Conversion of I-'4C mannoseand 1-'4C glucose to liver and muscle glycogen in the intact rat. J. Biol.Chem. 199:1-8.
27. Taylor, W. R., and R. G. Langdon. 1956. Intestinal absorptionof glucose in the rat. Biochem. Biophys. Acta. 21:384-385.
28. Bishop, J. S., R. Steele, N. Altszuler, A. Dunn, C. Bjerknes, andR. C. De Bodo. 1965. Effects of insulin on liver glycogen synthesis andbreakdown in the dog. Am. J. Physiol. 208(2):307-316.
29. Reo, N. V., B. A. Siegfried, and J. H. Ackerman. 1984. Directobservation of glycogenesis and glucagon stimulated glycogenolysis inthe rat liver in vivo by high-field carbon-1 3 surface coil NMR. J. Biol.Chem. 259:13664-13667.
30. Rognstad, R., and J. Katz. 1976. Effects of hormones and ofethanol on the fructose-6-P-fructose- 1,6-P2 futile cycle during glyconeo-genesis in the liver. Arch. Biochem. Biophys. 177:337-345.
31. Van Schaftingen, E., L. Hue, and H. G. Hers. 1980. Study of thefructose-6-phosphate/fructose- 1,6-biphosphate cycle in the liver in vivo.Biochem. J. 192:263-271.
32. Katz, J. 1985. The determination of gluconeogenesis in vivo with'4C labelled substrates. Am. J. Physiol. 248:R39 1-R399.
1236 Shulman et al.