mechanisms of injury and injury criteria for the … · initial flexion angle, and resultant ankle...
TRANSCRIPT

MECHANISMS OF INJURY AND INJURY CRITERIA FOR THE HUMAN FOOT AND ANKLE IN DYNAMIC AXIAL IMPACTS TO THE FOOT
Gregory S. Klopp, JeffR. Crandall, Gregory W. Hall, Walter D. Pilkey Dept. of Aerospace, Mechanical, and Nuclear Engineering, University ofVirginia
Shepard R. Hutwitz, M.D Department Of Orthopaedic Surgery, University of Virginia
Shashi M. Kuppa Conrad Technologies Inc.
ABSTRACT
A series of 50 amputated human lower limbs were tested to detennine the injury tolerance of the ankle and foot structure to kinematic and kinetic parameters that could be used to describe the impact environment. The test apparatus consisted of a pendulum-driven plate constrained to move longitudinally while simulating the motion of the toepan structure in an automobile. The leg specimens were amputated at the midshaft of the femur and attached to a device simulating the hip joint. The legs were mounted to the plate in a position approximating the geometry typical for drivers and were constrained with a spring loaded tether and knee harness which simulated the action ofthe leg muscles. Pendulum speed, foot plate acceleration and loads, leg and foot angular velocities and accelerations, and tibia intemal loads were measured directly for each test. The lower limb trauma included fractures of the calcaneus, talus, malleoli, and ligamentous tears identified from radiography and detailed necropsy. Logistic regression analysis was used to interpret the data. The peak plantar contact load and its rate of onset, as weil as resultant heel acceleration were good predictors of injury (p<0.05). The fifty percent probability of injury level using these single factor models is at 9.3 kN peak contact force, 5 kN/msec peak contact force onset rate, and 2 1 6 G' s peak resultant heel acceleration. Initial position ofthe foot was found to influence injury outcome with the dorsiflexed foot being more resistant to injury than the neutral or plantarflexed foot. Finally, injury risk models using a linear combination of contact force or its onset rate, initial flexion angle, and resultant ankle angular velocity were found to be very good predictors of injury (p=0.0001).
HIGH ENERGY TRAUMA to the ankle and foot region is a debilitating and expensive consequence ofmotor vehicle accidents. Morgan et al. (1991) estimated their incidence at 10% of all AIS�2 injuries. Pattimore et al. (1991) reviewed the UK CCIS accident database and noted that 68% of all skeletal injuries to front seat occupants in frontal impacts occur below the knee. These injuries have a maximum possible AIS rating of 2
IRCOBI Conference - Hannover, September 1997 73
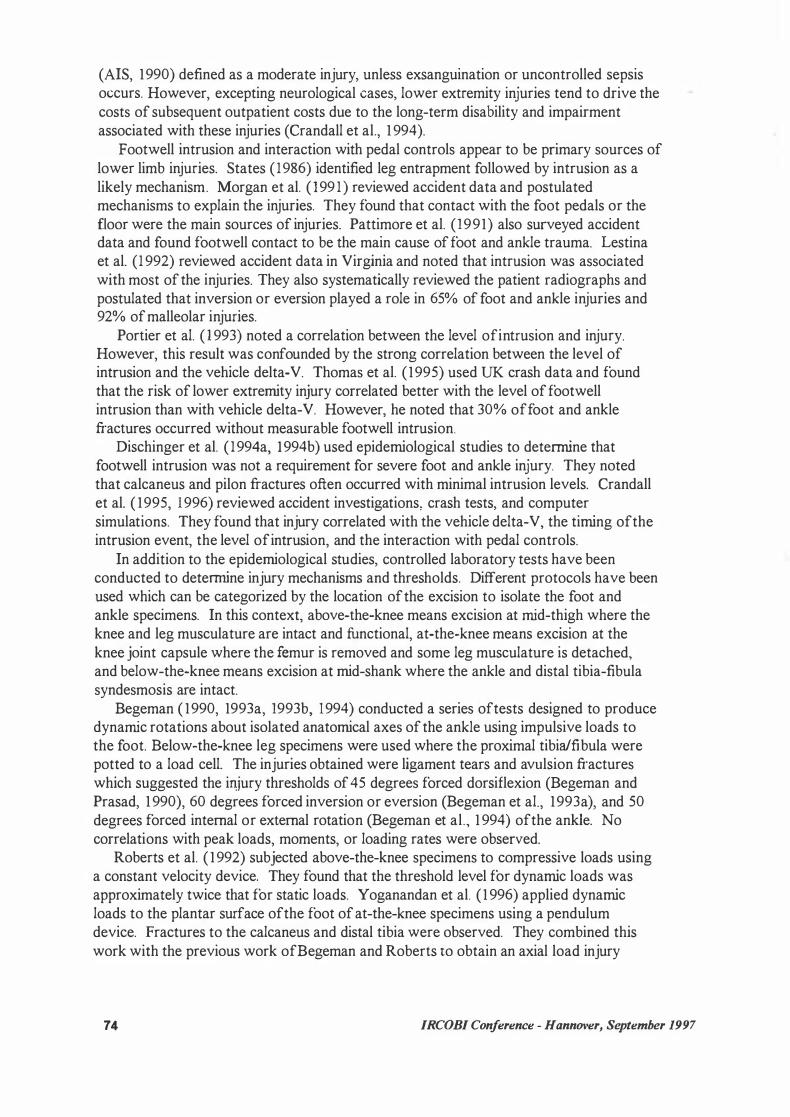
(AIS, 1990) defined as a moderate injury, unless exsanguination or uncontrolled sepsis occurs. However, excepting neurological cases, lower extremity injuries tend to drive the costs of subsequent outpatient costs due to the long-term disability and impairment associated with these injuries (Crandall et al., 1 994).
Footwell intrusion and interaction with pedal controls appear to be primary sources of lower limb injuries. States (1986) identified leg entrapment followed by intrusion as a likely mechanism. Morgan et al. ( 1991 ) reviewed accident data and postulated mechanisms to explain the injuries. They found that contact with the foot pedals or the floor were the main sources of injuries. Pattimore et al. (1991) also surveyed accident data and found footwell contact to be the main cause of foot and ankle trauma. Lestina et al. (1 992) reviewed accident data in Virginia and noted that intrusion was associated with most of the injuries. They also systematically reviewed the patient radiographs and postulated that inversion or eversion played a role in 65% of foot and ankle injuries and 92% of malleolar injuries.
Portier et al. ( 1 993) noted a correlation between the level ofintrusion and injury. However, this result was confounded by the streng correlation between the level of intrusion and the vehicle delta-V. Thomas et al. ( 1995) used UK crash data and found that the risk of lower extrernity injury correlated better with the level of footwell intrusion than with vehicle delta-V. However, he noted that 30% offoot and ankle fractures occurred without measurable footwell intrusion.
Dischinger et al. ( 1994a, l 994b) used epiderniological studies to deterrnine that footwell intrusion was not a requirement for severe foot and ankle injury. They noted that calcaneus and pilon fractures often occurred with minimal intrusion levels. Crandall et al. ( 1995, 1 996) reviewed accident investigations, crash tests, and computer simulations. They found that injury correlated with the vehicle delta-V, the tirning ofthe intrusion event, the level of intrusion, and the interaction with pedal controls.
In addition to the epiderniological studies, controlled laboratory tests have been conducted to deterrnine injury mechanisms and thresholds. Different protocols have been used which can be categorized by the location of the excision to isolate the foot and ankle specimens. In this context, above-the-knee means excision at rnid-thigh where the knee and leg musculature are intact and functional, at-the-knee means excision at the knee joint capsule where the femur is removed and some leg musculature is detached, and below-the-knee means excision at rnid-shank where the ankle and distal tibia-fibula syndesmosis are intact.
Begeman ( 1990, 1993a, 1993b, 1994) conducted a series oftests designed to produce dynarnic rotations about isolated anatornical axes of the ankle using impulsive loads to the foot. Below-the-knee leg specimens were used where the proximal tibia/fibula were potted to a load cell. The injuries obtained were ligament tears and avulsion fractures which suggested the injury thresholds of 45 degrees forced dorsiflexion (Begeman and Prasad, 1 990), 60 degrees forced inversion or eversion (Begeman et al., 1993a), and 50 degrees forced intemal or extemal rotation (Begeman et al., 1 994) ofthe ankle. No correlations with peak loads, moments, or loading rates were observed.
Roberts et al. ( 1992) subjected above-the-knee specimens to compressive loads using a constant velocity device. They found that the threshold level for dynarnic loads was approximately twice that for static loads. Y oganandan et al. ( 1 996) applied dynarnic loads to the plantar surface ofthe foot of at-the-knee specimens using a pendulum device. Fractures to the calcaneus and distal tibia were observed. They combined this work with the previous work ofBegeman and Roberts to obtain an axial load injury
74 IRCOBI Conference - Hannover, September 1997
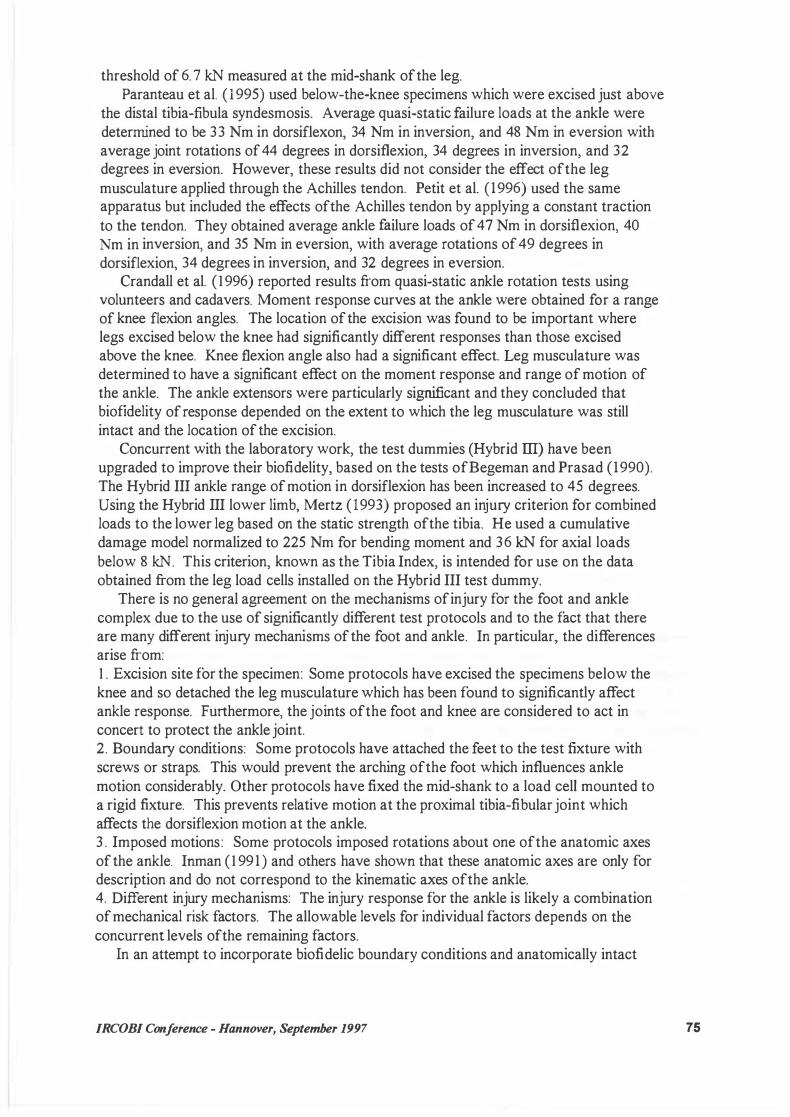
threshold of 6. 7 kN measured at the mid-shank of the leg. Paranteau et al. ( 1 995) used below-the-knee specimens which were excised just above
the distal tibia-fibula syndesmosis. Average quasi-static failure loads at the ankle were determined to be 33 Nm in dorsiflexon, 34 Nm in inversion, and 48 Nm in eversion with average joint rotations of 44 degrees in dorsiflexion, 34 degrees in inversion, and 32 degrees in eversion. However, these results did not consider the effect ofthe leg
musculature applied through the Achilles tendon. Petit et al. ( 1996) used the same apparatus but included the effects ofthe Achilles tendon by applying a constant traction
to the tendon. They obtained average ankle failure loads of 47 Nm in dorsiflexion, 40 Nm in inversion, and 35 Nm in eversion, with average rotations of 49 degrees in dorsiflexion, 34 degrees in inversion, and 32 degrees in eversion.
Crandall et al. ( 1 996) reported results from quasi-static ankle rotation tests using volunteers and cadavers. Moment response curves at the ankle were obtained for a range of knee flexion angles. The location of the excision was found to be important where legs excised below the knee had significantly different responses than those excised above the knee. Knee tlexion angle also had a significant effect. Leg musculature was determined to have a significant effect on the moment response and range of motion of the ankle. The ankle extensors were particularly significant and they concluded that biofidelity of response depended on the extent to which the leg musculature was still intact and the location of the excision.
Concurrent with the laboratory work, the test dummies (Hybrid ill) have been upgraded to improve their biofidelity, based on the tests ofBegeman and Prasad (1990). The Hybrid III ankle range of motion in dorsiflexion has been increased to 45 degrees. Using the Hybrid III lower limb, Mertz (1993) proposed an injury criterion for combined loads to the lower leg based on the static strength ofthe tibia. He used a cumulative damage model normalized to 225 Nm for bending moment and 36 kN for axial loads
below 8 kN. This criterion, known as the Tibia Index, is intended for use on the data obtained from the leg load cells installed on the Hybrid III test dummy.
There is no general agreement on the mechanisms of injury for the foot and ankle complex due to the use of significantly different test protocols and to the fact that there are many different injury mechanisms of the foot and ankle. In particular, the differences arise from: 1 . Excision site for the specimen: Some protocols have excised the specimens below the knee and so detached the leg musculature which has been found to significantly affect ankle response. Furthermore, the joints ofthe foot and knee are considered to act in concert to protect the ankle joint. 2. Boundary conditions: Some protocols have attached the feet to the test fixture with screws or straps. This would prevent the arching ofthe foot which influences ankle motion considerably. Other protocols have fixed the mid-shank to a load cell mounted to a rigid fixture. This prevents relative motion at the proximal tibia-fibular joint which affects the dorsiflexion motion at the ankle. 3 . Imposed motions: Some protocols imposed rotations about one ofthe anatomic axes of the ankle. Inman ( 1 991 ) and others have shown that these anatomic axes are only for description and do not correspond to the kinematic axes ofthe ankle. 4. Different injury mechanisms: The injury response for the ankle is likely a combination of mechanical risk factors. The allowable levels for individual factors depends on the concurrent levels ofthe remaining factors.
In an attempt to incorporate biofidelic boundary conditions and anatomically intact
IRCOBI Conference - Hannover, September 1997 75

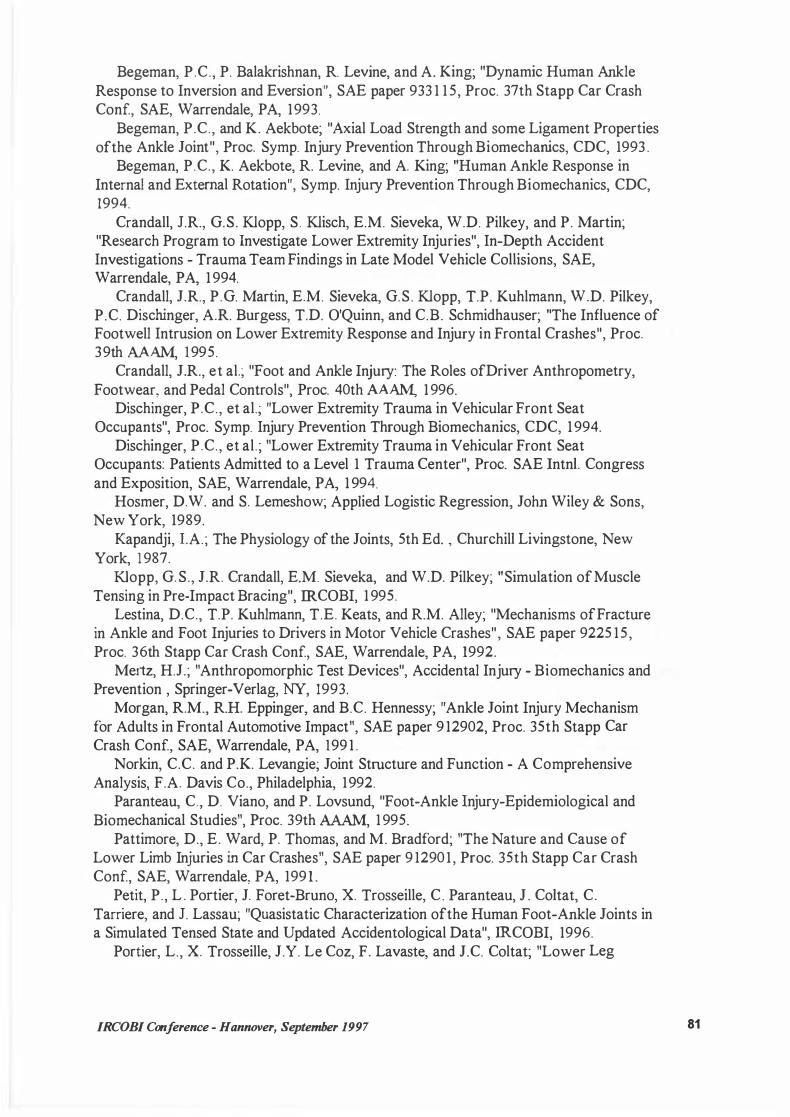
foot and ankle specimens, a test protocol, custom instrumentation, and test apparatus (Figure 1 ) were developed at the University ofVirginia. This paper presents a series of cadaver tests conducted with this apparatus in developing injury criteria of the foot and ankle complex.
l.\1ETHODOLOGY
Human lower leg specimens were obtained from medical cadavers pursuant to the ethical guidelines and research protocol approved by the Human Usage Review Panel, National Highway Trafiic Safety Administration and an institutional review board. Each specimen was obtained by excision at the rnidshaft ofthe femur. All knee ligaments and leg musculature were intact and knee and proximal tibia-fibula joint motions were normal. An initial series of radiographs was used to determine evidence of existing pathologies that would influence the outcome ofthe tests. Suitable fresh specimens were at -70° C and held in this condition for up to six months.
Prior to testing, the specimens were thawed at room temperature for 36 to 48 hours. A segment of the tibia diaphysis, approximately 9 cm long, was removed and an in situ five axis load cell was installed (torsion was not measured). Concurrently, a 3 cm incision was made over the medial aspect of the calcaneus and a mounting plate was screwed into the medial cortex of the calcaneus or through both cortices in later tests. This plate was used to attach a triaxial angular rate sensor and accelerometer assembly. A sirnilar installation was performed on the tibia.
The test apparatus consisted of a pendulum-driven ankle test cell (Figure 1) . The device was intended to simulate the interaction of the intruding floor pan with the lower extrernity. The ankle test cell consisted of a contact pad, transfer piston, positioning brackets, and a foot plate which was constrained to move longitudinally. This pulse shape was controlled by varying the drop height of the pendulum, its effective mass, and the composition of the contact pad which acted as a pulse moderater. The positioning brackets allowed initial positioning of the foot and ankle complex about the flexion and inversion/eversion axes. The foot plate was instrumented with a five axis load cell and a triaxial accelerometer assembly.
A femur bar was attached to the femur to reproduce the original hip to knee length of the specimen. The locations of the ankle and knee centers were determined by palpation and marked on the skin. This was done to locate the photo targets and to improve repeatability for the measurements of joint locations during the tests. The leg was installed in the test fixture by placing the foot on the foot plate and attaching the femur bar to the hip clevis with a pin.
The hip center location was adjusted along with the angle of inclination ofthe foot plate to obtain the femur and tibia angles corresponding to the desired initial ankle flexion angle for the test. The initial inversion/eversion angle was obtained by rotating the foot plate about its length which corresponded to rotating the foot about its long axis. The sign convention assigned dorsiflexion and eversion as positive values while plantarflexion and inversion were assigned negative values. Neutral position for the foot was defined as that configuration where the normal to the plane of contact for the sole of the foot was parallel to the mechanical axis of the tibia.
Once the initial leg configuration was established, a hamess was placed over the knee. This hamess was attached to a spring via a block and tackle assembly which could be adjusted to provide an initial preload. Using the data obtained from the tibia load cell,
76 IRCOBI Conference - Hannover, September 1997
the preload was adjusted to give an increase in tibia axial load corresponding to the normal standing load (i.e. one halfbody weight). This preload was imposed to set the ankle and arch and obtain reasonable initial conformities for these joints.
Testing was conducted as per a factorial design based on the initial dorsiflexion and eversion angles, peak contact load, and the onset rate for the contact load. All electronic data were obtained using a DSP TRAQ-P data analysis system with a 3300 Hz 8 pole butterworth low pass prefilter for anti-aliasing. The data were then digitized at 10,000 samples per second and digitally filtered to SAE J21 1 channel class 180. A video record was also made of each test using a Kodak Ekta-Pro high speed ( 1000 fps) monochrome video camera and motion analysis workstation.
RESULTS AND DISCUSSION
TEST DATA - The contact force between the foot plate and the plantar surface ofthe foot was obtained by mass compensating the foot plate load cell data. The onset rate for the contact force was calculated as the average slope between the points corresponding to 1 0% and 90% ofthe total rise. The angular velocity data were integrated to obtain angular displacement. Ankle rotations were obtained by transforming the rotation of the foot into the reference frame of the leg using Euler angle transformations (Hall, 1 996). The ankle angular velocity was obtained by differentiating the ankle rotations. Resultant heel acceleration was computed from the three axis array of accelerometers attached to the heel.
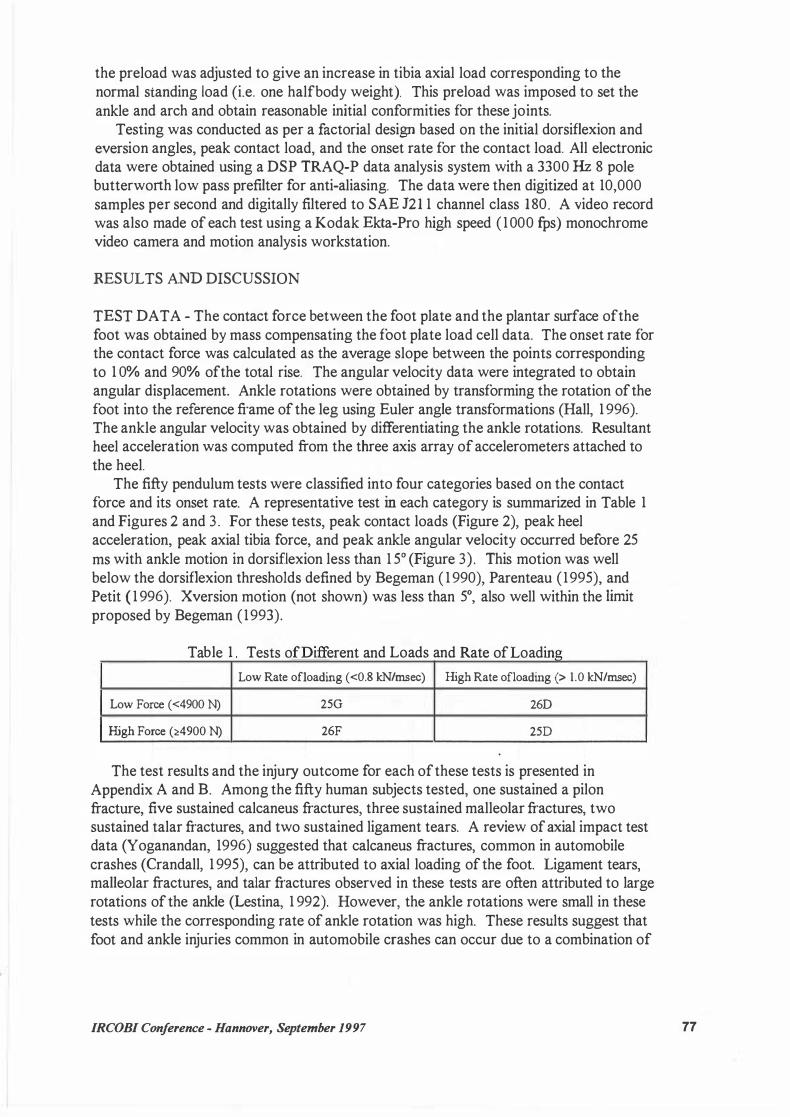
The fifty pendulum tests were classified into four categories based on the contact force and its onset rate. A representative test in each category is summarized in Table 1 and Figures 2 and 3 . For these tests, peak contact loads (Figure 2), peak heel acceleration, peak axial tibia force, and peak ankle angular velocity occurred before 25
ms with ankle motion in dorsiflexion less than 1 5° (Figure 3). This motion was well below the dorsiflexion thresholds defined by Begeman ( 1 990), Parenteau (1995), and Petit ( 1 996). Xversion motion (not shown) was less than 5°, also well within the limit proposed by Begeman (1993).
T bl 1 T a e ests o 1 erent an d L d d R fL d.
oa s an ate o oa mg Low Rate ofloading (<0.8 kN/msec) High Rate ofloading (> 1.0 kN/msec)
Low Force (<4900 N) 25G 26D
High Force (:<!4900 N) 26F 25D
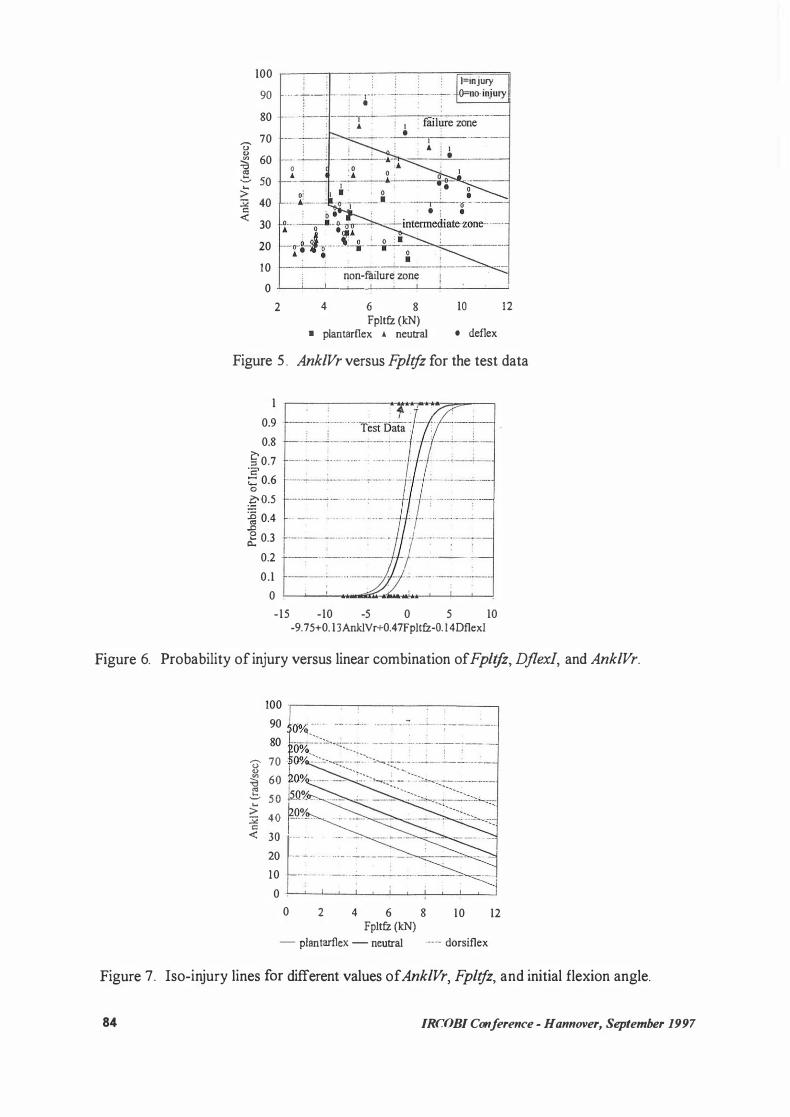
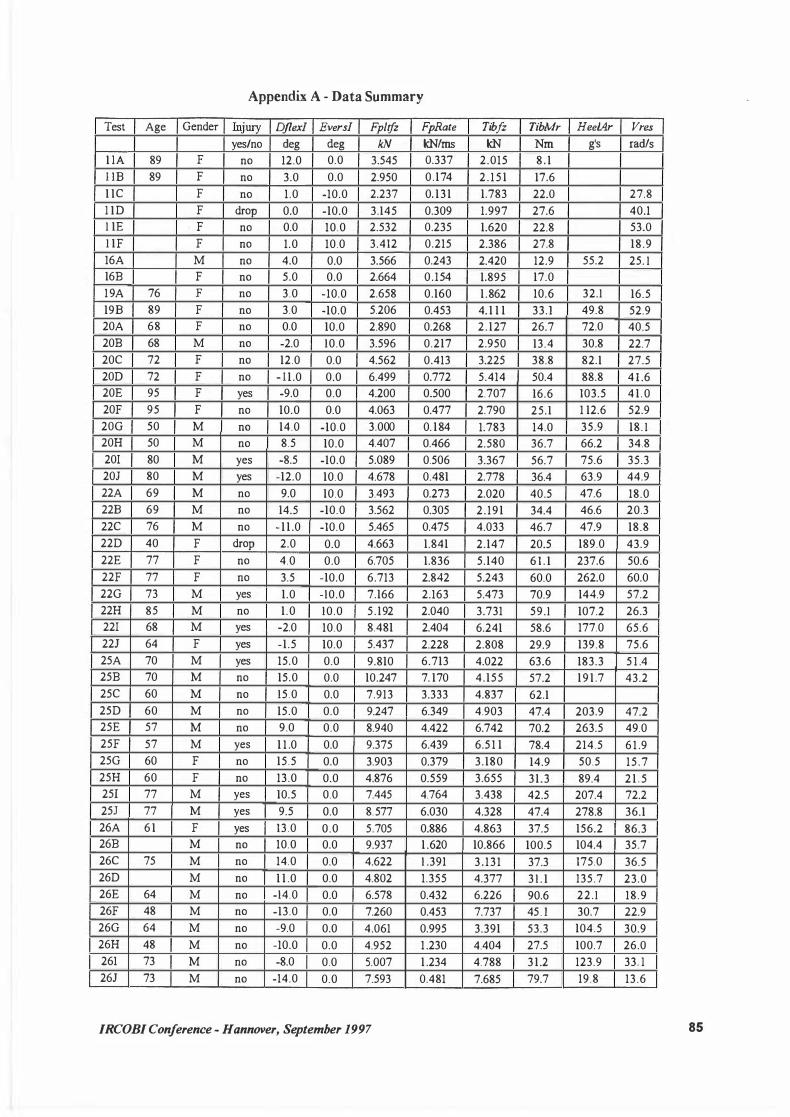
The test results and the injury outcome for each of these tests is presented in Appendix A and B. Among the fifty human subjects tested, one sustained a pilon fracture, five sustained calcaneus fractures, three sustained malleolar fractures, two sustained talar fractures, and two sustained ligament tears. A review of axial impact test data (Y oganandan, 1996) suggested that calcaneus fractures, common in automobile crashes (Crandall, 1 995), can be attributed to axial loading ofthe foot. Ligament tears, malleolar fractures, and talar fractures observed in these tests are often attributed to large rotations ofthe ankle (Lestina, 1 992). However, the ankle rotations were small in these tests while the corresponding rate of ankle rotation was high. These results suggest that foot and ankle injuries common in automobile crashes can occur due to a combination of
JRCOBJ Conference - Hannover, September 1997 77
axial loading of the foot and high rate of ankle rotation and may not require large ankle rotations.
STATISTICAL ANALYSIS - Statistical analysis was conducted to develop lower extremity injury criteria based on measured physical parameters. Linear logistic regression (Hosmer and Lemeshow, 1 989) was used to associate independent physical parameters with the observed presence of injury. The analyses were conducted using the SAS software package (SAS Institute, 1990).
The linear logistic model for the probability of injury has the form
1 p = ---n
-(ci+.EP,r;) 1 +e 1
where a is the iritercept, Xj are the n independent variables used in the model and ßi are the corresponding coefficients associated with each independent variable. The independent variables used in the analyses were the measured forces, accelerations, and moment at the tibia and the ankle and computed parameters such as resultants of accelerations, forces, and angular velocities, rate ofloading, impulse, and energy. The data were also tested for bias due to sex, age, hone mineral content, and hone size at the tibia mid-diaphysis. Although no bias was found, two older females (l ID, 22D) were excluded based on significantly lower hone mineral content.
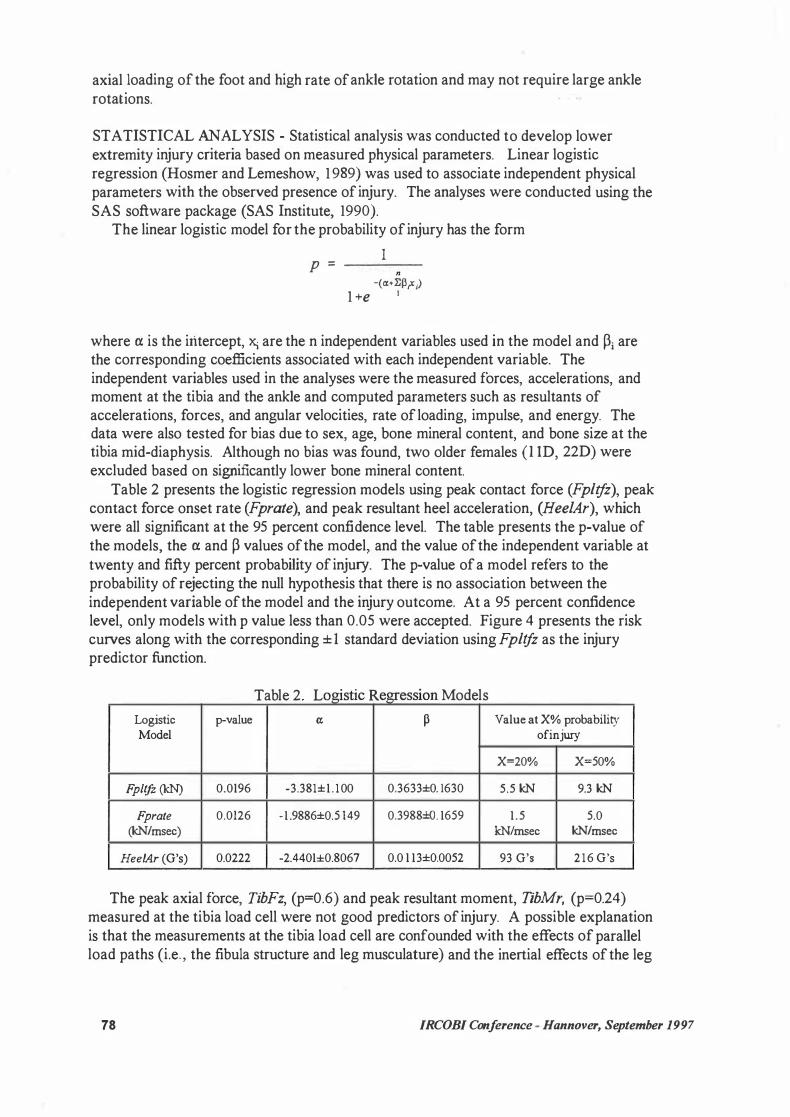
Table 2 presents the logistic regression models using peak contact force (Fpltfz), peak contact force onset rate (Fprate), and peak resultant heel acceleration, (Hee!Ar), which were all significant at the 95 percent confidence level. The table presents the p-value of the models, the a and ß values of the model, and the value of the independent variable at twenty and fifty percent probability of injury. The p-value of a model refers to the probability of rejecting the null hypothesis that there is no association between the independent variable of the model and the injury outcome. At a 95 percent confidence level, only models with p value less than 0.05 were accepted. Figure 4 presents the risk curves along with the corresponding ± 1 standard deviation using Fpltfz as the injury predictor function.
a e og1st1c egress1on T bl 2 L . . R M d l o e s
Logistic p-value a; ß V alue at X% probability Model ofinjwy
X=20% X=50%
Fp/tfz (kN) 0.0196 -3.381±1 . 100 0.3633±0. 1630 5.5 kN 9.3 kN
Fprate 0.0126 -1 .9886±0.5 149 0.3988±0. 1659 1 .5 5.0 (kN/msec) kN/rnsec kN/msec
Hee/Ar (G's) 0.0222 -2.4401±0.8067 0.0 1 13±0.0052 93 G's 216 G's
The peak axial force, TibFz, (p=0.6) and peak resultant moment, TibMr, (p=0.24) measured at the tibia load cell were not good predictors of injury. A possible explanation is that the measurements at the tibia load cell are confounded with the effects of parallel load paths (i.e„ the fibula structure and leg musculature) and the inertial effects of the leg
78 IRCOBI Conference - Hannover, September 1997

between the ankle and the load cell. The peak ankle rotations along the three anatomical axes were not good predictors of
injury (dorsiflexion: p=0.4, eversion: p=0.56, internal rotation: p=0.61). As was noted earlier, the ankle and foot injuries were not associated with the amount of rotation but with the loading conditions and the rate of ankle rotation. The Tibia Index computed from the peak axial force and sagittal plane bending moment measured by the tibia load cell was also a poor predictor of injury (p=0.3).
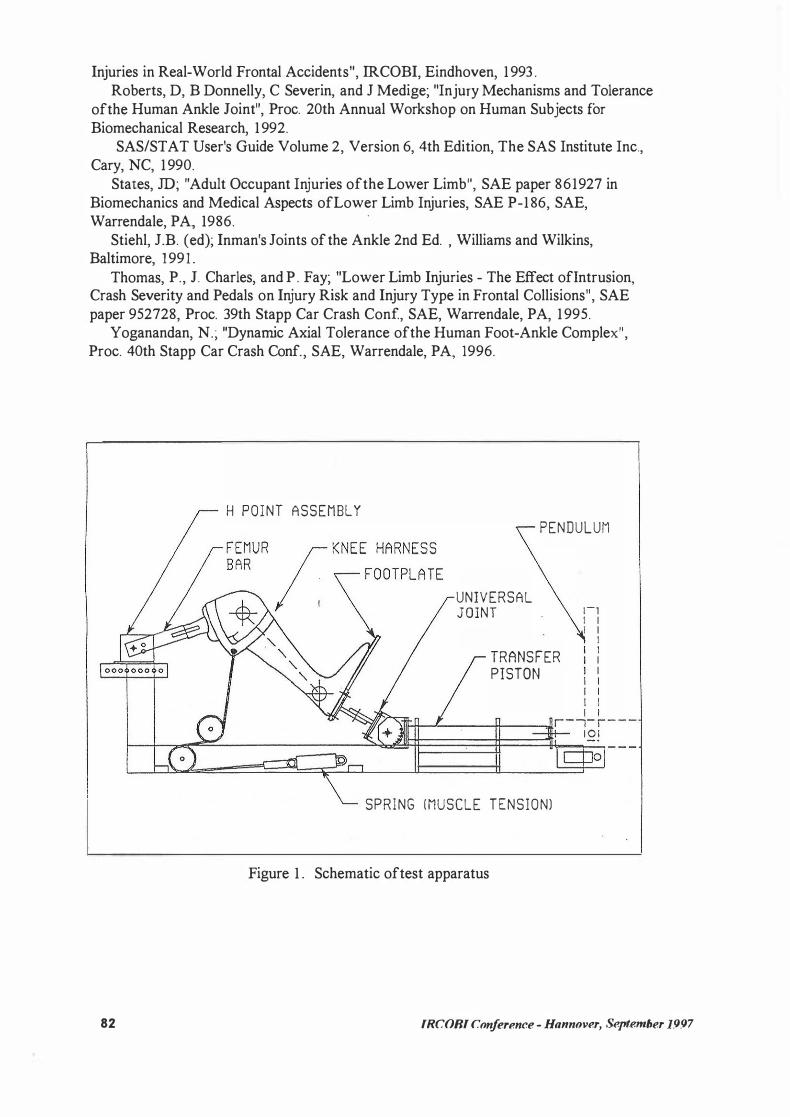
Analysis ofthe data suggested that the resultant ankle angular velocity, Ank!Vr, and initial dorsiflexion angle, Dflexl, also influerice the injury outcome. Figure 5 presents a plot of peak contact force, Fpltfz, versus peak resultant ankle angular velocity, Ank!Vr. Bach data point represents a test with initial flexion angle and the injury outcome noted. There are no foot and ankle injuries below Fpltfz of 4.2 kN in the 'non-failure zone' while there are only injuries in the 'failure zone'. There are both injury and non-injury cases in the 'intermediate zone' . All the non-injury cases for forces above 8 kN occur when the foot is initially dorsiflected (IO<Dflex/<1 5 degrees), while there are injury cases with the foot initially plantarflexed (-15<Dflexl<-1 0) even at low values of contact force and resultant angular velocity.
The ankle resultant angular velocity maybe associated with the rate dependent response of the ligaments and soft tissue of the foot and ankle structure. Preliminary analysis of the data suggested that the resultant ankle angular velocity correlates with the velocity and energy of the intruding foot plate. A foot initially dorsiflexed is less likely to be injured than a foot initially neutral or plantarflexed since the contact area at the subtalar joint is greater and the joint is better packed to withstand greater loads in the dorsiflexed state than in the neutral or plantarflexed state. The initial Xversion angle, Eversl, was found to have no influence on the injury outcome.
Since there was more than one parameter influencing injury outcome, multifactor logistic regression models were examined. A risk function using a linear combination of Fpltfz and Fprate could not be achieved because the two were highly correlated. llisk functions using a linear combination of Fpltfz or Fprate along with Dflexl and Ank!Vr were found to be the best predictors of ankle and foot injuries (p=O. 0001) as shown in Table 3 . Figure 6 presents the probability offoot and ankle injuries versus the linear combination of Fpltfz, Ank!Vr, and Dflexl along with the corresponding standard error in the probability. The linear combination separates the injury cases from the non-injury cases better and the standard error bounds are smaller than in the single factor models. Figure 7 presents iso-injury lines for 20% and 50% probability of injury for varying values of Ank!Vr and Fpltfz. The iso-injury lines are drawn for the foot in initial plantarflexion, neutral, and dorsiflexion. For Ank!Vr=50 rad/sec, the fifty percent probability of injury level is at 2 kN for the foot in initial plantarflexion, while it is at 1 1 kN for the foot in initial dorsiflexion.
CONCLUSIONS
Pendulum impact tests were conducted on 50 amputated human lower limbs to und erstand better the injury mechanisms and injury tolerances of the foot and ankle structure. The impacts were designed to represent the interaction ofthe lower extremities with the intruding floor pan during a vehicle crash. The injuries sustained by the subjects were representative ofthose noted in real world crashes. However, only a few severe foot and ankle injuries were generated.
IRCOBI Conference - Hannover, September 1997 79

T bl 3 M l . f1 a e u t1- actor R egress1on M d l o e s
Logistic Model p-value Cl ß Fpltfz (kN) 0.0001 -9.7534±3 .48 12 0.4672±0.3 149
Ank/Vr (rad/sec) 0. 1 340±0.0465 Djlexl ( degrees) -0. 1436±0.0813
Fprate (kN/msec) 0.0001 - 1 1 . 3019±4 . 1 977 1 .0935±0.5473 AnklVr (rad/sec) 0. 1786±0.0675 Dflexl ( degrees) -0.3278±0. 1601
Foot contact force, contact force onset rate, and heel acceleration, were good predictors of injury with p<0.05. The fifty percent probability ofinjury level for the single factor models are at 9.3 kN of plantar contact force, 5 kN/msec of contact force onset rate, and 2 1 6 G' s of resultant heel acceleration.
The resultant ankle angular velocity and the initial position of the foot had considerable influence on the injury outcome. Risk functions using a linear combination of the foot contact force or contact force onset rate, initial dorsiflexion angle, and the resultant ankle angular velocity were found to be the best predictors of injury (p=0.0001). The resultant ankle angular velocity maybe associated with the viscous response of the ligaments and soft tissue in the ankle. Preliminary analysis of the data suggested that the resultant ankle angular velocity correlates with the velocity and energy ofthe intruding foot plate. Under similar impact conditions, the initially dorsiflexed foot was less likely to be injured than the initially neutral or plantarflexed foot. This is because the ankle joint is better packed and has increased contact area for force transmission in the dorsiflexed state.
Initial eversion angle had no effect on injury outcome. Forces and moments measured at the tibia and peak ankle rotations were poor predictors of injury. The Tibia Index, as defined by Mertz ( 1993), was also a poor predictor of injury.
The results suggested that under dynamic loading conditions, as in a vehicle crash, foot and ankle injuries commonly attributed to large rotations of the ankle, can occur even when ankle rotations are small. Analsyis ofthe test data suggested that injury occurred early in the impact event when forces, accelerations, and moments were high, but the rotation ofthe foot was small.
ACKNOWLEDGMENT
This study was supported in part by DOT NHTSA Contract N. DTNH22-93-Y-07028. All findings and views reported in this manuscript are based on the opinions of the authors and do not necessarily represent the consensus of views of the funding organization.
REFERENCES
The Abbreviated Injury Scale , Assoc. for Advancement of Automotive Medicine, Des Plaines, IL, 1 990.
Begeman, P.C. and P. Prasad; "Human Ankle Impact Response in Dorsiflexion", SAE paper 902308, Proc. 34th Stapp Car Crash Conf, SAE, Warrendale, PA, 1 990.
80 IRCOBI Conference - Hannover, September 1997
Begeman, P.C., P. Balakrishnan, R. Levine, and A. King; "Dynamic Human Ankle
Response to Inversion and Eversion", SAE paper 933 1 1 5, Proc. 37th Stapp Car Crash Conf, SAE, Warrendale, PA, 1993.
Begeman, P.C., and K. Aekbote; "Axial Load Strength and some Ligament Properties ofthe Ankle Joint", Proc. Symp. Injury Prevention Through Biomechanics, CDC, 1993 .
Begeman, P.C., K. Aekbote, R. Levine, and A. King; "Human Ankle Response in Interna! and Externat Rotation", Symp. Injury Prevention Through Biomechanics, CDC, 1994.
Crandall, J.R., G.S. K.lopp, S. K.lisch, E.M. Sieveka, W.D. Pilkey, and P. Martin; "Research Program to Investigate Lower Extremity Injuries", In-Depth Accident Investigations - Trauma Team Findings in Late Model Vehicle Collisions, SAE, Warrendale, PA, 1 994.
Crandall, J.R., P.G. Martin, E.M. Sieveka, G.S. K.lopp, T.P. Kuhlmann, W.D. Pilkey, P.C. Dischinger, A.R. Burgess, T.D. O'Quinn, and C.B. Schmidhauser; "The Influence of Footwell Intrusion on Lower Extremity Response and Injury in Frontal Crashes", Proc. 39th AAAM, 1 995.
Crandall, J.R., et al.; "Foot and Ankle Injury: The Roles ofDriver Anthropometry, Footwear, and Pedal Controls", Proc. 40th AAAM, 1 996.
Dischinger, P.C., et al.; "Lower Extremity Trauma in Vehicular Front Seat Occupants", Proc. Symp. Injury Prevention Through Biomechanics, CDC, 1 994.
Dischinger, P.C., et al.; "Lower Extremity Trauma in Vehicular Front Seat Occupants: Patients Admitted to a Level 1 Trauma Center", Proc. SAE lntnl. Congress and Exposition, SAE, Warrendale, PA, 1 994.
Hosmer, D.W. and S. Lemeshow; Applied Logistic Regression, John Wiley & Sons, New York, 1989.
Kapandji, LA.; The Physiology of the Joints, 5th Ed. , Churchill Livingstone, New
York, 1 987. K.lopp, G. S., J.R. Crandall, E.M. Sieveka, and W.D. Pilkey; "Simulation ofMuscle
Tensing in Pre-Impact Bracing", IR.COBI, 1 995. Lestina, D.C., T.P. Kuhlmann, T.E. Keats, and R.M. Alley; "Mechanisms ofFracture
in Ankle and Foot Injuries to Drivers in Motor Vehicle Crashes", SAE paper 9225 1 5 , Proc. 36th Stapp Car Crash Conf, SAE, Warrendale, PA, 1992.
Mertz, H.J.; "Anthropomorphic Test Devices", Accidental Injury - Biomechanics and Prevention , Springer-Verlag, NY, 1993.
Morgan, R.M., R.H. Eppinger, and B.C. Hennessy; "Ankle Joint Injury Mechanism for Adults in Frontal Automotive Impact", SAE paper 9 12902, Proc. 35th Stapp Car
Crash Conf, SAE, Warrendale, PA, 199 1 . Norkin, C.C. and P.K. Levangie; Joint Structure and Function - A Comprehensive
Analysis, F.A. Davis Co., Philadelphia, 1992. Paranteau, C., D. Viano, and P. Lovsund, "Foot-Ankle lnjury-Epidemiological and
Biomechanical Studies", Proc. 39th AAAM, 1 995. Pattimore, D., E. Ward, P. Thomas, and M. Bradford; "The Nature and Cause of
Lower Limb Injuries in Car Crashes", SAE paper 9 1290 1 , Proc. 35th Stapp Car Crash Conf, SAE, Warrendale, PA, 199 1 .
Petit, P., L . Portier, J. Foret-Bruno, X. Trosseille, C . Paranteau, J . Coltat, C. Tarriere, and J. Lassau; "Quasistatic Characterization ofthe Human Foot-Ankle Joints in a Simulated Tensed State and Updated Accidentological Data", IR.COBI, 1996.
Portier, L., X. Trosseille, J.Y. Le Coz, F. Lavaste, and J.C. Coltat; "Lower Leg
IRCOBI Conference - Hannover, September 1997 81
Injuries in Real-World Frontal Accidents", IRCOBI, Eindhoven, 1 993 . Roberts, D, B Donnelly, C Severin, and J Medige; "Injury Mechanisms and Tolerance
ofthe Human Ankle Joint", Proc. 20th Annual Workshop on Human Subjects for Biomechanical Research, 1 992.
SAS/STAT User's Guide Volume 2, Version 6, 4th Edition, The SAS Institute Inc., Cary, NC, 1 990.
States, JD; "Adult Occupant Injuries ofthe Lower Limb", SAE paper 861927 in Biomechanics and Medical Aspects ofLower Limb Injuries, SAE P-1 86, SAE, Warrendale, PA, 1986.
·
Stiehl, J.B. ( ed); Inman's Joints of the Ankle 2nd Ed. , Williams and Wilkins, Baltimore, 1991 .
Thomas, P., J. Charles, and P . Fay; "Lower Limb Injuries - The Effect oflntrusion, Crash Severity and Pedals on Injury Risk and Injury Type in Frontal Collisions", SAE paper 952728, Proc. 39th Stapp Car Crash Conf, SAE, Warrendale, PA, 1 995.
Yoganandan, N.; "Dynarnic Axial Tolerance ofthe Human Foot-Ankle Complex", Proc. 40th Stapp Car Crash Conf., SAE, Warrendale, PA, 1996.
82
H POINT ASSEMBLY
PENDULUM
UNIVERSAL JOINT
TRANSFER
PISTON
1-1 1 1 1 1
1 1 1 1 1 1 1
1 1 \11�1---''--��-1-1-�-,,llr-1- r - - -1 0 1
SPRING (MUSCLE TENSIONl
Figure 1 . Schematic oftest apparatus
IRCOBI Conference - Hannover, Se.pt.emher 1.997

500 �-------,--...,..--..,.-.....,--..,.---:----:---, -500 ��,---�\IF-�l._..,."""'"--",..__,.,-----.---1
-1500 _,___,......__.,._,. g -2500 .1--.i..:-___.:i!J...J... ... :..!-...,LJ!l�-!--f-J.-_:_--+-.;::..c�-; 8 0 -3500 .
ti..
M -4500 . c 8 -5500 .
g -6500 -1----l+ll--� � : i
-7500 -1---4'�---'---'1-·-, --L-.l.-----''---'---+-'-"-1 ZSD : -8500 +--IJ--...L' --+' ---i----t--'---+--+----'---j -9500 .. L-�--!---4--+--.!..--+--+---+--+----1
0
Figure 2.
5 10 15 2 0 2 5 3 0 3 5 4 0 4 5 50 Time (msec)
Contact force for representative tests.
25 �---------------,---, ! 25D
,.-... 20 �-----'--...___·
[ 2sG .g 15 ··1------<----;------+---�G-;---+---,..--=r---==l ._,
4) öb < 10 +--'-----./-----,---r-...,.-----=� c 0 -� !i::: 5 ·1-----'---� -� 0 Cl
0 +-.......:'d-�
-5 +.------........... -+---'---:----7"-�
0 5 10 15 20 25 30 35 40 45 50 Time (msec)
Figure 3 . Ankle rotation in dorsiflexion for representative tests.
1 0.9 0.8
i::' ::> 0.7 "C' ;:;: 0.6 0
g 0.5 � 0.4 .D J: 0.3
0.2 0.1
0 0 2 4 6 8 10 12 14 16
Max. Contact Force FpltfZ (kN)
Figure 4. Probability of injury versus Fpltfz.
IRCOBI Conference - Hannover, September 1997 83
100
90 ··· - :--: - --:--F
l=injury O=no·injury
80
- -· -
----.-------...
: "' · . fäilure zone 70 'O „ � 60
"' '2 50 > 32 40 c <t: 30
20
10
0 ...
non-failure zone 0 _.._____.__...__ _____ �-----�-----�--
2 4 6 8 Fpltfz (kN)
• plantarflex • neutral
10 12
• deflex
Figure 5 . AnklVr versus Fpltfz for the test data
1 ,------,----*"'"E"*7' ......... :::-'="'---, 0.9 0.8
� 0.7 ·2 ;;::: 0.6 0 go.5 � 0.4 -· --··�-· �···· · . .0 d: 0.3 7' ·- -·-· :-·---
0.2 0.1
- ------
0 '---'---'---..... OiiiX1'.-1i1. ........ ,..__,__.___.� -15 -10 -5 0 5 10
-9. 75+0. 13An.klVr+0.47Fpltfz-O. l 4DflexI
Figure 6. Probability of injury versus linear combination of Fpltjz, Dflexl, and AnklVr.
100 ...---�....,.------------, 90 ·0%_... ·--·· - · · .. ----· . - - -·------
80 f-OöT _':.:::.._,,� - -- · · ·-·
----- · - ···7""··------ ·-,o.. ··-... : ' .
'[ 70 k�o/c __ ::.:. ... <:":::::- · ··---::-.:-::· �-
----···----1 �� F -- -"�-C : ::;:��::= <t: �� [·-� =� . . --- --· --- ---· -- -·
10 ··--·- --0 �_,__._......__.___.___.____,_.__.....__.__.___,
0 2 4 6 8 Fpltfz (kN)
10
- plantarflex - neutral ··-·· dorsiflex
12
Figure 7. Iso-injury lines for different values of AnklVr, Fpltfz, and initial flexion angle.
84 IRCOBI Conference - Hannover, September 1997
Appendix A - Data Summary
Test Age Gen der Injury Dflexl Eversl Fpltfz FpRate Tibfz TibMr HeelAr Vres yes/no deg deg kN kN/ms kN Nm g's rad/s
l lA 89 F no 12.0 0.0 3.545 0.337 2.015 8 . 1 l lB 89 F no 3.0 0.0 2.950 0.174 2 . 1 5 1 17.6 l lC F no 1 .0 -10.0 2.237 0. 1 3 1 1.783 22.0 27.8 l lD F drop 0.0 -10.0 3.145 0.309 1.997 27.6 40.1 l lE F no 0.0 10.0 2.532 0.235 1.620 22.8 53.0 l lF F no 1.0 10.0 3.412 0.215 2.386 27.8 18.9 16A M no 4.0 0.0 3.566 0.243 2.420 12.9 55.2 25. l 16B F no 5.0 0.0 2.664 0.154 1.895 17.0 1 9A 76 F no 3.0 -10.0 2.658 0.160 1 .862 10.6 32.l 16.5 19B 89 F no 3.0 -10.0 5.206 0.453 4. 1 1 1 33.l 49.8 52.9 20A 68 F no 0.0 10.0 2.890 0.268 2.127 26.7 72.0 40.5 20B 68 M no -2.0 10.0 3.596 0.217 2.950 13.4 30.8 22.7 20C 72 F no 12.0 0.0 4.562 0.413 3.225 38.8 82.l 27.5 20D 72 F no - 1 1 .0 0.0 6.499 0.772 5.414 50.4 88.8 4 1 .6 20E 95 F yes -9.0 0.0 4.200 0.500 2.707 16.6 103.5 4 1 . 0 20F 95 F no 10.0 0.0 4.063 0.477 2.790 25.1 1 12.6 52.9 20G 50 M no 14.0 -10.0 3.000 0. 1 84 1.783 14.0 35.9 18. l 20H 50 M no 8.5 10.0 4.407 0.466 2.580 36.7 66.2 34.8 20! 80 M yes -8.5 -10.0 5.089 0.506 3.367 56.7 75.6 35.3 20J 80 M yes -12.0 10.0 4.678 0.481 2.778 36.4 63.9 44.9 22A 69 M no 9.0 10.0 3.493 0.273 2.020 40.5 47.6 18.0 22B 69 M no 14.5 -10.0 3.562 0.305 2 .191 34.4 46.6 20.3 22C 76 M no - 1 1 .0 -10.0 5.465 0.475 4.033 46.7 47.9 18.8 22D 40 F drop 2.0 0.0 4.663 1.841 2.147 20.5 189.0 43.9 22E 77 F no 4.0 0.0 6.705 1.836 5.140 6 1 . l 237.6 50.6 22F 77 F no 3.5 -10.0 6.713 2.842 5.243 60.0 262.0 60.0 22G 73 M yes 1.0 -10.0 7.166 2.163 5.473 70.9 144.9 57.2 22H 85 M no 1.0 10.0 5.192 2.040 3.731 59.l 107.2 26.3 22! 68 M yes -2.0 10.0 8.481 2.404 6.241 58.6 177.0 65.6 22J 64 F yes -1.5 10.0 5.437 2.228 2.808 29.9 139.8 75.6 25A 70 M yes 15.0 0.0 9.810 6.713 4.022 63.6 183.3 5 1 .4 25B 70 M no 15.0 0.0 10.247 7. 170 4.155 57.2 1 9 1 .7 43.2 25C 60 M no 15.0 0.0 7.913 3.333 4.837 62.l 25D 60 M no 15.0 0.0 9.247 6.349 4.903 47.4 203.9 47.2 25E 57 M no 9.0 0.0 8.940 4.422 6.742 70.2 263.5 49.0 25F 57 M yes 1 1 .0 0.0 9.375 6.439 6.5 1 1 78.4 214.5 6 1 .9 25G 60 F no 15.5 0.0 3.903 0.379 3.180 14.9 50.5 15.7 25H 60 F no 13.0 0.0 4.876 0.559 3.655 31.3 89.4 2 1 . 5 25! 77 M yes 10.5 0.0 7.445 4.764 3.438 42.5 207.4 72.2 25J 77 M yes 9.5 0.0 8.577 6.030 4.328 47.4 278.8 36.l 26A 6 1 F yes 13.0 0.0 5.705 0.886 4.863 37.5 156.2 86.3 26B M no 10.0 0.0 9.937 1 .620 10.866 100.5 104.4 35.7 26C 75 M no 14.0 0.0 4.622 1 .391 3 . 131 37.3 175.0 36.5 26D M no 1 1 .0 0.0 4.802 1.355 4.377 3 1 . l 135.7 23.0 26E 64 M no -14.0 0.0 6.578 0.432 6.226 90.6 22.l 18.9 26F 48 M no -13.0 0.0 7.260 0.453 7.737 45. l 30.7 22.9 26G 64 M no -9.0 0.0 4.061 0.995 3.391 53.3 104.5 30.9 26H 48 M no -10.0 0.0 4.952 1 .230 4.404 27.5 100.7 26.0 261 73 M no -8.0 0.0 5.007 1 .234 4.788 3 1 .2 123.9 33. l 26J 73 M no -14.0 0.0 7.593 0.481 7.685 79.7 19.8 13.6
IRCOBI Conference - Hannover, September 1997 85

Appendix B - Injury Summary
Test Age gender Injury Description
1 10 89 F Closed complete fracture oftalar neck. Mild subtalar dislocation
20E 95 F Lateral ankle subluxation, bimalleolar fracture with displacement.
20I 80 M Closed complete oblique fracture of calcaneus from posterior side into subtalar joint.
201 80 M Closed complete comminuted fracture of calcaneus from posterior cortex into subtalar joint.
Transverse comminuted fractures oflateral malleolus and tibia plafond. 22D 40 F Anterior subluxation oftalus. Comminuted fracture ofcalcaneus into
subtalar joint.
22G 73 M Closed complete transverse fracture lateral malleolus. Total transverse tear of middle section of anterior tibi -fibular ligament.
22! 68 M Longitudinal split of mid-substance of peroneus brevis tendon, retinaculwn intact.
221 40 F pilon fracture. Severe ankle disruption.
25A 70 M Incomplete fracture of lateral process of talus.
4 cm longitudinal tear of middle of peroneus brevis tendon approximately 25F 57 M over lateral malleolus. Longitudinal tear ofmiddle tibiocalcaneal leaflet of
deltoid.
25! 77 M Fracture of calcaneus from posterior cortex into subtalar joint.
251 77 M Horizontal fracture of calcaneus.
26A 61 F Multiple comminuted fractures of calcaneus.
86 IRCOBI Conference - Hannover, September 1997