mechanisms of seizures and coma in hypoglycemia
TRANSCRIPT
Mechanisms of Seizures and Coma in Hypoglycemia
EVIDENCEFORA DIRECT EFFECTOF INSULIN
ON ELECTROLYTETRANSPORTIN BRAIN
ALLEN I. ARIEFF, TOMDOERNER,HARRYZELIG, and SHAULG. MASSRY
From the Medical and Research Services of the Wadsworth Veterans AdministrationHospital Center, Los Angeles, California 90073, the Research Medical Instituteand the Renal and Hypertension Service, Cedars-Sinai Medical Center, andthe Department of Medicine, Cedars-Sinai Medical Center and the University ofCalifornia, Los Angeles School of Medicine, Los Angeles, California 90048
A B S T R A C T The mechanisms involved in the pro-duction of hypoglycemic coma were studied in rabbits.Measurements were made in brain, cerebrospinal fluid(CSF), and plasma of osmolality, Na', K+, Cl1, watercontent, exogenous insulin, glucose, lactate, and glu-tamate, while pH, Pco2, Po2, and bicarbonate were eval-uated in arterial blood. 35 min after i.v. injection ofinsulin (50 U/kg), plasma glucose did not change,but brain K+ content increased significantly. Grand malseizures were observed in unanesthetized animals(+SD) 133±37 min after administration of insulin, ata time when brain glucose was normal, but brain tissuecontent of Na+, K+, osmoles, and water was signifi-cantly greater than normal. Coma supervened 212±54min after insulin injection, at which time brain glucose,lactate, and glutamate were significantly decreased. Atboth 35 and 146 min after insulin administration, ex-ogenous insulin was present in brain, but not in theCSF. After 208 min of insulin administration, animalswere given i.v. glucose and sacrificed 35 min later. Mostchanges in the brain produced by hypoglycemia werereversed by the administration of glucose. Hypoxia(Po2=23 mmHg) was produced and maintained for35 min in another group of animals. Hypoxia causedbrain edema but did not affect brain electrolyte content.
This study was presented in part at the 26th AnnualMeeting, Western Society for Clinical Research, Carmel,Calif., 3 February 1973, and at the 26th Annual Meeting,American Academy of Neurology, San Francisco, Calif.,27 April 1974. VA project No. 0508-02.
Dr. Arieff is a Clinical Investigator of the VeteransAdministration. Dr. Doerner and Dr. Zelig were recipientsof Summer Fellowships for Medical Students.
Received for publication 7 Decemnber 1973 and in revisedform 20 May 1974.
However, brain lactate concentration was significantlygreater than normal. The data indicate that the seizuresnoted early in the course of insulin-induced hypogly-cemia are temporally related to a rise in brain osmo-lality secondary to an increased net transport into brainof Na+ and K+, probably caused by insulin, per se. Ashypoglycemia persists, there is also a depletion ofenergy-supplying substrates (glucose, lactate, gluta-mate) in the brain, an event which coincides with theonset of coma. The brain edema observed during hy-poxia is largely due to an increase in brain osmolalitysecondary to accumulation of lactate.
INTRODUCTIONHypoglycemia may be associated with tremulousness,cold sweating, headache, and confusion. In addition, amultitude of neurological signs and symptoms, such asdelirium, hypothermia, brainstem dysfunction, stroke-like illness, and focal or generalized seizures may occur(1). Such neurological manifestations may progress tocoma and death (1). The symptoms of hypoglycemia, aswell as autopsy findings, suggest the presence of in-creased intracranial pressure, and it is possible thatcerebral edema may underlie many of the symptoms ofhypoglycemic coma. Since in both patients and experi-mental animals dying with hypoxia, the gross andmicroscopic findings in the brain are similar to thoseseen with hypoglycemia, it has been postulated that thepathophysiologic events underlying the symptomatologyand coma in these two conditions may be similar (1-4).It has been also suggested that with both hypoglycemiaand hypoxia, a decrease in cerebral oxygenation mightdisrupt cell membrane-bound Na'-K+ activated ATPase,
The Journal of Clinical Investigation Volume 54 September 1974*654-66365-4
with a net movement of Na+ into brain (4). This in-crement in brain Na+ would raise brain osmolalitvwhich in turn would cause movement of water intobrain, and hence cerebral edema would ensue.
Other studies have shown that hypoglycemia doesnot cause a significant fall in brain ATP or phospho-creatine (5, 6). Duff)-, Nelson. and Lowry (4), there-fore, postulated that hypoglycemic coma may resultfrom a lack of specific energy-supplying substrate, suchas glucose and its metabolites. Such metabolites mightinclude lactate and glutamate, which can probably serveas energy sources for the brain under hypoglycemicconditions (2, 7, 8).
Data from our laboratory have suggested that, inthe absence of h-pergl-cem-nia, insulin may directly en-hance transport of Na+ and K+ into brain (9). Such aneffect of insulin may be present during hypoglycemia,and it may lead to accumulation of these ions in brain,causing cerebral edema.
Although cerebral edema may be responsible for bothhypoglycemic and hypoxic coma, the events leading tobrain edema are probably complex and may be differentin these two pathological entities. The present stud-was undertaken to investigate the changes in brainwater and electrolyte metabolism that occur duringhypoglycemia and hypoxia in an effort to define themechanisms of the coma in these conditions.
METHODSStudies were performed in five groups of New Zealandwhite rabbits which were maintained on an ad libitumwater intake and Purina chow diet (Ralston Purina Co.,St. Louis, Mo.). The animals were fasted for 15 h beforeexperiments. Except for rabbits in group I, all animalswere studied under sodium pentobarbital anesthesia. Ven-tilation was maintained with a Harvard respirator (no. 661,Harvard Apparatus Co., Inc., Millis, Mass.) via a trache-ostomy tube. Tidal volume was based on the weight of theanimal (10), and minor adjustments were made throughoutthe experiment to maintain Pco2 around 35 mmHg at arespiratory rate of 25/min.
In preliminary experiments, it was found that after theintravenous injection of insulin, grand mal seizures wereobserved after 146 min, and the animals became unre-sponsive to noxious stimuli after 208 min. In addition,Zierler and Rabinowitz (11) had previously shown thatafter 35 min, insulin increased transport of K+ into skeletalmuscle without affecting plasma glucose. Thus, we electedto study changes in brain water and solute at 35, 146, and208 min after insulin administration.
Group I. 10 awake rabbits were given 50 U/kg of in-sulin (Iletin, Eli Lilly and Co., Indianapolis, l nd.) andwere observed for the appearance of seizure activity andcoma. Blood samples were obtained before the injection ofinsulin, at the time when seizures were first observed, andat the appearance of coma (unresponsiveness to noxiousstimuli).
Group II. 19 animals were given 50 U/kg of insulin andwere sacrificed after 35 min (6 rabbits), 146 min (7 rab-bits), and 208 min (6 rabbits).
Groutp III. Eight rabbits received 50 U/kg of insulin.After 208 min of insulin administration they were givenan intravenous injection of either 5 or 13 ml of 2.8 Mglucose solution. They were sacrificed 35 min later.
Group IV. 10 rabbits were treated in a similar manneras group II, but the insulin they received was a mixtureof regular and "25I-labeled insulin. Regular insulin wasmixed with "25I-labeled insulin (Imusay, Abbott Labora-tories, North Chicago, Ill., 250 juCi/ml) to attain a con-centration of 50 U regular insulin/ml and 1 ,uCi/2 U in-sulin. The animals were sacrificed at 35 and 146 min afterthe administration of insulin mixture. Blood, and cerebro-spinal fluid (CSF) 1 samples were obtained at the timeof sacrifice, and the simultaneous levels of exogenous in-sulin were determined in plasma, CSF, and brain.
Group V. Eight animals were made hypoxic by havingthem breath a mixture of 5% 02-95% N2 via a tracheostomytube. The arterial Po2 was maintained at about 23 mmHgfor 35 min, and anima's were then sacrificed.
At the beginning of experiments, 50 /Ci of 35SQ04 (NewEngland Nuclear, Boston, Mass., sp act 825 mCi/mmol)was given intravenously, and 10 min before the conclusionof each experiment in groups II, IV, and V, the animalswere given 25 juCi of 1251-labeled albumin intravenously(E. R. Squibb & Sons, New York). In animals of group I,onlv plasma glucose was measured. In all other groups,measurements were made in plasma, CSF, and brain ofNa+, K+, Cl-, lactate, glucose, glutamate, osmolality, andexogenous insulin. In addition, the pH, Pco2, Po2, and hi-carbonate were determined in arterial blood and the [I1I ] -
albumin space, extracellular space (ECS ), water content,and inorganic sulfate (:'SO::) space (relative to plasma)were measured in brain. \When 'S-labeled sulfate ( 5SO4=)is given intravenously, about 5-10%c is incorporated intobrain tissue proteins or other macromolecules (12). How-ever, we have previously shown that deproteinization ofbrain tissue (or plasma) precipitates the bound sulfate,but does not precipitate free sulfate (13). Thus, when brainand plasma have been deproteinized, the ratio of brain['sSO4=] (cpm/g)/plasma ['SO,:] (cpm/g) gives a repre-sentative value for the distribution of inorganic sulfate inbrain relative to plasma.
The skull was opened with a trephine and rongeur, sam-ples of CSF were obtained, and the brain was then re-moved as previously described (9). The cerebral hemi-spheres were separated from the rest of the brain andimmersed in a Dewar flask filled with liquid nitrogen. Theelapsed time from removal of the brain to its immersion inliquid nitrogen was less than 8 s in all cases. The cerebralhemispheres were then pulverized to a powder while underliquid nitrogen. Three samples, each about 0.4 g, were placedin conical glass flasks, weighed, dried in an oven at 1000Cfor 48 h, and then reweighed in order to determine watercontent. These samples were then extracted for 24 h in0.75 N HNO3, and the supernate was used for the measure-ment of Na+, K+ and Cl- (14). Three additional 0.4-gsamples were extracted in cold 185 mMtrichloroacetic acid(TCA) and the supernate used for the determination oflactate, f ree glucose, glutamate, and 35Q4= activity (13,15-17). The methods were modified for use with tissueextracts. These modifications, along with appropriate re-covery experiments, have previously been described (9).Two unprocessed 0.2-g tissue samples were used for thedetermination of "2I activity (13).
' Abbreviationis used in this paper: CSF, cerebrospinalfluid; ECS, extracellular space; TCA, trichloroacetic acid.
Hypoglycemic Coma 655)
Five additional 0.3-g samples were extracted in boilingdistilled water and used for the determination of brain tissueosmolality. The previously described method for brain os-molality determination (18) has been further evaluated innormal, uremic, and hemodialyzed dogs (19) and in hyper-glycemic rabbits (9). Additionally, a comparison was madeof the simultaneously measured osmolalities of brain tissueand CSF in six groups of rabbits subjected to various ex-perimental manipulations, who had been in a steady statefor at least 2 h.
The brain ECS was evaluated as the Cl- space relative tocisternal CSF (20), correcting for the brain intracellularCl- content (21). The brain intracellular concentration andcontent of glucose, Na+, and K+ were calculated relative tothe concentrations of these substances in cisternal CSF(20) by using the corrected Cl- space as being representa-tive of the brain ECS (21).
Exogenous ('I) insulin was determined in plasma, CSF,and brain of group IV animals in the following manner.Three preweighed samples of CSF, plasma, brain, andlabeled insulin were counted in an automatic gammacounter(Nuclear Chicago Corp., Des Plaines, Ill.) both beforeand after extraction with 185 mMTCA. The results of allof the above were converted into disintegrations per minuteper gram of either plasma, CSF, or brain. The TCA-ex-tractable fraction was assumed to represent insulin metab-olites (22) and was subtracted from the activity of theunprocessed samples to obtain the radioactivity which wasactually due to insulin. The radioactivity which was ex-tracted by TCA from the labeled insulin was found to be
12 -
440
420E 44
.21 400>a 270 -i
O-0 -
$ 230200 -
o 1280 -
160
Plasma
Brain
- V~~~~~~-
0 35 146 208Minutes after Insulin
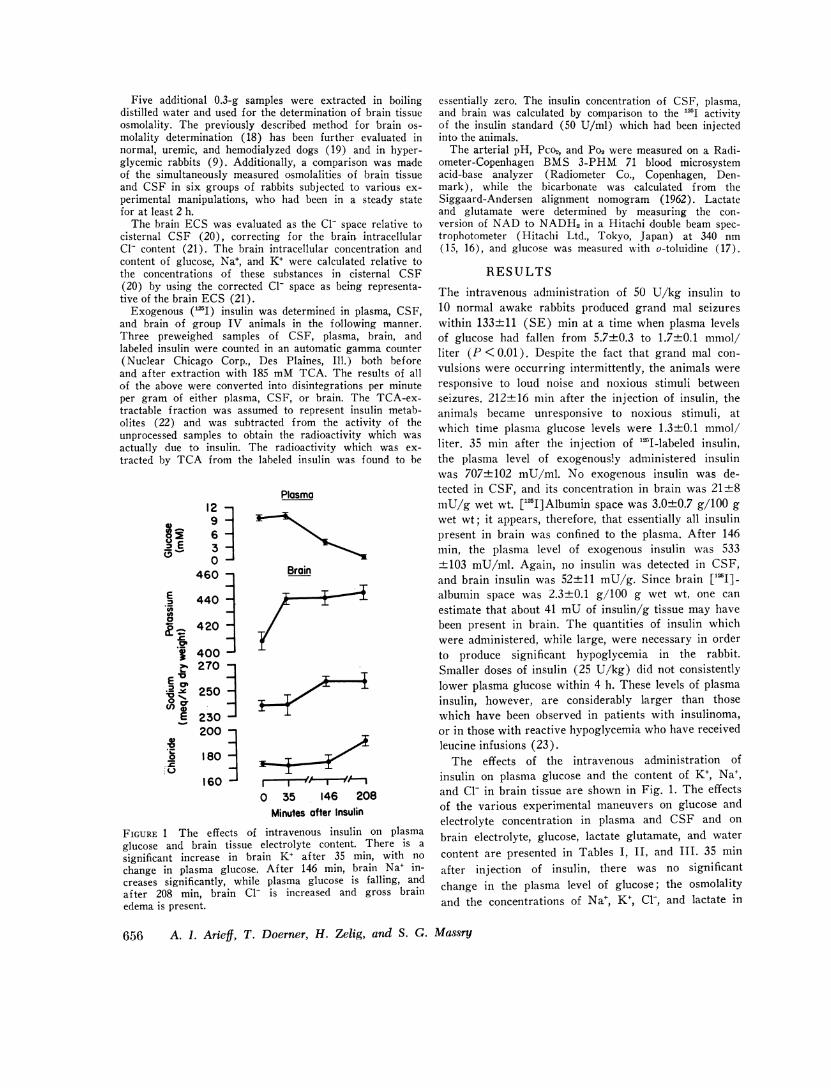
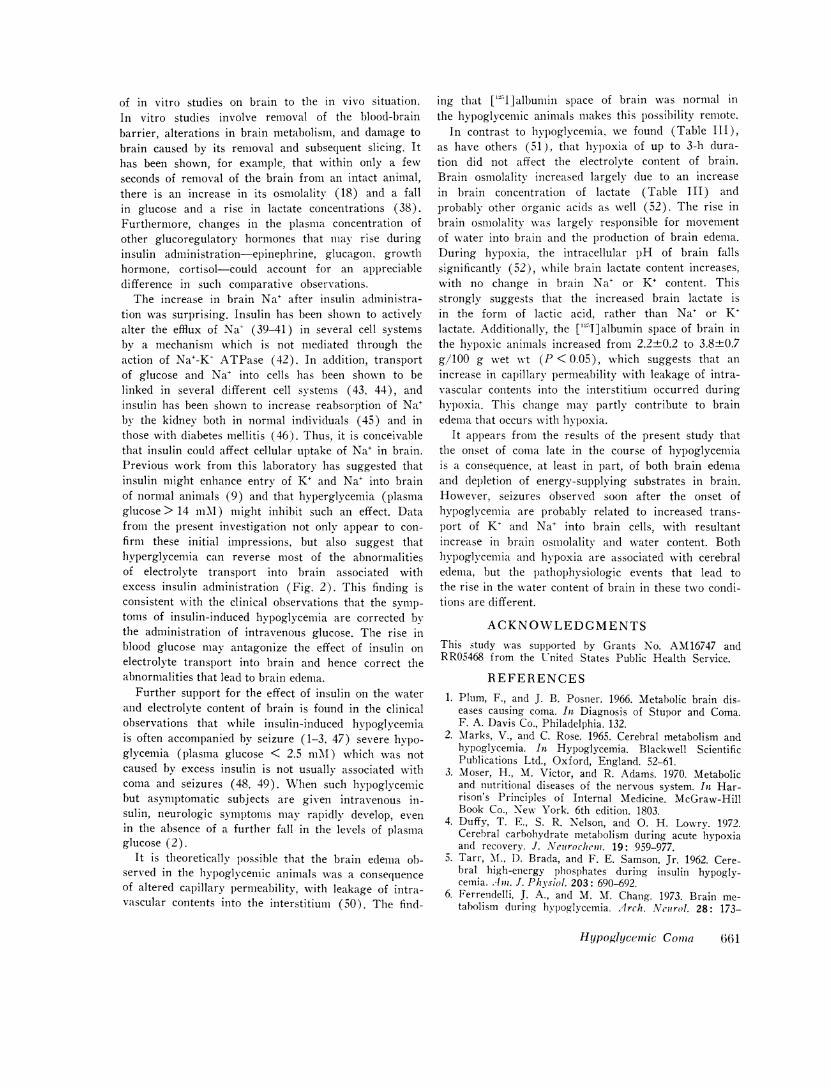
FIGURE 1 The effects of intravenous insulin on plasmaglucose and brain tissue electrolyte content. There is a
significant increase in brain K+ af ter 35 min, with nochange in plasma glucose. After 146 min, brain Na+ in-creases significantly, while plasma glucose is falling, andafter 208 min, brain Cl- is increased and gross brainedema is present.
essentially zero. The insulin concentration of CSF, plasma,and brain was calculated by comparison to the 'I activityof the insulin standard (50 U/ml) which had been injectedinto the animals.
The arterial pH, Pco2, and Po2 were measured on a Radi-ometer-Copenhagen BMS 3-PHM 71 blood microsystemacid-base analyzer (Radiometer Co., Copenhagen, Den-mark), while the bicarbonate was calculated from theSiggaard-Andersen alignment nomogram (1962). Lactateand glutamate were determined by measuring the con-version of NAD to NADH2in a Hitachi double beam spec-trophotometer (Hitachi Ltd., Tokyo, Japan) at 340 nm(15, 16), and glucose was measured with o-toluidine (17).
RESULTS
The intravenous administration of 50 U/kg insulin to10 normal awake rabbits produced grand mal seizureswithin 133±11 (SE) min at a time when plasma levelsof glucose had fallen from 5.7±0.3 to 1.7±0.1 mmol/liter (P <0.01). Despite the fact that grand mal con-vulsions were occurring intermittently, the animals wereresponsive to loud noise and noxious stimuli betweenseizures. 212±416 min after the injection of insulin, theanimals became unresponsive to noxious stimuli, atwhich time plasma glucose levels were 1.3±0.1 mmol/liter. 35 min after the injection of "I-labeled insulin,the plasma level of exogenously administered insulinwas 707±+102 mU/ml. No exogenous insulin was de-tected in CSF, and its concentration in brain was 21±8mU/g wet wt. ["I]Albumin space was 3.0±0.7 g/100 gwet wt; it appears, therefore, that essentially all insulinpresent in brain was confined to the plasma. After 146min, the plasma level of exogenous insulin was 533±103 mU/ml. Again, no insulin was detected in CSF,and brain insulin was 52±11 mU/g. Since brain ['I]-albumin space was 2.3±0.1 g/100 g wet wt, one canestimate that about 41 mUof insulin/g tissue may havebeen present in brain. The quantities of insulin whichwere administered, while large, were necessary in orderto produce significant hypoglycemia in the rabbit.Smaller doses of insulin (25 U/kg) did not consistentlylower plasma glucose within 4 h. These levels of plasmainsulin, however, are considerably larger than thosewhich have been observed in patients with insulinoma,or in those with reactive hypoglycemia who have receivedleucine infusions (23).
The effects of the intravenous administration ofinsulin on plasma glucose and the content of K+, Na+,and Cl- in brain tissue are shown in Fig. 1. The effectsof the various experimental maneuvers on glucose andelectrolyte concentration in plasma and CSF and on
brain electrolyte, glucose, lactate glutamate, and water
content are presented in Tables I, II, and III. 35 minafter injection of insulin, there was no significantchange in the plasma level of glucose; the osmolalityand the concentrations of Na+, K+, Cl-, and lactate in
656 A. i. Arieff, T. Doerner, H. Zelig, and S. G. Massry
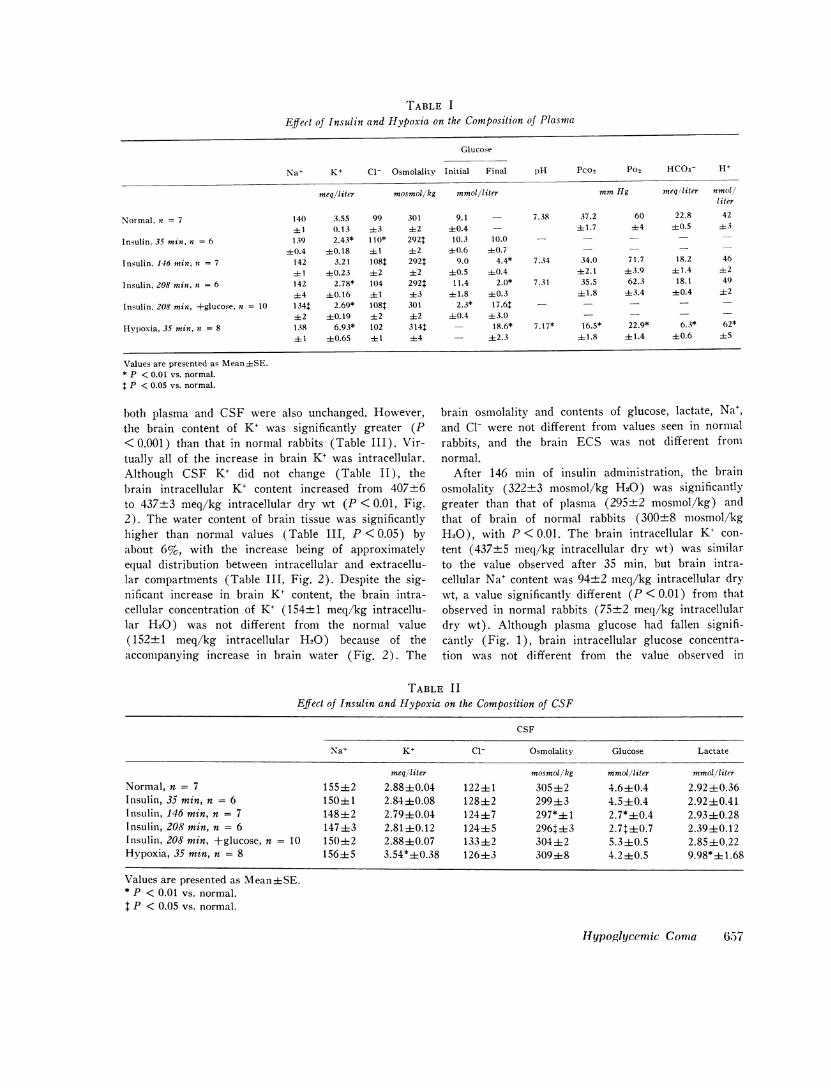
TABLE I
Effect of Insulin and Hypoxia on the Composition of Plasma
Glucose
Na+ K+ Cl- Osmolality Initial Final pH Pco2 Po2 HCO3- H+
meq/liter mosmol/kg mmol/liter mmHg meq/liter nmol/liter
Normal, it = 7 140 3.55 99 301 9.1 - 7.38 37.2 60 22.8 4241 0.13 43 +2 +0.4 - 41.7 +4 40.5 43
Insulin, 35 min, n = 6 139 2.43* 110* 292$ 10.3 10.0 - -
+0.4 +0.18 i+1 +2 -+0.6 +0.7 - - -
Insulin, 146 min, it = 7 142 3.21 108: 2921 9.0 4.4* 7.34 34.0 71.7 18.2 46+t 1 +t0.23 +2 +2 40.5 +-0.4 +2.1 +43.9 +t 1.4 +2
Insulin, 208 min, n = 6 142 2.78* 104 2921 11.4 2.0* 7.31 35.5 62.3 18.1 49-+4 +0.16 + 1 +3 +41.8 +0.3 + 1.8 +3.4 +0.4 +2
Insulin, 208 min, +glucose, n = 10 134+ 2.69* 108++ 301 2.3* 17.64: - - - - -+2 +0.19 +2 +2 +0.4 +3.0 - - - -
HypI)oxia, 35 min, n = 8 138 6.93* 102 314+ - 18.6* 7.17* 16.5* 22.9* 6.3* 62*+ 1 +0.65 + 1 +4 - +2.3 + 1.8 +41.4 +0.6 +5
Values are presented as Mean+SE.* P < 0.01 vs. normal.$ P < 0.05 vs. normal.
both plasma and CSF were also unchanged. However, brain osmolality and contents of glucose, lactate, Na+,the brain content of K+ was significantly greater (P and Cl- were not different from values seen in normal<0.001) than that in normal rabbits (Table III). Vir- rabbits, and the brain ECS was not different fromtually all of the increase in brain K+ was intracellular. normal.Although CSF K+ did not change (Table II), the After 146 min of insulin administration, the brainbrain intracellular K+ content increased from 407±6 osmolality (322+3 mosmol/kg H20) was significantlyto 437+3 meq/kg intracellular dry wt (P < 0.01, Fig. greater than that of plasma (295±2 mosmol/kg) and2). The water content of brain tissue was significantly that of brain of normal rabbits (300±8 mosmol/kghigher than normal values (Table III, P < 0.05) by H20), with P < 0.01. The brain intracellular K+ con-about 6%, with the increase being of approximately tent (437+5 meq/kg intracellular dry wt) was similarequal distribution between intracellular and extracellu- to the value observed after 35 min, but brain intra-lar compartments (Table III, Fig. 2). Despite the sig- cellular Na+ content was 94+2 meq/kg intracellular drynificant increase in brain K+ content, the brain intra- wt, a value significantly different (P<0.01) from thatcellular concentration of K+ (154±1 meq/kg intracellu- observed in normal rabbits (75+2 meq/kg intracellularlar H20) was not different from the normal value dry wt). Although plasma glucose had fallen signifi-(152±1 meq/kg intracellular H20) because of the cantly (Fig. 1), brain intracellular glucose concentra-accompanying increase in brain water (Fig. 2). The tion was not different from the value observed in
TABLE IIEffect of Insulin and Hypoxia on the Composition of CSF
CSF
Na+ K+ Cl- Osmolality Glucose Lactate
meq/liter mosmol/kg mmol/liter mmol/literNormal, n = 7 155±2 2.88±0.04 122i1 305±2 4.6±0.4 2.92i0.36Insulin, 35 min, n = 6 150±1 2.84+0.08 128±2 299±3 4.5±0.4 2.92±0.41Insulin, 146 min, n = 7 148±2 2.79+0.04 124±7 297*±1 2.7*±0.4 2.93±0.28Insulin, 208 min, n = 6 147±3 2.81±0.12 124±5 296t±3 2.7t±0.7 2.39i0.12Insulin, 208 min, +glucose, n = 10 150±2 2.88±0.07 133±2 304±2 5.3±0.5 2.85±0.22Hypoxia, 35 min, n = 8 156±5 3.54*±0.38 126+3 309±fi8 4.2±0.5 9.98*±1.68
Values are presented as Mean±SE.*P <0.01 vs. normal.t P < 0.05 vs. normal.
Hypoglycemic Coma 657
BRAIN
2o
.0~E°Z 1~E m
4501
X 425
E 0
400
300
4501. 285
s 0
C2
270~
GLUCOSEIC
comaseizures
Minutes after Insulin.............. i;v. glucose
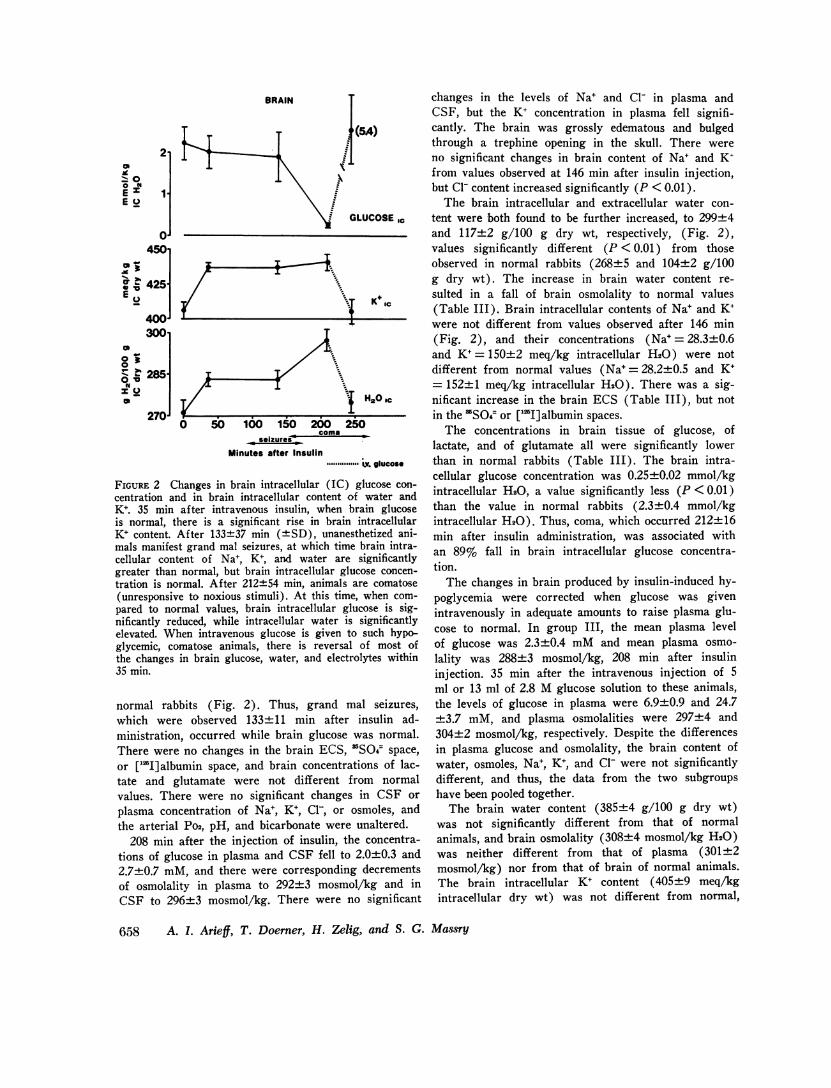
FIGURE 2 Changes in brain intracellular (IC) glucose con-centration and in brain intracellular content of water andK+. 35 min after intravenous insulin, when brain glucoseis normal, there is a significant rise in brain intracellularK+ content. After 133+37 min (+SD), unanesthetized ani-mals manifest grand mal seizures, at which time brain intra-cellular content of Na+, K+, and water are significantlygreater than normal, but brain intracellular glucose concen-tration is normal. After 212±54 min, animals are comatose(unresponsive to noxious stimuli). At this time, when com-pared to normal values, brain intracellular glucose is sig-nificantly reduced, while intracellular water is significantlyelevated. When intravenous glucose is given to such hypo-glycemic, comatose animals, there is reversal of most ofthe changes in brain glucose, water, and electrolytes within35 min.
normal rabbits (Fig. 2). Thus, grand mal seizures,which were observed 133±11 min after insulin ad-ministration, occurred while brain glucose was normal.There were no changes in the brain ECS, SO4~space,or ['lI]albumin space, and brain concentrations of lac-tate and glutamate were not different from normalvalues. There were no significant changes in CSF orplasma concentration of Na+, K+, Cl-, or osmoles, andthe arterial Po2, pH, and bicarbonate were unaltered.
208 min after the injection of insulin, the concentra-tions of glucose in plasma and CSF fell to 2.0±0.3 and2.7±0.7 mM, and there were corresponding decrementsof osmolality in plasma to 292±3 mosmol/kg and inCSF to 296±3 mosmol/kg. There were no significant
changes in the levels of Na+ and Cl1 in plasma andCSF, but the K+ concentration in plasma fell signifi-cantly. The brain was grossly edematous and bulgedthrough a trephine opening in the skull. There wereno significant changes in brain content of Na+ and K+from values observed at 146 min after insulin injection,but Cl- content increased significantly (P < 0.01).
The brain intracellular and extracellular water con-tent were both found to be further increased, to 299±4and 117±2 g/100 g dry wt, respectively, (Fig. 2),values significantly different (P < 0.01) from thoseobserved in normal rabbits (268±5 and 104±2 g/100g dry wt). The increase in brain water content re-sulted in a fall of brain osmolality to normal values(Table III). Brain intracellular contents of Na+ and K+were not different from values observed after 146 min(Fig. 2), and their concentrations (Na+ = 28.3+0.6and K+= 150+2 meq/kg intracellular H20) were notdifferent from normal values (Na+=28.2±0.5 and K+= 152±+1 meq/kg intracellular H20). There was a sig-nificant increase in the brain ECS (Table III), but notin the 'SO4= or ['I]albumin spaces.
The concentrations in brain tissue of glucose, oflactate, and of glutamate all were significantly lowerthan in normal rabbits (Table III). The brain intra-cellular glucose concentration was 0.25+0.02 mmol/kgintracellular H20, a value significantly less (P < 0.01)than the value in normal rabbits (2.3±0.4 mmol/kgintracellular H20). Thus, coma, which occurred 212±+16min after insulin administration, was associated withan 89% fall in brain intracellular glucose concentra-tion.
The changes in brain produced by insulin-induced hy-poglycemia were corrected when glucose was givenintravenously in adequate amounts to raise plasma glu-cose to normal. In group III, the mean plasma levelof glucose was 2.3±0.4 mMand mean plasma osmo-lality was 288±3 mosmol/kg, 208 min after insulininjection. 35 min after the intravenous injection of 5ml or 13 ml of 2.8 M glucose solution to these animals,the levels of glucose in plasma were 6.9±0.9 and 24.7±3.7 mM, and plasma osmolalities were 297±4 and304+2 mosmol/kg, respectively. Despite the differencesin plasma glucose and osmolality, the brain content ofwater, osmoles, Na+, K+, and Cl- were not significantlydifferent, and thus, the data from the two subgroupshave been pooled together.
The brain water content (385±4 g/100 g dry wt)was not significantly different from that of normalanimals, and brain osmolality (308±4 mosmol/kg H20)was neither different from that of plasma (301+±2mosmol/kg) nor from that of brain of normal animals.The brain intracellular K+ content (405±9 meq/kgintracellular dry wt) was not different from normal,
658 A. 1. Arieff, T. Doerner, H. Zelig, and S. G. Massry
4ll-. 0 .1
.1I
XI
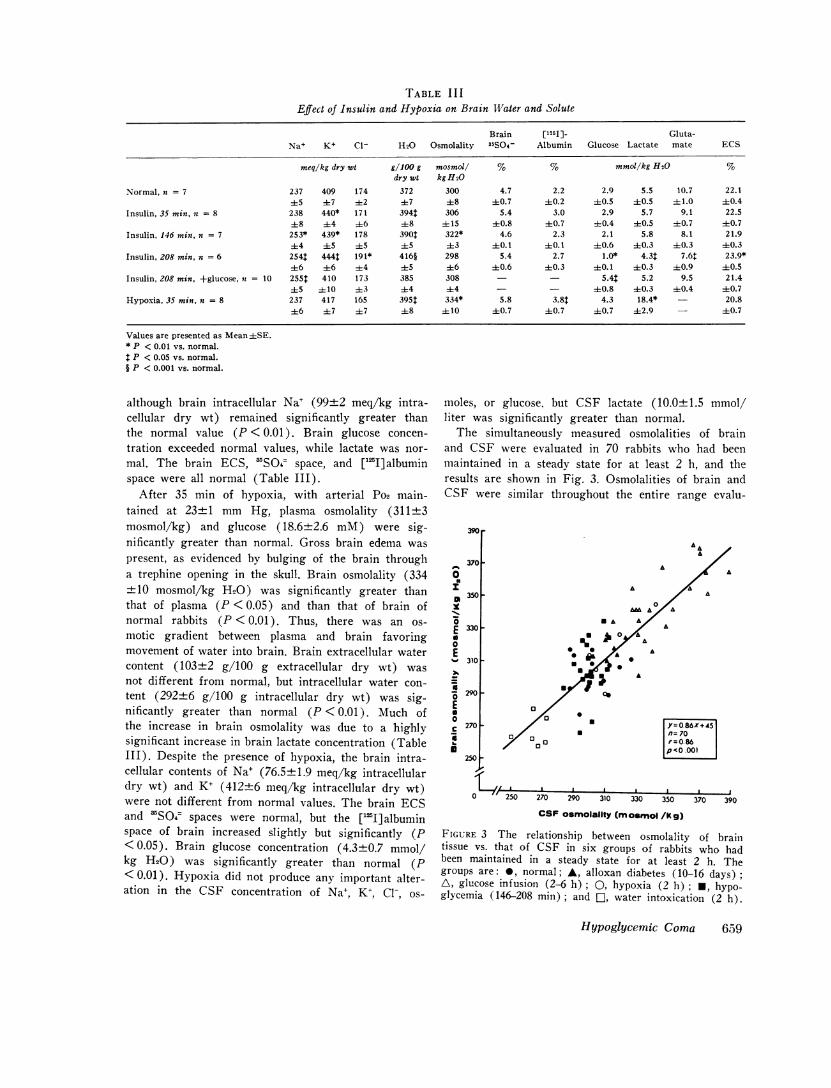
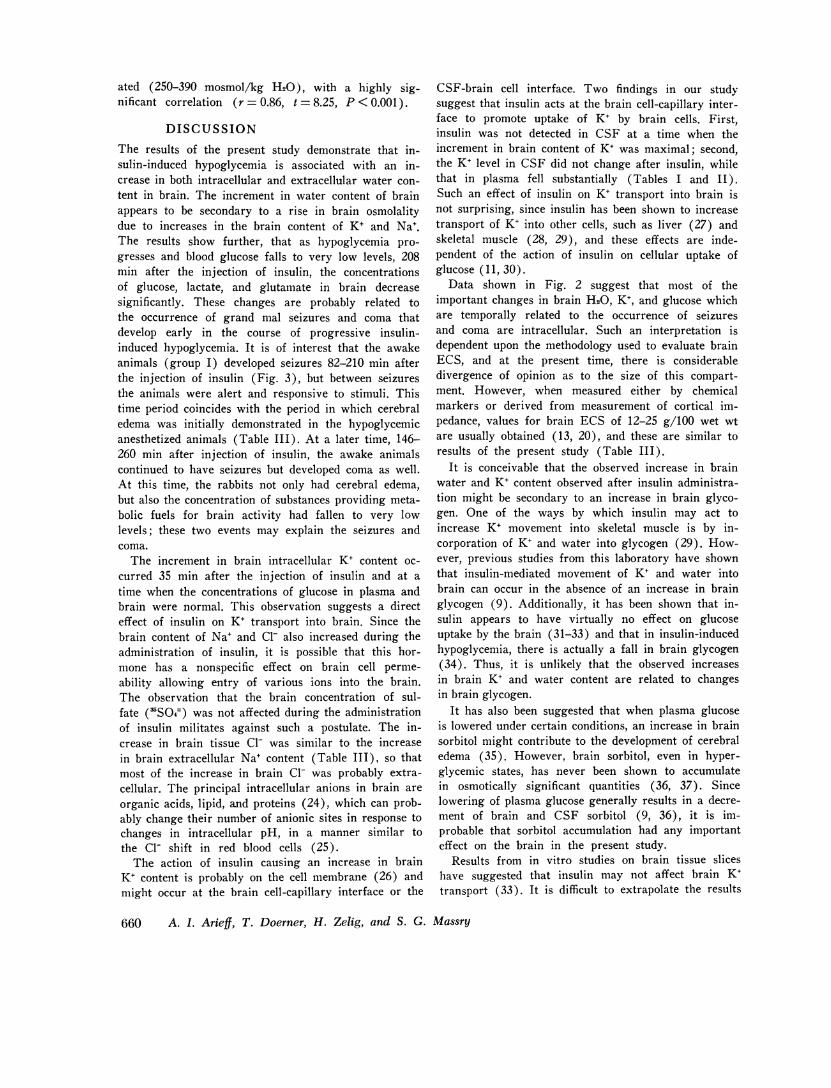
TABLE IIIEffect of Insulin and Hypoxia on Brain Water and Solute
Brain [1251] Gluta-Na+ K+ C1- H20 Osmolality 35S04- Albumin Glucose Lactate mate ECS
meq/kg dry wt g/100 g mosmol/ % % mmoi/kg H20 %dry wt kg H20
Normal, n = 7 237 409 174 372 300 4.7 2.2 2.9 5.5 10.7 22.145 ±7 ±2 ±7 48 ±0.7 ±0.2 ±0.5 40.5 ±1.0 ±0.4
Insulin, 35 min, = 8 238 440* 171 394t 306 5.4 3.0 2.9 5.7 9.1 22.5±8 ±4 +6 48 ± 15 ±0.8 ±0.7 ±0.4 40.5 ±0.7 ±0.7
Insulin, 146 min. n = 7 253* 439* 178 390t 322* 4.6 2.3 2.1 5.8 8.1 21.9±4 ±5 ±5 ±5 ±3 ±0. 1 ±0. 1 ±0.6 40.3 ±0.3 ±0.3
Insulin, 208 min, n = 6 2541 4441 191* 416§ 298 5.4 2.7 1.0* 4.3$ 7.6$ 23.9*±6 ±6 ±4 45 ±6 +0.6 ±0.3 ±0.1 ±0.3 ±0.9 40.5
Insulin, 208 min, +glucose, a = 10 2551 410 173 385 308 - - 5.4$ 5.2 9.5 21.4±5 ± 10 43 ±4 44 - - ±0.8 ±0.3 ±0.4 40.7
Hypoxia, 35 min. n = 8 237 417 165 395$ 334* 5.8 3.8$ 4.3 18.4* - 20.8±6 ±7 47 ±8 ± 10 ±+0.7 ±0.7 40.7 ±2.9 - ±0.7
Values are presented as Mean±SE.* P < 0.01 vs. normal.
P < 0.05 vs. normal.§ P < 0.001 vs. normal.
although brain intracellular Na+ (99±2 meq/kg intra-cellular dry wt) remained significantly greater thanthe normal value (P < 0.01). Brain glucose concen-tration exceeded normal values, while lactate was nor-mal. The brain ECS, 'SO4 space, and ['JI]albuminspace were all normal (Table III).
After 35 min of hypoxia, with arterial Po2 main-tained at 23±1 mm Hg, plasma osmolality (311+3mosmol/kg) and glucose (18.6±2.6 mM) were sig-nificantly greater than normal. Gross brain edema waspresent, as evidenced by bulging of the brain througha trephine opening in the skull. Brain osmolality (334±10 mosmol/kg H20) was significantly greater thanthat of plasma (P < 0.05) and than that of brain ofnormal rabbits (P < 0.01). Thus, there was an os-motic gradient between plasma and brain favoringmovement of water into brain. Brain extracellular watercontent (103±2 g/100 g extracellular dry wt) wasnot different from normal, but intracellular water con-tent (292±6 g/100 g intracellular dry wt) was sig-nificantly greater than normal (P < 0.01). Much ofthe increase in brain osmolality was due to a highlysignificant increase in brain lactate concentration (TableIII). Despite the presence of hypoxia, the brain intra-cellular contents of Na+ (76.5±1.9 meq/kg intracellulardry wt) and K+ (412±6 meq/kg intracellular dry wt)were not different from normal values. The brain ECSand 3SO4 spaces were normal, but the ["IJ] albuminspace of brain increased slightly but significantly (P< 0.05). Brain glucose concentration (4.3±0.7 mmol/kg H20) was significantly greater than normal (P<0.01). Hypoxia did not produce any important alter-ation in the CSF concentration of Na+, K+, Cl-, os-
moles, or glucose, but CSF lactate (10.0±1.5 mmol/liter was significantly greater than normal.
The simultaneously measured osmolalities of brainand CSF were evaluated in 70 rabbits who had beenmaintained in a steady state for at least 2 h, and theresults are shown in Fig. 3. Osmolalities of brain andCSF were similar throughout the entire range evalu-
390r
0ElIx
-
Ea0E
Ea0ciU
A370 F A
A
3501-
330 F
00a3101F
A
0A
29010
a270 -
0 o
250 2
,=0 86X+45n= 70,=0.860'<0 .001
I . a. I .
270 290 310 330 350 370 390
CSF osmolallty (m osmol /kg)
FIGURE 3 The relationship between osmolality of braintissue vs. that of CSF in six groups of rabbits who hadbeen maintained in a steady state for at least 2 h. Thegroups are: *, normal; A, alloxan diabetes (10-16 days);A, glucose infusion (2-6 h); 0, hypoxia (2 h); *, hypo-glycemia (146-208 min) ; and E], water intoxication (2 h).
Hypoglycemic Coma 659
ated (250-390 mosmol/kg H20), with a highly sig-nificant correlation (r = 0.86, t = 8.25, P < 0.001).
DISCUSSION
The results of the present study demonstrate that in-sulin-induced hypoglycemia is associated with an in-crease in both intracellular and extracellular water con-tent in brain. The increment in water content of brainappears to be secondary to a rise in brain osmolalitydue to increases in the brain content of K+ and Na'.The results show further, that as hypoglycemia pro-gresses and blood glucose falls to very low levels, 208min after the injection of insulin, the concentrationsof glucose, lactate, and glutamate in brain decreasesignificantly. These changes are probably related tothe occurrence of grand mal seizures and coma thatdevelop early in the course of progressive insulin-induced hypoglycemia. It is of interest that the awakeanimals (group I) developed seizures 82-210 min afterthe injection of insulin (Fig. 3), but between seizuresthe animals were alert and responsive to stimuli. Thistime period coincides with the period in which cerebraledema was initially demonstrated in the hypoglycemicanesthetized animals (Table III). At a later time, 146-260 min after injection of insulin, the awake animalscontinued to have seizures but developed coma as well.At this time, the rabbits not only had cerebral edema,but also the concentration of substances providing meta-bolic fuels for brain activity had fallen to very lowlevels; these two events may explain the seizures andcoma.
The increment in brain intracellular K+ content oc-curred 35 min after the injection of insulin and at atime when the concentrations of glucose in plasma andbrain were normal. This observation suggests a directeffect of insulin on K+ transport into brain. Since thebrain content of Na+ and Cl- also increased during theadministration of insulin, it is possible that this hor-mone has a nonspecific effect on brain cell perme-ability allowing entry of various ions into the brain.The observation that the brain concentration of sul-fate ('SO4=) was not affected during the administrationof insulin militates against such a postulate. The in-crease in brain tissue Cl- was similar to the increasein brain extracellular Na+ content (Table III), so thatmost of the increase in brain Cl- was probably extra-cellular. The principal intracellular anions in brain areorganic acids, lipid, and proteins (24), which can prob-ably change their number of anionic sites in response tochanges in intracellular pH, in a manner similar tothe Cl- shift in red blood cells (25).
The action of insulin causing an increase in brainK+ content is probably on the cell membrane (26) andmight occur at the brain cell-capillary interface or the
CSF-brain cell interface. Two findings in our studysuggest that insulin acts at the brain cell-capillary inter-face to promote uptake of K+ by brain cells. First,insulin was not detected in CSF at a time when theincrement in brain content of K+ was maximal; second,the K+ level in CSF did not change after insulin, whilethat in plasma fell substantially (Tables I and II).Such an effect of insulin on K+ transport into brain isnot surprising, since insulin has been shown to increasetransport of K+ into other cells, such as liver (27) andskeletal muscle (28, 29), and these effects are inde-pendent of the action of insulin on cellular uptake ofglucose (11, 30).
Data shown in Fig. 2 suggest that most of theimportant changes in brain H20, K+, and glucose whichare temporally related to the occurrence of seizuresand coma are intracellular. Such an interpretation isdependent upon the methodology used to evaluate brainECS, and at the present time, there is considerabledivergence of opinion as to the size of this compart-ment. However, when measured either by chemicalmarkers or derived from measurement of cortical im-pedance, values for brain ECS of 12-25 g/100 wet wtare usually obtained (13, 20), and these are similar toresults of the present study (Table III).
It is conceivable that the observed increase in brainwater and K+ content observed after insulin administra-tion might be secondary to an increase in brain glyco-gen. One of the ways by which insulin may act toincrease K+ movement into skeletal muscle is by in-corporation of K+ and water into glycogen (29). How-ever, previous studies from this laboratory have shownthat insulin-mediated movement of K+ and water intobrain can occur in the absence of an increase in brainglycogen (9). Additionally, it has been shown that in-sulin appears to have virtually no effect on glucoseuptake by the brain (31-33) and that in insulin-inducedhypoglycemia, there is actually a fall in brain glycogen(34). Thus, it is unlikely that the observed increasesin brain K+ and water content are related to changesin brain glycogen.
It has also been suggested that when plasma glucoseis lowered under certain conditions, an increase in brainsorbitol might contribute to the development of cerebraledema (35). However, brain sorbitol, even in hyper-glycemic states, has never been shown to accumulatein osmotically significant quantities (36, 37). Sincelowering of plasma glucose generally results in a decre-ment of brain and CSF sorbitol (9, 36), it is im-probable that sorbitol accumulation had any importanteffect on the brain in the present study.
Results from in vitro studies on brain tissue sliceshave suggested that insulin may not affect brain K+transport (33). It is difficult to extrapolate the results
660 A. I. Arieff, T. Doerner, H. Zelig, and S. G. Massry
of in vitro studies on brain to the in vivo situation.In vitro studies involve removal of the blood-brainbarrier, alterations in brain metabolism, and damage tobrain caused by its removal and subsequent slicing. Ithas been shown, for example, that within only a fewseconds of removal of the brain from an intact animal,there is an increase in its osmolality (18) and a fallin glucose and a rise in lactate concentrations (38).Furthermore, changes in the plasma concentration ofother glucoregulatory hormones that may rise duringinsulin administration-epinephrine, glucagon, growthhormone, cortisol-could account for an appreciabledifference in such comparative observations.
The increase in brain Na+ after insulin administra-tion was surprising. Insulin has been shown to activelyalter the efflux of Na' (39-41) in several cell systemsby a mechanism which is not mediated through theaction of Na'-K' ATPase (42). In addition, transportof glucose and Na+ into cells has been shown to belinked in several different cell systems (43. 44), andinsulin has been shown to increase reabsorption of Na'by the kidney both in normal individuals (45) and inthose with diabetes mellitis (46). Thus, it is conceivablethat insulin could affect cellular uptake of Na+ in brain.Previous work from this laboratory has suggested thatinsulin might enhance entry of K+ and Na+ into brainof normal animals (9) and that hyperglycemia (plasmaglucose> 14 mAI) might inhibit such an effect. Datafrom the present investigation not only appear to con-firm these initial impressions, but also suggest thathyperglycemia can reverse most of the abnormalitiesof electrolyte transport into brain associated withexcess insulin administration (Fig. 2). This finding isconsistent with the clinical observations that the symp-toms of insulin-induced hypoglycemia are corrected bythe administration of intravenous glucose. The rise inblood glucose may antagonize the effect of insulin onelectrolyte transport into brain and hence correct theabnormalities that lead to brain edema.
Further support for the effect of insulin on the waterand electrolyte content of brain is found in the clinicalobservations that while insulin-induced hypoglycemiais often accompanied by seizure (1-3, 47) severe hvpo-glycemia (plasma glucose < 2.5 mniM) which was notcaused by excess insulin is not usually associated withcoma and seizures (48, 49). Whlien such hVpoglycemiicbut asymptomatic subjects are given intravenous in-sulin, neurologic symptoms may rapidly develop, evenin the absence of a further fall in the levels of plasmaglucose (2).
It is theoretically possible that the brain edema ob-served in the hypoglycemic animals was a consequenceof altered capillary permeability, with leakage of intra-vascular contents into the interstitium (50). The find-
ing that ['21 ]albumin space of brain was normal inthe hypoglycemic animals makes this possibility remote.
In contrast to hypoglycemia, we found (Table III),as have others (51), that hypoxia of up to 3-h dura-tion did not affect the electrolyte content of brain.Brain osmolalitv increased largely due to an increasein brain concentration of lactate (Table III) andprobably other organic acids as well (52). The rise inbrain osmolalitv was largely responsible for movementof water into brain and the production of brain edema.During hypoxia, the intracellular pH of brain fallssignificantly (52), while brain lactate content increases,with no change in brain Na+ or K+ content. Thisstrongly suggests that the increased brain lactate isin the form of lactic acid, rather than Na' or K+lactate. Additionally, the ['I]albumin space of brain inthe hypoxic animals increased from 2.2±0.2 to 3.8±0.7g/100 g wet wt (P < 0.05), which suggests that an
increase in capillary permeability with leakage of intra-vascular contents into the interstitium occurred duringhypoxia. This change may partly contribute to brainedema that occurs with hypoxia.
It appears from the results of the present study thatthe onset of coma late in the course of hypoglycemiais a consequence, at least in part, of both brain edemaand depletion of energy-supplying substrates in brain.However, seizures observed soon after the onset ofhypoglycemia are probably related to increased trans-port of K+ and Na' into brain cells, with resultantincrease in brain osmolality and water content. Bothhypoglycemnia and hypoxia are associated with cerebraledema, but the pathophysiologic events that lead tothe rise in the water content of brain in these two condi-tions are different.
ACKNOWLEDGMENTSThis study was supported by Grants No. AM16747 andRR05468 from the United States Public Health Service.
REFERENCES1. Plum, F., and J. B. Posner. 1966. Metabolic brain dis-
eases causing coma. In Diagnosis of Stupor and Coma.F. A. Davis Co., Philadelphia. 132.
2. Marks, V., and C. Rose. 1965. Cerebral metabolism andhypoglycemia. In Hypoglycemia. Blackwell ScientificPublications Ltd., Oxford, England. 52-61.
3. Moser, H., M. Victor, and R. Adams. 1970. Metabolicand nutritional diseases of the nervous system. In Har-rison's Principles of Internal Medicine. McGraw-HillBook Co., New York. 6th edition. 1803.
4. Duffy, T. E., S. R. Nelson, and 0. H. Lowry. 1972.Cerebral carbohydrate metabolism during acute hypoxiaand recovery. J. Nenrochcmn. 19: 959-977.
5. Tarr, M., D. Brada, and F. E. Samson, Jr. 1962. Cere-bral high-energy phosphates during insulin hypogly-cemia. .4nI. J. Ph.siol. 203: 690492.
6. Ferrendelli, J. A., and M.. M. Chang. 1973. Brain me-tabolism during hypoglycemia. ,4rch. AVcirol. 28: 173-
Hypoglycemic Coma 661
177.7. Nemoto, E. M., J. T. Hoff, and J. W. Severinghaus.
1971. Cerebral lactate (LA) metabolism in insulin-in-duced hypoglycemic dogs. Physiologist. 14: 202.(Abstr.)
8. Stone, W. E., J. K. Tews, K. E. Whisler, and D. J.Brown. 1972. Incorporation of carbon from glucose intocerebral amino acids, proteins and lipids, and alterationsduring recovery from hypoglycaemia. J. Neurochem.19: 321-322.
9. Arieff, A. I., and C. R. Kleeman. 1973. Studies onmechanisms of cerebral edema in diabetic comas:effects of hyperglycemia and rapid lowering of plasmaglucose in normal rabbits. J. Clin. Invest. 52: 571-583.
10. Kleinman, L., and E. P. Radford. Tidal volume versusbody weight and rate for laboratory mammals in rest-ing state. Ventilation Graph. Harvard Apparatus, Millis,Mass.
11. Zierler, K. L., D. Rabinowitz. 1964. Effect of verysmall concentrations of insulin on forearm metabolism.Persistence of its action on potassium and free fattyacids without its effect on glucose. J. Clin. Invest. 43:950-961.
12. Barlow, C. F., N. S. Domek, M. A. Goldberg, andL. J. Roth. 1961. Extracellular brain space measuredby S' sulfate. Arch. Neurol. 5: 102-110.
13. Levin, E., A. Arieff, C. R. Kleeman. 1971. Evidence of*different compartments in the brain for extracellularmarkers. Am. J. Physiol. 221: 1319-1326.
14. Bradbury, M. W. B., and C. R. Kleeman. 1967. Stabilityof the potassium content of cerebrospinal fluid andbrain. Am. J. Physiol. 213: 519-528.
15. Hohorst, H. J. 1965. L-(+)-Lactate, determinationwith lactic dehydrogenase and DPN. In Methods of En-zymatic Analysis. H. U. Bergmeyer, editor. AcademicPress, Inc., New York. 2nd edition. 266.
16. Dubowski, K. M. 1962. An o-toluidine method forbody-fluid glucose determination. Clin. Chem. 8: 215-235.
17. Bernt, E., and H. U. Bergmeyer. 1965. L-Glutamate:determination with glutamic dehydrogenase. In Methodsof Enzymatic Analysis. H. U. Bergmeyer, editor. Aca-demic Press, Inc., New York. 2nd edition. 384.
18. Arieff, A. I., C. R. Kleeman, A. Keushkerian, and H.Bagdoyan. 1972. Brain tissue osmolality: method of de-termination and variations in hyper- and hypoosmolarstates. J. Lab. Clin. Med. 79: 334-343.
19. Arieff, A. I., S. G. Massry, A. Barrientos, and C. R.Kleeman. 1973. Brain water and electrolyte metabolismin uremia: effects of slow and rapid hemodialysis. Kid-ney Int. 4: 177-187.
20. Katzman, R., and H. M. Pappius. 1973. Fluid compart-ments. In Brain Electrolytes and Fluid Metabolism. R.Katzman and H. M. Pappius, editors. The Williams &Wilkins Co., Baltimore. 33-48.
21. Ames, A., III, and F. B. Nesbett. 1966. Intracellularand extracellular compartments of mammalian centralnervous tissue. J. Physiol. (Lond.). 184: 215-238.
22. Welsh, G. W., III, E. D. Henley, R. H. Williams, andR. W. Cox. 1956. Insulin I-131 metabolism in man;plasma-binding, distribution and degradation. Am. J.Med. 21: 324-338.
23. Yalow, R. S., and S. A. Berson. 1965. Dynamics ofinsulin secretion in hypoglycemia. Diabetes. 14: 341-350.
24. Tower, D. B. 1969. Inorganic constituents. In Hand-book of Neurochemistry I. Chemical Architecture of
the Nervous System. A. Lajtha, editor. Plenum Publish-ing Corp., New York. 1: 1-24.
25. Davson, H. 1970. Ionic equilibria, bioelectric potentials,and active transport. In A Textbook of General Physi-ology. The Williams & Wilkins Co., Baltimore. 4thedition. 1: 550.
26. Levine, R. 1966. The action of insulin at the cell mem-brane. Am. J. Med. 40: 691-694.
27. Mortimore, G. E. 1961. Effect of insulin on potassiumtransfer in isolated rat liver. Am. J. Physiol. 200:1315-1319.
28. Zierler, K. L. 1960. Effect of insulin on potassiumefflux from rat muscle in the presence and absence ofglucose. Am. J. Physiol. 198: 1066-1070.
29. Fenn, W. 0. 1939. The deposition of potassium andphosphate with glycogen in rat livers. J. Biol. Chem.128: 297-307.
30. Hiatt, N., and J. A. Sheinkopf. 1971. Treatment ofexperimental hyperkalemia with large dosages of in-sulin. Surg. Gynecol. Obst. 133: 833-836.
31. Gilboe, D. D., R. L. Andrews, G. Dardenne. 1970. Fac-tors affecting glucose uptake by the isolated dog brain.Am. J. Physiol. 219: 767-773.
32. Bronsted, H. E. 1970. Exchange of glucose betweenplasma, brain, extracellular fluid and cerebral ventriclesin cats and effects of intraventricular acetazolamide andinsulin. Acta Physiol. Scand. 80: 122-130.
33. Sloviter, H. A., and H. Yamada. 1971. Absence ofdirect action of insulin on metabolism of the isolatedperfused rat brain. J. Neurochem. 18: 1269-1274.
34. Coxon, R. V. 1970. Glycogen metabolism. VIII. Hor-monal influence on cerebral glycogen. In Handbook ofNeurochemistry. Vol. 3: Metabolic Reactions in theNervous System. Abel Lajtha, editor. Plenum Pub-lishing Corp., New York. 47-48.
35. Clements, R. S., Jr., L. D. Prockop, and A. I. Wine-grad. 1968. Acute cerebral oedema during treatment ofhyperglycaemia. An experimental model. Lancet. 2:384-386.
36. Prockop, L. D. 1971. Hyperglycemia, polyol accumu-lation, and increased intracranial pressure. Arch. Neu-rol. 25: 126-140.
37. Stewart, M. A., W. R. Sherman, M. M. Kurien, G. I.Moonsammy, and M. Wisgerhof. 1967. Polyol accumu-lations in nervous tissue of rats with experimental dia-betes and galactosaemia. J. Neurochem. 14: 1057-1066.
38. Lowry, 0. H., J. V. Passonneau, F. X. Hasselberger,and D. W. Schulz. 1964. Effect of ischemia on knownsubstrates and cofactors of the glycolytic pathway inbrain. J. Biol. Chem. 239: 18-30.
39. Otsuka, M., and Ohtsuki. 1970. Mechanism of muscularparalysis by insulin with special reference to periodicparalysis. Am. J. Physiol. 219: 1178-1182.
40. Herrera, F. C. 1965. Effect of insulin on short-circuitcurrent and sodium transport across toad urinary blad-der. Am. J. Physiol. 209: 819-824.
41. Whittam, R., and K. P. Wheeler. 1970. Transport acrosscell membranes: characterization of ion movementsmediated by the sodium pump. Annu. Rev. Physiol. 32:21-60.
42. Zierler, K. L. 1966. Possible mechanisms of insulinaction on membrane potential and ion fluxes. Am. J.Med. 40: 735-739.
43. Nelson, R. A., and R. J. Beargie. 1965. Relationshipbetween sodium and glucose transport in canine jejunum.Amt. J. Physiol. 208: 375-379.
662 A. I. Arieff, T. Doerner, H. Zelig, and S. G. Massry
44. Schultz, S. G., and R. Zalusky. 1964. Ion transport inisolated rabbit ileum. II. The interaction between activesodium and active sugar transport. J. Gen. Physiol. 47:1043-1059.
45. DeFronzo, R. A., C. R. Cooke, R. Andres, G. R. Fa-loona, and P. J. Davis. 1973. Insulin effect on tubularsodium reabsorption. Clipi. Res. 21: 990. (Abstr.)
46. Saukek, C. D., P. R. Boulter, R. H. Knopp, and R. A.Arky. 1974. Sodium retention accompanying insulintreatment of diabetes mellitus. Diabetes. 23: 240-246.
47. Bell, W. E., N. A. Samaan, and D. S. Longnecker.1970. Hypoglycemia due to organic hyperinsulinism ininfancy. Arch. Neurol. 23: 330-339.
48. Senior, B., and L. Loridan. 1969. Gluconeogenesis andinsulin in the ketotic variety of childhood hypoglycemiaand in control children. J. Pediatr. 74: 529-539.
49. Chowdhury, F., and S. J. Bleicher. 1973. Studies oftumor hypoglycemia. Metab. (Clin. Exp.). 22: 663-674.
50. Clasen, R. A., P. M. Cooke, S. Pandolfi, D. Boyd, andA. J. Raimondi. 1962. Experimental cerebral edemaproduced by focal freezing. An anatomic study utiliz-ing vital dye techniques. J. Neuropathol. EIxp. Neurol.21: 579-596.
51. Norris, J. WV., and H. M. Pappius. 1970. Cerebral waterand electrolytes: effects of asphyxia, hypoxia, and hy-percapnia. Arch. Neurol. 23: 248-258.
52. Kaasik, A. E., L. Nilsson, and B. K. Siesjd. 1970. Theeffect of asphyxia upon the lactate, pyruvate and bi-carbonate concentrations of brain tissue and cisternalCSF, and upon the tissue concentrations of phospho-creatinine and adenine nucleotides in anesthetized rats.Acta Physiol. Scand. 78: 433-447.
Hypoglycemic Coma 663