media planning umair masoom usmani lecture 1. media landscape of pakistan a brief overview
TRANSCRIPT

Media Planning
Umair Masoom Usmani
Lecture 1
Media Landscape of Pakistan
A brief Overview
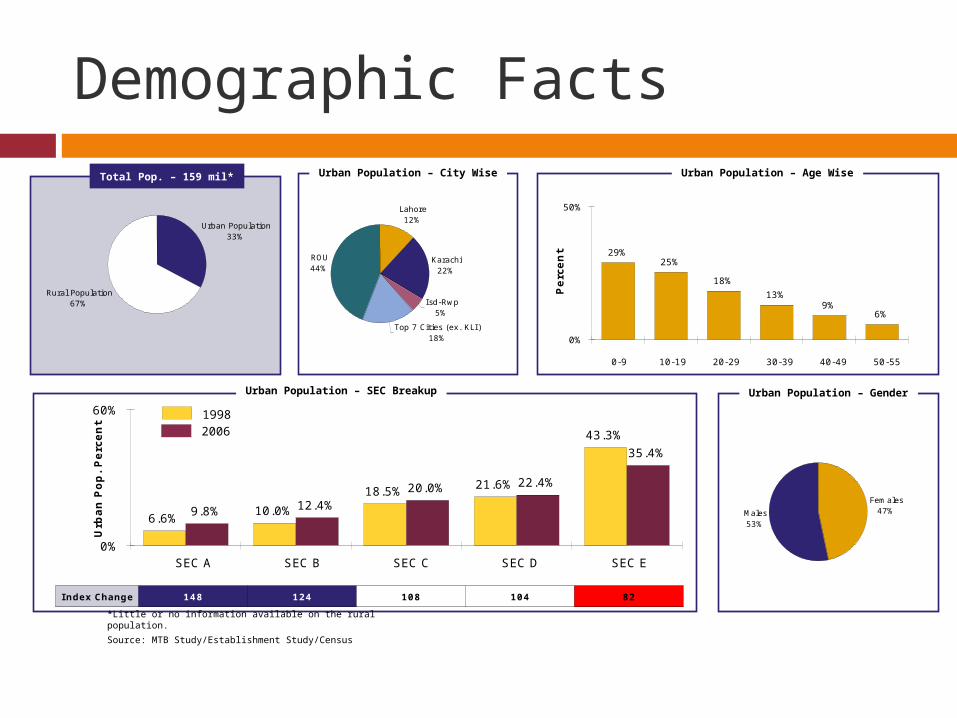
Demographic FactsTotal Pop. – 159 mil*
Urban Population – SEC Breakup
Urban Population – Age WiseUrban Population – City Wise
Urban Population – Gender
*Little or no information available on the rural population.
Source: MTB Study/Establishment Study/Census
Lahore12%
Karachi22%
Isd-Rwp5%
Top 7 Cities (ex. KLI )18%
ROU44%
Urb
an
Pop
. P
erc
en
t
SEC A SEC B SEC C SEC D SEC E
I ndex Change 148 124 108 104 82
6.6%10.0%
18.5%21.6%
43.3%
9.8% 12.4%20.0% 22.4%
35.4%
0%
60%
Females47%Males
53%
19982006
Perc
en
t
0-9 10-19 20-29 30-39 40-49 50-55
29%25%
18%
13%9%
6%
0%
50%
Urban Population33%
Rural Population67%

Industry Advertising Expenditure
Industry AdEx
Pakistan is one of the few countries where AdEx has risen this dramatically. This is primarily due to the booming economy, and deregulation of media.
Television has seen the highest growth.
Note:All expenditures are reported based on best estimates
Advert
isin
g E
xpen
dit
ure
(Rs B
illion
)
2005 2006 2007
Rs. 17.6 Bil
Rs. 24.3 Bil
Rs. 28.1 Bil
0
30
Advert
isin
g E
xpen
dit
ure
20
07
(R
s B
illion
)
Television Print OOH Radio
Rs. 13.6 Bil
Rs. 9.4 Bil
Rs. 4.8 Bil
Rs. .4 Bil
0
18

Top 10 Companies Advertised –TV + Print
Top A
dvert
iser'
s S
pen
d (
Rs M
illion
)
Unilever Government Mobilink Telenor Ufone P&G PepsiCo Warid LG Electronics Nestle
Rs. 1,467 mil
Rs. 1,235 mil
Rs. 1,122 mil
Rs. 713 milRs. 629 mil Rs. 604 mil Rs. 596 mil
Rs. 550 mil Rs. 522 milRs. 436 mil
0
2,000
TV 90% 52% 75% 71% 77% 91% 93% 64% 67% 90%Print 10% 48% 25% 29% 23% 9% 7% 36% 33% 10%

Which are the top 10 Brand to advertise the most?
Top B
ran
d's
Spen
d (
Rs M
illion
)
Mobilink (J azz) Telenor Ufone AL-Warid Government Of Pakistan
PTCL Habib Bank Ltd
Mobilink Paktel ( GSM ) Pepsi
Rs. 682 milRs. 649 mil
Rs. 629 mil
Rs. 550 milRs. 525 mil
Rs. 412 mil Rs. 401 mil
Rs. 283 milRs. 239 mil Rs. 237 mil
0
1,000
TV 66% 69% 77% 64% 1% 31% 56% 85% 44% 88%Print 34% 31% 23% 36% 99% 69% 44% 15% 56% 12%

TV Stations GrowthCY 2004 or Prior CY 2005 CY 2006 CY 2007
PTV A TV DhoomPTV World Aaj TV TV 2 DayIndus Plus
TV One
Mashriq TV
Rung TV
Indus VisionUni PlusCity ChannelARY One WorldGeo News
Roshni Indus NewsRoyal Television Waqt TV
Dawn NewsExpress TVKhabreinGeo EnglishDin NewsNews One
Ary Digital Hum TV Sun EntertainmentGeo Entertainment
Q TV Haq TVLabbaik
PTV National PTV Bolan KOOK Roohi TVSindh TV APNA Waseb KTN NewsKTN Khyber Kashish Music Sindh TV News
AJK TV Punjab TVRavi TV
The Musik Play TVN Vibe Channel G MTV PakistanIndus Music Aag
Sports Ten Sports Geo SuperWomen Indus PlusFashion FTV Pakistan
Food Masala TVSuper Wikkid
HBO Pakistan
Filmazia
Sun Biz CNBC PakistanBusiness Plus
VU1VU2
Shopping Shopping Channel
Hybrid
News
Entertainment
Religious
Movies
Business News
Education
Regional
Music
Children Cartoon Network Nick
CY 2004 CY 2005 CY 2006CY 2007
20 37 56 70+
Apna News
Samaa
Express News
Khyber News
Metro One
Channel 5
Star Movies
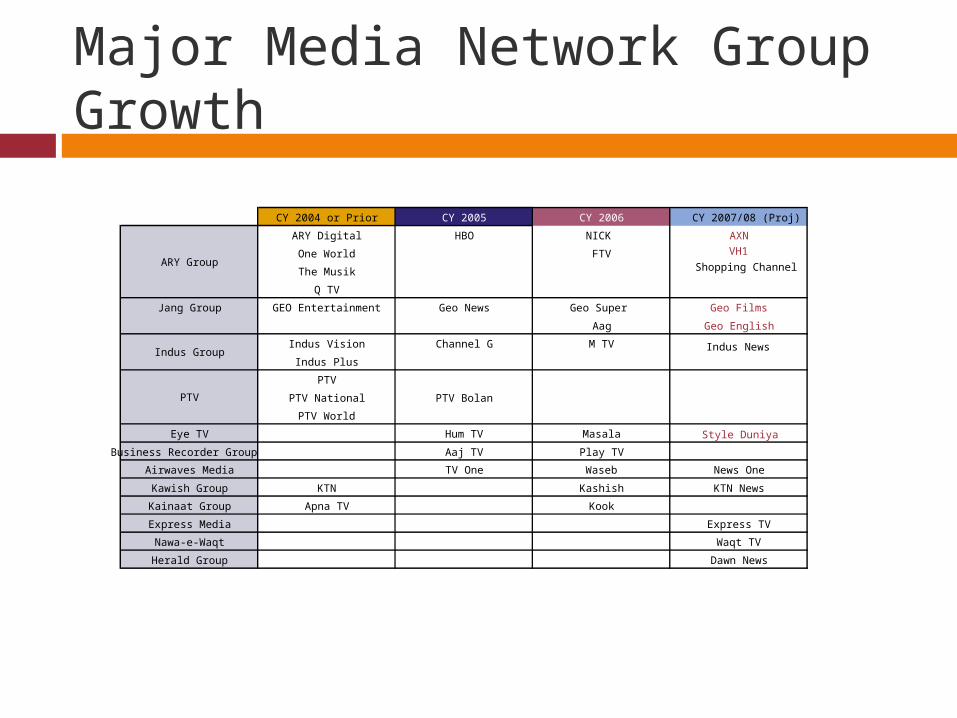
Major Media Network Group Growth
CY 2004 or Prior CY 2005 CY 2006 CY 2007/08 (Proj)
ARY Digital HBO NICK AXN
One World FTV
The Musik
Q TV
Jang Group GEO Entertainment Geo News Geo Super Geo Films
Aag Geo English
Indus Vision Channel G M TV
Indus Plus
PTV
PTV National PTV Bolan
PTV World
Eye TV Hum TV Masala
Business Recorder Group Aaj TV Play TV
Airwaves Media TV One Waseb News One
Kawish Group KTN Kashish KTN News
Kainaat Group Apna TV Kook
Express Media Express TV
Nawa-e-Waqt Waqt TV
Herald Group Dawn News
ARY Group
Indus Group
PTV
Indus News
VH1
Style Duniya
Shopping Channel

How many people own Television? How many people have access to C&S?
.
Source: NRS (Aftab Associates, 2006); Multi-Media Time Budget Study (Aftab Associates, 2004).
TV Ownership – 2004/2006 Cable Access –2004/2006
TV Ownership I ndex
Urban 104
Karachi 100
Lahore 101
Rwp/Isl 100
KLI 100
ROU 106
85%
91%
91%
92%
91%
79%
88%
91%
92%
92%
91%
84%
0 1
0 1
2004 2006
Cable Access I ndex
Urban 142
Karachi 116
Lahore 126
Rwp/Isl 138
KLI 120
ROU 126
48%
74%
57%
42%
65%
38%
68%
86%
72%
58%
78%
48%
0 1

Meter Diary Comparison

Currently available researches in Media
Gallup Ratings People Meters National readership survey Multi-time Budget Study Establishment surveys Census of Pakistan TV Monitoring Report Print Monitoring Report
TV Viewership

Gallup Diary System
Launched in 1994 Sample of 2200 respondents
1500 (urban) 700 (rural)
Sample in KLI: 600 What is the Diary system Potential Problems

The Diary SampleID Number:Date:Day
Aag TV Aaj TV Apna ARY Dig.AryOne ATV . . . . . . . . PTV TV One Vibe TV06:00 - 06:1406:15 - 06:2906:30 - 06:4406:45 - 06:5907:00 - 07:1407:15 - 07:2907:30 - 07:4407:45 - 07:5908:00 - 08:1408:15 - 08:2908:30 - 08:4408:45 - 08:5909:00 - 09:14
. .
. .
. .
. .
. .04:00 - 04:1404:15 - 04:2904:30 - 04:4404:45 - 04:5905:00 - 05:1405:15 - 05:2905:30 - 05:4405:45 - 05:59
Time Band

About meters in Pakistan
Launched by Media Logic Equipment provided by Gfk telecontrol (fourth largest research
company in the world) Hardware, software and maintenance provided by Gfk Gfk has set up meters in at least 14 countries (including India)
Data Delivery from September 2007

Meters: How do they work?
Users: Planners/Buyers
Internet based software
Overnight Data
User Remote
Central Processing Servers
Meter

Meter Panel Composition In the first phase, panel comprises of Households
from Top 3 Metros i.e. KHI, LHR, RWP/ISL
Medialogic conducted an exclusive Establishment survey in order to determine panel composition
CITY PANEL HOMES
KHI 225
LHR 175
RWP/ISL 100
TOTAL 500
SEC BREAK-UP
SEC A10%
SEC B16%
SEC C18%SEC D
25%
SEC E31%
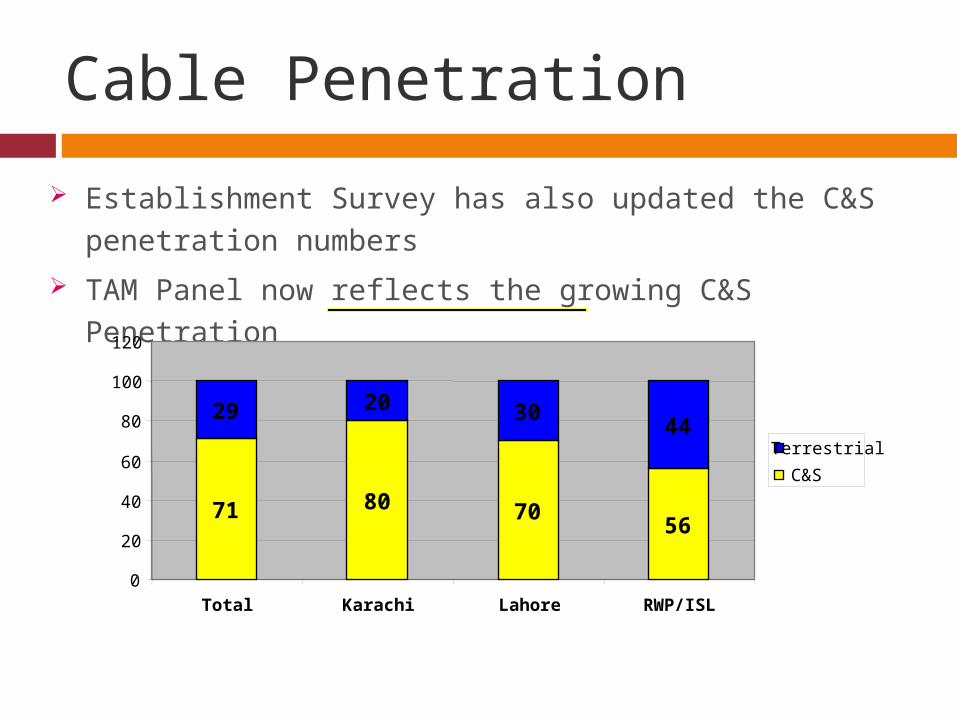
Cable Penetration
Establishment Survey has also updated the C&S penetration numbers
TAM Panel now reflects the growing C&S Penetration
71 80 7056
29 20 3044
0
20
40
60
80
100
120
Total Karachi Lahore RWP/ISL
Terrestrial
C&S

Data Reliability Questions
Channel switching by cable operator Idle viewership Non reported viewership Equipment/infrastructure related issues Sample size/Margin of Error Channel zapping by respondent