mediatek 2011 analyst day - emops.twse.com.tw
TRANSCRIPT

March 1, 2011
MediaTek 2011 Analyst Day

2011/3/15Copyright © MediaTek Inc. All rights reserved. 1
Safe Harbor Statement
Except for historical information contained herein, the matters set forth in this
presentation are forward-looking statements that are subject to risks and
uncertainties that could cause actual results to differ materially, including the
impact of competitive products and pricing, timely design acceptance by our
customers, timely introduction of new technologies, ability to ramp new
products into volume, industry wide shifts in supply and demand for
semiconductor products, industry overcapacity, availability of manufacturing
capacity, financial stability in end markets, and other risks.

A Look Back at 2010
- C. J. Hsieh, President

MediaTek Growth Drivers
2011/3/15Copyright © MediaTek Inc. All rights reserved. 3
HOME
3DTV
Blu-RayDVD
Mobile
Smartphone
WiMaxLTE
IPSharing

Outperforming Shipment Growth in Key Markets
2011/3/15Copyright © MediaTek Inc. All rights reserved. 4
20%
40%
0%
10%
20%
30%
40%
50%
Market MediaTek
Baseband
144%
500%
0%
100%
200%
300%
400%
500%
600%
Market MediaTek
BD Player
13%
64%
0%
10%
20%
30%
40%
50%
60%
70%
Market MediaTek
Flat Panel TV
Volume
Growth
‟10 vs „09
▪ 2.5/2.75G chipset shipment >500 million, +40% YoY
▪ BD player IC global market share over 40%
▪ Flat panel TV IC shipment +64% YoY
Source: Company data

Key Product Initiatives in 2010
2011/3/15Copyright © MediaTek Inc. All rights reserved. 5
Feature Phone SoC3DTV SoC
Touch Phone SoCInternet TV SoC
Tier-1 Account
LTE
BD Player SoC Smartphone

Ranked Global Top 20 Semiconductor Companies
2011/3/15Copyright © MediaTek Inc. All rights reserved. 6
Source: iSupply, www.fabtech.org / Dec. 17, 2010
Company Name 2010 Rev.
1 Intel 40,020
2 Samsung 28,137
3 Toshiba 13,081
4 Texas Instruments 12,966
5 Renesas 11,840
6 Hynix 10,577
7 STMicroelectronics 10,280
8 Micron Technology 8,853
9 Qualcomm 7,200
10 Elpida 5,676
11 Broadcom 6,506
12 AMD 6,355
13 Infineon 6,226
14 SONY 5,336
15 Panasonic 5,128
16 Freescale 4,329
17 NXP 4,021
18 Marvell 3,680
19 MediaTek 3,595
20 Nvidia 3,189
Strong Presence in EM
Right Product Strategies
Superior Execution
IP Coverage & Synergy
Turn-key Solution
ODD / BD / FPTV- C. J. Hsieh, President

0
50
100
150
2008 2009 2010 2011 2012 2013
BD ODD Market Price
(USD)
2011/3/15Copyright © MediaTek Inc. All rights reserved. 8
Blu-ray is About to Trigger Growth of Optical Storage
Source: TSR. 2010 Dec
Note: Combination of BD-ROM, BD-Combo, BD Writer Source : MediaTek 2010, Nov
Note: Others include CD-ROM, CD-RW, DVD-ROM
Price Erosion of Blu-ray
Leads to ODD Growth
0
100
200
300
400
2010 2011 2012 2013
BD ODD DVD-RW Others*
Million Units

Prominent BD DVD Market Share and Technology
Development
2010 2011
Process
OS
Application
MTK Has Achieved Over 40%
WW BD DVD Market Share!!
2011/3/15Copyright © MediaTek Inc. All rights reserved. 9
$223
$390
$476
$510
25
50
70
85
2010 2011 2012 2013
Million Units

Unit: Million pcs
Source: Display Search/ TSR / MTK
FPTV/MTV Demand Boom
2011/3/15Copyright © MediaTek Inc. All rights reserved. 10
Mobile TV
Market Forecast
0
50
100
150
200
250
300
350
2010 2011 2012 2013
Analog
CMMB
Others
Note: Others include FLO, ATSC-MH, DVB-T, DVB-H,
S-DMB, T-DMB- Tmm, Full Seg, lseg
Million UnitsFPTV
Market Forecast
0
50
100
150
200
250
2010 2011 2012 2013
3D
Connected
Others

ConnectivityHDMI 1.4a /
100M Ethernet
PCI-e /
Wi-Fi
2D to 3D /
3D MEMC
Interactive TV Smart TV
Rich 3D
Multimedia 3D
Software
Mobile TV MATV 2nd Gen MATV
Full-Range FPTV Solutions Roadmap
2011/3/15Copyright © MediaTek Inc. All rights reserved. 11
2010 2011
Universal
Platform
▪ Leverage MediaTek core technology in BD&Handset
▪ Multi-Devices with “MediaTek inside”

Feature Phone- C. J. Hsieh, President

Copyright © MediaTek Inc. All rights reserved.
Solid Execution Record
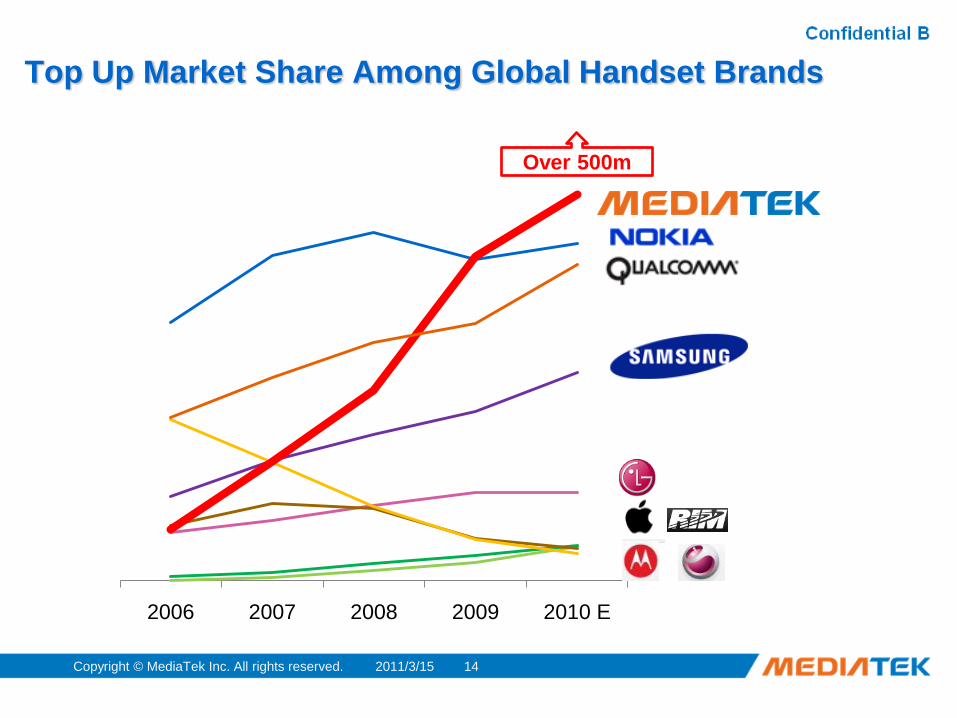
Top Up Market Share Among Global Handset Brands
2006 2007 2008 2009 2010 E
2011/3/15Copyright © MediaTek Inc. All rights reserved. 14
Over 500m

Broad Portfolio from Low-End, Mid-Range to
High-End Phones
2011/3/15Copyright © MediaTek Inc. All rights reserved. 15
4 G LTEUnder
DevelopmentUnder
Development
3.5 G HSPA
3 GWCDMA
TD-SCDMA -
2.75 G EDGE
2.5 G GPRS
UltraLow Cost
(no camera)
Entry-LevelCameraPhone
1.3Mega-Pixel
Camera
2~3Mega-Pixel
Camera
5+Mega-Pixel
Camera
Smart Phone(Android)
Hig
he
r B
an
dw
idth
Richer Multimedia & Functionality
Mobile TVFM Radio
SmartPhones
Low-CostPhones
Mid-to-High EndPhones
Bluetooth

Multiple Long-Term Growth Drivers
2011/3/15Copyright © MediaTek Inc. All rights reserved. 16

Base
Band
RF
TransceiverRF
PA
Memory
Dual
SIM
Cont-
roller
PMUSOC
Memory SIM
#1 #2SIM
#1 #2
Touch
Panel
Cont-
roller
World‟s Leading 2.5G Baseband/RF SOC
2011/3/15Copyright © MediaTek Inc. All rights reserved. 17
Unparallel
SOC
▪ 6253: 1st Gen. 2.5G SOC launched in 2010
▪ 6252: 2nd Gen. 2.5G SOC (with Serial flash)
▪ 6251: 2.5G Ultra-low-cost SOC
RF
PA

Copyright © MediaTek Inc. All rights reserved.
Smart Touch UI

0% 20% 40%
1000~
1001~2000
2001~3000
3001~5000
5000+
2009 2010
Surging Mobile Data Demand Drives Easier Content
Access
Source: 中國戶聯網信息聯絡中心 (CNNIC report, Jan. 2011)
Income of Mobile Internet
Users, 2009/2010
Major Mobile
Internet Usage
234
303
2009 2010
Users access Mobile Internet
(million)
30%+ in 2010, representing 66% of China’s Internet users
60%+ of China’s internet users’ income below RMB2,000 p.m.
Mobile internet usage mostly text-centric, no need of high bandwidth
2011/3/15Copyright © MediaTek Inc. All rights reserved 19
0% 20% 40% 60%
Shopping
Payment
Blogging
Video
Emails
Gaming
BBS
Social Network
E-Books
Music
Searching
News
SMS

Copyright © MediaTek Inc. All rights reserved. 20
Talented Software Provides Key Differentiators
Intuitive and Easy-to-use Smart Touch
HVGA Live wall paper, 3D Main Menu, Cap. touch, strong CPU computing
power as customized 3rd party app carrier (312 MHz).
Powerful Internet Browser and Widget
Full-HTML Browser, Wi-Fi with super UE, Opera mobile browser, Widget
applications: SNS, Finance, Search, Information
Stunning Multimedia Entertainment
Digital music, MPEG-4, AAC, H.264, ATV/DTV
,RMVB, True Color Display
Location Aware
Know where you are and where you
are going
Downloadable Applications
TrueColor
2011/02
3D Menu & App. Store

State-of-Art 3D Graphics User Interface
2011/02 21Copyright © MediaTek Inc. All rights reserved.
3D Live Wallpaper Shell App & Widget
2011/
3/15
Copyright © MediaTek Inc. All
rights reserved.

Full HTML Web Browser With Leading Standards
2011/3/15Copyright © MediaTek Inc. All rights reserved. 22
▪ Top-class UI to enjoy web pages for PC on handset
▪ Webkit level browser same as Google and iPhone
▪ Market-proven UI/UE experience with 80M+
worldwide users’ recognition
▪ Enabled on 2.75G/3G/3.5G/WiFi
▪ Opera mobile browser integrated
▪ Stable, secure, standard compliant

Copyright © MediaTek Inc. All rights reserved.
Q & A

Smart Phone- CJ Hsieh, President

2011/3/15Copyright © MediaTek Inc. All rights reserved. 25
Source: DIGITIMES,2010/12
Smartphone Penetration Reaches 40-50% in 2013
179
281
441
620
805
13.6%
19.3%
28.4%
37.4%
45.5%
0%
10%
20%
30%
40%
50%
0
200
400
600
800
1000
2009 2010(F) 2011(F) 2012(F) 2013(F)
Shipment
Penetration Ratio
Shipment
Unit (million)
Smartphone
Penetration

2011/3/15Copyright © MediaTek Inc. All rights reserved. 26
48 69 100 133 1634064
101
145179
61
96
150
207
274
9
21
36
53
69
9
14
27
41
60
12
17
27
41
60
170
281
441
620
805
2009 2010 2011 2012 2013
Global Smartphone Sales(Millions of Units)
North America
Western Europe
Asia Pacific
Central & Latin America
Central & Eastern Europe
Africa Middle East
Total
Emerging Market Drives Smart Phone Growth
(Asia Pac. - China, S. Korea ,India, Jap., Australia…etc )
▪ Entry level phones in China and Emerging Markets
▪ Mobile broadband for Internet Access
Driver of
Demand

2011/3/15Copyright © MediaTek Inc. All rights reserved. 27
SP (Mu) Q1 Q2 Q3 Q4 2010
Nokia 21.5 23.8 26.5 28.3 100.1
Apple 8.8 8.4 14.1 16.2 47.8
RIM 10.6 11.2 12.4 14.6 48.8
Samsung 2.7 3.1 7.5 11.3 24.6
HTC 3.0 5.2 6.7 9.1 24
Motorola 2.4 2.7 3.8 4.9 13.8
Sony Erics. 0.3 1.7 4.0 4.5 10.5
LG 0.3 0.9 1.1 2.5 4.8
Others 5.9 5.4 4.9 2.7 18.9
Total 55.4 62.4 81.0 94.1 293.3
Source: company data
Global Smart Phone Shipment in 2010
2011/3/15Copyright © MediaTek Inc. All rights reserved. 28
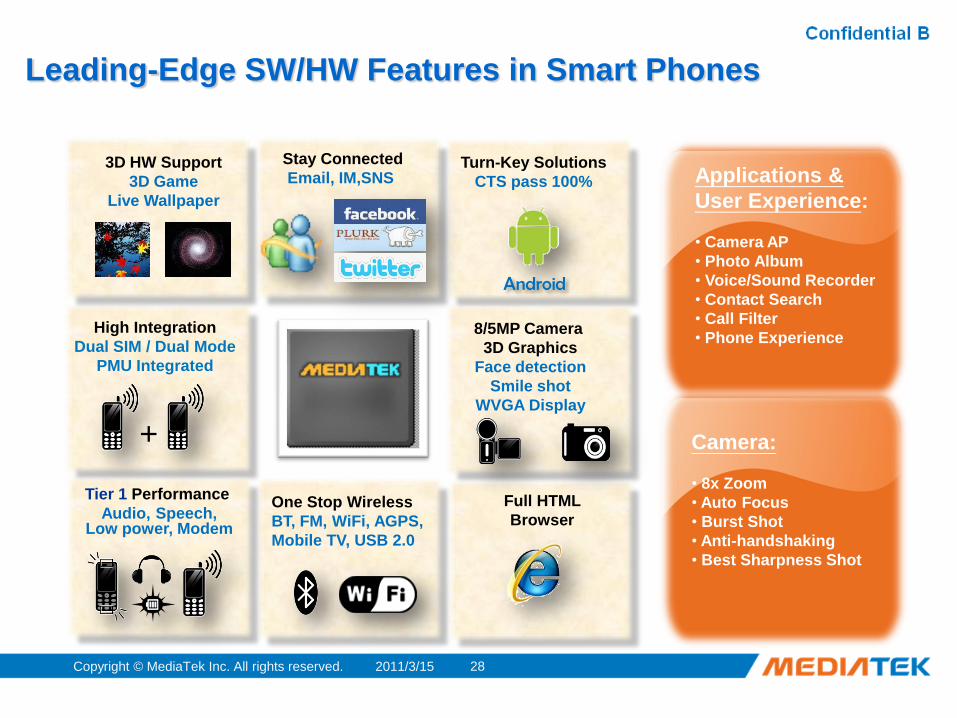
Leading-Edge SW/HW Features in Smart Phones
High Integration
Dual SIM / Dual Mode
PMU Integrated
8/5MP Camera
3D Graphics
Face detection
Smile shot
WVGA Display
3D HW Support
3D Game
Live Wallpaper
One Stop Wireless
BT, FM, WiFi, AGPS,
Mobile TV, USB 2.0
Stay Connected
Email, IM,SNS Turn-Key Solutions
CTS pass 100%
Full HTML
Browser
Tier 1 Performance
Audio, Speech, Low power, Modem
Android
+
Applications &
User Experience:
• Camera AP
• Photo Album
• Voice/Sound Recorder
• Contact Search
• Call Filter
• Phone Experience
Camera:
• 8x Zoom
• Auto Focus
• Burst Shot
• Anti-handshaking
• Best Sharpness Shot

Copyright © MediaTek Inc. All rights reserved.
Q & A

Thank you.
- CJ Hsieh, President

Financial Highlights
- David Ku, GM of Finance

Summary
▪ Track records of superior growth, profitability,
and operating efficiencies
▪ Long-term records of being shareholder friendly
▪ Proven records of riding the tide of major industry transition; Well
positioned for promising fields
▪ Sufficient resource to invest for the future
2011/3/15Copyright © MediaTek Inc. All rights reserved. 32

Track Records of Superior Revenue and Profitability
Growth
2011/3/15Copyright © MediaTek Inc. All rights reserved. 33
(Note) Before 2007 is pro forma NI
Unit: NT$M
0
10,000
20,000
30,000
40,000
2006 2007 2008 2009 2010
Net Income
CAGR
27.0%
0
50,000
100,000
150,000
2006 2007 2008 2009 2010
Rev
CAGR 21.0%
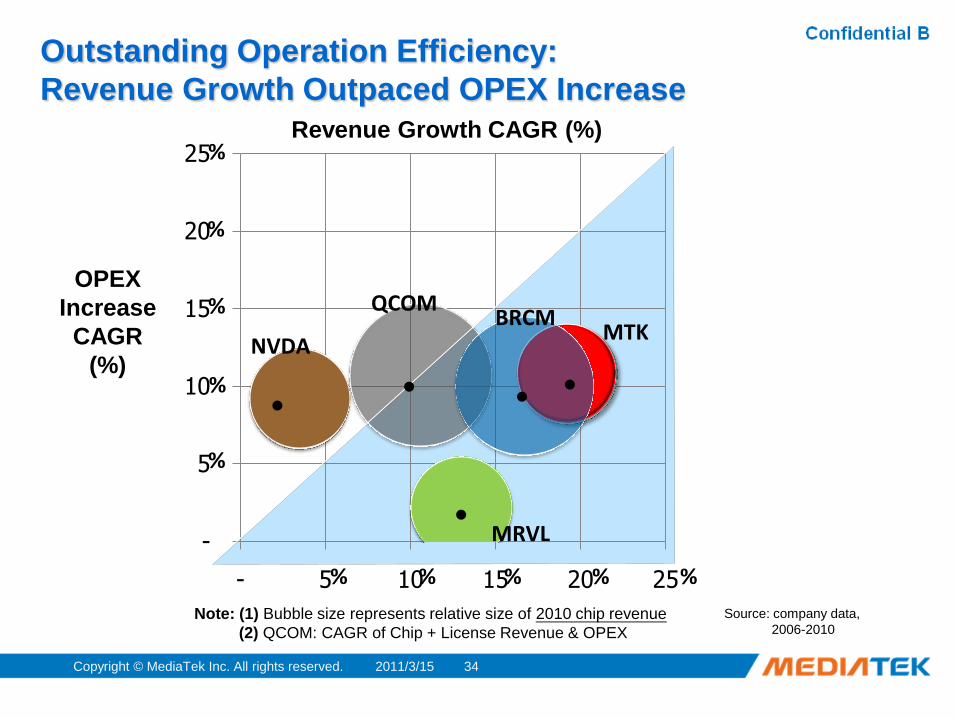
Outstanding Operation Efficiency:
Revenue Growth Outpaced OPEX Increase
2011/3/15Copyright © MediaTek Inc. All rights reserved. 34
-
5
10
15
20
25
- 5 10 15 20 25
Revenue Growth CAGR (%)
OPEX
Increase
CAGR
(%)NVDA
QCOMBRCM
MTK
MRVL
% % % % %
%
%
%
%
%
Note: (1) Bubble size represents relative size of 2010 chip revenue
(2) QCOM: CAGR of Chip + License Revenue & OPEX
Source: company data,
2006-2010

Comparative Surpassing Profitability
2011/3/15Copyright © MediaTek Inc. All rights reserved. 35
Note: (1) Bubble size represents relative size of 2006~2010 MTK accumulative revenue
(2) NI% =Accumulative net income / Accumulative revenue(2006~2010)
MTK, 1.0 X QCOM, 3.6 X
BRCM, 0.5 X
NVDA, 0.4 X
MRVL, 0.3 X
0%
5%
10%
15%
20%
25%
30%
35%
- 1.0 2.0 3.0 4.0 5.0
NI %
Revenue (x to MTK)
5 Year Accumulative Profit & Loss

Summary
▪ Track records of superior growth, profitability, and operating
efficiencies
▪ Long-term records of being shareholder friendly
▪ Proven records of riding the tide of major industry transition; Well
positioned for promising fields
▪ Sufficient resource to invest for the future
2011/3/15Copyright © MediaTek Inc. All rights reserved. 36

2011/3/15Copyright © MediaTek Inc. All rights reserved. 37
Constantly Reduced Employee Bonus Dilution
(註) 2007年(含)以前係proforma資料。
0%
10%
20%
30%
40%
50%
2006 2007 2008 2009 2010
Profit sharing to NI
-
5,000
10,000
15,000
20,000
25,000
0%
1%
2%
3%
2006 2007 2008 2009 2010
K Shares
share dilution% Profit sharing shares
Profit sharing shares dilution
2011/3/15Copyright © MediaTek Inc. All rights reserved. 38
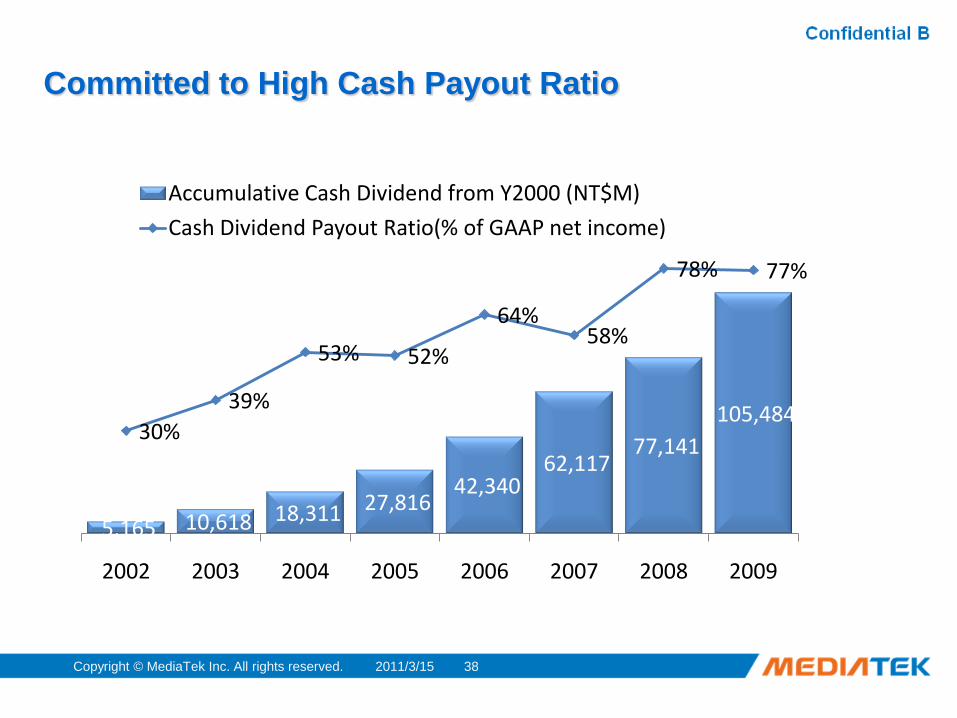
Committed to High Cash Payout Ratio
5,165 10,618 18,311 27,816 42,340
62,117 77,141
105,484 30%
39%
53% 52%
64%58%
78% 77%
2002 2003 2004 2005 2006 2007 2008 2009
Accumulative Cash Dividend from Y2000 (NT$M)
Cash Dividend Payout Ratio(% of GAAP net income)

Summary
▪ Track records of superior growth, profitability, and operating
efficiencies
▪ Long-term records of being shareholder friendly
▪ Proven records of riding the tide of major industry transition;
Well positioned for promising fields
▪ Sufficient resource to invest for the future
2011/3/15Copyright © MediaTek Inc. All rights reserved. 39

MediaTek Has The Broadest Product Portfolio;
Best Positioned For The Device Convergence Trend
MediaTek SPRD Mstar RDA BRCMQCOM+ATHR
MRVLST-
Ericsson
4G: LTE
WiMax
3G/3.75G: WCDMA/HSPA
3G: TD-SCDMA
2.5G / 2.75G
Smartphone AP
Multimedia AP
Bluetooth
WiFi
GPS
Mobile TV / FM
Digital TV
Analog TV
Blu-ray Player
Mass Storage
2011/3/15Copyright © MediaTek Inc. All rights reserved. 40
Meaningful presence Little presence or has announced entry / exit.

Product Perspectives Summary
Comprehensive product roadmap
Technology advantage in 2.5G/2.75G SoC
Value-added offering for feature phone:
Smart Touch UI for 2G/3G
Open MAUI platform
Proven track record in serving emerging market customers with
turnkey business solution
2011/3/15Copyright © MediaTek Inc. All rights reserved. 41

Summary
▪ Track records of superior growth, profitability, and operating
efficiencies
▪ Long-term records of being shareholder friendly
▪ Proven records of riding the tide of major industry transition; Well
positioned for promising fields
▪ Sufficient resource to invest for the future
2011/3/15Copyright © MediaTek Inc. All rights reserved. 42

Solid Financial Position for Future R&D Investments
and for Returning Capital to Shareholders
2011/3/15Copyright © MediaTek Inc. All rights reserved. 43
3,196 2,675 2,658 2,491
885
168 93 68
Cash & S/T Inv.
Note: (1) Taiwanese companies use exchange rate 1:29.3 for calculation(2) Each companies’ latest quarter cash & equivalent result, as of Feb. 21, 2011. Doesn’t include L/T marketable securities.(3) Mstar didn’t disclose post-IPO cash position in its 4Q10 result conference. Assumes 3Q10 cash position + NT$100E.(4) ST-Ericsson’s cash position included US$50m ad include 50m short-term credit facilities from parent companies.(5) Qualcomm cash & S/T investment position: US$10.5 bn (doesn’t show on this chart).
US$ million

Copyright © MediaTek Inc. All rights reserved.
Q & A

Financial Highlights
- David Ku, GM of Finance

March 1, 2011
MediaTek 2011 Analyst Day