medical and work loss cost estimation methods for teh ... · pdf filecalverton office park...
TRANSCRIPT

Calverton Office Park 11720 Beltsville Drive, Suite 900 Calverton, MD 20705-3111
Medical and Work Loss Cost
Estimation Methods for the WISQARS
Cost of Injury Module
Bruce A. Lawrence, Ph.D.
Soma Bhattacharya, Ph.D.
Eduard Zaloshnja, Ph.D.
Paul Jones, Ph.D.
Ted R. Miller, Ph.D.
Pacific Institute for Research & Evaluation
Phaedra S. Corso, Ph.D.
Department of Health Policy and Management
College of Public Health
University of Georgia
Claudia A. Steiner, M.D., M.P.H.
Agency for Healthcare Research and Quality
December 19, 2011

Medical and Work Loss Cost Estimation Methods for the WISQARS Cost of Injury Module
i
ACKNOWLEDGEMENTS
This report was prepared under contract for the Centers for Disease Control and
Prevention (CDC contract no. 200-2008-M-28023). It benefited greatly from the comments and
suggestions of four reviewers from the National Center for Injury Prevention and Control at
CDC, J. Lee Annest, Marcie-jo Kresnow, George W. Ryan and Tadesse Haileyesus. Thanks also
to the States that partner with the Healthcare Cost and Utilization Project for providing the
databases used to build the National Inpatient Sample and especially to the eight States that
allowed the project to access de-identified State Emergency Department Databases with charge
data.

Medical and Work Loss Cost Estimation Methods for the WISQARS Cost of Injury Module
ii
Table of Contents
Acknowledgements .......................................................................................................................... i
1. Introduction ............................................................................................................................. 1
1.1 Year of Dollars, Inflator Series, and Discount Rate ....................................................... 3 2. Background ............................................................................................................................. 3 3. Lifetime Medical Costs of Injuries ......................................................................................... 5
3.1 Fatalities .......................................................................................................................... 5 3.2 Hospitalized Injuries ....................................................................................................... 9
3.2.1 Total Inpatient Costs (Facility and Non-facility Costs) ................................... 10 3.2.2 Inpatient Readmission and Rehabilitation Costs ............................................. 11 3.2.3 Nursing Home Costs ........................................................................................ 12 3.2.4 Short- to Medium-Term Follow-Up Costs for Inpatient Admissions Not
Discharged to a Nursing Home ............................................................................. 12 3.2.5 Long-Term Follow-Up Costs .......................................................................... 14
3.2.6 Long-Term Costs of Spinal Cord Injuries (SCI) and Traumatic
Brain Injuries (TBI) .............................................................................................. 15 3.2.7 Transport costs ................................................................................................. 17
3.3 Injuries Treated in an Emergency Department ............................................................. 17 3.4 Applying the Estimated Non-Fatal Costs to the 2005 NEISS-AIP............................... 19
4. Lifetime Work Losses Due to Injuries .................................................................................. 20 4.1 Fatalities ........................................................................................................................ 21 4.2 Non-fatal Injuries .......................................................................................................... 23
4.2.1 Short-term Work Losses .................................................................................. 23 4.2.2 Long-term Work Losses .................................................................................. 25
4.2.3 Calculating Total Work Loss Costs ................................................................. 27 5. Limitations of Methods for Medical and Work Loss Estimates ........................................... 27
References ..................................................................................................................................... 29
Appendices: Appendix I. Mapping between ICD-9-CM Codes and NEISS Diagnosis
and Body Part Codes ............................................................................................32
Appendix II. Classification of Injury-Specific Diagnosis Groups by ICD-9-CM Codes
and the Multipliers Used to Estimate Short-Term Follow-up Costs..................35

Medical and Work Loss Cost Estimation Methods for the WISQARS Cost of Injury Module
1
Medical and Work Loss Cost Estimation Methods for the
WISQARS Cost of Injury Module
1. Introduction
This document describes the methods used to estimate costs of injury in the Center for
Disease Control and Prevention’s (CDC) Web-based Injury Statistics Query and Reporting
System (WISQARSTM
; CDC, Last updated Aug 2009) Cost of Injury module. The WISQARS
database is an interactive query system that provides customized reports of injury-related data. It
provides national and state statistics on the incidence and costs associated with unintentional and
violence-related fatal and non-fatal injuries. The WISQARS Cost of Injury Module, which is
available at (http://www.cdc.gov/injury/wisqars), provides cost estimates for injury deaths,
hospitalizations, and emergency department (ED)-treated (i.e., treated in the ED but not
hospitalized) cases by mechanism and intent of injury and by diagnosis and body region.
Part I of the WISQARS Cost of Injury Module uses fatal injury data from the National
Vital Statistics System (NVSS; CDC/National Center for Health Statistics, Last updated Aug
2009)1 and non-fatal data from the National Electronic Injury Surveillance System - All Injury
Program (NEISS-AIP; US Consumer Product Safety Commission, Last updated Aug 2009). The
NVSS provides data pertaining to causes of death that are classified and coded according to the
International Classification of Diseases (ICD; CDC/National Center for Health Statistics, Last
updated August 2009) (http://www.cdc.gov/nchs/nvss/about_nvss.htm). Since 1999, NVSS has
1 The NVSS database is collected and disseminated by the National Center for Health Statistics (NCHS) division of
CDC. It is one of the oldest and most successful examples of intergovernmental data sharing in public health. Its
data are provided through contracts between NCHS and vital registration systems operated in the various
jurisdictions legally responsible for the registration of vital events – births, deaths, marriages, divorces, and fetal
deaths (source: http://www.cdc.gov/nchs/nvss/about_nvss.htm).

Medical and Work Loss Cost Estimation Methods for the WISQARS Cost of Injury Module
2
used ICD-10 (10th
revision) as its basis of classifying and coding its data. The NEISS-AIP is an
expansion of the National Electronic Injury Surveillance System (NEISS) operated by the U.S.
Consumer Product Safety Commission (CPSC). The NEISS-AIP (Schroeder & Ault, 2001; CDC,
2001; http://www.cdc.gov/ncipc/WISQARS/nonfatal/datasources.htm#5.3) collects data on all
types and external causes of non-fatal injuries and poisonings treated in U.S. hospital emergency
departments (EDs), whether or not they subsequently are admitted to the hospital and whether or
not they are associated with consumer products. NEISS-AIP is a collaborative effort between the
National Center for Injury Prevention and Control (NCIPC) and CPSC.
Part II of the WISQARS Cost of Injury module allows users to input their own incidence
data on deaths, nonfatal hospitalized injury cases, and ED-treated injury cases. For deaths, cost
estimates are based on the ICD-10 diagnosis matrix
(http://www.cdc.gov/nchs/injury/injury_tools.htm); CDC, Last updated August 2009) and the
ICD-10 external cause of injury matrix (http://www.cdc.gov/nchs/injury/ice/matrix10.htm). For
nonfatal hospitalized and ED-treated injury cases, cost estimates are based on the 9th
Edition,
Clinical Modification of the ICD (ICD-9-CM; http://www.cdc.gov/nchs/icd.htm) using the Barell
Injury Diagnosis Matrix (http://www.cdc.gov/nchs/injury/injury_tools.htm) and the external-
cause-of-injury code (E-code) matrix (http://www.cdc.gov/injury/wisqars/ecode_matrix.html).
The following sections describe how the total lifetime costs for fatal injuries, nonfatal
hospitalized injuries and nonfatal ED-treated injuries, occurring in 2005, were estimated for use
in the WISQARS Cost of Injury module. The process essentially entails estimating and
aggregating the unit costs of medical treatment and work loss due to injuries.
Medical and Work Loss Cost Estimation Methods for the WISQARS Cost of Injury Module
3
1.1 Year of Dollars, Inflator Series, and Discount Rate
All costs used in the WISQARS Cost of Injury module are based on estimates in terms of
2005 dollars. Individual cost elements used in developing the cost module came from datasets
belonging to different time periods and were inflated to 2005 dollars. Health care costs that were
in prior year’s dollars are inflated using the Consumer Price Index (CPI), Medical Care; work
loss costs are inflated using the Employment Cost Index, Total Compensation, Total Private
Industry. Work loss costs more than one year post-injury were discounted to present value using
the 3% discount rate recommended by the Panel on Cost-Effectiveness in Health & Medicine
(Gold, Siegel, Russell, & Weinstein, 1996) and by Haddix, Teutsch, and Corso (2003).
2. Background
Every year, injuries impose a significant financial burden on the U.S. health care system.
For some injuries, medical treatment and corresponding costs may persist for years or even
decades after the initial injury. Injuries can result in both temporary and permanent disability.
When this occurs, injury victims may lose their ability to work or be restricted in their kinds of
work they can do. Reduced or restricted ability to work due to injury may result in lost wages
and accompanying fringe benefits, and the lost ability to perform one’s normal household
responsibilities. This document describes how these medical costs and work loss costs are
quantified in the WISQARS Cost of Injury Module.
The cost estimates presented here cover three mutually exclusive categories that reflect
the severity of injury: (1) injuries resulting in death, including deaths occurring within and
outside a healthcare setting; (2) injuries resulting in hospitalization with survival to discharge;

Medical and Work Loss Cost Estimation Methods for the WISQARS Cost of Injury Module
4
and (3) injuries requiring an ED visit not resulting in hospitalization. Costs were not estimated
for injuries treated only in doctor’s offices or outpatient departments because WISQARS
currently does not include those injuries. The cost analyses were computed from the societal
perspective, which means they include all costs regardless of who paid for them.
The medical and work loss costs of each injury death were estimated using 2005 NVSS
incidence data (http://www.cdc.gov/nchs/data/nvsr/nvsr56/nvsr56_10.pdf). The unit medical
costs of non-fatal injuries primarily were built from databases of the Healthcare Cost and
Utilization Project (HCUP) (http://www.hcup-us.ahrq.gov/databases.jsp): the 2005 HCUP
Nationwide Inpatient Sample (HCUP-NIS) (http://www.hcup-us.ahrq.gov/nisoverview.jsp;
HCUP Databases, last updated Aug 2009a) for hospital-admitted injuries and the 2003 HCUP
State Emergency Department Databases (HCUP-SEDD) (http://www.hcup-
us.ahrq.gov/seddoverview.jsp; HCUP Databases, last updated Aug 2009b) for non-admitted
injuries treated in a hospital emergency department. The SEDD databases were accessed under a
special agreement with AHRQ and its partner states. The treatment cost information from the
HCUP databases were integrated with the injury incidence data from the NEISS-AIP dataset in
order to assign costs at the case level classified by the NEISS diagnosis and body part codes.
The information on treatment costs from the HCUP databases were augmented with data
from Finkelstein et al. (2006) including cost data on emergency transportation, physician fees,
and rehabilitation to estimate the total lifetime medical and work loss costs by body region and
nature of injury. All costs initially were classified by ICD-9-CM codes, then collapsed into costs
by NEISS diagnosis code. The medical and work loss costs were summed to compute total costs.
ICD-9-CM uses a single numeric code to represent each medical condition. In contrast,
NEISS uses two separate codes to represent each condition: a nature of injury code (e.g., burn,

Medical and Work Loss Cost Estimation Methods for the WISQARS Cost of Injury Module
5
fracture, laceration) and a body part code. As detailed in Appendix I, maps previously developed
for CPSC (Lawrence, Miller, Jensen, Fisher, & Zamula, 2000) were used to collapse the unit
costs into NEISS code categories.2 The medical and work loss cost estimates from the HCUP
databases were then merged at the case level by age, sex, and NEISS diagnosis, and body part
codes to the 2005 NEISS-AIP dataset to yield total lifetime costs. (Note: NEISS routinely
collects only the principal diagnosis and primary body part affected that are recorded in the
medical record by the attending physician or other health care provider.)
3. Lifetime Medical Costs of Injuries
For some injuries, medical treatment and corresponding costs may persist for years or
even decades after the initial injury. Due to data limitations, the medical costs presented in this
study include costs associated with treatment for physical injuries only since data required to
estimate costs for mental health and psychological treatment were not available.
3.1 Fatalities
Fatal medical costs were calculated using costs per case by place of death from
Finkelstein et al. (2006). Costs were computed separately for five different places of death
identified in the NVSS data:
On-scene/at home.
Dead on arrival at a hospital (DOA).
In a hospital emergency department (ED).
2 The reader is referred to the Appendix for additional details on the mapping procedure.
Medical and Work Loss Cost Estimation Methods for the WISQARS Cost of Injury Module
6
In a hospital after inpatient admission.
In a nursing home.
The medical costs incurred, depending on place of death, might include charges for
coroner/medical examiner, medical transport, emergency department, inpatient hospital, and
nursing home. Table 1 summarizes the costs included for each place of death.
Table 1. Data and Methods for Estimating Medical Costs of Fatal Injuries
Location of
Fatality
Cost category Description, Unit Cost
(in 2005 US $)
Source of Data
On scene/at home Coroner/ME
(C/ME)
$657 (C/ME) Edwards et al. (1981)
(C/ME)
Dead on arrival
(DOA) at hospital
Transport (T) +
C/ME
$263 (T) + $657 (C/ ME) 1999 Medicare 5%
Sample (T),
Edwards et al. (1981)
(C/ME)
In ED T + C/ME +
ED
$263 (T) + $657
(C/ME)+ Avg. Costs for
fatalities in the ED by
selected external cause
and age groupings (ED)
1997 Nebraska, New
Hampshire, and South
Carolina ED discharge
data (ED)
In hospital after
admission
T + C/ME +
Fatal Inpatient
Total (FIT)
$263 (T) + $657
(C/ME)+ Avg. Costs for
fatalities in the hospital
by body region and
nature of injury (FIT)
2000 HCUP-NIS for
hospital facilities costs,
1996 and 1997
MarketScan® data for
non-facility costs (FIT)
In nursing home T+ C/ME +
Non-fatal
Inpatient Total
(NIT) + Avg.
Costs for
fatalities in
nursing homes
(NH)
$263 (T) + $657
(C/ME)+ Avg. costs for
non-fatal inpatient
injuries by diagnosis
(NIT)+ $6872 (NH)
2000 HCUP-NIS for
inpatient facilities costs
(NIT), 1996 and 1997
MarketScan® data for
non-facility costs (NIT),
1999 National Nursing
Home Survey (NH)
Medical and Work Loss Cost Estimation Methods for the WISQARS Cost of Injury Module
7
All fatalities were assigned coroner/medical examiner costs of $657 in 2005 dollars. The
original estimate was based on a dated survey of these officials (Edwards et al., 1981). Although
these data were old, no newer costs were available, and no evidence suggests these modest costs
had changed except due to inflation. DOAs and all deaths in the hospital, whether in the ED or as
an inpatient, also received the cost of a one-way transport, which was based on average
ambulance transport costs for injured patients in the 1999 Medicare 5% sample.
For deaths in the ED, Finkelstein et al. (2006) added average costs for injury fatalities in
the ED by external-cause-of-injury groupings (i.e., homicide, suicide, motor vehicle, other
unintentional) and age groups (i.e., age 0-19 years, 20 years and older) computed from 363
injury deaths in Nebraska, New Hampshire, and South Carolina ED discharge data for 1997.
(These were the only states where Finkelstein et al. (2006) could readily get data with ED
charges and discharge destination.) These data, like most hospital data, contained the hospital’s
nominal charges, which typically exceed the actual costs of treatment. Because facility specific
cost-to-charge ratios were not readily available for these data, average charges were adjusted to
costs by multiplying them times the ratio of the cost per non-fatal ED injury visit (from the 1996-
1999 Medical Expenditure Panel Survey – MEPS)) to the three-state average charge for a non-
fatal ED injury discharge.
For deaths in the hospital, costs for an inpatient admission that resulted in a fatality were
added to the transport and medical examiner/coroner costs. These inpatient costs were computed
by body region and diagnosis, as per the Barell Injury Diagnosis Matrix
(http://www.cdc.gov/nchs/injury/injury_tools.htm), from 10,889 unweighted cases in the 2000
HCUP-NIS file for those who died in the hospital. Then the estimated cost for non-facility
services – such as professional services used while in the hospital, yet not included in the

Medical and Work Loss Cost Estimation Methods for the WISQARS Cost of Injury Module
8
admissions billing (e.g., surgeon, anesthesia, physical therapy) was added to the inpatient facility
cost estimates from the HCUP-NIS. These non-facility costs were based on Medstat’s 1996 and
1997 MarketScan® Commercial Claims and Encounters Database. This database contains an
inpatient hospital admissions file, which summarizes each hospital admission, including total
payments, facility payments, length of stay and detailed diagnosis data. After removing non-fee-
for-service claims and claims without a diagnosis of injury, a file with 19,247 inpatient injury
admissions was created. Using these records, the mean ratio of total medical costs during the
inpatient stay to facilities costs was calculated by body region and nature of the injury as
presented in the Barell injury-diagnosis matrix. The ratios of total costs to facilities costs ranged
from 1.03 to 1.39, with an overall average of 1.26. The HCUP-NIS cost estimate for each
admission was multiplied by the ratio in the corresponding Barell injury-diagnosis category to
yield estimated total inpatient costs for each injury admission contained in the HCUP-NIS
database. Costs were computed for non-fatal hospitalized injuries using this same approach
(see below).
For deaths in a nursing home, the average cost of nursing home care (from 565
unweighted cases) computed from the 1999 National Nursing Home Survey was added to the
inpatient, transport and coroner costs. Although it would have been desirable to use the average
cost for only those who died in the nursing home, the small sample size prevented this analysis.
Since an inpatient stay with live discharge likely preceded the nursing home stay, there was the
potential for double-counting costs for both hospital and nursing home fatalities.
These costing methods were applied to the 2005 NVSS data at the case level using the
place of death variable (i.e., specifying where the death occurred) to produce the fatal medical
costs to be used in the WISQARS Cost of Injury module.

Medical and Work Loss Cost Estimation Methods for the WISQARS Cost of Injury Module
9
3.2 Hospitalized Injuries
The hospitalized injury costing methods in Finkelstein et al. (2006) were applied to 2005
acute care costs. An overview of the approach is presented in Table 2. The details are provided in
the following sections.
Table 2. Data and Methods for Estimating Medical Costs of
Non-Fatal Injuries Requiring Hospitalization
Cost category Description, Unit Cost
(in 2005 US $)
Source/ Notes
Facilities Component
of Inpatient Stay
Inpatient facility charges for the case
multiplied by inpatient cost to charge
ratio for the facility
2005 HCUP-NIS for charges,
Cost to Charge ratios from
Agency for Healthcare
Research and Quality (AHRQ)
Non-facilities
Component of
Inpatient Stay
Estimated by comparing ratio of total
costs to facilities costs by body
region and diagnosis
1996 and 1997 MarketScan®
data
Probability of
Hospital Readmission
During the First 6
Months Post-
discharge
Probability of readmission by 3-digit
ICD-9-CM codes
Estimated using 1997-98 MD,
NJ, and VT hospital discharge
data
Hospital
Rehabilitation Costs
Estimated for 14 diagnosis groups
and 6 mechanisms
Costs estimated using
Prospective Payment System
reimbursement amounts. All
estimates reported in Miller et
al. (2004)
Nursing Home (NH) Costs added to 2005 HCUP/NIS
discharges directly to NH. Specific
costs estimated for hip-related
fractures by age group. For all other
injuries, average cost estimated
1999 National Nursing Home
Survey
Medical and Work Loss Cost Estimation Methods for the WISQARS Cost of Injury Module
10
Cost category Description, Unit Cost
(in 2005 US $)
Source/ Notes
Short- to Medium-
Term Follow-Up
Costs
Estimated as the ratio of all costs in
months 1-18 after injury (on average)
to total inpatient costs by select
diagnosis groupings, excluding costs
of readmission less than 6 months
post-discharge
1996-1999 MEPS
Follow-Up Costs
Beyond 18 Months
and up to 7 Years
Estimated using ratios of total
lifetime costs to 18 month costs by
diagnosis/age group. Captures costs 7
years post injury
1979-1988 Detailed Claim
Information (DCI) data from
Worker’s Compensation
claims, Adjustment factor for
youth from Miller et al. (2000)
Costs Beyond 7 Years
Estimated for SCI and
TBI
SCI: Ratio of lifetime costs to 7 year
costs estimated from survey data
TBI: 7+ year costs estimated at 75%
of SCI costs
1986 survey data reported in
Berkowitz et al. (1990)
Transport 50% of admissions assumed to have
transport costs of $263
Mean cost estimated using 1999
Medicare ambulance claims
with an injury E-code
3.2.1 Total Inpatient Costs (Facility and Non-facility Costs)
The 2005 HCUP-NIS data on inpatient facilities charges were used to compute inpatient
facilities costs. For each record in HCUP-NIS, inpatient facilities charges were, multiplied by the
2005 Medicare cost-to-charge ratios supplied by AHRQ. These ratios are hospital specific for
77% of the records in the 2005 HCUP-NIS file. For hospitals whose facility-specific ratio could
not be calculated, a weighted group average ratio specific to the hospital’s state, ownership,
urban/rural location, and number of beds was used as recommended by AHRQ (Friedman, De La
Mare, Andrews, & McKenzie, 2002). One exception was the state of Texas which accounted for
8.26% of total injury records. A weighted state average cost-to-charge ratio was used in this case
because both hospital-specific and group ratios were unavailable.

Medical and Work Loss Cost Estimation Methods for the WISQARS Cost of Injury Module
11
When computing direct costs of inpatient care, 4.52% of the HCUP-NIS injury-related
records were excluded because they lacked either charges or a diagnosis code.3 Another 0.1% of
the records were excluded because the per diem charge fell in the extreme tails of the distribution
(less than $752 or greater than $63,500 for the motor vehicle injury dataset; less than $600 or
greater than $48,500 for the unintentional injuries dataset; less than $395 or greater than $46,625
for the residual injury dataset). Trimming the distribution eliminated obvious data entry errors
(e.g., $8/day for hospitalization charges) and produced robust means (Wainer, 1976). Following
the approach described above for deaths in the hospital, Medstat’s Marketscan® data were used
to quantify non-facility fees incurred during an inpatient admission for non-fatal hospitalized
injuries.
3.2.2 Inpatient Readmission and Rehabilitation Costs
Acute care readmission costs were computed for readmissions that occurred during the
first six months after the injury. These were estimated by multiplying the diagnosis-specific
probability of readmission from 1997-98 Maryland, New Jersey, and Vermont hospital discharge
data times the average inpatient facilities cost plus non-facility fees (as described above) for the
diagnosis.
Costs of inpatient rehabilitation were estimated using direct costs developed for 14
diagnosis groups in each of 6 mechanisms of injury groups by Miller et al. (2004). These
diagnosis and mechanism of injury groups came from the Health Care Financing Administration
(HCFA) (now the Center for Medicare and Medicaid Services, CMS) Prospective Payment
System (PPS) reimbursement schedule that governs payments for all U.S. inpatient rehabilitation
3 A total of 6,292 cases (1.2%) had missing charges while another 238 cases (0.05%) reported charges that were
deemed unreasonably high by AHRQ. An additional 17,087 (3.27%) cases had to be dropped because they lacked
injury diagnosis codes.

Medical and Work Loss Cost Estimation Methods for the WISQARS Cost of Injury Module
12
including professional fees. Miller et al. (2004) used PPS data on lengths of stay and cost per day
to develop direct cost estimates of rehabilitative treatment. They used data from California,
Maryland, and Pennsylvania hospital discharge systems to compute the probability of
rehabilitation for each PPS diagnosis and mechanism group. The product of the probability of
rehabilitation and the direct cost estimate of rehabilitation developed by Miller et al. (2004) were
added to the HCUP-NIS/Marketscan®-based cost estimates.
3.2.3 Nursing Home Costs
HCUP-NIS indicates injury admissions that were discharged directly to nursing homes.
Finkelstein et al. (2006) quantified nursing home costs for these cases using the discharge file of
the 1999 National Nursing Home Survey, a National Center for Health Statistics provider survey
(http://www.cdc.gov/nchs/nnhs.htm). The discharge file included data on 540 nursing home
discharges for injury. Each record included information on diagnoses, total length of stay from
admission to discharge (some admissions occurred prior to 1999), and total payments. With a
relatively small sample size, average nursing home costs were quantified for only two types of
injuries – hip-related fractures and all other injuries. For hip-related fractures average costs were
quantified separately for three age groups, 0-64 years, 65-74, and 75 and older. Costs were not
differentiated by age for those with non-hip-related injuries. Nursing home costs were added to
the HCUP-NIS/Marketscan® cost estimates by injury diagnosis.
3.2.4 Short- to Medium-Term Follow-Up Costs for Inpatient Admissions Not Discharged
to a Nursing Home
To develop estimates of short- to medium-term costs for injuries requiring an inpatient
admission but not discharged to a nursing home, Finkelstein et al. (2006) multiplied total

Medical and Work Loss Cost Estimation Methods for the WISQARS Cost of Injury Module
13
inpatient costs for each record in HCUP-NIS/Marketscan® (as derived above) by the ratio of all
costs in the first 18 months after injury, on average, (including costs for inpatient services, ED
visits, ambulatory care, prescription drugs, home health care, vision aids, dental visits, and
medical devices) to the total inpatient costs (including admissions and readmissions) for injury
by diagnosis and mechanism of injury. These ratios were derived from 1996-1999 MEPS data.
MEPS is a nationally representative survey of the civilian non-institutionalized population that
quantifies individuals’ use of health services and corresponding medical expenditures for two
consecutive years following enrollment. Because the MEPS analysis was limited to injuries of
admitted patients with at least 12 months of follow-up and the MEPS data include costs for up to
24 months, the MEPS sample captures injuries with an average of 18 months of post-injury
treatment.
Although MEPS is the best source of available data for capturing nationally
representative injury costs across treatment settings (e.g., hospitals, physician’s office,
pharmacy), even after pooling four years of data the sample size for many injuries with low
incidence rates was small. Therefore, to obtain robust direct cost estimates, injuries were
collapsed into broad categories prior to quantifying average costs. Records were collapsed into
ICD diagnosis groupings based on the following guidelines (in priority order):
1. Groupings must be comprehensive, covering all injury diagnoses (including those for
which MEPS lacks cases).
2. Groupings need to balance the goals of diagnosis-level detail and reasonable cell
sizes. In some instances, cell samples as small as 5 were accepted in order to avoid
combining radically dissimilar diagnoses into a single group.
Medical and Work Loss Cost Estimation Methods for the WISQARS Cost of Injury Module
14
3. Groupings should be similar, either in nature of injury (e.g., sprain, fracture) or in
body region, if not in both.
4. Total injury costs (or the ratio of total injury costs to hospitalization costs for
admitted injuries) should be similar in magnitude across diagnoses within each
grouping.
Using the MEPS data and the criteria detailed in the preceding paragraph, the average
ratio of 18-month costs to total inpatient costs (including inpatient facility and non-facility fees)
was calculated for 15 injury-specific diagnosis groups, ranging in size from 5 to 61 unweighted
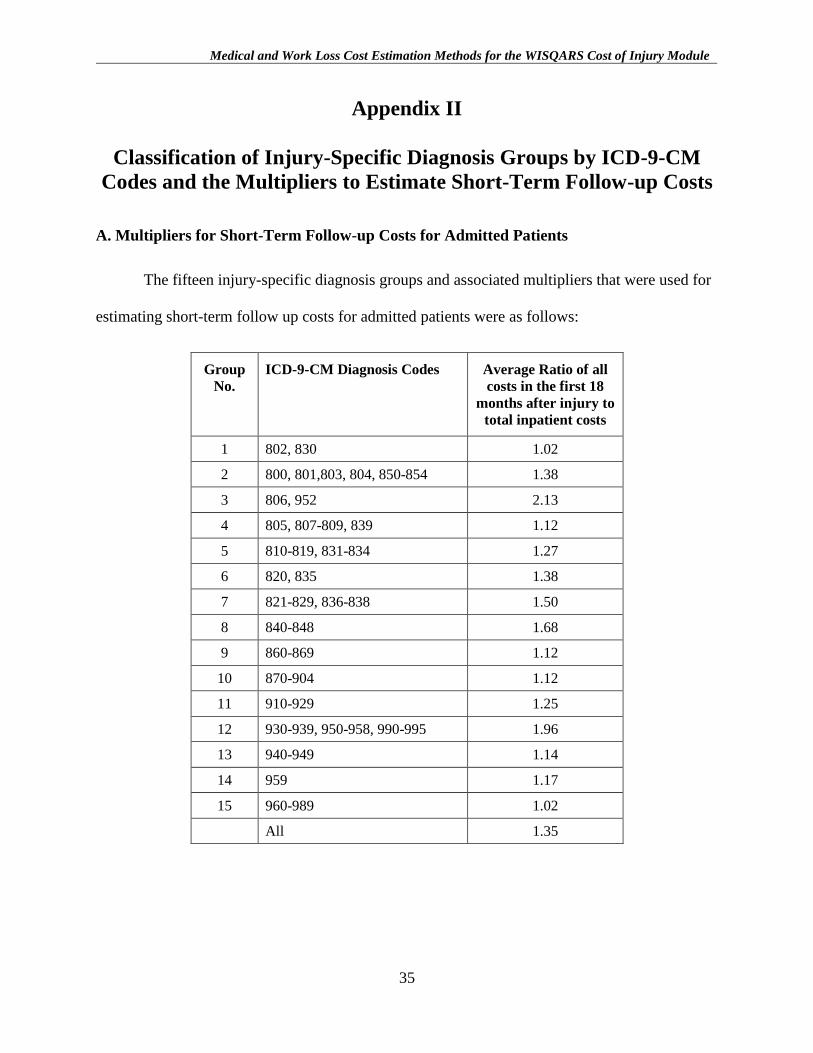
cases. The ratios ranged from 1.02 to 2.13, with an overall average of 1.35 (details in Appendix
II). The ratios were then multiplied by the corresponding inpatient cost estimates detailed in the
preceding section to arrive at 18-month costs for injuries requiring an inpatient admission.
3.2.5 Long-Term Follow-Up Costs
While short- to medium-term costs capture the majority of costs for most injuries, some
injuries continue to require treatment and costs beyond 18 months. Rice et al. (1989) estimated
long-term medical costs from costs in the first six months using multipliers derived from
longitudinal 1979-1988 Detailed Claim Information (DCI) data on 463,174 Worker's
Compensation claims spread across 16 states. The DCI file was unique: nothing similar in size,
geographic spread, and duration has become available subsequently. Because occupational injury
includes a full spectrum of external causes (e.g., motor vehicle crash, violence, fall), the DCI
data by diagnosis presumably captured the medical spending pattern for an injury to a working-
age adult reasonably accurately. Their applicability to childhood injuries was questionable. To
address this concern, Miller, Romano, and Spicer (2000b) analyzed the 30-month cost patterns

Medical and Work Loss Cost Estimation Methods for the WISQARS Cost of Injury Module
15
(long-term costs were not available) of adult versus child injury using 1987-89 MarketScan data
on private health insurance claims. They found that the ratios of 30-month costs to initial
hospitalization costs for children’s episodes by diagnosis did not differ significantly from the
comparable ratios for adults. By diagnosis, the ratios for children ranged from 95% to 105% of
the ratios for adults. Thus, it is reasonable to apply the DCI estimates to childhood injury cases.
Costs beyond 18 months were not inconsequential for some injuries. For lack of a better
alternative, following Finkelstein et al. (2006), ratios computed from the DCI expenditure
patterns were used to adjust estimates of costs in the first 18 months to arrive at estimates of the
total medical costs (including long-term) associated with injuries. This method implicitly
assumed that while treatment costs varied over time, the ratio of lifetime costs to 18-month costs
had remained constant between the time the DCI data were reported and 2005.
For those injury/age groups identified in MEPS as having costs in months 7-18, the cost
estimates for months 0-18 were multiplied by the ratio of lifetime costs to the costs in months 0-
18 for the same injury/age group calculated using the DCI data. Although the DCI ratios varied
by injury diagnosis, overall, they revealed that, using a 3% discount rate, 77% of the costs for
admitted cases occurred in months 0-18 (Miller et al., 2000a). These ratios suggested an average
multipliers of 1.30 for admitted cases.
3.2.6 Long-Term Costs of Spinal Cord Injuries (SCI) and Traumatic Brain Injuries (TBI)
WISQARS incorporates TBI and SCI medical cost estimates from Finkelstein et al.
(2006). For several types of injuries, and especially for SCI and TBI, a substantial portion of the
total medical costs occur beyond seven years of sustaining the injury. For SCI, because data are
available beyond seven years, the ratio of lifetime costs to costs in years 1-7 was multiplied by

Medical and Work Loss Cost Estimation Methods for the WISQARS Cost of Injury Module
16
the estimates from the MEPS/DCI analysis to obtain total cost estimates (Finkelstein et al.,
2006). This ratio was generated from data collected by Berkowitz, Harvey, Greene, and Wilson
(1990), who surveyed a nationally representative sample of SCI survivors and their families in
1986 and collected data on 758 SCI victims, including those residing in institutions, those living
at home, and those in independent living centers. The respondents (victims, families, or
guardians) provided details of care payments during the past year, including payments for
medical, hospital, prescription, vocational rehabilitation, durable medical equipment,
environmental modification, personal assistant, and custodial care. The long-term cost estimates
for SCI rely on the assumption that the now dated Berkowitz data on medical costs by year post-
injury mirror the expected lifetime costs for recent SCI victims.
Quantifying long-term costs for TBI is more problematic. Most TBI programs do not
have longitudinal data on TBI costs. However, Miller et al. (2004) estimated inpatient
rehabilitation costs by diagnosis group, including SCI and TBI, finding that among patients
receiving rehabilitation, the cost per case for TBI averaged 75% of the cost for SCI. TBI patients,
however, were far less likely to receive inpatient rehabilitation (6% versus 31%). Finkelstein et
al. (2006) assumed the TBI patients who received inpatient rehabilitation would follow the same
cost pattern more than seven years post-injury as the SCI patients, but with costs equal to 75% of
SCI levels. For very severe burns, amputations, and other non-SCI, non-TBI injuries requiring
lifetime medical care, lack of available data will bias Finkelstein et al.’s (2006) lifetime cost
estimates downwards.

Medical and Work Loss Cost Estimation Methods for the WISQARS Cost of Injury Module
17
3.2.7 Transport costs
None of the data sets and analyses of non-fatal hospitalized injuries described above
include transportation costs. WISQARS incorporates transportation costs from Finkelstein et al.
(2006). Finkelstein et al. (2006) estimated the half of non-fatal injuries requiring a hospital
admission also required a one-way trip via ambulance to the hospital. For each injury, the costs
include half of the one-way average emergency transport costs based on 1999 average transport
costs for Medicare beneficiaries with an E-code on an ambulance claim. There were 15,579
Medicare ambulance claims (including air ambulance) that were E-coded, with an average cost
of $263 in 2005. The estimated 50% transport rate may be conservative. The National Pediatric
Trauma Registry, which captures admitted serious injuries, showed that from 4/1/94 to 11/5/01,
58.4% of 48,288 pediatric patients arrived by ambulance (National Pediatric Trauma Registry,
2002).
3.3 Injuries Treated in an Emergency Department
Table 3 summarizes the approach for quantifying costs of non-fatal injuries treated in
EDs and released without inpatient admission.

Medical and Work Loss Cost Estimation Methods for the WISQARS Cost of Injury Module
18
Table 3. Data and Methods for Estimating Medical Costs of Non-Fatal,
Non-Admitted Injuries Treated in Emergency Departments
Cost category Description, Unit Cost
(in 2005 US $)
Source/Notes
ED Visit ED facility charges times
facility-specific (or hospital
stratum average) cost-to-charge
ratios times national/state price
adjusters
2003 HCUP-SEDD (CT, GA,
MD, MN, NE, SC, TN, UT),
cost-to-charge ratios from
AHRQ, and national/state price
adjusters from ACCRA
Follow-up Visits
and Medication,
Months 1-18
Estimated as the ratio of all
costs in the first 18 months after
injury to costs of the initial ED
visit by diagnosis grouping
1996-1999 MEPS
Follow-Up Costs
Beyond 18
Months
Estimated using ratios of total
lifetime costs to 18 month costs
by diagnosis/age group.
1979-1988 Detailed Claim
Information (DCI) data from
Worker’s Compensation claims,
Adjustment factor for youth
from Miller et al. (2000)
Emergency
Transport
50% of ED visits assumed to
have transport costs of $263
Mean cost estimated using 1999
Medicare ambulance claims with
an injury E-code
The 2003 HCUP-SEDD data were used to quantify direct medical costs for ED-treated,
non-admitted, non-fatal injuries. The HCUP-SEDD includes all patients treated in an ED who
were not subsequently admitted as inpatients. AHRQ provided facility-specific cost-to-charge
ratios for EDs in eight states (Connecticut, Georgia, Maryland, Minnesota, Nebraska, South
Carolina, Tennessee, and Utah). These ratios were multiplied by the hospital charges in the
HCUP-SEDD database to estimate the facility cost, similar to the methods described above using
the HCUP-NIS data to estimate hospital-admitted costs.
Since these costs were at state price levels for a non-representative sample of states, we
converted the costs to national price levels using state price indices based on the ACCRA Cost of
Living Indices for health care services (http://www.coli.org). ACCRA publishes indices for large
Medical and Work Loss Cost Estimation Methods for the WISQARS Cost of Injury Module
19
metropolitan areas and the non-metropolitan remainders of states. The regional index values for
medical care within each state were weighted using Census population estimates for 2003 to
obtain a state-level index. For New York, separate indices were computed for New York City
and the balance of the state and then combined using population weights.
As with costs for hospitalized injuries, the costs of the initial visit were factored up by
1996-99 MEPS-based ratios for 51 categories of non-admitted injuries, to account for follow-up
visits and medication in the first 18 months post injury. The ratios ranged from 1.02 to 5.44, with
an overall average of 1.78 (details in Appendix II). For those injury/age-groups identified in
MEPS requiring follow ups longer than 18 months, average costs were estimated using ratios
from DCI expenditure patterns and implicitly assuming that the ratio of lifetime costs to 18-
month costs had remained constant between the time DCI data were reported and 2003. These
long-term costs were calculated by multiplying the DCI ratios of lifetime costs to 0-18 month
costs for the same injury/age-group using the 0-18 month costs from MEPS. Using a 3%
discount rate, 88% of the costs for non-admitted cases occurred in months 0-18 and the average
multiplier was 1.14 (Miller et al., 2000a). For age-groups not represented in DCI, the costs were
adjusted using ratios from Miller et al.(2000b). As with hospital costs, half the patients were
assumed to receive emergency transport so half of average one-way emergency transport costs of
$263 was added to the costs of all ED-treated injuries (see Transport Costs Section above).
3.4 Applying the Estimated Non-Fatal Costs to the 2005 NEISS-AIP
The medical costs were computed as described for all non-fatal injury cases in the 2005
HCUP-NIS and the 2003 HCUP-SEDD. The costs by admission status, age group, sex, and
diagnosis were further differentiated by major cause using three cause groups: motor vehicle

Medical and Work Loss Cost Estimation Methods for the WISQARS Cost of Injury Module
20
traffic-related injuries, intentional injuries (i.e., assaults and self-harm), and all other injuries
(including unintentional, non-motor-vehicle injuries and all injuries with missing cause codes or
unknown intent). A few diagnosis categories not commonly found among intentional and motor
vehicle injuries – notably burns – were not differentiated but were placed into the “all other
injuries” category. All cases were assigned NEISS nature of injury and body part codes (which
taken together constitute a NEISS diagnosis) using a procedure developed by Lawrence et al.
(2000). Then average costs were computed by admission status, age group, sex, NEISS nature of
injury, body part, and cause group. Sometimes age/sex/diagnosis cells were combined together
using a set of decision rules developed for this purpose to obtain large enough cell counts (at
least 10 unweighted cases and usually at least 30) for obtaining stable national estimates
4. Lifetime Work Losses Due to Injuries
Injuries can result in both temporary and permanent disability. When this occurs, injury
victims may lose part or all of their productivity potential. Work losses due to injury may include
lost wages and accompanying fringe benefits, and the lost ability to perform one’s normal
household responsibilities. For non-fatal injuries, work losses represent the value of goods and
services not produced because of injury-related illness and disability. To the degree that injuries
prevent or deter individuals from producing goods and services in the marketplace, the public
sector, or the household, the value of these losses is a cost borne by society.
Fatal work losses represent the value of goods and services never produced because of
injury-related premature death. These work loss costs were estimated by applying expected
lifetime earnings by age and sex to the 149,075 deaths from injury sustained in 2005, including
an imputed value for lost household services.
Medical and Work Loss Cost Estimation Methods for the WISQARS Cost of Injury Module
21
Consistent with the human capital approach for quantifying the burden of injuries (Rice
et al., 1989), estimates of non-fatal work losses involve applying average earnings to work-years
lost and the value of housekeeping services to time lost in home production. Non-fatal injuries
may result in both short-term work loss and in lifetime work losses. The latter includes the value
of output lost by persons disabled in later years as a result of injury sustained in 2005.
The work loss estimates for the WISQARS Cost of Injury module were inflated from
Finkelstein et al. (2006). Non-fatal work losses were stratified into two categories: short-term
losses, which represent lost wages and accompanying fringe benefits and household services
occurring in the first six months after an injury, and long-term losses, which represent the
respective wage and household loss occurring after six months from the time of the injury. The
decision to use six months as the transition point between short-term and long-term work losses
was driven by the availability of data on duration of work loss.
Because men earn higher wages than women, even in the same job (Bureau of Labor
Statistics, 2001) or for injuries with the same prevalence between men and women, the work loss
estimates were greater for men. Finkelstein et al. (2006) view this as more of a shortcoming of
the labor market than an inherent problem with the human capital approach. Regardless, this
undervaluation of women’s labor is reflected in the estimates.
4.1 Fatalities
For someone of a given sex and age who sustained a fatal injury, Finkelstein et al. (2006)
summed the sex-specific probability of surviving to each subsequent year of age (Arias, 2002)
times sex-specific expected earnings for someone of that age. We used this formula with
earnings data by sex and year of age derived from the March Supplement of the Current

Medical and Work Loss Cost Estimation Methods for the WISQARS Cost of Injury Module
22
Population Survey, averaged across a full business cycle from 2002 through 2009. We inflated or
deflated all earnings figures to 2005 dollars using the Employment Cost Index–Wages &
Salaries, All Civilian. We added fringe benefits of 23.33% of wages based on the average ratio
of wage supplements to wages for 2002-2009 from the national income accounts (Economic
Report of the President, various years, Table B-28). Earnings, including salary and the value of
fringe benefits, at future ages were adjusted upward to account for a historical 1% work growth
rate (Haddix et al., 2003) and then discounted to present value using a 3% discount rate.
Parallel calculations valued lost household work. Estimates of the value of household
work are also included in Haddix et al. (2003). Historically, productivity growth in household
production has been negligible, so Finkelstein et al. (2006) did not adjust for it. In all cases, they
assumed that the probability of surviving past the age of 102 is zero.
In equation form, lifetime earnings for someone of age a and sex b (Earna,b) is computed
as
where Earn = lifetime earnings, Pa,b(k) = the probability that someone of age a and sex b will live
until age k, Y k,b = the average value of annual wages (plus fringe benefits) or of annual
household production at age k for someone of gender b, g = the productivity growth rate (0.01
for wages, 0.00 for household production), and .03 is the discount rate.
These costing methods were applied to the 2005 NVSS data at the case level to produce
the fatal work loss costs to be used in WISQARS.
Medical and Work Loss Cost Estimation Methods for the WISQARS Cost of Injury Module
23
4.2 Non-fatal Injuries
For non-fatal injuries, work loss estimates included the sum of the value of wage and
household work lost due to short-term disability in the acute recovery phase and of the value of
wage and household work lost due to permanent or long-term disability for the subset of injuries
that cause lasting impairments that restrict work choices or preclude return to work.
4.2.1 Short-term Work Losses
Finkelstein et al. (2006) quantified temporary or short-term work loss for non-fatal
injuries using the approach presented in Lawrence et al. (2000). Lawrence et al. combined the
probability of an injury resulting in lost workdays from 1987-1996 National Health Interview
Survey (NHIS) data with the mean work days lost (conditional on having missed at least one
day) per injury estimated from the 1993 Annual Survey of Occupational Injury and Illness
reported by the Bureau of Labor Statistics (BLS). These data were sent to BLS by employers
through a mandatory reporting system. Employers reported work loss from date of occupational
injury to the end of the calendar year for a sample of approximately 600,000 injury victims. All
cases reported involved at least one day of work loss beyond the date of the injury. Moreover, if
a worker still was out of work at the time the employer report was due to BLS, the report would
undercount work days lost. On average, BLS work-loss reports cover six months post injury.
Lawrence et al. (2000) used a Weibull regression model to estimate the total duration of work
loss for cases still open at the end of the survey reporting period. These results were combined
with those of the closed cases to estimate average work loss, conditional on having missed at
least one day of work. These BLS-based estimates were then combined with the pooled 1987-
1996 NHIS data on probability of work loss to compute mean work loss including cases without

Medical and Work Loss Cost Estimation Methods for the WISQARS Cost of Injury Module
24
work loss. Although BLS uses a detailed two-column coding system (body part, nature of
injury), Finkelstein et al. (2006) were able to map their codes to the ICD-9-CM codes. They
assigned the average work loss across all BLS cases to cases with ICD-9-CM diagnosis codes of
“Other Unspecified” or “Other Specified.” Averaged across all injuries, total estimated
temporary work loss was 24.5 days per injury.
Although the BLS data are limited to injuries that occur on the job, Finkelstein et al.’s
(2006) separate analysis of 1996-99 MEPS data (based on a much smaller sample)
found that the duration of work loss did not differ significantly by whether or not the
injury occurred on the job. This suggested that the BLS-NHIS work loss estimates
could credibly be applied to estimate work loss associated with non-work-related
injuries.
MEPS revealed that work-loss was roughly 5 times longer for hospitalized injuries
than non-hospitalized injuries. Using this ratio, Finkelstein et al. (2006) computed
work-loss durations for injuries separately for admitted and non-admitted cases.
Averaged across all injuries (including those with no work loss), the estimated
temporary work loss was 11.1 days per injury.
To place a monetary value on temporary wage work loss, the estimated days of work
lost were multiplied times average earnings per day of work, given the victim’s age
and sex, from the Current Population Survey, as described above in section 4.1.4
Household workdays lost were estimated as 90% of wage workdays lost, based on
findings from an unpublished nationally representative survey on household work losses
following injury (S. Marquis, the Rand Corporation, personal communication, 1992). This ratio
4 Source: www.bls.census.gov/cps/cpsmain.htm
Medical and Work Loss Cost Estimation Methods for the WISQARS Cost of Injury Module
25
and the value of household work used in Haddix et al. (2003), were used to impute a value to
household work lost.
The estimates in Haddix et al. (2003) value household production lost using replacement
cost. They started with national survey data on the average amount and nature of housework that
people do by age group and sex, for example the hours that a woman 30-34 years old spends on
cooking and on cleaning. They valued the cost of replacing these hours using BLS data on
average wage rate by occupation (e.g., for cooks and maids).
4.2.2 Long-term Work Losses
Finkelstein et al. (2006) considered permanent total disability and permanent partial
disability separately. For permanent total disability, the present value of age-and-sex-specific
lifetime earnings and household production from the fatality analysis were multiplied by the
probability of permanent disability for each type of injury. For permanent partial disability, the
earnings estimate times the probability of permanent partial disability was multiplied by an
additional factor identifying the percentage of disability resulting from that type of injury. The
results were then summed to compute the net work loss associated with permanent disability,
including total and partial disability.
The probabilities of permanent partial disability by body part and nature of injury were
from Miller, Pindus, Douglass, and Rossman (1995) and were based on pooled multi-state
Workers’ Compensation data from the 1979-1988 Detailed Claims Information (DCI) data base
of the National Council on Compensation Insurance (NCCI). The percent disabled came from
Lawrence et al. (2000) and was based on 1992-96 DCI data. DCI records the disability status for
each sampled case. Following Rice at al. (1989), Finkelstein et al. (2006) assumed that these
Medical and Work Loss Cost Estimation Methods for the WISQARS Cost of Injury Module
26
probabilities are the same for injuries that do and do not occur on the job and that these
probabilities have not changed significantly over time. This method also assumes that the
probability that an injury (e.g., a skull fracture) will cause someone never to do wage or
household work again is the same for children, adults, and the elderly (the years of work lost
obviously will vary with the age of onset) and that people will experience the same percentage
reduction in household work ability that they experience in wage work ability.
To verify that the DCI data produce reasonable estimates, Finkelstein et al. (2006)
conducted a literature review to compare their estimates to estimates from other sources. Due to
the paucity of data on this subject, they identified only a few sources with published disability
estimates, and these were generally dated and limited to specific populations.
Based on the limited information available, the DCI data suggested similar probabilities
of permanent disability to the other studies of long-term work loss. Although dated and restricted
to occupational injury, the DCI data have several advantages that outweigh their disadvantages.
As a result of their large sample, the DCI database can be used to compute probabilities for a far
wider range of specific diagnoses than all the disability studies in the literature combined.
Despite its restriction to occupational injury, the DCI sample also is more representative of the
mix of injuries admitted to hospitals than the few studies in the literature, notably those which
are restricted to patients triaged to trauma centers. The DCI data also are virtually the only
source of information about permanent disability due to injuries not admitted to the hospital. The
sample includes 318,885 medically treated, non-admitted patients with valid lost-work claims in
Workers’ Compensation. Averaged across all injuries, the estimated percentage of lifetime
productivity potential lost due to permanent injury-related disability was 0.26% per injury.

Medical and Work Loss Cost Estimation Methods for the WISQARS Cost of Injury Module
27
4.2.3 Calculating Total Work Loss Costs
The work loss costs were computed as described for all non-fatal injury cases in the 2005
HCUP-NIS and the 2007 HCUP-NEDS. Short- and long-term costs were summed to compute
total work loss costs. Similar to the procedure used for medical costs, average costs were
computed by age, sex, and NEISS diagnosis within the three major cause categories, sometimes
combining age/sex/diagnosis cells to ensure that estimates were produced for all cells.
5. Limitations of Methods for Medical and Work Loss Estimates
The WISQARS cost estimates are subject to several limitations. First, the estimates focus
exclusively on medical costs and work loss costs. They do not account for non-health costs (e.g.,
criminal justice, educational impacts, property damage etc.), pain and suffering, quality of life
loss, or injury costs borne by family and caretakers. Also excluded are costs due to mental
health, psychological treatment, and medical claims processing.
Second, a major limitation was the requirement to use data from a multitude of sources.
Although these were the best available data at the time of the analysis, some of the sources are
old, others are based on non-representative samples, and all are subject to reporting and
measurement error. These factors may have incorporated significant bias into the cost estimates.
The costing approach was designed to minimize the potential bias. However, more current and
nationally representative data would have been preferable but were not available.
Third, an additional limitation of having to use multiple data sets was the inability to
generate standard errors around the cost estimates. These costs are associated with great

Medical and Work Loss Cost Estimation Methods for the WISQARS Cost of Injury Module
28
uncertainty, and users are cautioned that the actual costs for any given injury category could be
substantially higher or lower than the WISQARS estimates.
The methods for estimating work loss costs had many additional limitations. Because
women, the elderly, and children have lower average earnings, the human capital approach
applied undervalued injuries to these groups. The approach also placed lower values on the work
of full-time homemakers than the work of people participating in the labor market, which further
depressed the value placed on women’s losses relative to men’s losses. It also undervalued
disability among those of retirement age, and did not value temporary disability among children,
as they had not yet entered the labor force. Discounting future work losses to present value
meant that the loss of a lifetime of work by a 2-year-old was considered equivalent to loss of a
lifetime of work by a 43-year-old. Although the child loses many more years of work, those
years are far in the future and heavily discounted. The work loss cost calculations are also based
on a year 2000 life table, which essentially assumes that life expectancy would have remained
constant over each person’s expected lifespan absent injury. Moreover, victims of serious and
fatal injury may tend to be risk-takers (for example, thrill-seekers, heavy drinkers, or drug
abusers) whose life expectancy may be shorter than for the average population, which would
further bias the results. And, as noted above, some of the estimates are computed using fairly
dated data that are based on a working population. Additionally, the estimates exclude the ability
to work lost by people other than the injured person. These losses may include the time family,
friends, and professionals spend caring for the injured, time spent investigating the injury, and
worker retraining. All of these limitations suggest that the costs should be interpreted with
caution.
Medical and Work Loss Cost Estimation Methods for the WISQARS Cost of Injury Module
29
References
Arias, E. (2002). United States Life Tables, 2000, National Vital Statistics Reports (Vol. 51) (3).
Hyattsville, MD: National Center for Health Statistics.
Berkowitz, M., Harvey, C., Greene, C., & Wilson, S. (1990). The economic consequences of
spinal cord injury. Washington, DC: Paralysis Society of America of the Paralyzed
Veterans of America.
Bureau of Labor Statistics. (2001). Highlights of Women's Earnings in 2000 (BLS Report 952).
Washington, DC: Bureau of Labor Statistics.
CDC/National Center for Health Statistics. (Last updated Aug 2009). NVSS (National Vital
Statistics System Homepage). Accessed August 13, 2009, from the World-Wide Web:
http://www.cdc.gov/nchs/nvss.htm
CDC/National Center for Health Statistics. (Last updated August 2009). ICD-9-CM
(Classification of Diseases and Functioning and Disability Homepage). CDC/National
Center for Health Statistics. Accessed August 29, 2009, from the World-Wide Web:
http://www.cdc.gov/nchs/icd.htm
Centers for Disease Control and Prevention. (2001). National estimates of nonfatal injuries
treated in hospital emergency departments – United States, 2000. Morbidity and
Mortality Weekly Report, 50, 340-346.
Centers for Disease Control and Prevention. (Last updated August 2009). CDC-WISQARS (Web-
based Injury Statistics Query and Reporting System). Accessed August 13, 2009, from
the World-Wide Web: http://www.cdc.gov/injury/wisqars/index.html
Centers for Disease Control and Prevention. (Last updated August 2009). CDC-WISQARS
(Proposed Matrix of E-code Groupings). Centers for Disease Control and Prevention.
Accessed August 29, 2009, from the World-Wide Web:
http://www.cdc.gov/injury/wisqars/ecode_matrix.html
Current Population Survey, March Supplement, various years. Washington, DC: U.S.
Department of Commerce, Bureau of the Census, 2006. Accessed October 13, 2011 from
DataFerrett: http://dataferrett.census.gov/index.html
Economic Report of the President, various years. (Last updated February 23, 2011). Washington:
Government Priting Office. Accessed October 17, 2011 from the Word-Wide Web:
http://www.gpoaccess.gov/eop/download.html
Edwards, C. M., Mackintosh, D. R., & Claid, D. (1981). Patient cost and economic burden due
to accidental injuries (Final report submitted to the Center for Environmental Health,
CDC, under Contract 200-79-0964). Washington, DC: National Institute for Advanced
Studies.

Medical and Work Loss Cost Estimation Methods for the WISQARS Cost of Injury Module
30
Finkelstein, E. A., Corso, P. C., Miller, T. R., Fiebelkorn, I. A., Zaloshnja, E., & Lawrence, B. A.
(2006). Incidence and Economic Burden of Injuries in the United States, 2000. New
York: Oxford University Press.
Friedman, B., De La Mare, J., Andrews, R., & McKenzie, D. H. (2002). Practical options for
estimating cost of hospital inpatient stays. Journal of Health Care Finance, 29(1), 1-13.
Gold, M. R., Siegel, J. E., Russell, L. B., & Weinstein, M. C. (Eds.). (1996). Cost-effectiveness in
Health and Medicine:Report of the Panel on Cost-Effectiveness in Health and Medicine.
New York, NY: Oxford University Press.
Haddix, A. C., Teutsch, S. M., & Corso, P. S. (2003). Prevention Effectiveness, A Guide to
Decision Analysis and Economic Evaluation. (Second ed.). New York: Oxford University
Press.
HCUP Databases. (Last updated Aug 2009a). HCUP-US-NIS (Healthcare Cost and Utilization
Project - Nationwide Inpatient Sample). Agency for Healthcare Research and Quality,
Rockville, MD. Accessed August 13, 2009, from the World-Wide Web:
http://www.hcup-us.ahrq.gov/nisoverview.jsp.
HCUP Databases. (Last updated Aug 2009b). HCUP-US-SEDD (Healthcare Cost and
Utilization Project - State Emergency Department Databases). Agency for Healthcare
Research and Quality, Rockville, MD. Accessed August 13, 2009, from the World-Wide
Web: http://www.hcup-us.ahrq.gov/seddoverview.jsp.
Lawrence, B. A., Miller, T. R., Jensen, A. F., Fisher, D. A., & Zamula, W. W. (2000). Estimating
the costs of non-fatal consumer product injuries in the United States. Injury Control &
Safety Promotion - 2000, 7(2), 97-113.
Miller, T. R., Langston, E. A., Lawrence, B. A., Becker, L. R., Snowden, C. B., Granger, C. V.,
Russell, C., Kreutzer, J. S., & Marwitz, J. (2004). Rehabilitation costs and long-term
consequences of motor vehicle injury (Draft Final Report). Washington, DC: National
Highway Traffic Safety Administration.
Miller, T. R., Lawrence, B. A., Jensen, A. F., Waehrer, G. M., Spicer, R. S., Lestina, D. C., &
Cohen, M. A. (2000a). The Consumer Product Safety Commission’s Revised Injury Cost
Model (Final Report to CPSC). Landover MD: Public Services Research Institute.
Miller, T. R., Pindus, N. M., Douglass, J. B., & Rossman, S. B. (1995). Databook on nonfatal
injury: Incidence, costs, and consequences. Washington, DC: The Urban Institute Press.
Miller, T. R., Romano, E. O., & Spicer, R. S. (2000b). The cost of childhood unintentional
injuries and the value of prevention. The Future of Children, 10(1), 137-163.
National Pediatric Trauma Registry. (2002). Biannual report, December 2001. Boston, MA:
Tufts University.
Medical and Work Loss Cost Estimation Methods for the WISQARS Cost of Injury Module
31
Rice, D. P., MacKenzie, E. J., Jones, A. S., Kaufman, S. R., deLissovoy, G. V., Max, W.,
McLoughlin, E., Miller, T. R., Robertson, L. S., Salkever, D. S., & Smith, G. S. (1989).
Cost of injury in the United States: A report to Congress. San Francisco, CA: Institute for
Health & Aging, University of California, and Injury Prevention Center, The Johns
Hopkins University.
Schroeder, T., & Ault, K. (2001). NEISS All Injury Program: Sample Design and
Implementation. Washington, DC: U.S. Consumer product Safety Commission.
US Consumer Product Safety Commission. (Last updated August 2009). NEISS (National
Electronic Injury Surveillance System). Accessed August 13, 2009, from the World-Wide
Web: http://www.cpsc.gov/LIBRARY/neiss.html
Wainer, H. (1976). Robust statistics: A survey and some prescriptions. Journal of Educational
Statistics, 1(4), 285-312.

Medical and Work Loss Cost Estimation Methods for the WISQARS Cost of Injury Module
32
Appendix I
Mapping between ICD-9-CM Codes and
NEISS Diagnosis and Body Part Codes
This Appendix describes the mapping technique between ICD-9-CM codes and NEISS
diagnosis and body part codes developed by Lawrence et al. (2000) under contract for CPSC. In
the HCUP datasets, diagnoses were coded using the International Classification of Diseases, 9th
Revision, Clinical Modification (ICD-9-CM), http://www.cdc.gov/nchs/icd.htm which uses a
single numeric code to represent each medical condition. NEISS, like many other specialized
systems for coding injury diagnoses, uses two separate codes to represent each condition: a
nature of injury code (e.g., burn, fracture, laceration) and a body part code. Therefore, to estimate
costs by NEISS diagnosis (nature of injury and body part), the ICD-9-CM primary injury
diagnosis of each HCUP case had to be mapped into NEISS codes.
Mapping is not a straightforward process because there is not a one-to-one
correspondence between codes in the two systems. In some instances, ICD-9-CM is more
detailed, while in other instances, NEISS is more detailed. For example, NEISS lumps all
poisonings into a single code, while ICD-9-CM has separate codes for more than 200 substances.
In this instance, many ICD-9-CM diagnoses are mapped to a single NEISS diagnosis. When
mapping from ICD-9-CM to NEISS, this is not a problem, as it results in a single NEISS
diagnosis for each HCUP case. On the other hand, NEISS distinguishes between six different
types of burns (electrical, scald, chemical, thermal, radiation, and unspecified), while ICD-9-CM
has just one category for burns. In this instance, a single ICD-9-CM diagnosis must be mapped to
six NEISS diagnoses. To handle this, the original HCUP burn case was transformed into six
Medical and Work Loss Cost Estimation Methods for the WISQARS Cost of Injury Module
33
cases, each with a different NEISS code. In order to maintain the original weighted case count
when mapping, each new NEISS-coded case received one-sixth of the original case weight.
Using the NEISS-coded versions of the HCUP datasets, mean costs then were calculated
by age group (0-19, 20-54, 55-69, 70+), sex (female, male), and NEISS diagnosis (31 two-digit
nature of injury codes and 26 two-digit body part codes, which combine to make 500-plus four-
digit diagnoses). In instances where cell counts were small, similar cells were combined, most
often by combining adjacent age groups, but sometimes by combining male and female or by
combining similar diagnoses. For a few nature of injury categories (e.g., amputation, crushing),
the HCUP cell counts were too small to obtain hospital-admitted costs by age, sex, and four-digit
diagnosis. For these cases, the hospital-admitted costs were computed using a two-step
procedure. First, the mean cost for each four-digit diagnosis code and the cost differentials by
age-sex for the entire nature of injury category (e.g. all burns) were estimated. Second, the age-
sex differentials for each category were applied to the average cost of each four-digit diagnosis
code to differentiate by age and sex.
In building the WISQARS costs, this process was applied using twelve datasets: two
admission statuses (hospital-admitted, ED-treated) by three cause groups and by two types of
costs (medical, work loss). The three cause groups were: motor vehicle traffic-related injuries,
intentional injuries (i.e., assaults and self-harm), and all other injuries (including unintentional,
non-motor-vehicle injuries and all injuries with missing cause codes or unknown intent). A few
diagnosis categories not commonly found among intentional and motor vehicle injuries – notably
burns – were not differentiated but were placed into the “all other injuries” category. The result
was a file of costs by admission status, cause group, NEISS nature of injury and body part, sex,
and age group. In order to test for completeness, the estimated costs were merged onto the 2005
Medical and Work Loss Cost Estimation Methods for the WISQARS Cost of Injury Module
34
NEISS-AIP data, revealing a number of cases with rare diagnoses without assigned costs. For
these cases with rare diagnoses, costs were copied from similar diagnoses. For cases where the
patient's sex or age was missing, average costs were estimated by age and NEISS diagnosis or by
sex and NEISS diagnosis, respectively. Using this approach, all individual NEISS-AIP cases for
the 2005 NEISS-AIP file were assigned medical and work loss costs.
Medical and Work Loss Cost Estimation Methods for the WISQARS Cost of Injury Module
35
Appendix II
Classification of Injury-Specific Diagnosis Groups by ICD-9-CM
Codes and the Multipliers to Estimate Short-Term Follow-up Costs
A. Multipliers for Short-Term Follow-up Costs for Admitted Patients
The fifteen injury-specific diagnosis groups and associated multipliers that were used for
estimating short-term follow up costs for admitted patients were as follows:
Group
No.
ICD-9-CM Diagnosis Codes Average Ratio of all
costs in the first 18
months after injury to
total inpatient costs
1 802, 830 1.02
2 800, 801,803, 804, 850-854 1.38
3 806, 952 2.13
4 805, 807-809, 839 1.12
5 810-819, 831-834 1.27
6 820, 835 1.38
7 821-829, 836-838 1.50
8 840-848 1.68
9 860-869 1.12
10 870-904 1.12
11 910-929 1.25
12 930-939, 950-958, 990-995 1.96
13 940-949 1.14
14 959 1.17
15 960-989 1.02
All 1.35

Medical and Work Loss Cost Estimation Methods for the WISQARS Cost of Injury Module
36
B. Multipliers for Short-Term Follow-up Costs for ED-Treated Patients
The fifty one injury-specific diagnosis groups and associated multipliers that were used
for estimating short-term follow up costs for injuries treated and released in emergency
departments were as follows:
Group
No.
ICD-9-CM
Diagnosis Codes
Average Ratio of all
costs in the first 18
months after injury
to total ED visit
costs
Group
No.
ICD-9-CM
Diagnosis Codes
Average Ratio of
all costs in the
first 18 months
after injury to
total ED visit costs
1 802, 830 2.47 27 851-854 1.38
2 800, 801, 803, 804 1.19 28 860-869 1.04
3 805-809 1.40 29 870-874 1.15
4 810-811 3.40 30 875-879 1.09
5 812 3.95 31 880-881 1.82
6 813 1.43 32 882 1.28
7 814 2.83 33 883 1.28
8 815-817 1.75 34 884-887 1.45
9 818-819 1.77 35 890-891, 894-897 1.35
10 820-822 2.01 36 892-893 1.18
11 823 2.31 37 900-904 2.73
12 824 2.19 38 910-919 1.29
13 825 1.77 39 920 1.02
14 826 1.69 40 921 1.33
15 827-829 1.38 41 922 1.32
16 831 2.44 42 923 1.28
17 832-833 3.96 43 924 1.49
18 834 1.36 44 925-929 1.53
19 835-839 1.27 45 930-934 1.11
20 840 5.44 46 935-939 1.74
21 841-842 1.22 47 940-949 1.93
22 843-844 2.25 48 950-958, 990-995 1.11
23 845 1.34 49 959 2.00
24 846-847 1.83 50 960-988 1.11
25 848 1.62 51 989 1.12
26 850 1.16 All 1.78