medium term budget policy statement
TRANSCRIPT

Medium Term Budget Policy Statement
2012
National Treasury
Republic of South Africa
25 October 2012

ii
ISBN: 978-0-621-41333-5 RP: 319/2012 The Medium Term Budget Policy Statement is compiled using the latest available information from departmental and other sources. Some of this information is unaudited or subject to revision. To obtain additional copies of this document, please contact:
Communications Directorate National Treasury Private Bag X115 Pretoria 0001 South Africa Tel: +27 12 315 5526 Fax: +27 12 315 5126
The document is also available on the internet at: www.treasury.gov.za

iii
Foreword South Africa’s economy has demonstrated resilience in the face of strong global headwinds. Our range of economic policies – from the New Growth Path to the Industrial Policy Action Plan – has positioned us to accelerate investment and employment in a framework of inclusive growth. Recent events, however, have put all emerging markets under pressure. A global slowdown rooted in the advanced economies of Europe and North America has pulled down economic growth in South Africa and other developing economies, including Brazil, China and India. At home, a combination of structural constraints in the economy, specific challenges related to the mining sector and the Marikana tragedy has led to lower economic growth prospects for 2012. As South Africans, we have a history of working together to resolve problems. Today we are making a commitment to reposition the economy and society. Earlier this month the President took the bold step of calling a summit of government, labour and business to find a way forward in the interests of all South Africans. In summary, participants agreed on a programme of action to: • Ignite growth and job creation.
• Invest in improving potential GDP growth, while taking necessary measures to promote inclusivity.
• Narrow inequality, especially between poor and upper-income groups.
• Implement our economic and social policies more effectively.
• Fix our education system, which is the ultimate guarantor of a better future for our children.
• Enhance the labour relations system based on lessons from the recent past.
• Help small and medium-sized businesses to grow, employ and export.
• Increase exports to narrow current account imbalances.
• Radically improve the living conditions of poor communities.
These matters will receive the attention of government over the three years covered by this Medium Term Budget Policy Statement. The fiscal framework proposed in this document reflects the constraints within which government is operating. These constraints make it imperative that we do things differently. To continue serving our people, government departments will need to live within our means. Spending needs to become more efficient and achieve value for money. Wastage of taxpayers’ money must come to an end. Corruption in procurement will be identified and dealt with in the strongest possible manner. Working together, we can achieve these goals and more, and walk the path to national prosperity.
Pravin J Gordhan Minister of Finance

iv
Contents Chapter 1 Levers of development: opportunities and challenges .................................. 1 Introduction ........................................................................................................... 1 Overview of the 2012 policy statement ................................................................. 4 Conclusion ........................................................................................................... 8 Chapter 2 Economic outlook ............................................................................................... 9 Introduction ........................................................................................................... 9 The global economy .............................................................................................. 10 Domestic economic trends and outlook ................................................................ 12 A path to higher growth ......................................................................................... 19 Conclusion ............................................................................................................ 20 Chapter 3 Fiscal policy and trends ..................................................................................... 21 Securing South Africa’s fiscal footing .................................................................... 21 Fiscal policy objectives .......................................................................................... 24 Fiscal framework ................................................................................................... 28 Conclusion ............................................................................................................ 32 Chapter 4 Medium-term expenditure framework and division of revenue ..................... 33 Introduction ........................................................................................................... 33 2011/12 outcomes and 2012/13 mid-year estimates ............................................ 34 Division of revenue, 2013/14 – 2015/16 ............................................................... 36 Medium-term expenditure framework ................................................................... 42 Conclusion ............................................................................................................ 48 Annexure A 2011/12 outcome and half-year spending estimates for 2012/13 ................... 49 Glossary .............................................................................................................................. 53

v
Tables
1.1 Macroeconomic projections, 2011 – 2015 ................................................................. 51.2 Consolidated government fiscal framework, 2011/12 – 2015/16 ............................... 61.3 Division of revenue, 2012/13 – 2015/16 .................................................................... 71.4 Consolidated government expenditure, 2012/13 – 2015/16 ...................................... 7 2.1 Annual percentage change in GDP and consumer price inflation, selected
regions/countries, 2012 – 2014 .................................................................................. 102.2 Macroeconomic performance and projections, 2009 – 2015 ..................................... 132.3 Macroeconomic projections, 2011/12 – 2015/16 ....................................................... 132.4 Contribution to gross domestic expenditure growth, 2008 – 2012 ............................ 142.5 Performance of exports by destination, 2000 – 2012 ................................................ 162.6 Balance of payments, 2007 – 2012 ........................................................................... 17 3.1 Main budget non-interest expenditure plans, 2010/11 – 2015/16 ............................. 253.2 Consolidated fiscal framework, 2010/11 – 2015/16 ................................................... 283.3 Total tax and budget revenue, 2011/12 – 2013/14 .................................................... 293.4 Total national government debt, 2009/10 – 2015/16 ................................................. 303.5 Main budget net borrowing requirement and financing, 2011/12 – 2015/16 ............. 30 4.1 National and provincial expenditure: 2011/12 outcomes and 2012/13 mid-year
estimates .................................................................................................................... 354.2 Main budget framework, 2009/10 – 2015/16 ............................................................. 374.3 Division of revenue, 2012/13 – 2015/16 .................................................................... 384.4 Consolidated government expenditure, 2011/12 – 2015/16 ...................................... 414.5 Social grants beneficiary projections, 2012/13 – 2015/16 ......................................... 424.6 Performance indicators, education and related function ............................................ 43 Figures
2.1 Manufacturing performance by subsector, 2007-2012 .............................................. 142.2 Public- and private-sector contributions to GDP growth, 2004 - 2012 ....................... 15 3.1 Fiscal performance and projections ........................................................................... 223.2 Stock of government debt, 2005/06 – 2016/17 .......................................................... 253.3 Forward estimates compared with budget outcomes, 2009/10 – 2012/13 ................ 31 4.1 Households with access to water and sanitation ....................................................... 444.2 Expanded public works programme: non-financial performance and targets,
2008/09 – 2013/14 ..................................................................................................... 454.3 Electricity backlogs by province ................................................................................. 46

vi

1
1 Levers of development: opportunities and challenges
In brief • The proposed framework for the 2013 Budget has been prepared in an environment of continued
economic uncertainty. Growth has slowed in both advanced and developing economies, and recent domestic events have underlined the urgent need to accelerate South Africa’s social transformation.
• Despite this challenging environment, South Africa’s economy has continued to grow, supported by sound monetary and fiscal policies grounded in a stable institutional framework.
• Gross domestic product (GDP) growth is projected at 2.5 per cent this year – slightly lower than the 2.7 per cent forecast in the 2012 Budget. Growth is expected to improve to about 4 per cent in 2015.
• The proposed fiscal framework presents a disciplined spending trajectory, partially financed through a budget deficit of 4.5 per cent of GDP in 2013/14, which narrows to 3.1 per cent of GDP in 2015/16 as the economic recovery gains momentum.
Introduction
outh Africa faces a confluence of difficult global and domestic challenges over the period ahead. These reflect the stage of development at which we find ourselves. The mining sector needs
to modernise and industries have to compete. Labour needs the skills to function in the global economy. Communities need to overcome barriers to social cohesion. And the state must improve its ability to promote inclusive development in a highly unequal society.
The Medium Term Budget Policy Statement sets out government’s view of the fiscal and economic dimensions of these imperatives.
Achieving the inclusive society envisioned in the Constitution depends on bringing about an efficient developmental state that helps to build capabilities throughout the economy and society, while intervening to redress historical inequalities. It requires a growing economy that generates jobs and economic opportunities for all. And it will take
S Confronting the challenges of development in a highly unequal society

2012 MEDIUM TERM BUDGET POLICY STATEMENT
2
commitment, hard work and resilience to radically improve the prospects of all South Africans.
The National Development Plan, endorsed by Cabinet in September of this year, sets out an approach to development leading up to 2030. It provides government with a clear and progressive foundation on which to develop the work of the state and align the public finances.
The medium-term expenditure framework (MTEF) proposed for the 2013 Budget takes the National Development Plan as a point of departure. Government recognises that choices have to be made within prudent fiscal limits shaped by the current circumstances, while laying the foundations on which to build in future budgets.
Critical actions to promote growth and development
The National Development Plan sets out 10 “critical actions” on which government policy can proceed in partnership with the private sector, trade unions and civil society:
• A social compact to reduce poverty and inequality, and raise employment and investment.
• A strategy to address poverty and its effects by broadening access to employment, strengthening the social wage, improving public transport and raising rural incomes.
• Steps by the state to professionalise the public service, strengthen accountability, improve coordination and prosecute corruption.
• Boost private investment in labour-intensive areas, competitiveness and exports, with adjustments to lower the risk of hiring younger workers.
• An education accountability chain, with lines of responsibility from state to classroom.
• Phase in national health insurance, with a focus on upgrading public health facilities, producing more health professionals and reducing the relative cost of private health care.
• Public infrastructure investment to reach 10 per cent of GDP, financed through tariffs, public-private partnerships, taxes and loans and focused on transport, energy and water.
• Interventions to ensure environmental sustainability and resilience to future shocks.
• New spatial norms and standards – densifying cities, improving transport, locating jobs closer to where people live, upgrading informal settlements and fixing housing market gaps.
• Reduce crime by strengthening criminal justice and improving community environments.
Policies, plans and actions for change
South Africa’s record of sound macroeconomic and fiscal management means that government is able to confront the complexities of the present economic environment from a position of strength. The long-term structural reforms outlined in the National Development Plan are complemented by the nearer-term goals set out in the New Growth Path and the Industrial Policy Action Plan, and the work of the Presidential Infrastructure Coordinating Commission.
Strengthening the arrangements through which planning, cooperation and implementation are achieved will be a key determinant of progress in implementing these plans. An initiative by the President has recently brought together government, business and labour representatives to respond with urgency to the underlying causes of worker discontent and civil unrest, and to find collaborative solutions to address the country’s longer-term economic and social needs.
In the near term, the global economic context is not expected to be supportive of more rapid domestic growth. Following the initial recovery
National Development Plan provides a clear, progressive approach for long-term development
Arrangements for planning, cooperation and implementation are being strengthened
CHAPTER 1: LEVERS OF DEVELOPMENT: OPPORTUNITIES AND CHALLENGES
3
from the 2008-2009 recession, growth has slowed in both advanced and developing economies. Yet there are clear opportunities for expansion and realignment in the period ahead. Trade and investment in many sub-Saharan African economies are buoyant, world food demand is increasing, and industrial production linkages and service sectors are becoming more globally integrated.
South Africa has plans and programmes to address the structural impediments to more rapid participation in these developments, including:
• Construction of new power plants to provide adequate electricity.
• Expansion of rail lines serving export markets and improvements of the efficiency of transport logistics.
• Efforts to promote skills development.
• Programmes to boost agricultural production.
• Initiatives to overcome deficiencies in land and housing markets.
• Approaches to eliminate hurdles to small business development.
These initiatives will take place within a disciplined spending trajectory partially financed through a budget deficit of 4.5 per cent of GDP in 2013/14, narrowing to 3.1 per cent of GDP in line with improved economic growth by 2015/16.
Sound institutional framework
South Africa has a sound institutional framework built on the foundation of the Constitution. It has proven resilient and capable of mediating the contradictions that accompany development in an unequal and sometimes fractious society. Four successful national elections have given practical expression to the country’s commitment to democracy. Vigorous contest between political parties has enabled diverse communities to express themselves in the national debate. The Chapter 9 institutions established by the Constitution, such as the Public Protector and the Auditor-General, regularly assert their independence in safeguarding democratic practice. The judiciary pursues its mandate with vigour. A free media and civil society organisations play a vital role in keeping South Africans informed and empowered to make their own choices.
Government’s record of sound fiscal management and transparent budget practices has been strengthened by legislative reforms that enhance the contribution of Parliament to public finance management. Fiscal guidelines ground the management of revenue and expenditure in a sustainable countercyclical policy framework. Building on these guidelines, the National Treasury is preparing a long-term fiscal report to enhance the policy debate and make explicit the implications of new public finance initiatives for future generations.
Developmental role of the state
The state has a critical role to play in development. In South Africa’s circumstances, this is partly a consequence of historical legacies that have to be addressed. But it is also shaped by forward-looking imperatives. Good-quality public services, economic infrastructure and investment in
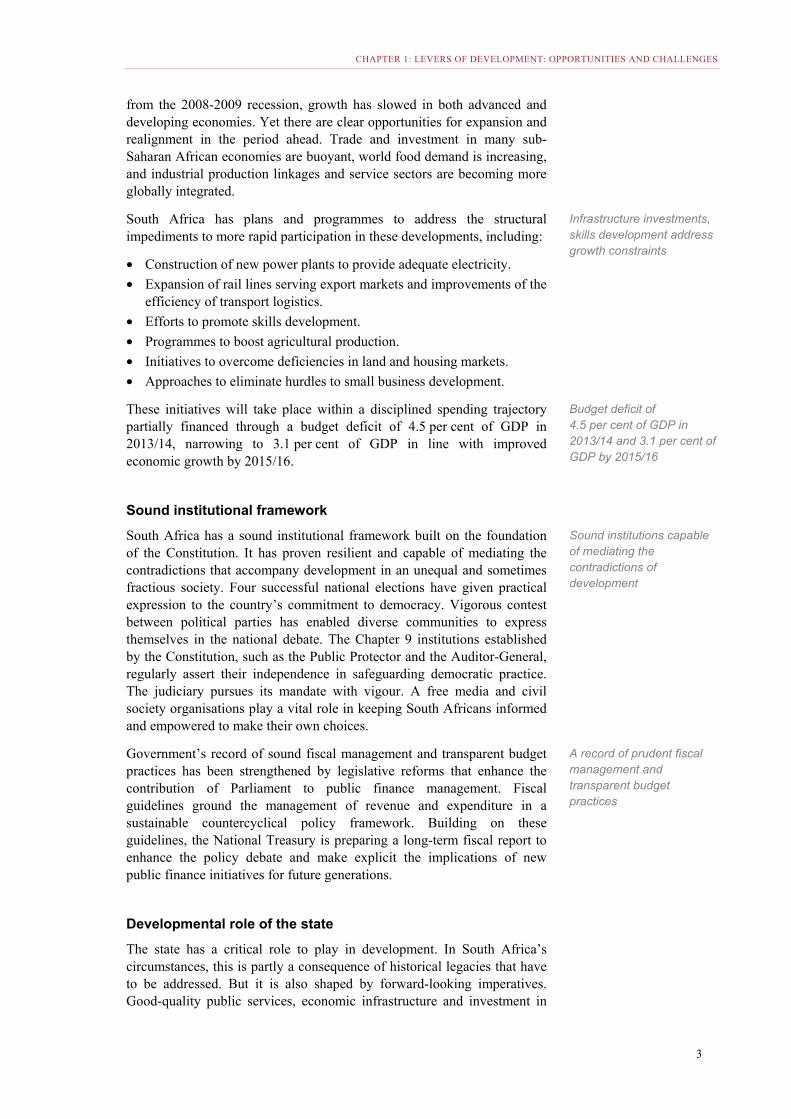
Infrastructure investments, skills development address growth constraints
Budget deficit of 4.5 per cent of GDP in 2013/14 and 3.1 per cent of GDP by 2015/16
Sound institutions capable of mediating the contradictions of development
A record of prudent fiscal management and transparent budget practices

2012 MEDIUM TERM BUDGET POLICY STATEMENT
4
human resources are crucial to achieving growth and broad-based development. Such services are needed to ensure that poor communities can participate in a modernising economy. It is also the role of the state to ensure that the interests of all South Africans – including those without effective voice – are balanced constructively, within an inclusive vision of our shared future.
Over the MTEF period, further steps will be taken to strengthen the capacity and efficiency of government departments. Particular attention will be paid to implementing reforms in provincial and municipal infrastructure planning and delivery.
Government will also step up its efforts to combat waste, inefficiency and corruption. Reforms will focus on procurement systems that prioritise value for money and strengthening the anti-corruption system as a whole.
Overview of the 2012 policy statement
The Medium Term Budget Policy Statement is a part of South Africa’s institutional framework. It broadly serves four purposes:
• To outline the economic context in which the forthcoming government budget is being formulated.
• To explain fiscal policy in the context of the economic outlook.
• To present the division of nationally collected revenue between national, provincial and local government.
• To propose government’s spending framework for the next three years.
This information is presented to Parliament and for public debate to ensure that the processes by which the government arrives at its budget are transparent, aligned with economic circumstances and address policy priorities within a sustainable financial framework.
Economic outlook
Chapter 2 discusses the economic outlook.
Since 2008, private- and public-sector deleveraging in many advanced economies has acted as a brake on growth, affecting many developing economies – including China, India and Brazil. Likewise, the South African economy has yet to recover to the higher levels of growth and broadening participation achieved in the years leading up to the recession.
Sustaining a stronger economic recovery will require both a resolution of global economic challenges – particularly the crisis in Europe and weak growth prospects in the United States – and greater progress in addressing South Africa’s structural and economic policy challenges.
The South African economy is projected to grow by 2.5 per cent in 2012. By 2014, GDP growth is expected to reach 3.8 per cent, supported by expanding public-sector investment in infrastructure, the activation of new electricity-generating capacity, improving private-sector confidence, relatively low inflation and interest rates, and strong growth in the southern African region.
New steps to combat waste, inefficiency and corruption in the state
Proposing government’s spending framework for the next three years
Stronger recovery depends on resolution of global challenges and progress in addressing structural constraints at home

CHAPTER 1: LEVERS OF DEVELOPMENT: OPPORTUNITIES AND CHALLENGES
5
To improve confidence in the economy, expand trade and investment, increase employment and broaden participation in the economic recovery, government will target progress in several areas:
• Re-establishing orderly labour relations
• Investing in strategic infrastructure programmes, including energy generation and transport capacity needed to open up new mining and industrial opportunities
• Strengthening municipal finances, and investing in residential development and urban infrastructure
• Promoting special economic zones with industrial and export development potential
• Accelerating youth employment opportunities
• Improving living conditions for miners and upgrading informal settlements
• Shifting the export mix towards emerging markets, with particular focus on expanding trade and investment on the African continent
• Providing agricultural support and promoting small business development.
Prudent fiscal management, a flexible exchange rate and an effective inflation targeting regime serve as the macroeconomic foundation for these reforms. Sectoral strategies and priorities identified in the National Development Plan will, over time, be translated into practical programmes and policies, drawing on the capacity and initiative of both the public and private sectors.
Fiscal policy and trends
Chapter 3 discusses fiscal policy and trends.
South Africa’s fiscal framework remains grounded in a sustainable, countercyclical approach to managing revenue and expenditure. Spending growth will be well contained over the medium term. Key social and economic programmes will be continued, complemented by efforts to improve the quality of spending.
Fiscal policy will narrow the budget deficit from a projected 4.8 per cent of GDP in 2012/13 to 3.1 per cent of GDP in 2015/16, enabling government to rebuild fiscal space. In addition, three policy objectives will be targeted:
Table 1.1 Macroeconomic projections, 2011 – 20152011 2012 2013 2014 2015
Calendar year Actual Estimate Forecast
Percentage change unless otherwise indicated
Final household consumption 5.0 3.4 3.5 4.0 4.2
Gross fixed capital formation 4.4 5.2 4.5 5.1 5.8
Real GDP growth 3.1 2.5 3.0 3.8 4.1
GDP at current prices (R billion) 2 964.3 3 202.5 3 513.5 3 868.9 4 263.9
CPI inflation 5.0 5.7 5.5 5.1 4.9
Current account balance (% of GDP) -3.3 -5.9 -5.8 -5.5 -5.5
Prudent fiscal management, flexible exchange rate and inflation targeting provide solid foundation for reforms
Spending growth will be well contained over the medium term
2012 MEDIUM TERM BUDGET POLICY STATEMENT
6
• Ensuring that expenditure grows at a moderate pace. Government has decided that there will be no upward adjustment of the spending projection set out in the 2012 Budget over the first two years of the MTEF, with moderate growth in the outer year.
• Stabilising public debt. This will require a significant reduction in the deficit. The combination of slower spending growth and recovery in revenue as economic growth gathers pace will stabilise debt as a percentage of GDP by 2015/16.
• Improving the impact of spending, including by shifting the balance of resource allocation towards investment in infrastructure.
As the economic context changes over the medium term, government will realign its policy stance, firmly grounded in a sustainable budget structure that promotes growth, equity and employment.
If the economic environment deteriorates, government will need to reconsider current expenditure and revenue growth plans. In a lower-growth scenario, an appropriate balance between spending restraint and new revenue initiatives would be necessary. In either case, the necessary adjustments will avoid an unwarranted early withdrawal of fiscal support.
Medium-term expenditure framework and division of revenue
Chapter 4 discusses the MTEF and the division of revenue.
Government’s ability to support accelerated growth and employment, and to reduce poverty and inequality, is not primarily limited by the quantity of funds available. Over the past decade, government spending excluding inflation has doubled, significantly expanding access to education, health, basic services and social grants. However, there has not always been a commensurate increase in the quality of public services or in the performance of the public sector itself. Making progress in the delivery of public services requires greater focus on the use of existing allocations, and a shift in the composition of spending from current consumption towards capital investment. These changes are particularly important given current fiscal constraints.
The proposed spending framework approved by Cabinet takes account of the need to control growth in spending while increasing the efficiency of existing allocations to improve public services. As a result, the fiscus does not increase available funds beyond the 2012 budget baseline.
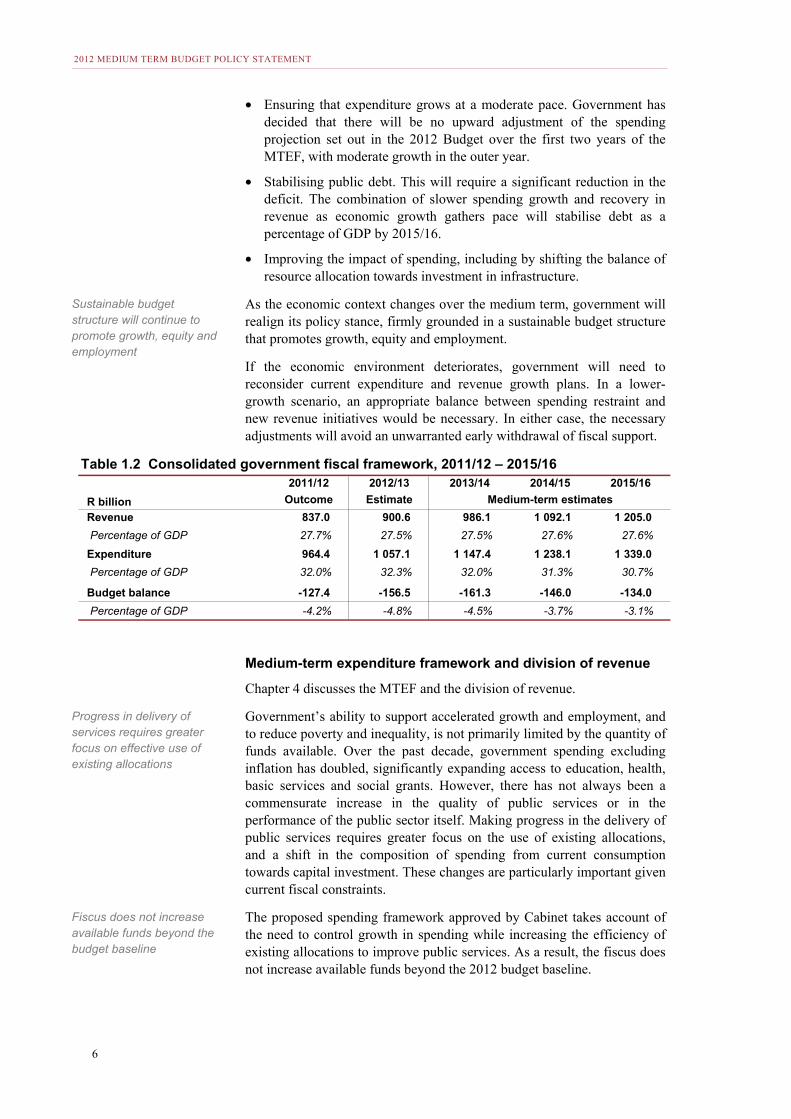
Table 1.2 Consolidated government fiscal framework, 2011/12 – 2015/162011/12 2012/13 2013/14 2014/15 2015/16
R billion Outcome Estimate Medium-term estimates
Revenue 837.0 900.6 986.1 1 092.1 1 205.0
Percentage of GDP 27.7% 27.5% 27.5% 27.6% 27.6%
Expenditure 964.4 1 057.1 1 147.4 1 238.1 1 339.0
Percentage of GDP 32.0% 32.3% 32.0% 31.3% 30.7%
Budget balance -127.4 -156.5 -161.3 -146.0 -134.0
Percentage of GDP -4.2% -4.8% -4.5% -3.7% -3.1%
Sustainable budget structure will continue to promote growth, equity and employment
Progress in delivery of services requires greater focus on effective use of existing allocations
Fiscus does not increase available funds beyond the budget baseline

CHAPTER 1: LEVERS OF DEVELOPMENT: OPPORTUNITIES AND CHALLENGES
7
Departments have reprioritised spending away from programmes that are not meeting performance requirements or that are not closely aligned to departmental mandates. Government has also asked national and provincial departments to reduce expenditure where possible over the medium term so that these funds can be reallocated to infrastructure and other priorities.
Over the next three years reprioritisation of funds by departments amounts to about R40 billion. This money, combined with drawdowns in the contingency reserve, will allow for the revision of budget baselines without any increase in government spending. Funds are shared between national, provincial and local government, enabling them to meet the higher costs of the public-sector wage settlement and give effect to government priorities.
Table 1.3 Division of revenue, 2012/13 – 2015/16R billion 2012/13 2013/14 2014/15 2015/16
National allocations 412.3 446.6 481.4 510.4
Provincial allocations 388.9 417.9 447.5 477.9
Equitable share 313.0 335.3 357.3 378.8
Conditional grants 75.9 82.7 90.2 99.1
Local government allocations 77.5 84.5 91.6 100.7
Total allocations 878.7 949.0 1 020.5 1 089.0
Changes to baseline
National allocations -0.1 0.3 2.6 13.5
Provincial allocations 4.4 6.8 10.5 20.8
Equitable share 4.0 6.3 8.0 13.4
Conditional grants 0.5 0.5 2.5 7.4
Local government allocations 0.1 0.7 0.9 5.8
Total 4.5 7.9 14.0 40.1
Table 1.4 Consolidated government expenditure, 2012/13 – 2015/162012/13 2013/14 2014/15 2015/16 Average
annual growth
R billionRevised estimate
Budget estimate 2012/13 –2015/16
General public services 53.3 56.0 59.6 62.1 5.2%
Defence and state security 42.0 44.7 47.4 50.2 6.1%
Public order and safety 99.7 107.0 113.2 119.7 6.3%
Transport, energy and communication 83.5 91.5 98.8 105.1 7.9%
Economic services 44.6 48.1 50.4 52.6 5.6%
Local government, housing and community amenities
121.7 132.5 144.5 157.5 9.0%
Health and social protection 246.2 267.8 287.5 306.4 7.6%
Education and related functions 220.0 234.0 250.5 268.9 6.9%
Employment and social security 43.0 48.6 53.9 55.9 9.1%
Science and technology 14.1 14.5 15.4 16.0 4.1%
Contingency reserve – 4.0 10.0 30.0
Non-interest expenditure 968.3 1 048.8 1 131.3 1 224.2 8.1%
State debt cost 88.8 98.6 106.8 114.8 8.9%
Total expenditure 1 057.1 1 147.4 1 238.1 1 339.0 8.2%
Reprioritisation and drawdowns on contingency reserve allow for revisions to budget baselines without increased spending

2012 MEDIUM TERM BUDGET POLICY STATEMENT
8
Conclusion
Challenging times require South Africans to unify and give effect to the sound plans that we have developed. While the global outlook is not expected to improve markedly in the short term, there are many areas of opportunity. A range of plans and programmes is addressing the structural impediments to more rapid participation in these developments, including expansion of economic infrastructure, and efforts to grow trade and investment on the African continent.
The proposed framework for the 2013 Budget recognises the need for a further shift in the composition of spending to contribute to these reforms. This will take place within a disciplined spending trajectory consistent with long-term fiscal sustainability.
Government plans and programmes are addressing the structural impediments to more rapid growth

9
2 Economic outlook
In brief
• South Africa’s economy continues to grow in a weak global economic environment. Real GDP growth is projected at 2.5 per cent in 2012 and 3.0 per cent in 2013, rising to 4.1 per cent in 2015. Global growth is expected to reach 3.6 per cent, and sub-Saharan Africa 5.7 per cent, in 2013.
• Over the medium term, sustained public-sector infrastructure investment, the activation of new electricity-generating capacity, low inflation and interest rates, and continued growth in the region will contribute to an improved economic performance.
• Although rising food and petrol prices, in combination with a weaker rand, will put upward pressure on prices, consumer price inflation should remain within the targeted band over the next three years.
• The current account deficit is expected to widen to 5.9 per cent of GDP in 2012 as the trade balance deteriorates, narrowing to 5.5 per cent in the outer year of the forecast.
• Domestic structural constraints and imbalances are the main obstacles to faster growth. Implementation of the National Development Plan will begin to address these challenges.
Introduction
he global economy is undergoing a difficult adjustment to the extended period of weaker growth and increased volatility ushered in by the financial crisis that began in 2008. A lengthy period of
deleveraging in advanced economies is expected to act as a brake on growth, circumscribing trade and investment. These trends have resulted in a slowdown in developing economies – including China, India and Brazil.
In this challenging environment, South Africa’s economy has displayed resilience and has continued to expand at a moderate pace. The National Treasury projects real GDP growth of 2.5 per cent in 2012 – slightly lower than the 2.7 per cent forecast in the 2012 Budget. Economic growth is expected to remain muted in 2013 at 3.0 per cent, picking up to 3.8 per cent in 2014 and 4.1 per cent in 2015. Far more rapid growth is needed to draw large numbers of unemployed South Africans into economic activity.
The global economy is adjusting to a prolonged period of weaker growth and higher volatility
T

2012 MEDIUM TERM BUDGET POLICY STATEMENT
10
Each country has its own history and economic challenges. As recent events have underlined, the primary obstacles to South Africa achieving faster, more inclusive growth and reducing inequality are rooted in the domestic economy. Strike activity in mining and other sectors, the balance between electricity supply and demand, weak business confidence and a widening current account deficit reflect a series of binding constraints and unsustainable imbalances that hold back investment and job creation.
South Africa has a sound foundation from which to address these challenges. Macroeconomic policy settings and institutions will continue to promote stability, certainty and confidence. Prudent fiscal policy will continue to promote countercyclicality, debt sustainability and intergenerational equity. Flexible monetary policy will balance low and stable inflation with support for growth and financial stability. Macroeconomic policy remains supportive of economic activity, but on its own cannot generate the growth or jobs required to make inroads into high levels of poverty and inequality. Complementary reforms that address structural impediments are vital to raise employment levels and broaden participation, lift competitiveness and promote social cohesion.
The National Development Plan, endorsed earlier this year by Cabinet, outlines an approach to eliminate poverty and reduce inequality by raising levels of employment, productivity and earnings. The key levers it identifies are creating jobs through faster growth, improving the quality of education, skills development and innovation, and building the capability of the state to implement policy and deliver services effectively.
The global economy
The global economic outlook has weakened, with a broad-based slowdown in both advanced and emerging economies. The International Monetary Fund (IMF) projects global growth of 3.3 per cent in 2012, down from 3.8 per cent in 2011, with a modest pick-up in 2013.
Table 2.1 Annual percentage change in GDP and consumer price inflation,
selected regions/countries, 2012 – 2014Region / country 2012 2013 2014 2012 2013 2014
Percentage GDP projections1 CPI projections1
World 3.3 3.6 4.1 4.0 3.7 3.6
Advanced economies 1.3 1.5 2.3 1.9 1.6 1.8
US 2.2 2.1 2.9 2.0 1.8 1.8
Euro area -0.4 0.2 1.2 2.3 1.6 1.4
UK -0.4 1.1 2.2 2.7 1.9 1.7
Japan 2.2 1.2 1.1 0.0 -0.2 2.1
Emerging markets and developing countries
5.3 5.6 5.9 6.1 5.8 5.3
Brazil 1.5 4.0 4.2 5.2 4.9 4.8
Russia 3.7 3.8 3.9 5.1 6.6 6.5
India 4.9 6.0 6.4 10.3 9.6 8.3
China 7.8 8.2 8.5 3.0 3.0 3.0
Sub-Saharan Africa 5.0 5.7 5.5 9.1 7.1 6.1
South Africa2 2.5 3.0 3.8 5.7 5.5 5.1
1. IMF World Economic Outlook, October 20122. National Treasury forecasts
Main obstacles to faster, more inclusive growth are largely rooted in domestic economy
National Development Plan outlines an approach to eliminate poverty and reduce inequality

CHAPTER 2: ECONOMIC OUTLOOK
11
The IMF describes the chance of a steeper slowdown as “alarmingly high” given uncertainty about growth prospects in Europe and the United States. Economic growth in developed countries is expected to remain anaemic (1.3 per cent in 2012 and 1.5 per cent in 2013) compared with relatively stronger growth in developing countries (5.3 per cent and 5.6 per cent).
Weak near-term prospects for advanced economies
High bond yields, banking-sector distress and severe pressure on sovereign balance sheets have depressed growth in the euro area. This decline has been most severe in Greece, Portugal and Italy, while Spain remains at the centre of the crisis. There are also signs of faltering growth in Germany, Europe’s largest economy. Economic growth in the euro area is projected at just 0.2 per cent in 2013. The effect of current policy measures to relieve the crisis, including intervention by the European Central Bank, is uncertain, as are initiatives to promote a fiscal and banking union.
US economic growth remains weak, with consumption subdued in the face of a fragile labour market. The US Federal Reserve recently announced its third round of “quantitative easing”, which aims to stimulate economic activity through the purchase of mortgage-backed securities from commercial banks. Interest rates will remain near zero until 2015. In coming months, the world’s largest economy could face a new hurdle if it fails to avert a “fiscal cliff” – automatic spending cuts and tax increases due to come into effect from January 2013.
Unconventional measures employed by central banks in Europe, the US and Japan that aim to stimulate growth have provided some relief and contributed to market buoyancy. These measures, however, have not been able to offset the growth-reducing impact of front-loaded fiscal consolidation and austerity, alongside private-sector deleveraging.
Slowdown in emerging markets, but good prospects for Africa
Over the past year, economic growth has weakened in emerging markets. China, India and Brazil have experienced a slowdown in production and exports.
Policy responses to support growth in Brazil, India and China
In response to stalling growth, Brazil has cut its main interest rate by 5.25 percentage points to 7.25 per cent since August 2011 and eased controls on capital inflows. Large-scale infrastructure investment plans include significant private-sector concessions on federal roads and railways, while extended tax breaks and reduced electricity prices in 2013 should provide a boost for businesses and consumers.
China’s leaders have reduced the government’s growth target from 8 per cent to 7.5 per cent. Current policy measures aim to stabilise growth. Aggressive stimulus policies adopted early during the financial crisis generated large imbalances and excess capacity in the economy. The authorities are wary of similar outcomes arising from a response to the current slowdown.
In India, policy space is constrained by high inflation, and large fiscal and current account deficits. Authorities have announced several structural reforms, including a rise in fuel prices to reduce fiscal strains, small-scale privatisation and easing restrictions on foreign ownership in aviation, broadcasting, energy and retail.
Developing countries are expected to achieve strong growth in comparison with developed countries
Eurozone sovereign debt and banking crises remain major risks to global economic outlook
‘A dramatic tightening of the deficit by about 4 per cent of GDP next year … would effectively plunge the [US] off a “fiscal cliff”’. — Christine Lagarde, Managing Director, IMF

2012 MEDIUM TERM BUDGET POLICY STATEMENT
12
Global commodity prices have softened over the past year in line with reduced demand from China and India. High levels of global liquidity, however, reinforced by aggressive actions by major central banks, have supported “safe-haven” assets such as gold. The gold price has increased by 13 per cent since the start of the year, reaching US$1 770/oz in mid-October. The oil price remains volatile and a risk to the recovery, while global food prices have risen significantly in response to supply shocks.
Sub-Saharan Africa has continued to grow, but exports will be affected by slower growth in China and lower commodity prices. Political stability, improved economic management and a sustained period of relatively high commodity prices have contributed to a marked rise in global investment into Africa. Growth in the region is projected to average 5.0 per cent in 2012 and 5.7 per cent in 2013; growth in Mozambique, Ghana and Zambia is expected to average above 7.5 per cent over the next five years.
Impact of global food price surge
World agricultural commodity prices have surged since July this year, following drought conditions in the US and Russia. Domestic prices of corn, wheat and soybean spiked in August and are currently 69 per cent, 10 per cent and 17 per cent higher than their levels in May.
Food inflation by category, 2007 – 2012 Global food prices are expected to push domestic inflation higher over the next six to 12 months, but not as dramatically as during the 2008 food price crisis. Food price inflation is expected to average about 9 per cent in 2013, up from 5.1 per cent in August 2012.
The poorest 20 per cent of households spend about 40 per cent of their income on food. Existing government measures, such as the school nutrition programme, help protect vulnerable households.
Over the long term, an adequate and affordable food supply depends on increasing productivity in agriculture and creating a favourable environment for investment to increase production. Ensuring competition in the food supply chain is important to reduce mark-ups and limit price shocks to consumers.
-20
-10
0
10
20
30
40
50
60
70
2007
2008
2009
2010
2011
2012
Perc
enta
ge ch
ange
CPI foodBread and cerealMeatFishOils and fats
Source: Statistics South Africa
Domestic economic trends and outlook
Widespread strikes in the mining sector have had a significant effect on the economy in 2012. The events at Lonmin’s Marikana mine and the spread of industrial action since August have dented confidence and lowered growth prospects for the remainder of the year.
GDP growth is expected to improve over the medium term. Real GDP growth is forecast to average 2.5 per cent in 2012 and 3 per cent in 2013, rising to 4.1 per cent in 2015. Factors expected to contribute to an improved performance include expanded infrastructure investment, the activation of new electricity-generating capacity, relatively low inflation and interest rates, and strong regional growth. A substantial accumulation of cash in the corporate sector can fund additional investment as business confidence improves. Government is actively working to find effective ways to partner with the private sector to promote investment.
Gold price has increased by 13 per cent since the start of the year to US$1 770/oz
Sub-Saharan Africa will continue to benefit from marked increase in global investment
Capital investment, new power plants, low inflation and regional exports will boost GDP growth

CHAPTER 2: ECONOMIC OUTLOOK
13
Medium-term macroeconomic projections are set out below.
Table 2.2 Macroeconomic performance and projections, 2009 – 20152009 2010 2011 2012 2013 2014 2015
Calendar year Actual Estimate Forecast
Percentage change unless otherwise indicated
Final household consumption -1.6 3.7 5.0 3.4 3.5 4.0 4.2
Final government consumption 4.7 4.9 4.5 3.7 3.5 3.5 3.2
Gross fixed-capital formation -3.2 -1.6 4.4 5.2 4.5 5.1 5.8
Gross domestic expenditure -1.6 4.2 4.3 4.1 3.8 4.4 4.7
Exports -19.5 4.5 5.9 0.5 3.5 5.8 6.5
Imports -17.4 9.6 9.7 6.3 6.4 7.4 7.6
Real GDP growth -1.5 2.9 3.1 2.5 3.0 3.8 4.1
GDP inflation 7.7 7.9 8.0 5.4 6.5 6.1 5.8
GDP at current prices (R billion) 2 398.2 2 661.4 2 964.3 3 202.5 3 513.5 3 868.9 4 263.9
Headline CPI inflation 7.1 4.3 5.0 5.7 5.5 5.1 4.9
Current account balance (% of GDP) -4.0 -2.8 -3.3 -5.9 -5.8 -5.5 -5.5
Source: Reserve Bank and National Treasury
Table 2.3 Macroeconomic projections, 2011/12 – 2015/162011/12 2012/13 2013/14 2014/15 2015/16
Fiscal year Actual Estimate
Percentage change unless otherwise indicated
Real GDP growth 2.8 2.7 3.2 3.9 4.2
GDP inflation 6.7 5.5 6.4 6.2 5.8
Headline CPI inflation 5.6 5.7 5.3 5.1 4.9
GDP at current prices (R billion) 3 017.9 3 269.9 3 590.5 3 961.8 4 367.7
Source: National Treasury
Forecast
Impact of strikes in mining sector
The National Treasury estimates that the total value of production lost to platinum and gold mining strikes and stoppages since the opening of the year has amounted to about R10.1 billion. Declining mining output and the spread of strike activity have depressed activity in related industries including manufacturing, logistics and services, with negative consequences for GDP, tax revenues, exports and employment. The impact will be larger if strike activity is protracted.
Real value added in mining contracted by 6.3 per cent in the first half of 2012 compared with the same period last year, following a sharp decline in platinum group metals output. The platinum price had declined by 14.2 per cent to US$1 427/oz between February and July, but rebounded above US$1 650/oz in September as supply was limited by strikes.
In the year to August, mining output fell by 3.3 per cent, with production of platinum group metals 15.3 per cent lower. Continued strong growth in iron ore, spurred by Chinese demand, has offset some of the decline in platinum, gold and coal.
As Figure 2.1 shows, output growth in petrochemicals, food and beverages, and motor vehicles contrasts sharply with the metals subsector, where output has fallen sharply and remains significantly below pre-
Lost production in platinum and gold mining has amounted to about R10.1 billion
Manufacturing performance varies widely, with strong performances in food and petrochemicals

2012 MEDIUM TERM BUDGET POLICY STATEMENT
14
recession levels. The purchasing managers’ index suggests that manufacturing output will remain muted in 2012.
The relatively weaker currency, greater export potential into other Southern African Development Community (SADC) countries, and government support through incentives and local procurement targets should help lift production over time.
Figure 2.1 Manufacturing performance by subsector, 2007-2012
70
80
90
100
110
120
Total Petrochemicals Metals products Food & beverage Motor vehicles
Seas
onall
y adj
uste
d ind
ex (2
005=
100)
Avg. level in 2007 Lowest point (avg. Jan - Jun 2009) Dec-11 Aug-12
-2%
7%
-18%
1%21%
Source: Statistics South Africa
Domestic expenditure
Real gross domestic expenditure grew at an annualised rate of 4.6 per cent in the first half of 2012 compared with 4.0 per cent in the second half of 2011, supported by stronger public-sector gross fixed capital formation. Over the next three years, growth in real gross domestic expenditure is forecast to average 4.3 per cent.
Table 2.4 Contribution to gross domestic expenditure growth, 2008 – 2012Percentage points 2008 2009 2010 2011 20121
Household consumption expenditure 1.4 -1.0 2.3 3.0 2.3
Government consumption expenditure 0.8 0.9 1.0 0.9 0.8
Gross fixed-capital formation 2.5 -0.7 -0.3 0.8 1.1
Change in inventories -1.6 -1.0 1.4 0.3 0.1
Total (per cent)2 3.5 -1.6 4.2 4.3 4.3
1. First half of 2012 compared with first half of 20112. Totals may not add up due to residual items that represent unallocated gross domestic expenditureSource: Reserve Bank
Figure 2.2 shows that the contribution of the private sector to domestic growth has slowed over the past 15 months. In the near term, private-sector domestic demand is expected to expand at a modest pace.
Greater export potential into SADC countries can boost manufacturing exports

CHAPTER 2: ECONOMIC OUTLOOK
15
Figure 2.2 Public- and private-sector contributions to GDP growth,
2004 – 2012
-10
-8
-6
-4
-2
0
2
4
6
8
10
2004
2005
2006
2007
2008
2009
2010
2011
2012
Per c
ent
Public sector Private sector
Source: Reserve Bank and National Treasury calculations
Public- and private-sector investment
Private-sector investment continues to grow, but at a weaker pace than during 2011, as South African corporations refrain from significant new project developments in an environment of weaker business confidence, domestic supply constraints and low levels of demand.
In contrast, gross fixed-capital formation by the public sector expanded at an annual rate of 10.9 per cent during the first half of 2012. Eskom, Transnet and the South African National Roads Agency Limited account for about 95 per cent of capital spending by state-owned enterprises. Government spending on water, health, sanitation and road infrastructure has also picked up, supporting a nascent recovery in construction.
As the economic environment strengthens, rising confidence should result in a gradual improvement in private-sector gross fixed-capital formation. The public-sector infrastructure programme will continue to support overall investment growth over the medium term.
Household consumption growth has slowed from 5.0 per cent in 2011, and is forecast to average 3.4 per cent in 2012 and 3.5 per cent in 2013 owing to sluggish job creation, elevated debt and limited growth in real disposable income.
Consumer indebtedness stands at 76 per cent of gross disposable income. The value of new unsecured credit granted to households in the second quarter of 2012 was 36 per cent higher than during the same period in 2011. Most of the increase reflects larger loans over longer time periods. Currently, levels of unsecured lending do not pose a significant risk to financial stability; however, measures to improve responsible lending and borrowing are required to support access and affordability of credit. In lower- and middle-income communities, concerns related to the garnishee system require attention. Financial sector regulators are investigating these matters. The forthcoming “twin peaks” regulatory reforms in the financial sector should help ensure better coordination among regulators.
Gross fixed-capital formation by the public sector expanded at an annual rate of 10.9 per cent during the first half of 2012
Household consumption growth slows

2012 MEDIUM TERM BUDGET POLICY STATEMENT
16
Trade balance
Export volumes contracted at an annual rate of 6.3 per cent in the second quarter after falling by 1.5 per cent in the first quarter of 2012. The value of exports of coal and chemical products remained robust, while platinum and base metals declined by 21.9 per cent and 6.7 per cent respectively over the first eight months of the year. Domestic supply constraints, including electricity rationing in manufacturing and disruptions to mining output, have exacerbated the pressure on exports.
The value of imports increased by 20 per cent over the same period, driven by strong increases in crude oil, machinery and appliances, vehicles and original equipment components. Import volumes are now almost 4 per cent above pre-2009 highs, while exports are 13 per cent below their highs. The widening trade deficit has been exacerbated by a steady decline in the price of exports relative to imports (terms of trade), which has fallen by almost 5 per cent since its peak in the third quarter of 2010.
Table 2.5 Performance of exports by destination, 2000 – 20122011 20121
2011 201212000 2011 20121
European Union 2.6 -0.9 10.9 -4.0 31.2 22.0 21.0
Germany 0.1 -0.9 1.1 -13.9 7.8 6.2 5.5
UK 0.4 -0.0 8.5 -0.1 8.9 4.1 3.9
Netherlands 0.8 0.6 25.4 18.8 3.3 3.1 3.7
India 0.4 0.7 9.6 19.7 1.4 3.5 4.1
Brazil 0.1 0.1 13.9 6.7 0.7 0.9 0.9
China 4.6 1.1 45.7 9.2 2.0 12.3 12.0
SADC 2.2 2.7 20.7 26.2 9.8 10.6 12.2
Mozambique 0.6 0.3 24.0 10.9 2.3 2.5 2.7 Zimbabwe 0.4 0.3 13.5 13.1 2.2 2.5 2.5
Zambia 0.8 0.7 41.7 33.9 2.0 2.3 2.7
US 1.4 0.0 15.8 0.5 12.0 8.6 8.1
Japan 1.5 -1.7 19.3 -20.7 8.1 8.0 6.2
Unallocated2 2.4 1.4 20.9 13.3 15.2 11.5 11.3
Other 4.0 3.1 17.7 13.5 19.6 22.5 24.1
Total 19.2 6.4 19.2 6.4 100 100 100
1. First eight months of 20122. Consists of mostly commodities such as gold that are sold through commodities exchanges
Source: Quantec
Annual weighted % change
% change % share
The pattern of trade in the first half of 2012 shows declining exports to the European Union (EU) and Japan, flat exports to the US, and growing exports to China, India and the SADC. Disruptions to platinum output affected trade with Germany, Japan and the US, while China’s higher demand for coal offset lower steel imports. There was a notable decline in exports of motor vehicles to Germany.
The SADC is currently South Africa’s second-largest export market after the EU. The share of manufactured exports to the region (21.8 per cent) has increased rapidly over the past few years, led by purchases of steel, chemical products, and machinery and appliances, especially mining equipment. With strong growth forecast for the next five years, the SADC region could soon become South Africa’s biggest market for manufactured exports.
Strong exports of coal and chemical products have partially offset declines in other areas
Exports to SADC countries have grown sharply, and the region could soon become the largest market for manufactured exports

CHAPTER 2: ECONOMIC OUTLOOK
17
Export growth is expected to improve over the medium term as mining production stabilises, external demand strengthens, and trade with emerging and African economies becomes a larger share of total exports.
Current account
The current account deficit has widened sharply over the past year and is expected to average 5.9 per cent of GDP in 2012, up from 3.3 per cent in 2011. The trade deficit deteriorated to 1.9 per cent of GDP in the first half of 2012 and net transfer payments nearly doubled as a share of GDP due to an increase in net customs revenue payments to the Southern African Customs Union (SACU). Over the medium term, the current account deficit is projected to moderate to 5.5 per cent of GDP.
The financial account recorded a large surplus in the first six months of the year, with net inflows worth R98.5 billion. Non-resident investors were net purchasers of bonds worth R83.8 billion in the year to mid-October, spurred by favourable yield differentials and South Africa’s inclusion in Citigroup’s World Government Bond Index. Overseas demand for bonds should remain robust owing to high levels of global liquidity seeking good returns.
Table 2.6 Balance of payments, 2007 – 2012
Percentage of GDP 2007 2008 2009 2010 2011 20122
Total current account -7.0 -7.2 -4.0 -2.8 -3.3 -5.7
Trade balance -1.8 -1.6 0.1 1.0 0.6 -1.9
Net services, income and transfer receipts -5.2 -5.6 -4.1 -3.8 -3.9 -3.8
Net service receipts -0.9 -1.5 -1.0 -1.2 -1.2 -0.7
Net income receipts -3.4 -3.3 -2.2 -2.0 -2.2 -2.2
Net dividend receipts -3.1 -2.6 -1.6 -1.5 -1.8 -1.8
Net transfer payments (mainly SACU) -0.8 -0.8 -0.9 -0.6 -0.5 -0.9
Current account excluding SACU transfers -6.1 -6.3 -3.1 -2.2 -2.8 -4.8
Financial account balance1 9.3 8.3 4.7 4.0 4.4 6.3
1. Actual values including unrecorded transactions2. Includes data for the first two quarters of 2012, seasonally adjusted and annualisedSource: Reserve Bank
Rand exchange rate
The rand has remained volatile as global risk appetite waxes and wanes in response to developments in major economies. Sentiment towards the rand has been negatively affected by the deterioration of the current account and wildcat strikes. The currency’s exchange value depreciated from an average of R8.01 to the US dollar in January to R8.62 in October. The nominal trade-weighted rand was, on average, 10 per cent weaker in the first three quarters of 2012 compared with the same period a year ago. In real terms, the rand was 7 per cent weaker in the first half of 2012 compared to the same period in 2011. The weaker rand has so far provided little support for manufacturing export growth, which remains subdued in the present economic environment.
Improvement in financial account reflects continued global interest in government debt
In real terms, the rand was 7 per cent weaker in the first half of 2012 compared with the same period in 2011

2012 MEDIUM TERM BUDGET POLICY STATEMENT
18
Inflation
Consumer price inflation (CPI) has averaged 5.7 per cent in the year to August. Core inflationary pressures remain contained and headline inflation is expected to stay within the 3 to 6 per cent inflation target band throughout the forecast period. Rising international food prices and higher petrol costs, combined with a weaker exchange rate, are expected to place upward pressure on consumer prices during the second half of 2012. Food price inflation is expected to average 9 per cent in 2013, up from 5.1 per cent in August 2012. Administered prices have risen by 10.3 per cent over the past year. Electricity prices are expected to continue rising in line with the move to cost-reflective tariffs.
Inflation targeting: keeping price increases under control
Low and stable inflation is a key determinant of economic competitiveness, with particular importance for preserving the purchasing power of poor households.
South Africa adopted inflation targeting in 2000. Since then, average levels of inflation and real interest rates have declined, growth in real GDP and fixed investment have been higher and less volatile, and inflation expectations have been lower and more stable than before. Reserve Bank independence and more transparent monetary policy have improved credibility and lowered the cost of long-term financing. The Bank also plays an important role in overseeing and maintaining financial stability.
The Reserve Bank’s Monetary Policy Committee considers a range of factors when setting interest rates. These include the inflation forecast; level of GDP growth relative to potential; confidence levels; the pace of credit growth; trends in production and unit labour costs; commodity prices and capital flows; the exchange rate; the current account; and the fiscal position – enabling it to respond flexibly to economic shocks.
Macroeconomic performance before and after introduction of inflation targeting
Average (%)1 Volatility (%)
Headline inflation2
1990-1999 (pre-inflation targeting) 9.8 3.7
2000-2012 (inflation targeting) 5.9 2.9
Real GDP growth
1990-1999 (pre-inflation targeting) 1.4 2.3
2000-2012 (inflation targeting) 3.5 1.9
Real repo rate3
1990-1999 (pre-inflation targeting) 5.7 4.1
2000-2012 (inflation targeting) 3.2 2.5
Real investment growth
1990-1999 (pre-inflation targeting) 1.6 7.2
2000-2012 (inflation targeting) 6.9 6.3
1. Average annual change, based on quarterly data
2. Headline inflation excluding mortgage interest costs (CPIX) for urban areas up to 2008, and headline inflation thereafter
3. Average repo rate minus average inflationSource: Reserve Bank and National Treasury calculations
Inflation and interest rates since 2000
-4
-2
0
2
4
6
8
10
12
14
16
2000
2001
2002
2003
2004
2005
2006
2007
2008
2009
2010
2011
2012
Per c
ent
Repo rateHeadline inflationReal repo rate
Source: Reserve Bank
Job creation
Economic growth is integral to job creation. Employment gains have decelerated in tandem with slower growth over the past year and the unemployment rate remains stubbornly high at 24.9 per cent. Formal non-agricultural employment has risen towards pre-2009 levels, with 125 000 jobs created over the past 12 months. Public-sector employment has risen by 38 000 jobs compared with 87 000 additional private-sector jobs. Labour force participation rates remain low, with more than 1.1 million additional South Africans classified as discouraged since the end of 2008. High levels of structural unemployment make labour market entry more difficult for the young and less skilled.
CPI inflation is forecast to remain within target band over forecast period
CHAPTER 2: ECONOMIC OUTLOOK
19
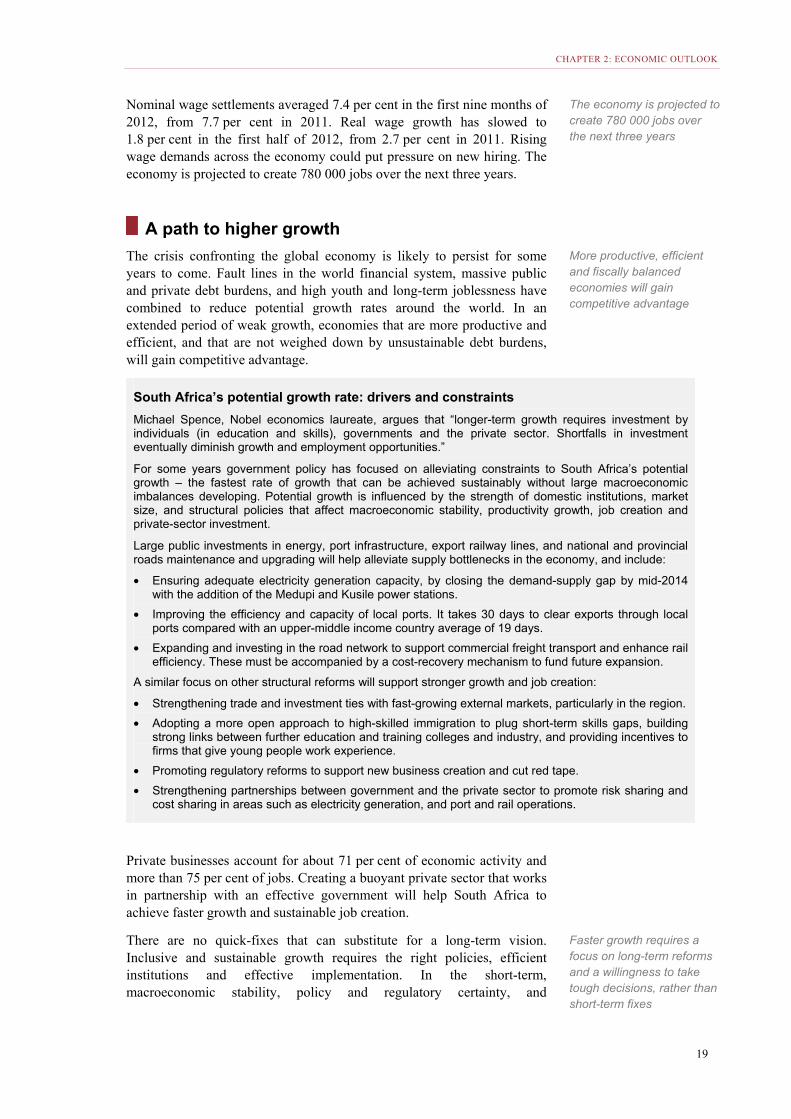
Nominal wage settlements averaged 7.4 per cent in the first nine months of 2012, from 7.7 per cent in 2011. Real wage growth has slowed to 1.8 per cent in the first half of 2012, from 2.7 per cent in 2011. Rising wage demands across the economy could put pressure on new hiring. The economy is projected to create 780 000 jobs over the next three years.
A path to higher growth
The crisis confronting the global economy is likely to persist for some years to come. Fault lines in the world financial system, massive public and private debt burdens, and high youth and long-term joblessness have combined to reduce potential growth rates around the world. In an extended period of weak growth, economies that are more productive and efficient, and that are not weighed down by unsustainable debt burdens, will gain competitive advantage.
South Africa’s potential growth rate: drivers and constraints
Michael Spence, Nobel economics laureate, argues that “longer-term growth requires investment by individuals (in education and skills), governments and the private sector. Shortfalls in investment eventually diminish growth and employment opportunities.”
For some years government policy has focused on alleviating constraints to South Africa’s potential growth – the fastest rate of growth that can be achieved sustainably without large macroeconomic imbalances developing. Potential growth is influenced by the strength of domestic institutions, market size, and structural policies that affect macroeconomic stability, productivity growth, job creation and private-sector investment.
Large public investments in energy, port infrastructure, export railway lines, and national and provincial roads maintenance and upgrading will help alleviate supply bottlenecks in the economy, and include:
• Ensuring adequate electricity generation capacity, by closing the demand-supply gap by mid-2014 with the addition of the Medupi and Kusile power stations.
• Improving the efficiency and capacity of local ports. It takes 30 days to clear exports through local ports compared with an upper-middle income country average of 19 days.
• Expanding and investing in the road network to support commercial freight transport and enhance rail efficiency. These must be accompanied by a cost-recovery mechanism to fund future expansion.
A similar focus on other structural reforms will support stronger growth and job creation:
• Strengthening trade and investment ties with fast-growing external markets, particularly in the region.
• Adopting a more open approach to high-skilled immigration to plug short-term skills gaps, building strong links between further education and training colleges and industry, and providing incentives to firms that give young people work experience.
• Promoting regulatory reforms to support new business creation and cut red tape.
• Strengthening partnerships between government and the private sector to promote risk sharing and cost sharing in areas such as electricity generation, and port and rail operations.
Private businesses account for about 71 per cent of economic activity and more than 75 per cent of jobs. Creating a buoyant private sector that works in partnership with an effective government will help South Africa to achieve faster growth and sustainable job creation.
There are no quick-fixes that can substitute for a long-term vision. Inclusive and sustainable growth requires the right policies, efficient institutions and effective implementation. In the short-term, macroeconomic stability, policy and regulatory certainty, and
The economy is projected to create 780 000 jobs over the next three years
More productive, efficient and fiscally balanced economies will gain competitive advantage
Faster growth requires a focus on long-term reforms and a willingness to take tough decisions, rather than short-term fixes

2012 MEDIUM TERM BUDGET POLICY STATEMENT
20
implementing infrastructure investments on time should help instil confidence and provide the platform for expanded private investment.
The National Development Plan recommends a series of actions to address structural constraints and bottlenecks in the economy. Urgent decisions across a range of policy areas are needed to translate the plan’s vision into reality, start changing the structure of the economy and shift onto a higher growth trajectory. These should include measures that:
• Support sustainable long-term investment in competitive economic infrastructure through financing that combines cost-reflective tariffs, taxes, loans and private-sector participation.
• Introduce active labour market policies that enable young, unskilled job seekers to transition into employment, and ensure the price of labour relative to productivity and capital helps stimulate job creation.
• Encourage new business creation and small business expansion by reducing the cost of tax and regulatory compliance for small and medium-sized firms, streamlining processes for granting licenses and permits, and paying government invoices on time.
• Transform human settlements and develop functioning public transport networks to improve living conditions and support the country’s rapid urbanisation.
• Provide policy certainty and predictability to encourage long-term investment in the mining sector, and structure the tax regime to expand the benefits accruing from South Africa’s mineral wealth.
• Increase exports in areas where South Africa has natural endowments and comparative advantage, such as mining, construction, mid-skill manufacturing, agriculture and agro-processing, education, tourism and business services, and encourage export diversification.
• Take a more developmental approach to regional integration, emphasising efficient transport infrastructure, uniform competition rules and faster progress in removing trade barriers.
Achieving such results will require a willingness to manage difficult trade-offs, effective and efficient implementation, and broad partnerships between government, business, labour and civil society
Conclusion
Domestic growth is expected to be modest next year and to gather pace over the medium term. Yet much faster growth is required to stimulate the job creation South Africa needs. Macroeconomic stability continues to provide a solid foundation for inclusive growth. Complementary structural reforms are required and progress in policy priorities is needed to broaden participation in the economy, boost productivity and raise living standards.
Reforms needed to broaden economic participation, boost productivity and raise living standards

21
3 Fiscal policy and trends
In brief
• A narrow fiscal window is available to government over the next three years, given moderate economic growth prospects and elevated levels of public debt.
• During 2013/14 and 2014/15, spending will remain within the non-interest expenditure ceilings established in the 2012 Budget. Over the medium term, government will limit real expenditure growth to average 2.9 per cent per year. Spending on key social and economic programmes will be maintained.
• As economic growth gathers pace, the budget deficit is projected to narrow from an estimated 4.8 per cent of GDP in the current year to 3.1 per cent of GDP by 2015/16.
• With spending well contained, the primary risk to the fiscal outlook is lower-than-projected GDP growth that would result in poor revenue outcomes.
• To realise improved outcomes, government must shift the composition of expenditure away from consumption towards capital investment, and improve the quality of spending.
• South Africa’s fiscal guidelines promote countercyclicality, sustainability and intergenerational equity. The National Treasury will publish a long-term fiscal report on the sustainability of spending options.
Securing South Africa’s fiscal footing
outh Africa’s fiscal framework remains grounded in a sustainable, countercyclical approach to managing revenue and expenditure. Spending will be well contained over the medium-term expenditure
framework (MTEF) period. Key social and economic programmes will be maintained, complemented by efforts to improve the quality of spending.
Fiscal policy began adjusting to a new economic terrain with the onset of the global financial crisis. After nearly a decade of rapid expansion in non-interest expenditure, government began to reduce the rate of growth in the budget while continuing to support the economy. This approach was made possible by the fiscal space built up in previous years.
Today government does not have ample fiscal space. The economic environment and attendant risks outlined in Chapter 2 impose sharp limits
Spending growth will remain contained, while continuing to support social and economic priorities
S

2012 MEDIUM TERM BUDGET POLICY STATEMENT
22
on government spending. The challenge is to navigate a path between fiscal consolidation and an excessive, premature withdrawal of support for the economic recovery.
Fiscal policy over the past decade
South Africa’s national income, adjusted for inflation, is 50 per cent larger than it was a decade ago. Over the same period, government expenditure has doubled. As shown in Figure 3.1, real non-interest expenditure grew by an annual average of 8 per cent between 2002/03 to 2011/12.
Figure 3.1 Fiscal performance and projections
Real growth in main budget non-interest expenditure1 Main budget revenue and non-interest expenditure
Consolidated budget balance Real growth of expenditure components
Source : National Treasury
Expenditure growth during this period resulted from a conscious decision to improve access to services and accelerate the pace of infrastructure investment. The expanding fiscal envelope has enabled a doubling of the social wage, rising capital budgets, growing social transfers, increased public employment and improved public-sector wages.
1 The main budget includes expenditure financed from the National Revenue Fund at national, provincial and local government level, but excludes spending of social security funds, public entities and provinces financed from their own revenue. Since 2002/03 government has presented consolidated accounts in line with international standards. The budget deficit is generally reported in consolidated form and used by government as the core measure of fiscal sustainability. Unless indicated otherwise, budget data is presented in consolidated form. Two figures above use main budget data because it is available over a longer period of time.
7.7
3.9
9.4
11.9
8.4
11.2
8.0 8.3
4.2
7.1
2.23.0 3.0
3.7
0
2
4
6
8
10
12
14
2002/03
2003/04
2004/05
2005/06
2006/07
2007/08
2008/09
2009/10
2010/11
2011/12
2012/13
2013/14
2014/15
2015/16
Per c
ent r
eal g
rowt
h
18
20
22
24
26
28
30
1997/98
1999/00
2001/02
2003/04
2005/06
2007/08
2009/10
2011/12
2013/14
2015/16
Per c
ent o
f GDP
Non-interest expenditureRevenue
-0.8
-2.5-1.9
-0.6
1.21.7
-1.1
-6.5
-4.3 -4.2-4.8 -4.5
-3.7-3.1
-7-6-5-4-3-2-10123
2002/03
2003/04
2004/05
2005/06
2006/07
2007/08
2008/09
2009/10
2010/11
2011/12
2012/13
2013/14
2014/15
2015/16
Per c
ent o
f GDP
2.6
3.83.9
1.3
4.84.3
5.5
2.1
6.4
3.7
8.3
1.3
0
2
4
6
8
10
12
2008/09 - 2011/12 2012/13 - 2015/16
Per c
ent
Other transfers and subsidiesGoods and servicesCapital paymentsTransfers to householdsDebt-service costsCompensation of employees
Over the past 10 years real government spending has doubled

CHAPTER 3: FISCAL POLICY AND TRENDS
23
Government’s response to the 2009 recession has led to a dramatic widening of the deficit. By the time debt stabilises in 2015/16, more than R1 trillion will have been added to government debt (see Table 3.4). The cost of servicing this debt has grown rapidly, and the doubling of the debt-to-GDP ratio means that government has fewer countercyclical options at its disposal.
Stable, well-contained expenditure over medium term
Over the past decade, the redistributive and pro-poor character of public spending has significantly improved, alleviating poverty and advancing social development. But there is increasing concern within government that additional budget allocations do not result in commensurate improvements in service delivery. Government's ability to support accelerated growth, increase employment, and reduce poverty and inequality is limited by two factors: the quality of spending and the composition of spending, with a shift necessary from consumption towards capital investment.
The narrowing of fiscal space, in combination with the erosion of the link between budget inputs and social outputs, implies the need for additional measures to secure the country’s fiscal footing and improve the quality of spending. While current levels of spending can be sustained over the medium term, expenditure cannot grow at the rate it did over the last decade. Nor is it possible to sustain budget deficits in excess of 4.5 per cent of GDP indefinitely.
Over the next three years spending growth will remain stable and well contained, while continuing to support social priorities and enhancing the contribution of the public finances to output growth. This will make it
Fiscal policy and the global downturn South Africa’s fiscal response to the 2009 recession was strong by international comparison. This is reflected in the change in the budget balance. South Africa’s balance fell by about 6 per cent of GDP, from a budget surplus of 1.7 per cent of GDP in 2007/08 to a deficit of 4.2 per cent of GDP in 2011/12, reflecting strong spending growth in the face of lower revenue collection. The corollary of this trend is shown in the growth of public debt, depicted in the figure on the right. The increase in South Africa’s debt-to-GDP ratio, albeit from a low base, was far greater than that of other emerging markets.
Change in budget balance, 2007 – 2011
Source: IMF Fiscal Monitor, October 2012
Change in government debt, 2007 – 2014
* Emerging markets average
South Africa’s medium-term challenge is to improve the quality and composition of expenditure
Government will act to stabilise the growth of public debt and begin rebuilding fiscal space
-7-6-5-4-3-2-1012
South AfricaAustraliaG-7MalaysiaIndiaEuro areaPolandMexicoEM average*ChinaKenyaArgentinaKoreaBrazilTurkey
Per c
ent o
f GDP
-30-20-10
01020304050
G-7 averageEuro areaAustraliaSouth AfricaMalaysiaPolandMexicoKenyaKoreaChinaTurkeyEM average*BrazilIndiaArgentina
Per c
ent o
f GDP

2012 MEDIUM TERM BUDGET POLICY STATEMENT
24
possible to restore the deficit to sustainable levels and begin rebuilding fiscal space.
If, however, the substantial risks to the outlook materialise and the economic environment deteriorates, realising these fiscal objectives will require a reconsideration of current spending and revenue plans. In a lower-growth scenario, an appropriate balance between spending restraint and new revenue initiatives would be necessary, taking into account the need to limit the potential impact on growth, employment and equity. In either case, the necessary adjustments will avoid an unwarranted early withdrawal of fiscal support for the recovery.
Fiscal policy objectives
Government’s fiscal guidelines promote countercyclicality, debt sustainability and intergenerational equity. The fiscal stance targets medium-term consolidation, with moderate expenditure growth supporting economic recovery and sustaining the social wage.
The 2011 Medium Term Budget Policy Statement (MTBPS) projected that the budget deficit would narrow in line with moderate expenditure increases and automatic revenue growth. While expenditure has remained within budgeted targets, revenue has continued to underperform, reflecting the weakness of the economic environment. As the economy improves revenue is expected to recover, narrowing the budget deficit from 4.8 per cent of GDP in 2012/13 to 3.1 per cent of GDP in 2015/16.
South Africa continues to run a large structural deficit that reflects an underlying, longer-term imbalance in revenue and expenditure (rather than one based on short-term factors). The aim of fiscal policy over the next three years is to narrow this structural deficit towards 3 per cent of GDP and rebuild fiscal space. Three policy objectives will be targeted:
• Improving the impact of spending, including by shifting the balance of resource allocation towards investment in infrastructure.
• Ensuring that expenditure grows at a moderate pace.
• Stabilising public debt.
Moderating expenditure growth
Expenditure growth must balance the need to sustain the current level of social commitments with support for improved competitiveness, investment and maintenance of productive infrastructure. The spending plans outlined in the 2012 Budget targeted these objectives and allocated sufficient resources to achieve them. By reducing waste and inefficiency government can achieve better outcomes within this resource envelope.
Accordingly, government has decided that there will be no upward adjustment of the overall spending projection set out in the 2012 Budget during the first two years of the MTEF period. This marks a necessary shift from the pattern of additional spending allocations that had come to be taken for granted over the past decade. Through savings and reprioritisation, government has also ensured that despite the larger-than-budgeted public-sector wage agreement, the overall spending envelope for the current year has not increased. The outer year of the fiscal framework
If substantial risks materialise, it may be necessary to reconsider spending and revenue plans
Countercyclicality, debt sustainability and intergenerational equity anchor fiscal approach
By reducing waste and inefficiency government can achieve better outcomes
No upward adjustment of overall spending projection set out in 2012 Budget over next two years

CHAPTER 3: FISCAL POLICY AND TRENDS
25
makes provision for moderate growth of non-interest expenditure, consistent with the objective of stabilising debt.
Stabilising government debt
Rebuilding fiscal space depends on stabilising the level of public debt. Although the stock of debt remains manageable, it is expected to increase from 35.7 per cent of GDP in the current fiscal year to 39.2 per cent of GDP in 2015/16, and then to decline in subsequent years.
Arresting the growth in debt will require a significant reduction in the primary deficit – the amount by which non-interest spending exceeds revenue. In combination, slower spending growth and a recovery in revenue will narrow the primary deficit from 2.1 per cent of GDP in 2012/13 to 0.4 per cent in 2015/16, resulting in the stabilisation of debt. The reduction of the debt-to-GDP ratio thereafter will require government to maintain a small primary surplus.
Despite the expected moderation of the budget deficit over the next few years, debt-service costs are projected to grow at an annual average of 8.9 per cent in nominal terms over the MTEF period. In the outer year it will cost government R114.8 billion to service the debt, draining resources that could be spent on productive investment and social priorities.
Figure 3.2 Stock of government debt, 2005/06 – 2016/17
Source: National Treasury
Government’s debt management strategies will continue to support fiscal sustainability by meeting financing requirements at the lowest possible cost and within prudent levels of risk.
Table 3.1 Main budget non-interest expenditure plans, 2010/11 – 2015/16R million 2010/11 2011/12 2012/13 2013/14 2014/15 2015/16
Budget 2010 746 785 799 875 860 292
Budget 2011 743 353 812 345 877 324 948 992
Budget 2012 814 554 879 977 953 024 1 030 539
MTBPS 2012 878 669 953 024 1 030 539 1 118 991
20
25
30
35
40
45
0
200
400
600
800
1000
1200
1400
1600
1800
2000
2005/06
2006/07
2007/08
2008/09
2009/10
2010/11
2011/12
2012/13
2013/14
2014/15
2015/16
2016/17
Per c
ent o
f GDP
R bi
llion
R billion (left axis) Per cent of GDP (right axis)
To rebuild fiscal space, government must stabilise debt
Debt-service costs continue to grow over the medium term, draining resources that could be spent on productive investment

2012 MEDIUM TERM BUDGET POLICY STATEMENT
26
Improving outcomes and shifting the composition of spending
Government remains committed to improving the quality of spending – by eliminating waste, inefficiency and corruption – and ensuring that public resources are used to greater effect.
Last year’s MTBPS emphasised the need to shift the composition of spending in favour of the creation of social and economic assets. This process has begun. Over the MTEF period, real growth in compensation of employees will average 1.3 per cent, while capital payments will grow at 4.3 per cent.
The wage agreement reached this year between government and public-sector unions was higher than projected in the 2012 Budget. Over the medium term the cost of the agreement is R37.5 billion, absorbing a large share of additional allocations made available through reprioritisation. Over the period ahead, government will take a more deliberate approach to managing overall employment and wage trends across the public sector, including state-owned entities. In particular, government will curtail unwarranted growth in personnel numbers.
The pace of public infrastructure spending has picked up over the past 12 months and government remains committed to sustaining this improvement. While the bulk of infrastructure spending is financed from the balance sheets of state-owned companies, the fiscus funds the provision of social infrastructure, delivered primarily through provinces and municipalities. The main challenge is to ensure that budget allocations are spent – and spent efficiently.
In preparing their medium-term plans, departments have been required to reprioritise spending away from underperforming programmes and identify savings within existing budgets. Over the next several years government will also step up its efforts to combat waste, inefficiency and corruption. These measures will include:
• Reforms to procurement systems that prioritise value for money and introducing centralised procurement where warranted. These initiatives will be led by a chief procurement officer in the National Treasury.
• Introducing safeguards such as reviews by the Auditor-General and the Parliamentary Standing Committee on Public Accounts for tenders above a certain amount.
• Assigning authority and improving capacity within the National Treasury to investigate the value for money associated with tenders.
• Strengthening the anti-corruption system by providing additional resources to agencies such as the Office of the Public Protector, the Anti-Corruption Task Team and others.
• Instituting a series of detailed expenditure reviews to consider the outcomes that are achieved from the use of public finances.
Efforts to shift the composition of expenditure have begun to yield results
Government will step up efforts to combat waste, inefficiency and corruption

CHAPTER 3: FISCAL POLICY AND TRENDS
27
Public-sector infrastructure investment and the budget During the State of the Nation Address the President announced an ambitious infrastructure programme. The 2012 Budget Review provided further details of the programme, which is initially costed at R3.2 trillion over 20 years. The bulk of this spending will be financed from the balance sheets of state-owned enterprises, either from retained earnings or through the issue of debt. The costs of this infrastructure, which supports profitable economic activity, will be recovered by charges levied on users.
The Budget Review identified R690 billion worth of projects at various stages of development to be financed from the fiscus over the next decade. These initiatives include the majority of the envisaged social and community infrastructure projects such as schools, health facilities and secondary roads. The bulk of this infrastructure will be provided to citizens without direct charge or at highly subsidised rates.
Over the next three years, budgeted capital allocations amounting to R250 billion will finance those projects that are “shovel ready”. These funds need to be spent – and spent effectively. Other investments are under consideration and, following rigorous feasibility assessments, cost-effective projects that provide optimal long-term benefits will be eligible for support from the fiscus.
Major infrastructure projects by phase and implementing agent
Source: National Treasury
* Mixed means financed jointly by state-owned companies and government ** Government includes national, provincial and local government infrastructure projects financed from the budget
Long-term fiscal objectives
Beyond the medium term, government intends to reduce the structural deficit, and restore and maintain a primary surplus. This will ensure that spending is financed mainly by revenue, and create the fiscal space to respond to future variations in the business cycle and external shocks.
The National Treasury is preparing a long-term fiscal report that assesses the sustainability of spending options in light of demographic and economic projections. This includes growth projections for different age cohorts and how this will affect public spending over time. Given the uncertainty of economic projections that stretch over several decades, the report will also consider the limits to expenditure in low, medium and high-economic growth scenarios.
Unlike many developed economies, the effects of population ageing will not begin to fully exert pressure on the South African fiscus for several decades. Population growth is already slowing and the growth rates of key demographic cohorts, such as those eligible for child support grants, are moderating or declining. This implies reduced pressure on the fiscus from
0 500 1 000 1 500 2 000 2 500 3 000
Government**
Mixed*
State-ownedcompanies
R billion
OngoingTender and constructionDesign and financingConcept and feasibility assessment
Phase:
Forthcoming fiscal report to assess sustainability of long-term spending options
Demographic trends may reduce pressure on fiscus

2012 MEDIUM TERM BUDGET POLICY STATEMENT
28
social grants over the next two decades. Similarly, the school-age population is beginning to fall, underscoring the need to improve the quality of education rather than increase the quantity of resources available.
The long-term fiscal report will model the impact of a variety of policy changes, including the introduction of national health insurance and proposals contained in the National Development Plan. Increased structural spending will require significantly accelerated economic growth, unless it is financed by a concomitant increase in structural revenue. The report aims to inform policy debate and make explicit the implications of new initiatives. Preliminary observations will be published in November, and the full report will be issued early in 2013 to include data from the 2011 census.
Fiscal framework
The fiscal framework is presented in Table 3.2. Owing to weaker economic conditions, anticipated tax revenue for 2012/13 has been revised downwards, leading to a higher-than-projected consolidated budget deficit in the current fiscal year. The deficit narrows gradually towards 3.1 per cent of GDP in 2015/16.
Revenue is expected to grow in line with the economic forecast presented in Chapter 2, remaining at about 27.5 per cent of GDP. Real growth of non-interest expenditure is projected to average 2.9 per cent per year over the MTEF period, below the pace of economic growth, which will enable a gradual reduction in the ratio of expenditure to GDP as the economy recovers. The primary balance is expected to narrow towards 0.4 per cent of GDP, stabilising the growth of debt. Nevertheless, debt-service costs will continue to outpace the overall growth of expenditure.
Revenue outlook
Given projected weakness in the economic environment, tax revenue is revised downwards by R5 billion in the current year. This still implies a robust nominal growth rate of 10.6 per cent over the previous year. If economic conditions deteriorate or mining sector output is disrupted over an extended period, further downward revision may be warranted.
Table 3.2 Consolidated fiscal framework, 2010/11 – 2015/162010/11 2011/12 2012/13 2013/14 2014/15 2015/16
R billion / percentage of GDP Outcome Estimate Medium-term estimates
Revenue 757.4 837.0 900.6 986.1 1 092.1 1 205.0 27.5% 27.7% 27.5% 27.5% 27.6% 27.6%
Expenditure 874.4 964.4 1 057.1 1 147.4 1 238.1 1 339.0 31.8% 32.0% 32.3% 32.0% 31.3% 30.7%
Non-interest expenditure 808.2 887.9 968.3 1 048.8 1 131.3 1 224.2 29.4% 29.4% 29.6% 29.2% 28.6% 28.0%
State debt cost 66.2 76.5 88.8 98.6 106.8 114.8 2.4% 2.5% 2.7% 2.7% 2.7% 2.6%
Budget balance -117.0 -127.4 -156.5 -161.3 -146.0 -134.0-4.3% -4.2% -4.8% -4.5% -3.7% -3.1%
Primary balance (percentage of GDP) -1.8% -1.7% -2.1% -1.7% -1.0% -0.4%
Long-term fiscal report to model impact of various policy considerations
Tax revenue is revised downwards by R5 billion in current year

CHAPTER 3: FISCAL POLICY AND TRENDS
29
In line with performance during the first half of 2012/13, the estimated personal and corporate income tax revenue collections for the year have been adjusted downwards, and value-added tax (VAT) and customs duties collections have been revised upwards. Mineral and petroleum royalties have also been revised downwards due to lower commodity prices and mining strikes. Revenues from import-related taxes, such as customs duties and VAT on imports have performed strongly. Gross tax revenue collection is expected to remain subdued next year, but should improve during the outer years of the MTEF period as economic conditions strengthen.
Government debt and public-sector borrowing
The main budget borrowing requirement is projected to increase from R165.5 billion in 2012/13 to R173.7 billion in 2013/14, before declining to R151.5 billion in 2015/16. Government debt, as shown in Table 3.4, is expected to peak at 39.2 per cent of GDP in 2015/16.
Table 3.3 Total tax and budget revenue, 2011/12 – 2013/142011/12 2012/13 2013/14
R million
Outcome Budget RevisedEstimates
Difference
Persons and individuals 250 389 285 970 282 000 -3 970 312 450
Companies 151 563 167 839 166 100 -1 739 185 322
Value-added tax 191 014 209 675 212 000 2 325 233 620
Secondary tax on companies/dividend withholding tax
21 965 19 050 18 800 -250 20 980
Specific excise duties 25 450 28 772 28 500 -272 29 410
Fuel levy 36 589 42 776 41 000 -1 776 42 310
Custom duties 34 173 36 160 38 000 1 840 39 550
Other 31 508 36 160 35 001 -1 159 37 749
Total tax revenue 742 651 826 401 821 401 -5 000 901 392
Non tax revenue 19 193 15 091 15 183 92 16 597
of which mineral royalties 5 612 6 510 5 900 -610 6 490
Estimate of SACU payments1 -21 760 -42 151 -42 151 – -43 700
Provinces, social security and selected public entities
96 922 105 489 106 204 714 113 284
Repayment of Gautrain loan2 – – – – -1 521
Total budget revenue 837 007 904 830 900 637 -4 194 986 052
1. Estimates are based on National Treasury projections. Actual payments will be determined by outcomes of customs and excise revenue collections in line with the SACU agreement2. Netting of repayment of Gautrain loan included in non tax revenue
Personal and corporate income tax revenue for first half of 2012/13 adjusted downwards; VAT and customs duties revenue revised upwards

2012 MEDIUM TERM BUDGET POLICY STATEMENT
30
The domestic market will remain the main source of funding. Debt issuance in the domestic market will be maintained at sustainable levels. This will be achieved by drawing on cash balances, exchanging debt maturing within the next several years for longer-dated debt and borrowing in global capital markets to finance part of South Africa’s foreign currency commitments.
The public sector borrowing requirement remains at 7.1 per cent of GDP, as reported in the 2012 Budget Review, and is expected to moderate over the medium term.
Fiscal performance and risks
The MTEF requires the publication of detailed three-year spending plans that give substance to government’s priorities. Containing expenditure growth over the next three years while improving the quality of the public finances implies renewed emphasis on medium-term planning.
Figure 3.3 contrasts the budget outcomes with the National Treasury’s MTBPS estimates in the three years prior to those outcomes. Revenue forecasts have generally been optimistic, with outcomes falling short of expectations. The revenue outcome for 2009/10, for instance, was well below the estimate made in the 2008 MTBPS. Since then, forecasts have been closer to the mark, but revenue has continued to underperform as a result of the weakness of the economic recovery.
Table 3.4 Total national government debt, 2009/10 – 2015/16As at 31 March 2009/10 2010/11 2011/12 2012/13 2013/14 2014/15 2015/16
R billion Outcome Estimate
Total gross loan debt 805.0 990.6 1 187.8 1 351.9 1 522.1 1 690.5 1 864.4
Total net loan debt 673.1 820.4 989.7 1 166.0 1 352.8 1 535.6 1 709.9
As percentage of GDP:
Total gross loan debt 33.0% 36.0% 39.4% 41.3% 42.4% 42.7% 42.7%
Total net loan debt 27.6% 29.8% 32.8% 35.7% 37.7% 38.8% 39.2%
Foreign debt as percentage of:
Gross loan debt 12.4% 9.9% 9.8% 8.5% 6.9% 6.4% 6.2%
Net loan debt 11.0% 4.8% 5.0% 3.5% 3.5% 3.3% 3.4%
See National Treasury website for further detail on government debt
Medium-term estimates
Table 3.5 Main budget net borrowing requirement and financing, 2011/12 – 2015/16
2011/12 2012/13 2013/14 2014/15 2015/16
R million Outcome Budget Revised Medium-term estimates
Main budget balance -147 962 -170 025 -173 031 -177 292 -165 776 -154 747
Extraordinary receipts and payments 3 821 1 176 7 498 3 550 3 300 3 200
Borrowing requirement (-) -144 141 -168 849 -165 533 -173 742 -162 476 -151 547
Domestic short-term loans (net) 18 725 22 000 22 000 23 000 22 000 21 000
Domestic long-term loans (net) 138 501 119 998 126 319 135 923 118 275 117 115
Foreign loans (net) 9 135 -7 492 -7 114 -3 553 3 701 9 044
Change in cash and other balances1 -22 219 34 343 24 328 18 372 18 500 4 388
Financing 144 141 168 849 165 533 173 742 162 476 151 547
1. A positive change indicates a decrease in cash balancesSee National Treasury website for further detail on net borrowing and financing
Domestic debt market will remain the main source of funding
Budgeting should be understood as part of a three-year framework

CHAPTER 3: FISCAL POLICY AND TRENDS
31
Figure 3.3 Forward estimates compared with budget outcomes, 2009/10 – 2012/13
Revenue Non-interest expenditure
Source: National Treasury * For 2012/13 the outcome reflects the revised in-year estimate
Over the past two years spending has been below MTEF estimates. This is in contrast to the general pattern in the decade prior to the recession, where spending outcomes were often greater than MTEF estimates as a result of significant additions to planned spending in each successive budget. More recently, alignment with budgeted estimates has improved, and outcomes correspond more closely to the planned expenditure.
In summary, higher-than-anticipated budget deficits have been the result of a weak recovery in tax revenue, rather than uncontrolled increases in non-interest spending. The main risk to the fiscal framework over the forecast period is related to economic performance. If GDP growth does not match expectations, revenue will fall short of current forecasts, implying the need for policy shifts to achieve the targets in the fiscal framework. An appropriate balance between spending restraint and new revenue initiatives would be necessary, taking into account the need to limit the potential impact on growth, employment and equity.
Outstanding guarantees and other contingent liabilities remain within prudent levels, but do represent potential risks, especially in an environment of economic weakness. State-owned entities need to operate in a prudent, accountable manner and borrow on the strength of their balance sheets. Cost recovery from user charges is essential to ensure the sustainability of long-term financial commitments associated with capital investment in infrastructure. From time to time, additional support may be necessary and government may issue guarantees with strict conditions. The National Treasury continually monitors contingent liabilities to ensure the health of the fiscus.
The risk of further sovereign rating downgrades needs to be considered. Although the impact of recent rating actions on the yield on government debt has been very limited, further downgrades would raise the cost of borrowing.
The three-year wage settlement between government and public-sector trade unions provides a stable medium-term basis for planning. The contingency reserve, which enables government to absorb such risks, is somewhat lower in the first two years of the proposed fiscal framework.
20
22
24
26
28
30
32
2009/10 2010/11 2011/12 2012/13
Per c
ent o
f GDP
Outcome*1 year ahead2 years ahead3 years ahead
24
25
26
27
28
29
30
2009/10 2010/11 2011/12 2012/13
Per c
ent o
f GDP
Outcome*1 year ahead2 years ahead3 years ahead
Alignment with budgeted expenditure estimates has improved over the past few years
Main risk to fiscal framework is related to economic performance
Government remains vigilant on contingent liabilities

2012 MEDIUM TERM BUDGET POLICY STATEMENT
32
Conclusion
South Africa’s fiscal policy framework is based on the principles of countercyclicality, debt sustainability and intergenerational equity. The stabilisation in the growth of spending achieved over the last three years will continue over the medium term as fiscal space is rebuilt. While the prospects of achieving government’s fiscal objectives remain good, there are risks to these projections. As the context changes over the medium term, government will realign its policy stance, firmly grounded in a sustainable budget structure that promotes growth, equity and employment.
Stabilisation of spending growth will continue as government works to rebuild fiscal space

33
4 Medium-term expenditure framework and division of revenue
In brief • The proposed consolidated framework for the 2013 Budget provides for total spending of R1.15 trillion
in 2013/14, R1.24 trillion in 2014/15 and R1.34 trillion in 2015/16, maintaining expenditure growth of about 8.2 per cent a year and reducing expenditure to 30.7 per cent of GDP in 2015/16.
• Debt-service costs will rise from R89 billion this year to R115 billion in 2015/16.
• The fiscus does not increase available funds beyond the 2012 budget baseline.
• Drawdowns on the contingency reserve provide for limited increases in allocations, mainly to accommodate the carry-through costs of the 2012 public-sector wage agreement.
• Government’s spending plans continue to reflect social and economic development priorities: education, health, social development, infrastructure, crime-fighting and enhancing competitiveness.
• Departments have reprioritised spending and identified savings to improve value for money and ensure alignment with the National Development Plan.
• Infrastructure planning and delivery in provinces and municipalities is undergoing major reforms.
Introduction
he medium-term expenditure framework (MTEF) for the 2013 Budget provides for continued real growth in spending on public services, though total non-interest expenditure remains
broadly unchanged from the 2012 Budget. This reflects the challenging economic environment and the fiscal constraints in which government is operating. In this context, enhancing service delivery will require departments and public entities to consolidate programmes and activities, and to seek greater value for money within the available resource envelope.
Decision to contain expenditure growth reflects economic environment, fiscal constraints and need to realise value for money
T

2012 MEDIUM TERM BUDGET POLICY STATEMENT
34
Departments have reprioritised spending away from programmes that are not meeting performance requirements or that are not closely aligned to departmental mandates. National and provincial departments were asked to reduce spending, where possible, so that these funds could be reallocated to infrastructure investment and other priorities.
Reprioritisation has been achieved without reducing social expenditure, which accounts for 58 per cent of consolidated government spending. Allocations to health, social assistance, education and free basic services will be maintained, although in these areas there is considerable scope for improved financial management and more cost-effective programmes. Funding for economic development has also been safeguarded. In addition to the emphasis on improving infrastructure, the expanded public works programme and the community work programme will continue to grow, and investment in special economic zones and manufacturing will be enhanced.
A need to shift the composition of spending
Government is committed to shifting the composition of spending from current consumption to productive investment. Within the wider public sector, municipal finances need to be strengthened and the substantial investment requirements of energy, water and transport utilities must be financed. For these shifts in the public finances to be achieved, moderation in personnel expenditure and greater efficiency in service delivery is necessary.
Since 2008/09, personnel spending has increased from 33 per cent to 35 per cent of total government expenditure. This year government and public service unions signed a three-year wage settlement. The agreement provides for cost-of-living adjustments of 7 per cent in 2012/13 and consumer price inflation (CPI) plus 1 per cent in both 2013/14 and 2014/15. The cost of this agreement is estimated at R5.5 billion for 2012/13 and R37.5 billion over the 2013 MTEF. Compensation of employees will be limited to 34 per cent of total expenditure in 2015/16 as government restrains growth in personnel numbers.
2011/12 outcomes and 2012/13 mid-year estimates
Table 4.1 sets out the national and provincial appropriated expenditure outcomes for 2011/12 and estimates for the first half of the current financial year. A detailed breakdown by national department and province is contained in Annexure A.
Appropriations from the National Revenue Fund (including transfers to provinces and municipalities) amounted to R888 billion in 2011/12, compared with an original budget estimate of R889 billion and a revised estimate of R894 billion (including an additional R5.7 billion provided to the South African National Roads Agency Limited in a special adjustments appropriation in February this year).
Departments were asked to reprioritise spending away from programmes that are not meeting requirements
Allocations to health, social assistance, education and free basic services will be maintained
To promote growth and development, government must shift the composition of spending
A close correlation between appropriations and budget estimates

CHAPTER 4: MEDIUM-TERM EXPENDITURE FRAMEWORK AND DIVISION OF REVENUE
35
The revised estimate of total appropriated expenditure in 2012/13 is R967.5 billion. This amount is R1.9 billion less than the estimate in the 2012 Budget and 8.9 per cent more than the 2011/12 outcome.
Of the voted appropriations to national departments, spending amounted to R498.9 billion in 2011/12, 97.7 per cent of the adjusted appropriation of R510.9 billion. In the first six months of 2012/13, R257.1 billion was spent, or 47.1 per cent of the adjusted appropriation for the year of R546.4 billion.
Transfers and subsidies includes conditional grants to provinces and municipalities, social grants, housing subsidies and transfers to universities, science councils and public entities. It is the largest category of national department spending, followed by compensation of employees.
Provincial expenditure in 2011/12 amounted to R368.3 billion, 98.7 per cent of a total adjusted budget of R373.0 billion. Expenditure by provinces was R189.2 billion in the first six months of 2012/13, representing 48.7 per cent of the main appropriation for the year.
Provinces are primarily responsible for the delivery of social services, including basic education and health services. Compensation of employees is consequently the largest category in provincial budgets, accounting for 59 per cent of expenditure in 2011/12. Underspending on capital projects
Table 4.1 National and provincial expenditure: 2011/12 outcomes and 2012/13
mid-year estimates2011/12 2012/13
R billion
Originalbudget
Adjusted estimate
Preliminary outcome
Over(-)/ under(+)
Originalbudget
Adjusted
estimate1
Actual spending April to
September
National revenue fund expenditure
888.9 893.8 888.0 5.7 969.4 967.5 464.8
State debt cost 76.6 76.9 76.5 0.4 89.4 88.8 43.5
Provincial equitable share 288.5 291.7 291.7 – 309.1 313.0 154.5
Other direct charges 20.2 20.2 21.0 -0.8 21.5 23.3 9.7
National votes 499.5 510.9 498.9 12.1 543.6 546.4 257.1
of which:
Compensation of employees 92.4 94.4 92.7 1.7 101.0 103.3 49.8
Transfers and subsidies 342.2 349.2 343.2 6.0 370.9 371.7 181.8
Payments for capital assets 11.2 12.1 12.0 0.2 15.2 14.4 4.3
Unallocated and contingency reserve
4.1 – – – 5.8 – –
Projected underspending – -6.0 – -6.0 – -3.5 –
Local government repayment to the National revenue fund
– – – – – -0.5 –
Provincial expenditure 365.5 373.0 368.3 4.7 388.4 n/a 189.2
of which:
Compensation of employees 212.2 215.5 217.5 -1.9 231.9 n/a 115.8
Transfers and subsidies 51.3 55.7 54.2 1.5 55.6 n/a 26.6
Payments for capital assets 27.6 29.4 25.9 3.5 27.2 n/a 12.5
1. Provinces will table adjusted estimates during November 2012
Most spending under voted allocations is for transfers and subsidies, followed by compensation of employees
Spending on provincial infrastructure shows signs of improvement

2012 MEDIUM TERM BUDGET POLICY STATEMENT
36
in 2011/12 amounted to R3.5 billion, but capital spending shows an improvement in the first six months of 2012/13.
Revised national expenditure estimates, 2012/13 The Adjustments Appropriation Bill and the Division of Revenue Amendment Bill set out amendments in the current financial year. These reflect in-year changes to allocations made possible by reprioritisation within the existing expenditure envelope. The bills propose the following changes:
• R1.5 billion in rollovers arising from commitments related to unspent balances in 2011/12.
• R1.5 billion to cover the costs of higher-than-expected salary adjustments in national departments flowing from the public-sector wage settlement reached in 2012.
• R323 million to cover costs associated with hosting the 2013 Africa Cup of Nations football tournament, including security, protocol and migration services.
• R450 million for the rehabilitation of Mthatha airport.
• R375 million for community development projects that support environmental management and conservation under the expanded public works programme.
• R187.7 million for VAT payments for the purchase of the new Antarctic research vessel, the SA Agulhas II.
• R118.3 million for contractual penalties incurred by Denel Saab Aerostructures related to the A400M aircraft contracts.
• R80.7 million for additional game rangers to combat rhinoceros poaching in the Kruger National Park.
• R63 million to deploy vessels and resources in joint anti-piracy operations in the Mozambican Channel.
• R440.1 million refunded to departments for monies paid directly into the National Revenue Fund from department-specific activities.
• R3 billion that will not be spent in 2012/13 and has been declared as savings by departments.
Revised provincial allocations
• R4 billion added to the provincial equitable share for higher-than-anticipated salary costs related to the public-sector wage settlement.
• R87.3 million to the further education and training colleges grant to cover the cost of the wage settlement.
• R366 million for infrastructure in the health sector: R180 million to the health infrastructure grant and R186 million to the hospital revitalisation grant.
• R15 million for health-related costs associated with hosting the 2013 Africa Cup of Nations tournament.
Revised local government allocations
• R123.1 million to cover costs to cities associated with hosting the 2013 Africa Cup of Nations tournament.
In addition, there is a R500 million reduction in the local government equitable share to offset unspent conditional grant monies owed to the National Revenue Fund.
Details of the revised national spending allocations are set out in the Adjusted Estimates of National Expenditure, including rollovers of unspent funds from 2011/12, approved allocations of unforeseeable and unavoidable expenditure, other shifts and adjustments, and declared savings. Revised provincial appropriations will be tabled in provincial legislatures before the end of the financial year.
Division of revenue: 2013/14 – 2015/16
After providing for debt-service costs, the 2012 Budget allowed for spending of R953 billion in 2013/14 and R1.03 trillion in 2014/15. These non-interest spending ceilings will be retained for the 2013 Budget, and a ceiling of R1.12 trillion is set for 2015/16, in keeping with the fiscal policy stance outlined in Chapter 3. The main budget framework is shown in Table 4.2.
Baseline expenditure announced in 2012 Budget will be maintained
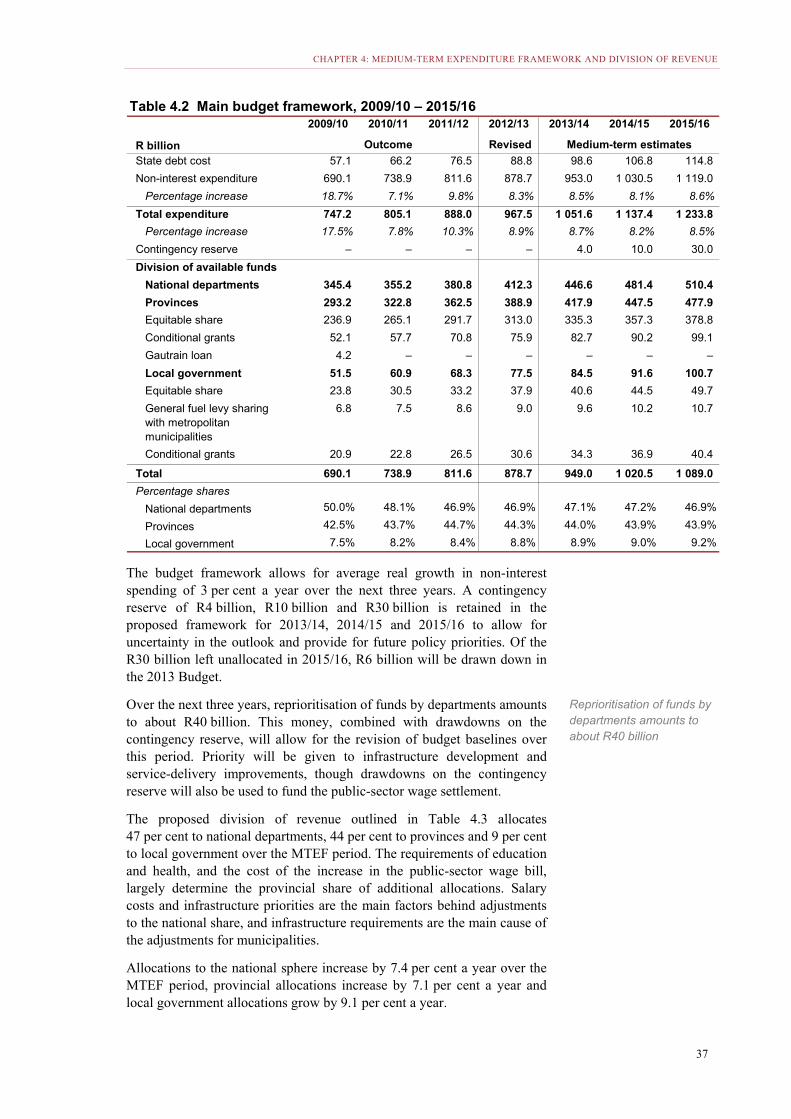
CHAPTER 4: MEDIUM-TERM EXPENDITURE FRAMEWORK AND DIVISION OF REVENUE
37
The budget framework allows for average real growth in non-interest spending of 3 per cent a year over the next three years. A contingency reserve of R4 billion, R10 billion and R30 billion is retained in the proposed framework for 2013/14, 2014/15 and 2015/16 to allow for uncertainty in the outlook and provide for future policy priorities. Of the R30 billion left unallocated in 2015/16, R6 billion will be drawn down in the 2013 Budget.
Over the next three years, reprioritisation of funds by departments amounts to about R40 billion. This money, combined with drawdowns on the contingency reserve, will allow for the revision of budget baselines over this period. Priority will be given to infrastructure development and service-delivery improvements, though drawdowns on the contingency reserve will also be used to fund the public-sector wage settlement.
The proposed division of revenue outlined in Table 4.3 allocates 47 per cent to national departments, 44 per cent to provinces and 9 per cent to local government over the MTEF period. The requirements of education and health, and the cost of the increase in the public-sector wage bill, largely determine the provincial share of additional allocations. Salary costs and infrastructure priorities are the main factors behind adjustments to the national share, and infrastructure requirements are the main cause of the adjustments for municipalities.
Allocations to the national sphere increase by 7.4 per cent a year over the MTEF period, provincial allocations increase by 7.1 per cent a year and local government allocations grow by 9.1 per cent a year.
Table 4.2 Main budget framework, 2009/10 – 2015/162009/10 2010/11 2011/12 2012/13 2013/14 2014/15 2015/16
R billion Outcome Revised Medium-term estimates
State debt cost 57.1 66.2 76.5 88.8 98.6 106.8 114.8
Non-interest expenditure 690.1 738.9 811.6 878.7 953.0 1 030.5 1 119.0
Percentage increase 18.7% 7.1% 9.8% 8.3% 8.5% 8.1% 8.6%
Total expenditure 747.2 805.1 888.0 967.5 1 051.6 1 137.4 1 233.8
Percentage increase 17.5% 7.8% 10.3% 8.9% 8.7% 8.2% 8.5%
Contingency reserve – – – – 4.0 10.0 30.0
Division of available funds
National departments 345.4 355.2 380.8 412.3 446.6 481.4 510.4
Provinces 293.2 322.8 362.5 388.9 417.9 447.5 477.9
Equitable share 236.9 265.1 291.7 313.0 335.3 357.3 378.8
Conditional grants 52.1 57.7 70.8 75.9 82.7 90.2 99.1
Gautrain loan 4.2 – – – – – –
Local government 51.5 60.9 68.3 77.5 84.5 91.6 100.7
Equitable share 23.8 30.5 33.2 37.9 40.6 44.5 49.7
General fuel levy sharing with metropolitan municipalities
6.8 7.5 8.6 9.0 9.6 10.2 10.7
Conditional grants 20.9 22.8 26.5 30.6 34.3 36.9 40.4
Total 690.1 738.9 811.6 878.7 949.0 1 020.5 1 089.0
Percentage shares
National departments 50.0% 48.1% 46.9% 46.9% 47.1% 47.2% 46.9%
Provinces 42.5% 43.7% 44.7% 44.3% 44.0% 43.9% 43.9%
Local government 7.5% 8.2% 8.4% 8.8% 8.9% 9.0% 9.2%
Reprioritisation of funds by departments amounts to about R40 billion

2012 MEDIUM TERM BUDGET POLICY STATEMENT
38
Section 214 of the Constitution and Section 9 of the Intergovernmental Fiscal Relations Act (1997) require the Financial and Fiscal Commission to make recommendations on the division of revenue at least 10 months before the budget is tabled. The commission tabled its submission in Parliament in May 2012. Government will formally respond to matters raised in the submission when it tables the 2013 Budget in February.
Funding provincial government
Provinces are responsible for the bulk of government’s social spending. Over the medium term, reprioritised funds will enable provinces to extend and improve school facilities, expand library services, improve health services and increase social welfare services. Contributing to these priorities, R38.1 billion will be added to transfers to provincial spending over the next three years.
Provincial equitable share
Additions to the provincial equitable share of R6.3 billion in 2013/14, R8.0 billion in 2014/15 and R13.4 billion in 2015/16 are proposed. These increases will provide for the costs of the public-sector wage agreement, while allowing for growth in the number of health practitioners. They will also fund improvements in education for learners from poor backgrounds, improved diagnostics in healthcare and greater welfare support.
Table 4.3 Division of revenue, 2012/13 – 2015/16
R billion
2012/13 2013/14 2014/15 2015/16 Average annual growth
2012/13 – 2015/16
National allocations 412.3 446.6 481.4 510.4 7.4%
of which:
Indirect grants to provinces 1 2.3 2.5 3.3 3.1 9.7%
Indirect grants to local
government 1
5.1 5.9 7.4 9.3 21.9%
Provincial allocations 388.9 417.9 447.5 477.9 7.1%
Equitable share 313.0 335.3 357.3 378.8 6.6%
Conditional grants 75.9 82.7 90.2 99.1 9.3%
Local government allocations 77.5 84.5 91.6 100.7 9.1%
Total allocations 878.7 949.0 1 020.5 1 089.0 7.4%
Changes to baseline
National allocations -0.1 0.3 2.6 13.5
of which:
Indirect grants to provinces 1 – -2.7 -2.2 -2.7
Indirect grants to local
government 1
0.0 0.2 1.6 3.2
Provincial allocations 4.4 6.8 10.5 20.8
Equitable share 4.0 6.3 8.0 13.4
Conditional grants 0.5 0.5 2.5 7.4
Local government allocations 0.1 0.7 0.9 5.8
Total 4.5 7.9 14.0 40.1
1. Amounts may be shifted between direct and indirect grants to provinces and local government before the 2013 Budget is tabled
R38.1 billion is added to provincial transfers to improve education, health and social services
CHAPTER 4: MEDIUM-TERM EXPENDITURE FRAMEWORK AND DIVISION OF REVENUE
39
The provincial equitable share formula will be updated with data from the 2011 Census for the total population and school-age population in each province. These variables account for a substantial weighting in the formula and could result in changes to provincial allocations over time.
Provincial conditional grants
Proposed adjustments to provincial conditional grants include the following:
• Additional resources will be made available in the further education and training colleges grant to cover the cost of the wage agreement.
• The comprehensive HIV and Aids grant is allocated additional money to compensate for the reduction in US donor funding of HIV and Aids prevention, care and treatment programmes.
• Funds will be added to the human settlements development grant for informal settlements upgrading.
• Funds will be made available for further investment in provincial roads.
• Increased resources are being made available for the community library services grant.
• Reprioritised funds will be used to improve the delivery of school infrastructure in provinces through the education infrastructure grant.
• The devolution of the property rates fund grant will be phased out as soon as grant conditions have been met.
Additions are proposed to fund education infrastructure, the higher take-up of antiretroviral medicines and to increase condom distribution.
Improving performance in provincial infrastructure delivery Over the next three years government aims to achieve better value for money from investment in provincial infrastructure. A new approach to infrastructure conditional grants is intended to institutionalise proper planning. Provinces will be required to bid for these allocations two years in advance and financial incentives will be built into the grant for provinces that implement best practices in delivering infrastructure.
Funding local government
Allocations to local government have grown rapidly over the past decade, allowing municipalities to expand infrastructure and deliver free basic services to the poor. Over the 2013 MTEF, allocations to local government continue to grow faster than those for national and provincial government. Greater emphasis will be placed on maintaining infrastructure and ensuring that those who can afford to pay for services do so. A total of R12.3 billion is added to the local government budget framework over the 2013 MTEF, including direct and indirect transfers.
Local government equitable share
The local government equitable share funds the provision of free basic services to the poor and helps to defray administrative costs. A new formula will be introduced in the 2013 Budget. Additions to the local government equitable share over the MTEF will compensate for the rising costs of bulk water and electricity.
Support for HIV and Aids programmes compensates for reduction in donor funding
Allocations to local government continue to grow faster than those for national and provincial government

2012 MEDIUM TERM BUDGET POLICY STATEMENT
40
Local government conditional grants
Local government conditional grants are being reformed to provide targeted support to different types of municipalities. The human settlements and public transport functions are being devolved to urban municipalities, and greater technical support will be provided in rural areas. In 2012/13, a new direct grant for water infrastructure administered by the Department of Water Affairs will enable the department to help municipalities deliver clean drinking water to households.
Over the medium term, funds will be made available to expand the integrated national electrification programme. Reprioritised funds will also be used to improve the sustainability of municipal services by subsidising critical refurbishment projects, and combating wastage of water and electricity.
National government has already made substantial investments in the construction of local government infrastructure, committing over R100 billion for this purpose through direct and indirect conditional grants from 2007/08 to 2011/12. These transfers have made a significant difference to the lives of South Africans who did not previously have access to municipal services. However, there are still areas where households do not have access to basic services.
The 2011 Census data will be used to identify areas where progress has been made and where it has not. During 2013, the effectiveness of conditional grants in facilitating the rollout of infrastructure will be reviewed by the National Treasury, other national departments, the South African Local Government Association and municipalities. This review could result in changes to the structure of conditional grants from 2014/15.
Census data will also be used to update the backlog figures in the formulas used to allocate funds for infrastructure conditional grants. This will ensure that funds are targeted at areas that need them most. All changes will be phased in to avoid disruption to existing infrastructure plans.
Review of the local government equitable share formula Local government’s equitable share of nationally raised revenue is distributed between the country’s 278 municipalities by means of a formula. This formula has been reviewed by the National Treasury, the Department of Cooperative Governance and the South African Local Government Association, with assistance from the Financial and Fiscal Commission and Statistics South Africa.
The proposed structure of a new formula has been endorsed by the Budget Forum – the intergovernmental entity consulted on fiscal issues that affect municipalities.
The formula will provide a subsidy for the provision of free basic water, electricity, sanitation and refuse removal services for every poor household. The formula will also provide funds for the institutional costs of municipalities and, for the first time, will explicitly allocate funds for non-trading services, such as municipal roads and fire services. To ensure that the funds for institutional costs and non-trading services are targeted at poorer municipalities, the proposed formula will apply a revenue-adjustment factor reflecting municipalities’ ability to generate their own revenue.
The formula will use data from the 2011 Census and will be updated annually to reflect estimates of population growth and projected increases in the cost of services such as water and electricity. The formula will also include explicit funding for the maintenance of basic services funded through the equitable share.
Details of the new formula are being finalised to take into account inputs received from municipalities. The final formula will be presented as part of the Division of Revenue Bill tabled with the 2013 Budget.
Greater technical support for rural municipalities
Additional support for electrification, and to combat wastage of water
Following analysis of 2011 Census data, structure of conditional grants could be changed from 2014/15

CHAPTER 4: MEDIUM-TERM EXPENDITURE FRAMEWORK AND DIVISION OF REVENUE
41
Table 4.4 Consolidated government expenditure, 2011/12 – 2015/162011/12 2012/13 2013/14 2014/15 2015/16 Average
annual growth
R billion
Outcome Revised Medium-term estimates 2012/13 – 2015/16
General public services 51.7 53.3 56.0 59.6 62.1 5.2%
Defence, public order and safety 128.4 141.7 151.7 160.6 169.8 6.2%
Defence and state security 38.4 42.0 44.7 47.4 50.2 6.1%Police services 60.2 66.2 70.9 75.1 79.5 6.3%Law courts 13.8 15.6 17.1 18.2 19.3 7.4%Prisons 16.0 17.9 19.0 19.9 20.9 5.3%
Transport, energy and communication 78.2 83.5 91.5 98.8 105.1 7.9%Fuel and energy 9.5 8.5 9.6 10.7 10.3 6.4%Transport 66.4 72.5 79.7 86.1 92.5 8.4%Communication 2.3 2.5 2.2 2.0 2.3 -2.7%
Economic services 38.1 44.6 48.1 50.4 52.6 5.6%
Local government, housing and community amenities
109.0 121.7 132.5 144.5 157.5 9.0%
Housing development 25.5 28.6 31.9 33.7 36.2 8.1%
Local government and communitydevelopment
60.2 67.2 72.3 77.8 84.5 7.9%
Water supply 23.4 25.8 28.3 33.1 36.8 12.6%
Health 114.1 121.7 132.3 141.8 151.1 7.5%
Social protection 115.2 124.5 135.6 145.7 155.3 7.6%
Education and related functions 204.2 220.0 234.0 250.5 268.9 6.9%
Employment and social security 35.9 43.0 48.6 53.9 55.9 9.1%
Science and technology 13.0 14.1 14.5 15.4 16.0 4.1%
Allocated by function 887.9 968.3 1 044.8 1 121.3 1 194.2 7.2%
State debt cost 76.5 88.8 98.6 106.8 114.8 8.9%
Contingency and policy reserve – – 4.0 10.0 30.0
Consolidated expenditure1 964.4 1 057.1 1 147.4 1 238.1 1 339.0 8.2%
Economic classification
Current payments 582.4 645.0 694.5 740.9 786.6 6.8%
Compensation of employees 346.0 378.3 403.8 429.6 456.2 6.4%
Goods and services 154.2 171.4 183.9 195.8 206.5 6.4%
Interest and rent on land 82.2 95.3 106.9 115.5 123.9 9.1%
of which: state debt cost 76.5 88.8 98.6 106.8 114.8 8.9%
Transfers and subsidies 313.9 340.4 374.9 404.6 430.0 8.1%
Provinces and municipalities 73.4 81.0 90.2 98.1 107.8 10.0%
Departmental agencies and accounts 21.2 18.9 22.0 23.3 26.1 11.4%
Higher education institutions 19.8 21.2 22.5 23.9 25.0 5.7%
Foreign governments and internationalorganisations
2.3 2.2 2.3 2.4 2.4 3.7%
Public corporations and private enterprises 24.1 27.3 30.8 34.3 34.1 7.8%Non-profit institutions 23.8 24.9 28.4 30.1 31.2 7.8%Households 149.4 164.9 178.8 192.4 203.1 7.2%
Payments for capital assets 66.7 70.2 73.6 82.2 92.4 9.6%
Buildings and other capital assets 51.6 55.8 60.1 65.1 72.3 9.0%
Machinery and equipment 15.2 14.4 13.5 17.1 20.1 11.7%
Payments for financial assets 1.4 1.5 0.3 0.5 –
Total 964.4 1 057.1 1 143.4 1 228.1 1 309.0 7.4%
Contingency and policy reserve – – 4.0 10.0 30.0
Consolidated expenditure1 964.4 1 057.1 1 147.4 1 238.1 1 339.0 8.2%
1. Consisting of national, provincial, social security funds and selected public entities

2012 MEDIUM TERM BUDGET POLICY STATEMENT
42
Medium-term expenditure framework
Estimates of the consolidated expenditure of national government, provinces, social security funds and public entities over the forthcoming MTEF period are set out in Table 4.4. The resource envelope has been distributed between function groups rather than departments to reflect shared responsibility for many key outcomes and priorities.
Health and social development
Consolidated health spending has moderated in 2012/13, following five years during which expenditure increased by an average of 15.8 per cent per year. Given the constrained fiscal environment, the health sector has to seek greater efficiency and improve financial management, with particular emphasis on critical inputs such as medicines and medical supplies.
Priorities over the 2013 MTEF period include the rollout of an improved diagnostic test for tuberculosis. Additional allocations will be made for HIV and Aids, taking into account the phasing out of a US-funded assistance programme. Growth in the number of personnel employed in provincial health departments will slow, after increasing by 50 000 over the past four years to 313 000.
In social development, savings of about R450 million per year have been identified as a result of the new grants administration contract. A portion of this will be reprioritised to improve the South African Social Security Agency’s infrastructure and systems, and to employ additional social workers. Administrative costs are expected to fall to below 5 per cent of grant spending. As shown by Table 4.5, the number of social assistance beneficiaries is forecast to increase from 16.2 million in 2012/13 to 17.3 million over the next three years, with annual growth slowing to 2.0 per cent in 2015/16. The 2013 Budget will provide for the recruitment of graduates from the social worker scholarship programme, which trains some 5 000 students. Attention will be given to supporting nongovernmental organisations (NGOs) in social development and facilitating a more equitable funding model for these organisations.
Education
The key outcomes in the education function are to improve the quality of education, develop a skilled and capable workforce, and promote inclusive citizenship. This is the largest expenditure category in the consolidated budget, rising to R269 billion by 2015/16 at an average annual rate of
Table 4.5 Social grants beneficiary projections,
2012/13 – 2015/16Thousand 2012/13 2013/14 2014/15 2015/16Old age & war veterans 2 834 2 897 2 958 3 019
Disability 1 185 1 182 1 181 1 181
Foster care 584 613 643 675
Care dependency 130 134 139 143
Child support 11 449 11 756 12 033 12 287
Total 16 182 16 582 16 954 17 305
Source: South African Social Security Agency
The health sector has to seek greater efficiency and improve financial management
Steps to strengthen social development and employ additional social workers
Education remains the largest category in the consolidated budget

CHAPTER 4: MEDIUM-TERM EXPENDITURE FRAMEWORK AND DIVISION OF REVENUE
43
6.9 per cent. The main drivers of growth are rising learner and student numbers, and associated growth in employment of teachers and student funding allocations. Supplementary funding in recent years has prioritised the school infrastructure backlogs grant, the National Student Financial Aid Scheme, further education and training (FET) colleges and improvements in employee compensation.
As a result of slow spending on the schools infrastructure backlogs grant, R7.2 billion has been taken away from this programme over the medium term. These funds will be used to increase the education infrastructure grant to provinces and the community library grant, and to support the construction of new universities in Mpumalanga and the Northern Cape.
Over the medium term, the basic education function will focus on improving numeracy and literacy in the foundation phase, expanding enrolment in grade R and reducing school infrastructure backlogs. In higher education and training, initiatives are in progress to bolster throughput rates at universities and improve the quality of FET college programmes.
Also in this function, government will be announcing a new national sports plan during the MTEF and rolling out Mzansi Golden Economy, an initiative to create jobs and stimulate economic activity in arts and culture.
Local government, housing and community amenities
The key priorities in the local government and housing function are the provision of basic services such as water and sanitation, human settlement development and local government infrastructure. This function grows by an annual average of 9.0 per cent over the spending period from R121.7 billion in 2012/13 to R157.5 billion in 2015/16.
As a result of slow spending on the municipal infrastructure grant, funds will be allocated to a new interim water supply programme run by the Department of Water Affairs. Additional expenditure will fund regional bulk water supply, acid mine drainage prevention, the De Hoop Dam
Table 4.6 Selected performance indicators, education and related function,
2009/10– 2015/162009/10 2010/11 2011/12 2012/13 2013/14 2014/15 2015/16
Indicator Past Current Projections
New learners enrolled in the Kha Ri Gude mass literacy campaign
613 643 609 199 660 924 678 000 687 000 696 700 706 000
Funza Lushaka teacher education bursaries awarded
9 190 10 074 8 773 11 500 14 500 15 500 16 500
Learners fed a meal each school day (million)
7.4 8.1 8.8 9.1 9.1 9.1 9.1
Students in higher education institutions (full-time equivalent)
837 779 816 400 886 033 906 700 935 700 961 900 1 017 500
Students in FET colleges(full-time equivalent)
102 667 212 215 210 971 229 900 237 400 252 600 259 000
Community libraries upgraded 43 56 56 50 85 90 94
Community libraries built 7 10 13 15 18 20 21
Improving numeracy and literacy at the foundation phase remains a priority
Additional funding for water supply, pipelines and environmental management

2012 MEDIUM TERM BUDGET POLICY STATEMENT
44
pipelines from Steelpoort to Mooihoek, a pipeline from Flag Boshielo to Mokopane and effluent management at Magalies Water.
Informal settlement upgrading is prioritised in several areas, including mining communities around Rustenburg and in the municipalities of Lephalale, eMalahleni, Govan Mbeki and Steve Tshwete, while social housing is prioritised in urban areas.
Figure 4.1 shows how provision of water and sanitation services has expanded steadily over time. Demand management and better maintenance are required to ensure that improvements in the provision of water infrastructure translate into access to potable water.
Figure 4.1 Households with access to water and sanitation
Source: Department of Water Affairs, Department of Cooperative Governance and Traditional Affairs and census data
Employment and labour services
Active labour market policies are central to improving the economy’s employment potential. Additional allocations will be made in the 2013 Budget to the Department of Labour’s public employment services and the Council for Conciliation, Mediation and Arbitration in preparation for amended labour legislation. Supplementary funding will also be provided to maintain factories that provide jobs for disabled workers.
Government also seeks to expand employment opportunities through a wide range of public works and special employment programmes. Over the medium term, the Department of Public Works will spend over R4 billion in incentive grants to expanded public works projects implemented by provincial departments and municipalities. The community work programme will receive about R7.6 billion over the next three years and environmental programmes at least R8.5 billion.
Additional funds will also be made available to NGOs that participate in the non-state sector employment programme to support their contribution to job creation. Funding for the community work programme will increase by an annual average of 25 per cent over the MTEF period.
0
2 000 000
4 000 000
6 000 000
8 000 000
10 000 000
12 000 000
14 000 000
16 000 000
1993/94
1994/95
1995/96
1996/97
1997/98
1998/99
1999/00
2000/01
2001/02
2002/03
2003/04
2004/05
2005/06
2006/07
2007/08
2008/09
2009/10
2010/11
2011/12
Numb
er of
hous
ehol
ds
Total number of householdsAccess to sanitationAccess to water infrastructure > or = to basic service levels (RDP standards)
Management, maintenance are needed to ensure that infrastructure leads to provision of potable water
Active labour market policies are central to improving South Africa’s employment potential
Funding for community work programme increases by an annual average of 25 per cent

CHAPTER 4: MEDIUM-TERM EXPENDITURE FRAMEWORK AND DIVISION OF REVENUE
45
Figure 4.2 shows the performance and future targets of the expanded public works programme. The term “work opportunity” refers to the provision of work to an individual and can be of any duration, while “full-time equivalents” represents the total number of workdays created by a programme divided by the number of working days in a year.
Figure 4.2 Expanded public works programme: non-financial performance and targets, 2008/09 – 2013/14
About R5.5 billion will be allocated to the Jobs Fund over the MTEF period. Its initial allocations have been reduced owing to slow progress in establishing administrative capacity, but the approved R9 billion is expected to be fully committed over a five-year period. An amount of R1 billion has been shifted from the Jobs Fund allocation over the 2013 MTEF to other labour-market priorities.
Transport, energy and communication
Investment in economic infrastructure is central to the modernisation, improved competitiveness and enhanced growth potential of the economy. While the major investments in energy and transport infrastructure fall under separate state-owned enterprises, there are nonetheless substantial contributions made by the fiscus. Consolidated spending on transport, energy and communication is projected to rise from R83.5 billion in 2012/13 to R105.1 billion in 2015/16, with average growth of 7.9 per cent per year over the MTEF.
Spending will focus on national road upgrades and provincial road maintenance. A database recording the quality of bridges and roads across the country will help improve expenditure planning for provincial roads. Expenditure on public transport will continue to grow strongly, with spending on rail services growing at an average annual rate of 19.7 per cent between 2012/13 and 2015/16, supporting investment in rolling stock and signalling infrastructure.
440 266
570 815
843 459
1 210 000
1 650 000
146 359184 642
251 127
502 174
684 783
0
200 000
400 000
600 000
800 000
1 000 000
1 200 000
1 400 000
1 600 000
1 800 000
2008/09 2009/10 2011/12 2012/13 t* 2013/14 t*
Numb
er
Work opportunitiesFull-time equivalent jobs
Expanded public works programme expected to create 685 000 ‘full-time equivalent’ jobs by 2013/14
R5.5 billion will be allocated to the Jobs Fund over the medium term
Spending on public transport grows strongly to support investments in rolling stock and signalling

2012 MEDIUM TERM BUDGET POLICY STATEMENT
46
The integrated national electrification programme, which connects previously unserved households to the national grid, continues to receive support. Funding is also set aside for upgrades to municipal electricity distribution. The new Municipal Infrastructure Support Agency, established to build infrastructure capacity at local government level, will also receive funding. While 5.5 million households have been connected to the electricity grid since 1994, an estimated 3.4 million households are still without access to electricity. Figure 4.3 shows how this backlog is distributed by province.
Figure 4.3 Electricity backlogs by province
Source: Department of Energy
To improve efficiency in the delivery of electricity connections, both on and off grid, the Department of Energy will develop an electrification master plan in collaboration with Eskom and other interested parties to reduce the cost per connection, support asset maintenance and enhance delivery mechanisms to achieve universal electrification.
There will be additional spending on digital television broadcasting. Money will also be set aside to fund a new broadband strategy once it is approved by Cabinet.
Reprioritised funds have also been made available for carbon capture and storage technology, and a feasibility study on hydraulic fracturing.
General administration
The general public services function has a baseline allocation of R53.3 billion in 2012/13, which is projected to grow by an average of 5.2 per cent a year over the MTEF period. The highest baseline growth is in the executive branch of government. This is the result of the incorporation of the National Youth Development Agency and Brand SA on the Presidency’s Vote, and the expansion of the Department of Performance Monitoring and Evaluation and the Department of Traditional Affairs. There will be a decline in transfers and subsidies in 2015/16 as public entities become more self-sufficient. The Government Printing Works will no longer rely on transfer payments from 2015/16 onwards.
613,113
200 435
878 725829 737
214 409
44 397
270 877
157 419212 552
0
100 000
200 000
300 000
400 000
500 000
600 000
700 000
800 000
900 000
1000 000
Eastern Cape
Free State
Gauteng
KwaZulu Natal
Mpumalanga
Northern Cape
Limpopo
North West
Western Cape
Numb
er of
hous
ehol
ds
New agency established to build infrastructure capacity at local level
Electricity connection cost reduction and asset maintenance to receive attention
Highest baseline growth in general administration is in the executive and legislative branches

CHAPTER 4: MEDIUM-TERM EXPENDITURE FRAMEWORK AND DIVISION OF REVENUE
47
Reprioritised funds of R1.6 billion over the MTEF period (R333 million in 2013/14, R529 million in 2014/15 and R705 million in 2015/16) were identified in national departments and transfers to public entities. These adjustments will be made without adverse effects on service delivery.
Turning around Public Works The Department of Public Works has produced a turnaround strategy to stabilise its operations. The plan, which will cost R400 million, is under way and will continue over the medium term. Current-year priorities are:
• Clean audit interventions: To stabilise finance and supply chain management, financial specialists will be appointed to help the department chart a new approach and prepare for the 2012/13 audit.
• Anti-corruption and maladministration initiatives: The department is working with the Special Investigating Unit to investigate alleged irregularities, most of which relate to leases and supply chain management practices.
• Technical capacity: The department intends to fill 88 technical positions during 2012/13. These posts account for 40 per cent of 220 technical vacancies.
Economic services
Consolidated spending on economic services is expected to rise from R44.6 billion in 2012/13 to R52.6 billion in 2015/16. Over R10 billion of this is provided for the economic competitiveness support package announced in 2011, which includes incentives to improve manufacturing competitiveness and accelerate the development of special economic zones. The Department of Trade and Industry will continue to promote localisation and seek ways to broaden participation in the economy.
Funding of the competition authorities, and other economic regulatory and development finance institutions, will be strengthened over the period ahead.
Agriculture, forestry and fisheries, and rural development and land reform account for about 50 per cent of spending in economic services. Onderstepoort Biological Products will receive funding for modernisation. Work is under way on possible fiscal incentives for biofuels production to encourage agricultural employment and develop agro-processing industries.
Conditional grants for agriculture will encourage improvements in planning and monitoring. From 2008/09 to 2011/12, the Department of Rural Development and Land Reform spent R995 million on capital goods and operating expenses for 640 farms as part of land reform and restitution programmes. The National Rural Youth Services Corps has recruited 8 000 young people to work with rural communities. A review of the land restitution programme is due to be completed by December 2012 and a comprehensive land register is being updated.
Allocations to the Department of Mineral Resources in the 2013 Budget will include support for the beneficiation strategy and regulatory obligations associated with shale gas exploration. The focus over the medium term is to support improved health and safety regulation and mining inspections, and assist new and established small, medium and micro enterprises. Additional funds of R160 million will accommodate the rehabilitation of derelict and ownerless mines, of which there are about 6 000. An amount of R59 million has been added to implement amendments to the National Environmental Management Act.
Economic competitiveness support package receives over R10 billion
Work is under way on possible fiscal incentives for biofuels production
Support for minerals beneficiation strategy

2012 MEDIUM TERM BUDGET POLICY STATEMENT
48
Science and technology
The science and technology function includes the Department of Science and Technology and the main programmes of the Department of Environmental Affairs, the agencies reporting to these departments and the science councils. The function is allocated R14.5 billion in 2013/14, rising to R16.0 billion in 2015/16. Supplementary allocations to several science councils and technology programmes will be made from the economic competitiveness and support package.
South Africa and Australia have been selected to host a global radio astronomy project known as the Square Kilometre Array (SKA), positioning South Africa as a leading provider of scientific data internationally. The partnership is expected to attract global funding of R20 billion over the long term, accompanied by job creation, scientific development and advanced technology benefits. Over the period ahead further investment will be made in the MeerKAT phase, which entails construction of 64 telescope dishes and associated infrastructure.
Police, public order and safety
Expenditure on defence, public order and safety will grow at an average annual rate of 6.2 per cent over the MTEF period, from R141.7 billion in 2012/13 to R169.8 billion in 2015/16.
Fighting crime remains a priority. The serious crime rate per 100 000 of the population has declined from 4 299 in 2008/09 to 4 126 in 2011/12. Over the medium term, funds are reprioritised within the Department of Police to support expanded detective and forensic capability.
Funds are also reprioritised to the Department of Justice and Constitutional Development to improve the efficiency of the criminal justice system and to maintain Thuthuzela care centres, which assist victims of rape. The Department of Defence has reprioritised funds towards military veterans' benefits and towards the Maritime Security Strategy, which addresses the fight against piracy in the Indian Ocean and further development of naval facilities in Durban.
Conclusion
Departments at both national and provincial level have reprioritised spending to fulfil their core mandates and respond to South Africa’s most pressing needs without requiring additions to the MTEF baseline. At the same time, revisions to provincial and municipal financing arrangements are under way that seek to improve the quality of spending, especially in infrastructure delivery. These are necessary actions in the present fiscal climate. They will place public finances on a firmer footing over the medium term and assist the shift in the compensation of government expenditure towards productive areas. They will allow policies outlined in the National Development Plan to be implemented over the long term.
Science and technology function is allocated R14.5 billion in 2013/14
Continued support for Square Kilometre Array
Rate of serious crime shows some decline
Reprioritisation and savings initiatives will place public finances on a surer footing over the medium term

49
Annexure A
2011/12 outcome and half-year spending estimates for 2012/13

2012 MEDIUM TERM BUDGET POLICY STATEMENT
50
Table A.1 Expenditure by vote, 2011/12 and 2012/132011/121
R million
Main budget
Adjusted budget
Preliminaryoutcome
Over(-)/ Under(+)
Main budget
Adjusted budget
Actual spending April to
September
Central Government Administration
1 The Presidency 890 1 006 979 27 1 018 1 062 464
2 Parliament2 1 265 1 273 1 215 58 1 333 1 338 611 3 Cooperative Governance and Traditional Affairs 47 934 48 205 46 222 1 983 54 716 54 855 21 584 4 Home Affairs 5 464 5 851 5 655 196 5 296 5 244 2 464 5 International Relations and Cooperation 4 797 5 153 5 022 132 5 117 5 272 2 083 6 Performance Monitoring and Evaluation 79 99 96 3 174 174 58 7 Public Works 7 819 7 830 7 061 768 7 994 7 891 4 137 8 Women, Children and People with Disabilities 118 143 166 -23 172 193 90 Financial and Administrative Services
9 Government Communication and Information System
419 364 344 21 429 461 180
10 National Treasury 22 598 23 839 21 362 2 477 21 551 21 178 9 519
11 Public Enterprises 230 353 346 7 1 249 1 377 84
12 Public Service and Administration 690 690 645 45 731 727 303
13 Statistics South Africa 3 241 3 730 3 674 56 1 722 1 762 890
Social Services
14 Arts and Culture 2 469 2 537 2 406 131 2 686 2 672 1 244 15 Basic Education 13 868 14 080 12 901 1 180 16 344 16 204 7 506 16 Health 25 732 25 968 25 713 255 27 557 28 057 14 041 17 Higher Education and Training 28 229 28 300 28 282 18 31 500 31 586 22 240 18 Labour 1 981 2 017 2 007 10 2 120 2 140 990 19 Social Development 104 733 104 284 103 139 1 145 112 217 112 144 55 919 20 Sport and Recreation South Africa 803 821 811 10 848 1 063 362 Justice, Crime Prevention and Security
21 Correctional Services 16 559 16 687 15 793 894 17 732 17 700 7 996 22 Defence and Military Veterans 34 605 34 349 34 331 18 37 493 37 889 16 096 23 Independent Complaints Directorate 152 154 154 – 197 198 75 24 Justice and Constitutional Development 11 413 11 582 11 574 7 13 080 13 021 6 112 25 Police 58 062 58 551 57 933 617 62 485 63 389 29 965 Economic Services and Infrastructure
26 Agriculture, Forestry and Fisheries 4 720 4 964 4 928 36 5 799 5 869 2 968 27 Communications 1 889 2 003 1 792 211 1 712 1 655 764 28 Economic Development 595 598 578 21 673 697 330 29 Energy 6 090 6 201 6 174 27 6 806 6 734 3 151 30 Environmental Affairs 2 846 4 202 4 109 93 4 512 5 175 2 303 31 Human Settlements 22 578 22 826 22 599 227 25 263 25 138 10 056 32 Mineral Resources 1 036 1 039 1 029 10 1 169 1 176 642 33 Rural Development and Land Reform 8 124 8 137 7 998 139 8 878 8 974 3 381 34 Science and Technology 4 405 4 407 4 403 4 4 956 5 000 3 139 35 Tourism 1 243 1 265 1 250 15 1 367 1 374 728 36 Trade and Industry 6 787 6 877 6 801 76 9 092 8 351 4 148 37 Transport 35 084 35 767 35 447 321 38 829 39 647 17 711 38 Water Affairs 9 936 9 028 8 165 863 8 813 8 993 2 738
Total appropriation by vote 499 481 505 179 493 104 12 076 543 630 546 379 257 071
State debt cost 76 579 76 864 76 460 404 89 388 88 794 43 546
Provincial equitable share 288 493 291 736 291 736 – 309 057 313 016 154 529 General fuel levy sharing with metropolitanmunicipalities
8 573 8 573 8 573 – 9 040 9 040 3 013
Other direct charges against the National Revenue Fund
11 667 11 666 12 424 -757 12 441 14 235 6 679
g gRevenue Fund 385 312 388 839 389 193 -353 419 926 425 085 207 766
Unallocated and contingency reserve 4 130 – – – 5 810 – –
Less: Projected underspending – -6 000 – -6 000 – -3 500 – Less: Local government repayment to National Revenue Fund
– – – – – -500 –
Total 888 923 888 018 882 296 5 722 969 365 967 463 464 837
Additional adjustments appropriation act (Transport) – 5 750 5 750 – – – –
Total 888 923 893 768 888 046 5 722 969 365 967 463 464 837
1. The 2011/12 financial year numbers were adjusted to include function shifts
2. The audited outcome for Parliament is converted from accrual to cash
2012/13

ANNEXURE A
51
Table A.2 Expenditure by province, 2011/12 and 2012/132011/12
R million
Main budget
Adjusted budget
Preliminary outcome
Over(-)/ Under(+)
Deviation from
adjusted budget
Main budget
Actual spending April to
September
Eastern Cape 52 644 54 327 53 753 574 1.1% 56 205 26 425
Education 24 635 25 145 25 174 -29 -0.1% 26 288 12 807
Health 14 237 14 813 14 901 -88 -0.6% 15 166 7 529
Social Development 1 711 1 711 1 692 19 1.1% 1 782 819
Other functions 12 060 12 658 11 986 672 5.3% 12 968 5 270
Free State 23 188 24 203 23 767 436 1.8% 24 870 12 812
Education 9 496 9 778 9 718 60 0.6% 10 045 5 381
Health 6 821 6 930 6 813 118 1.7% 7 383 4 067
Social Development 802 813 804 9 1.1% 865 426
Other functions 6 069 6 682 6 433 249 3.7% 6 577 2 939
Gauteng 67 645 68 887 67 909 978 1.4% 69 311 35 893
Education 25 965 26 438 26 122 315 1.2% 27 151 14 476
Health 22 838 23 387 23 813 -427 -1.8% 24 519 13 708
Social Development 2 425 2 433 2 334 99 4.1% 2 490 1 211
Other functions 16 418 16 629 15 640 989 5.9% 15 150 6 497
KwaZulu-Natal 77 300 78 332 78 649 -317 -0.4% 83 571 41 755
Education 32 618 33 227 33 799 -572 -1.7% 34 765 18 178
Health 24 485 24 669 24 791 -122 -0.5% 26 555 13 363
Social Development 1 953 1 953 1 939 14 0.7% 2 048 858
Other functions 18 244 18 483 18 120 363 2.0% 20 204 9 356
Limpopo 43 932 44 321 43 183 1 137 2.6% 45 937 21 937
Education 20 859 21 068 21 161 -93 -0.4% 22 126 10 560
Health 11 588 11 672 11 366 305 2.6% 11 948 6 285
Social Development 1 159 1 163 1 162 1 0.1% 1 166 653
Other functions 10 326 10 417 9 493 924 8.9% 10 698 4 440
Mpumalanga 29 198 29 967 29 393 575 1.9% 30 968 14 902
Education 12 952 13 201 13 024 177 1.3% 13 984 6 970
Health 7 365 7 548 7 225 323 4.3% 7 544 3 410
Social Development 956 961 958 4 0.4% 920 436
Other functions 7 925 8 257 8 186 72 0.9% 8 520 4 087
Northern Cape 10 285 10 866 10 763 103 1.0% 11 355 5 410
Education 4 062 4 110 4 081 30 0.7% 4 197 2 155
Health 2 947 3 011 3 007 5 0.2% 3 122 1 572
Social Development 520 525 523 2 0.4% 526 244
Other functions 2 756 3 220 3 153 67 2.1% 3 511 1 439
North West 24 465 25 036 23 940 1 097 4.4% 26 272 11 585
Education 10 261 10 424 10 148 276 2.6% 10 872 5 083
Health 6 321 6 414 6 380 33 0.5% 6 959 3 195
Social Development 882 897 883 14 1.6% 950 380
Other functions 7 000 7 302 6 528 773 10.6% 7 490 2 927
Western Cape 36 839 37 088 36 949 138 0.4% 39 917 18 512
Education 13 332 13 377 13 361 16 0.1% 14 229 6 803
Health 13 395 13 429 13 388 41 0.3% 14 632 6 880
Social Development 1 332 1 332 1 317 15 1.1% 1 412 616
Other functions 8 780 8 949 8 883 66 0.7% 9 644 4 212
Total 365 496 373 027 368 306 4 721 1.3% 388 406 189 231
Education 154 181 156 768 156 589 179 0.1% 163 657 82 412
Health 109 997 111 872 111 684 188 0.2% 117 829 60 009
Social Development 11 740 11 789 11 611 178 1.5% 12 160 5 643
Other functions 89 578 92 598 88 423 4 176 4.5% 94 761 41 167
2012/13

2012 MEDIUM TERM BUDGET POLICY STATEMENT
52
This page was left blank intentionally.

53
Glossary
Adjustments estimate Presentation to Parliament of the amendments to be made to the appropriations voted in the main budget for the year.
Appropriation The approval by Parliament of spending from the National Revenue Fund, or by a provincial legislature from the Provincial Revenue Fund.
Asset price bubble A condition occurring when prices for a category of assets rise above the level justified by economic fundamentals.
Balance of payments A summary statement of all the transactions of the residents of a country with the rest of the world over a particular time period.
Baseline The initial allocations used during the budget process, derived from the previous year’s forward estimates.
Budget balance The difference between expenditure and revenue. If expenditure exceeds revenue, the budget is in deficit – or, if the reverse is true, it is in surplus.
Capital gains tax Tax levied on the profits realised from the disposal of capital assets or investments by a taxpayer. A capital gain is the excess of the selling price over the original purchase price of a capital asset.
Capital flow A flow of investments in and out of the country.
Conditional grants Allocations of money from one sphere of government to another, conditional on certain services being delivered or on compliance with specified requirements.
Consolidated government expenditure
Total expenditure by national and provincial government, social security funds and selected public entities, including transfers and subsidies to municipalities, businesses or other entities. See also main budget.
Consumer price inflation (CPI)
The main measure of inflation, charting the price movements of a basket of consumer goods and services.
Consumption expenditure Expenditure on goods and services, including salaries, which are used up within a short period of time – usually a year.
Contingency reserve An amount set aside, but not allocated in advance, to accommodate changes to the economic environment and to meet unforeseen spending pressures.
Countercyclical fiscal policy Policy that has the opposite effect on economic activity to that caused by the business cycle, such as slowing spending growth in a boom period and accelerating spending in a recession.

2012 MEDIUM TERM BUDGET POLICY STATEMENT
54
Current account (of the balance of payments)
The difference between total exports and total imports, also taking into account service payments and receipts, interest, dividends and transfers. The current account can be in deficit or surplus. See also trade balance.
Debt-service cost The cost of interest on government debt.
Depreciation (capital) A reduction in the value of fixed capital as a result of wear and tear or redundancy.
Depreciation (exchange rate) A reduction in the external value of a currency.
Division of revenue The allocation of funds between the spheres of government as required by the Constitution.
Economic cost The cost of an alternative that must be forgone to pursue a certain action.
Equitable share The allocation of revenue to the national, provincial and local spheres of government as required by the Constitution.
Financial and Fiscal Commission
An independent body established in terms of the Constitution to make recommendations to Parliament and provincial legislatures about financial issues affecting the three spheres of government.
Financial account (of the balance of payments)
A statement of all financial transactions between a country and the rest of the world, including portfolio and fixed investment flows and movements in foreign reserves.
Financial year The 12 months according to which companies and organisations budget and account. Government’s financial year runs from 1 April to 31 March.
Fiscal policy Policy on taxation, spending and borrowing by government.
Fiscal space The ability of a government’s budget to provide additional resources without jeopardising fiscal sustainability.
Foreign direct investment The acquisition of long-term business interests in another country, usually involving management, technology and financial participation.
GDP inflation A measure of the total increase in prices in the whole economy. Unlike CPI inflation, GDP inflation includes price increases in goods that are exported and intermediate goods such as machines, but excludes imported goods.
Gross domestic product (GDP) A measure of the total national output, income and expenditure in the economy. GDP per head is the simplest overall measure of welfare, although it does not take account of the distribution of income, nor of goods and services produced outside the market economy.
Gross fixed-capital formation The addition to a country’s fixed-capital stock over a specific period, before provision for depreciation.
Inflation An increase in the general level of prices.
Inflation targeting A monetary policy framework intended to achieve price stability over a certain period of time. The Reserve Bank and government agree on a target rate or range of inflation to be maintained.

GLOSSARY
55
Main budget expenditure National government expenditure and transfers to provincial and local government financed from the National Revenue Fund, excluding revenues and spending related to social security funds, extra-budgetary institutions and provincial own revenue. See also consolidated government expenditure.
Medium-term Expenditure Committee
The technical committee responsible for evaluating the MTEF budget submissions of national departments and recommending allocations.
Medium-term expenditure framework (MTEF)
The three-year spending plans of national and provincial governments published at the time of the Budget.
Money supply The total stock of money in an economy.
National budget The projected revenue and expenditure that flow through the National Revenue Fund. It does not include spending by provinces or local government from their own revenues.
National Development Plan A national strategy to eliminate poverty and reduce inequality.
National Revenue Fund The consolidated account of national government into which all taxes, fees and charges collected by the South African Revenue Service and departmental revenue must be paid.
Nominal exchange rate The current rate of exchange between the rand and foreign currencies.
Non-interest expenditure Total expenditure by government less debt-service costs.
Organisation for Economic Cooperation and Development
An organisation of 33 mainly industrialised countries.
Presidential Infrastructure Coordinating Commission
A body overseeing selection, planning, monitoring and coordination of large infrastructure projects, composed of representatives selected from national, provincial and local government.
Primary sector The agricultural and mining sectors of the economy.
Private-sector credit extension Credit provided to the private sector by banks. This includes all loans, credit card balances and leases.
Productivity A measure of the amount of output generated from every unit of input over a period of time. Typically used to measure changes in labour efficiency.
Public entities Companies, agencies, funds and accounts that are fully or partly owned by government or public authorities and are regulated by law.
Public-private partnership (PPP)
A contractual arrangement in which a private party performs part of a government function and assumes the associated risks. In return, the private party receives a fee based on predefined performance criteria.
Public sector borrowing requirement
The consolidated cash borrowing requirement of general government and non-financial public enterprises.
Real effective exchange rate A measure of the rate of exchange of the rand relative to a trade-weighted average of South Africa’s trading partners’ currencies, adjusted for price trends.
Real expenditure Expenditure measured in constant prices, i.e. after taking account of inflation.

2012 MEDIUM TERM BUDGET POLICY STATEMENT
56
Real interest rate The level of interest after taking account of inflation.
Repurchase (repo) rate The rate at which the Reserve Bank lends to commercial banks.
Reserves (foreign exchange) Holdings of foreign exchange, either by the Reserve Bank only, or by the Reserve Bank and domestic banking institutions.
Rollover Funds not spent during a given financial year that “roll over” into the following year’s budget.
Seasonally adjusted and annualised The process of removing the seasonal volatility (monthly or quarterly) from a time series. This provides a measure of the underlying trend in the data. Annualised: to express a rate as if it were applied over one year.
Southern African Customs Union (SACU) Agreement
An agreement that allows for the unrestricted flow of goods and services, and a sharing of customs and excise revenue, between South Africa, Botswana, Namibia, Lesotho and Swaziland.
Southern African Development Community (SADC)
A regional governmental organisation that promotes collaboration, economic integration and technical cooperation throughout Southern Africa.
Sovereign debt Debt issued by a government.
Special economic zone A designated area where infrastructure and incentives are provided to clusters of businesses to encourage private investment and employment growth.
Terms of trade An index measuring the ratio of export prices to import prices.
Trade balance The monetary record of a country’s net imports and exports of physical merchandise. See also current account.
Unit labour costs The cost of labour per unit of output. Calculated by dividing average wages by productivity (output per worker per hour).