meeting ieee 519- 1992 harmonic limitsnw.automation.wesco.com/sites/default/files/tci meeting ieee...
TRANSCRIPT
Meeting IEEE 519-1992 Harmonic Limits
Using HarmonicGuard ®
Passive Filters
Written By:John F. HibbardMichael Z. Lowenstein
AbstractWith the advent of IEEE 519-92, the increasingdemand by utilities for power factor improvement, andthe proliferation of non-linear loads in industrial powerdistribution systems, specification of harmonicmitigation has become common. Questions ariseregarding the performance of passive harmonic trapfilters in removing harmonic distortion.
Data from a number of TCI HarmonicGuard® trap filterinstallations have been collected which illustrate howclosely IEEE 519-92 limits can be met.HarmonicGuard® filters have been installed, both forpower factor improvement and to meet harmonicdistortion limits based on IEEE 519-92.
A computer model has been developed to help predictthe harmonic reduction that can be expected forspecific load-filter combinations and the model hasbeen verified with field data. This paper outlines andexplains the computer model and details theapplication of harmonic trap filters. Computer-generated design curves are provided which can beused by a system designer to predict success inmeeting harmonic specifications usingHarmonicGuard® trap filters.
IEEE 519, 1981IEEE 519, “Recommended Practices andRequirements for Harmonic Control in Electric PowerSystems,” was published in 1981. The documentestablished levels of voltage distortion acceptable tothe distribution system. This document has beenwidely applied in establishing needed harmoniccorrection throughout the electrical power industry.However with the increase in industrial usage ofadjustable speed drives, rectifiers, and other non-linear
loads, it became apparent that a rewrite of IEEE 519,treating the relationship of harmonic voltages to theharmonic currents flowing within industrial plants, wasnecessary to support control of harmonic voltages.The new IEEE 519, published in 1992, sets forth limitsfor both harmonic voltages on the utility transmissionand distribution system and harmonic currents withinthe industrial distribution systems. Since harmonicvoltages are generated by the passage of harmoniccurrents through distribution system impedances, bycontrolling the currents or system impedances withinthe industrial facility, one can control harmonicvoltages on the utility distribution.
Unfortunately, there is some user confusion regardingthe application and intent of the information included inIEEE 519, 1992. Section 10, “RecommendedPractices for Individual Consumers” describes thecurrent distortion limits that apply within the industrialplant. Consulting engineers and applicationsengineers may not be clear as to the proper use ofTable 10.3, which outlines the limits of harmonicdistortion as a function of the nature of the electricaldistribution system.
This paper will explain, with examples, the proper useand interpretation of this table. Using a computermodel, we have outlined the level of distortion onemight expect to encounter for various types of loadsand distribution systems and the level of correctionobtainable through the use of line reactors and passiveharmonic trap filters has been detailed. It is hoped thatthe readers of this paper will come away with a betterunderstanding of the meaning and application of IEEE519, 1992.
Trans-Coil, Inc.7878 North 86th StreetMilwaukee, WI 53224
(414) 357-4480FAX (414) 357-4484
PQ Helpline (800) TCI-8282www.transcoil.com
2
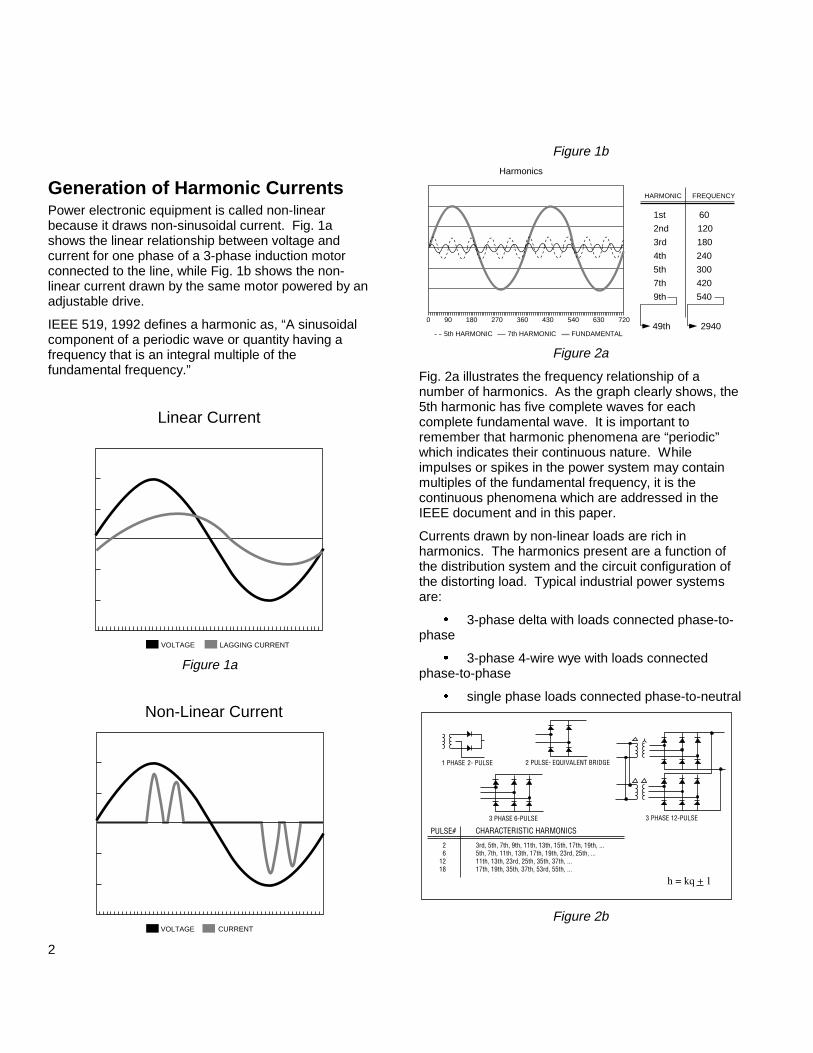
Generation of Harmonic CurrentsPower electronic equipment is called non-linearbecause it draws non-sinusoidal current. Fig. 1ashows the linear relationship between voltage andcurrent for one phase of a 3-phase induction motorconnected to the line, while Fig. 1b shows the non-linear current drawn by the same motor powered by anadjustable drive.
IEEE 519, 1992 defines a harmonic as, “A sinusoidalcomponent of a periodic wave or quantity having afrequency that is an integral multiple of thefundamental frequency.”
Linear Current
VOLTAGE LAGGING CURRENT
Figure 1a
Non-Linear Current
CURRENTVOLTAGE
Figure 1b
0 90 180 270 360 430 540 630 720
5th HARMONIC FUNDAMENTAL7th HARMONIC
Harmonics
HARMONIC FREQUENCY
1st 60
2nd 120
3rd 180
4th 240
5th 300
7th 420
9th 540
49th 2940
Figure 2a
Fig. 2a illustrates the frequency relationship of anumber of harmonics. As the graph clearly shows, the5th harmonic has five complete waves for eachcomplete fundamental wave. It is important toremember that harmonic phenomena are “periodic”which indicates their continuous nature. Whileimpulses or spikes in the power system may containmultiples of the fundamental frequency, it is thecontinuous phenomena which are addressed in theIEEE document and in this paper.
Currents drawn by non-linear loads are rich inharmonics. The harmonics present are a function ofthe distribution system and the circuit configuration ofthe distorting load. Typical industrial power systemsare:
� 3-phase delta with loads connected phase-to-phase
� 3-phase 4-wire wye with loads connectedphase-to-phase
� single phase loads connected phase-to-neutral
Figure 2b
3
Fig. 2b illustrates the most commonly utilized rectifiercircuits. The harmonic frequencies produced by eachof the circuits are characteristic of the number ofrectifiers (or pulse number) in the circuit, and arecalled “Characteristic Harmonics.” They can bedetermined using the equation, h = kq±1, where hequals the harmonic number, k equals an integer, andq equals the pulse number. The table in Fig 2bcontains characteristic harmonics of various rectifiercircuits. Lower harmonics are eliminated when morerectifiers are used, but increasing complexity and costof the circuit often offset the advantages of reducedharmonics. Note that for illustration purposes, diodeshave been used in the circuits. The same circuitscould contain SCR's instead of diodes with no changein the characteristic harmonics. Also observe that onlyodd harmonics are produced. Half-wave converters,which result in the production of even harmonics, arenot approved for new installations, and it isrecommended that they be phased out of oldersystems as quickly as possible.
While the characteristic harmonics are a function ofthe number of rectifiers in the circuit, the relativemagnitudes of each harmonic depend on theparameters of the load(s) and the distribution system.As one might expect the number of possibleload/distribution configurations is almost limitless. Byconcentrating on 3-phase loads connected to a typical3-phase distribution system, we will be analyzing thosesystems that dominate the industry and are the highestconsumers of power. The principles discussed areapplicable to any load or system.
IEEE 519, 1992
Current Distortion Limits
Figure 3
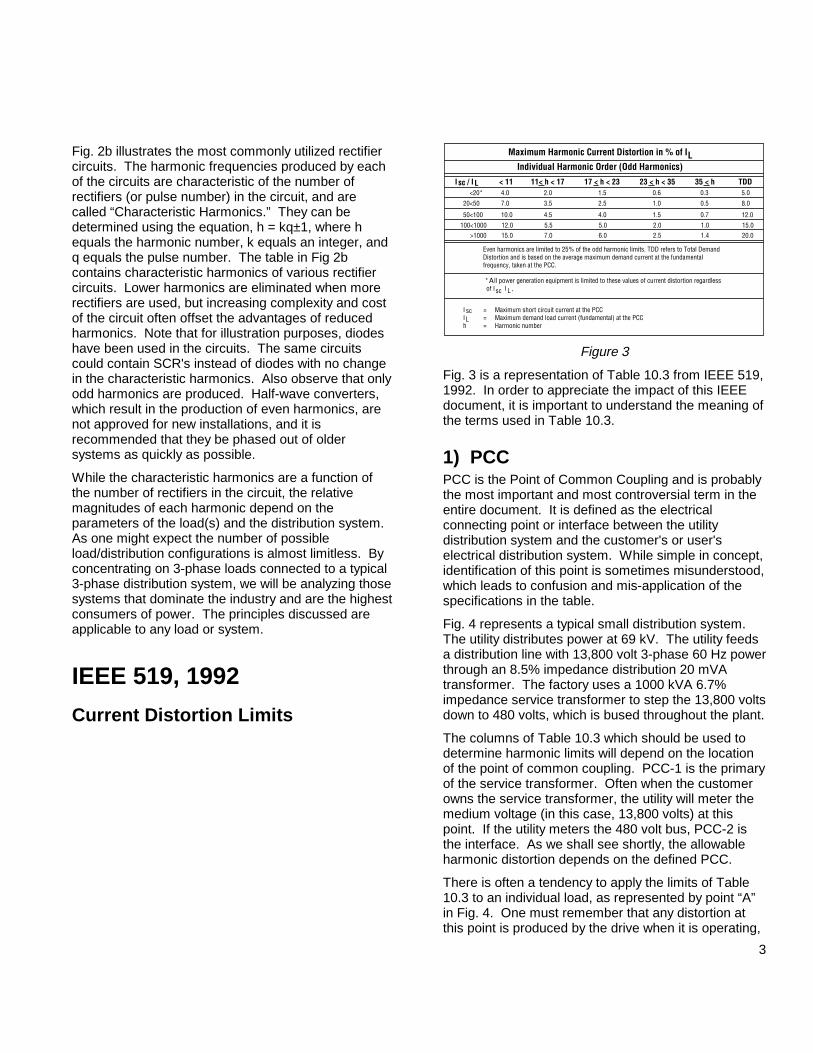
Fig. 3 is a representation of Table 10.3 from IEEE 519,1992. In order to appreciate the impact of this IEEEdocument, it is important to understand the meaning ofthe terms used in Table 10.3.
1) PCCPCC is the Point of Common Coupling and is probablythe most important and most controversial term in theentire document. It is defined as the electricalconnecting point or interface between the utilitydistribution system and the customer's or user'selectrical distribution system. While simple in concept,identification of this point is sometimes misunderstood,which leads to confusion and mis-application of thespecifications in the table.
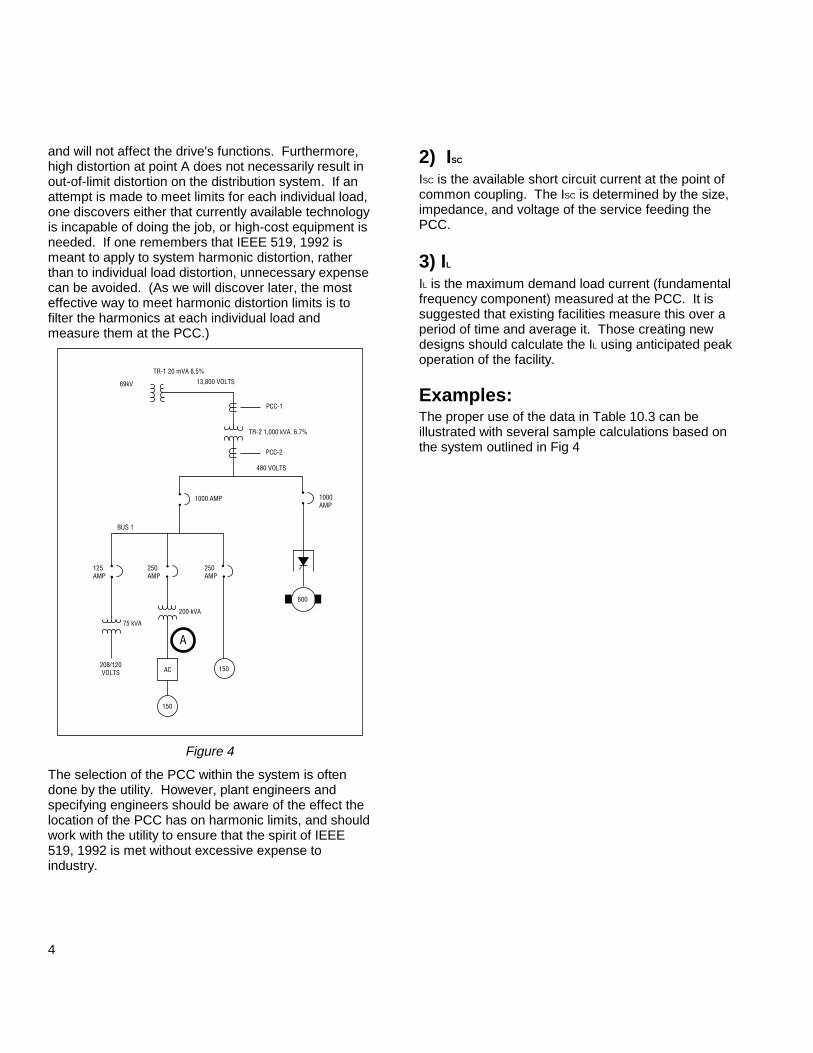
Fig. 4 represents a typical small distribution system.The utility distributes power at 69 kV. The utility feedsa distribution line with 13,800 volt 3-phase 60 Hz powerthrough an 8.5% impedance distribution 20 mVAtransformer. The factory uses a 1000 kVA 6.7%impedance service transformer to step the 13,800 voltsdown to 480 volts, which is bused throughout the plant.
The columns of Table 10.3 which should be used todetermine harmonic limits will depend on the locationof the point of common coupling. PCC-1 is the primaryof the service transformer. Often when the customerowns the service transformer, the utility will meter themedium voltage (in this case, 13,800 volts) at thispoint. If the utility meters the 480 volt bus, PCC-2 isthe interface. As we shall see shortly, the allowableharmonic distortion depends on the defined PCC.
There is often a tendency to apply the limits of Table10.3 to an individual load, as represented by point “A”in Fig. 4. One must remember that any distortion atthis point is produced by the drive when it is operating,
4
and will not affect the drive's functions. Furthermore,high distortion at point A does not necessarily result inout-of-limit distortion on the distribution system. If anattempt is made to meet limits for each individual load,one discovers either that currently available technologyis incapable of doing the job, or high-cost equipment isneeded. If one remembers that IEEE 519, 1992 ismeant to apply to system harmonic distortion, ratherthan to individual load distortion, unnecessary expensecan be avoided. (As we will discover later, the mosteffective way to meet harmonic distortion limits is tofilter the harmonics at each individual load andmeasure them at the PCC.)
Figure 4
The selection of the PCC within the system is oftendone by the utility. However, plant engineers andspecifying engineers should be aware of the effect thelocation of the PCC has on harmonic limits, and shouldwork with the utility to ensure that the spirit of IEEE519, 1992 is met without excessive expense toindustry.
2) ISC
ISC is the available short circuit current at the point ofcommon coupling. The ISC is determined by the size,impedance, and voltage of the service feeding thePCC.
3) IL
IL is the maximum demand load current (fundamentalfrequency component) measured at the PCC. It issuggested that existing facilities measure this over aperiod of time and average it. Those creating newdesigns should calculate the IL using anticipated peakoperation of the facility.
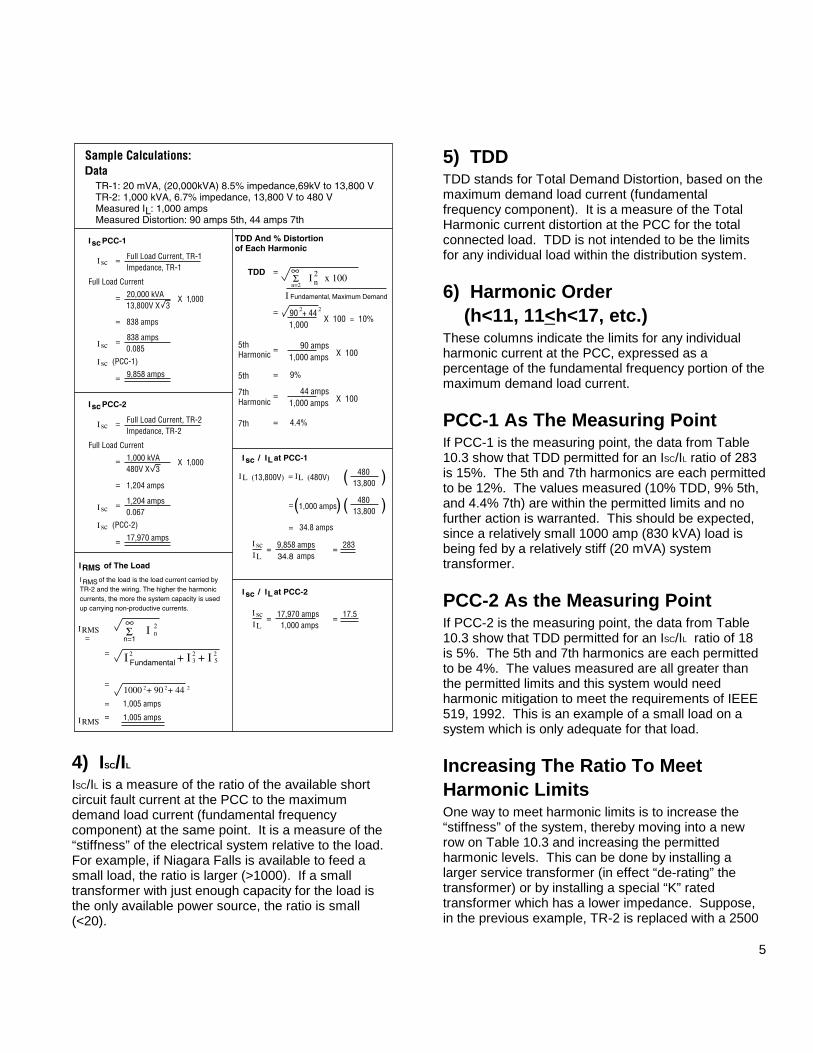
Examples:The proper use of the data in Table 10.3 can beillustrated with several sample calculations based onthe system outlined in Fig 4
5
4) ISC/IL
ISC/IL is a measure of the ratio of the available shortcircuit fault current at the PCC to the maximumdemand load current (fundamental frequencycomponent) at the same point. It is a measure of the“stiffness” of the electrical system relative to the load.For example, if Niagara Falls is available to feed asmall load, the ratio is larger (>1000). If a smalltransformer with just enough capacity for the load isthe only available power source, the ratio is small(<20).
5) TDDTDD stands for Total Demand Distortion, based on themaximum demand load current (fundamentalfrequency component). It is a measure of the TotalHarmonic current distortion at the PCC for the totalconnected load. TDD is not intended to be the limitsfor any individual load within the distribution system.
6) Harmonic Order (h<11, 11<h<17, etc.)These columns indicate the limits for any individualharmonic current at the PCC, expressed as apercentage of the fundamental frequency portion of themaximum demand load current.
PCC-1 As The Measuring PointIf PCC-1 is the measuring point, the data from Table10.3 show that TDD permitted for an ISC/IL ratio of 283is 15%. The 5th and 7th harmonics are each permittedto be 12%. The values measured (10% TDD, 9% 5th,and 4.4% 7th) are within the permitted limits and nofurther action is warranted. This should be expected,since a relatively small 1000 amp (830 kVA) load isbeing fed by a relatively stiff (20 mVA) systemtransformer.
PCC-2 As the Measuring PointIf PCC-2 is the measuring point, the data from Table10.3 show that TDD permitted for an ISC/IL ratio of 18is 5%. The 5th and 7th harmonics are each permittedto be 4%. The values measured are all greater thanthe permitted limits and this system would needharmonic mitigation to meet the requirements of IEEE519, 1992. This is an example of a small load on asystem which is only adequate for that load.
Increasing The Ratio To MeetHarmonic LimitsOne way to meet harmonic limits is to increase the“stiffness” of the system, thereby moving into a newrow on Table 10.3 and increasing the permittedharmonic levels. This can be done by installing alarger service transformer (in effect “de-rating” thetransformer) or by installing a special “K” ratedtransformer which has a lower impedance. Suppose,in the previous example, TR-2 is replaced with a 2500
6
kVA “K” rated transformer of 3.7% impedance. ISC/IL isnow 81.
With the new transformer, and PCC-2 as themeasuring point, the data from Table 10.3 show thatTDD permitted for an ISC/IL ratio of 81 is 12%. The 5thand 7th harmonics are each permitted to be 10%. Thevalues measured are all within the permitted limit andno further action is warranted.
Replacing the transformer, however, is not usually aneconomically viable solution to this type of problem.Replacement is expensive, and the transformer is nowoversized for the load. The larger transformer has ahigh magnetizing current and, because it is lightlyloaded, a lower (worse) power factor exists. Additionalvaluable real estate either inside or outside the facilityis used. More practical solutions include the use ofline reactors and passive harmonic filters.
Distortion Level PredictionsPredicting distortion levels in practical application is farmore complicated than it appears at first glance.Although it is convenient to think of non-linear loads asharmonic “current generators,” in reality the inductiveimpedance is what affects the levels of harmoniccurrents drawn by these loads. Therefore, we cannottreat loads as ideal generators. It is only partiallycorrect to assume a “typical” harmonic currentspectrum for a particular load and then attempt todetermine the resulting distortion levels.
One can model a wide range of distributionsystem/linear loads/non-linear loads using PSPICE, anelectronic circuit simulator software package availablefrom MicroSim Corporation of Irvine, California.PSPICE is based on the SPICE2 circuit simulationprogram developed at Berkeley in early 1970's. Thisprogram has become the de facto standard for analogcircuit simulation.
Available components such as voltage sources,capacitors, inductors, resistors, diodes, SCR's, etc.,may be used to construct circuits. Real world parasiticcharacteristics can be included. PSPICE simulates thebehavior of the circuit over a user-defined window oftime, and an output file is created which allows theprogrammer to probe circuit voltages and currents andto perform a Fourier analysis of any voltage or current.
As stated earlier, the investigation of harmonicdistortion undertaken in this paper is limited to 3-phaseloads operating on a 3-phase distribution system.
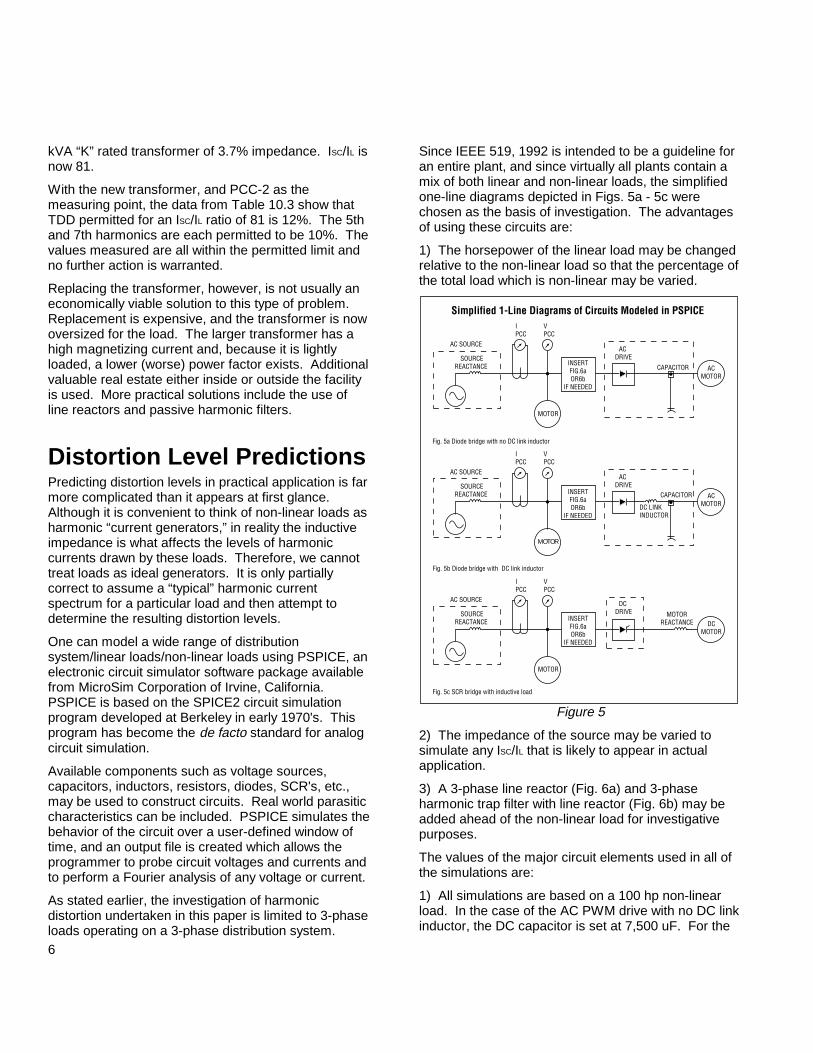
Since IEEE 519, 1992 is intended to be a guideline foran entire plant, and since virtually all plants contain amix of both linear and non-linear loads, the simplifiedone-line diagrams depicted in Figs. 5a - 5c werechosen as the basis of investigation. The advantagesof using these circuits are:
1) The horsepower of the linear load may be changedrelative to the non-linear load so that the percentage ofthe total load which is non-linear may be varied.
MOTOR
Figure 5
2) The impedance of the source may be varied tosimulate any ISC/IL that is likely to appear in actualapplication.
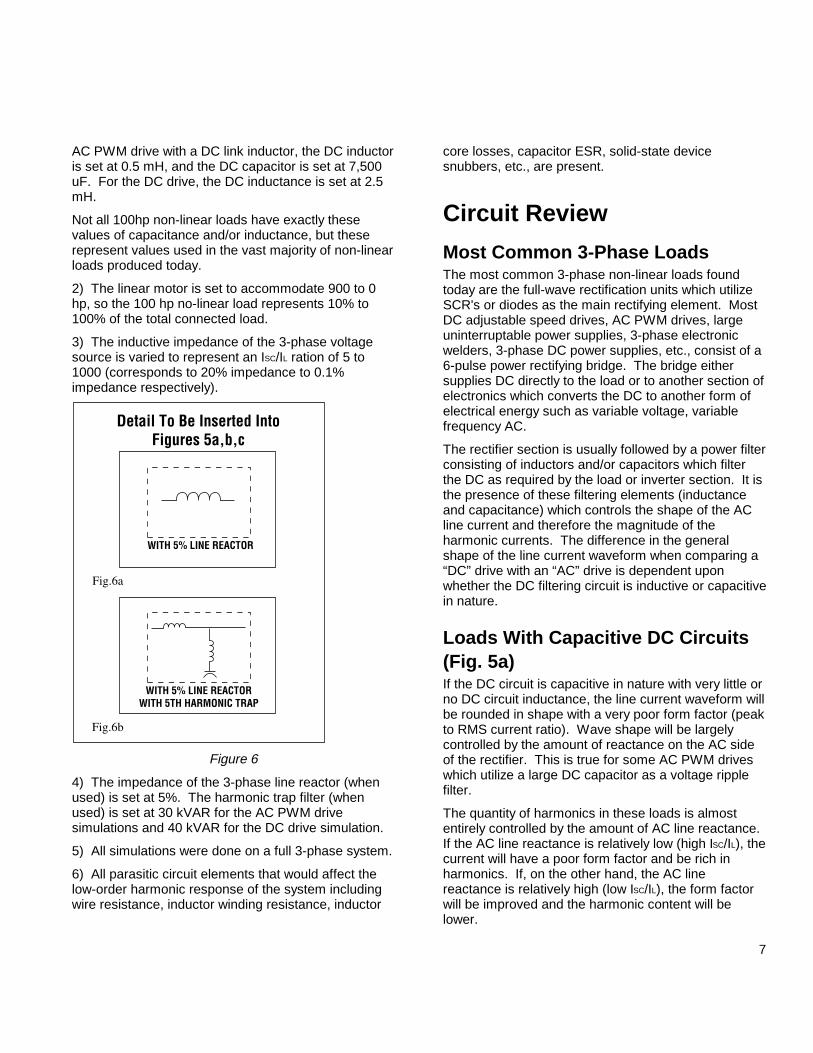
3) A 3-phase line reactor (Fig. 6a) and 3-phaseharmonic trap filter with line reactor (Fig. 6b) may beadded ahead of the non-linear load for investigativepurposes.
The values of the major circuit elements used in all ofthe simulations are:
1) All simulations are based on a 100 hp non-linearload. In the case of the AC PWM drive with no DC linkinductor, the DC capacitor is set at 7,500 uF. For the
7
AC PWM drive with a DC link inductor, the DC inductoris set at 0.5 mH, and the DC capacitor is set at 7,500uF. For the DC drive, the DC inductance is set at 2.5mH.
Not all 100hp non-linear loads have exactly thesevalues of capacitance and/or inductance, but theserepresent values used in the vast majority of non-linearloads produced today.
2) The linear motor is set to accommodate 900 to 0hp, so the 100 hp no-linear load represents 10% to100% of the total connected load.
3) The inductive impedance of the 3-phase voltagesource is varied to represent an ISC/IL ration of 5 to1000 (corresponds to 20% impedance to 0.1%impedance respectively).
Figure 6
4) The impedance of the 3-phase line reactor (whenused) is set at 5%. The harmonic trap filter (whenused) is set at 30 kVAR for the AC PWM drivesimulations and 40 kVAR for the DC drive simulation.
5) All simulations were done on a full 3-phase system.
6) All parasitic circuit elements that would affect thelow-order harmonic response of the system includingwire resistance, inductor winding resistance, inductor
core losses, capacitor ESR, solid-state devicesnubbers, etc., are present.
Circuit Review
Most Common 3-Phase LoadsThe most common 3-phase non-linear loads foundtoday are the full-wave rectification units which utilizeSCR's or diodes as the main rectifying element. MostDC adjustable speed drives, AC PWM drives, largeuninterruptable power supplies, 3-phase electronicwelders, 3-phase DC power supplies, etc., consist of a6-pulse power rectifying bridge. The bridge eithersupplies DC directly to the load or to another section ofelectronics which converts the DC to another form ofelectrical energy such as variable voltage, variablefrequency AC.
The rectifier section is usually followed by a power filterconsisting of inductors and/or capacitors which filterthe DC as required by the load or inverter section. It isthe presence of these filtering elements (inductanceand capacitance) which controls the shape of the ACline current and therefore the magnitude of theharmonic currents. The difference in the generalshape of the line current waveform when comparing a“DC” drive with an “AC” drive is dependent uponwhether the DC filtering circuit is inductive or capacitivein nature.
Loads With Capacitive DC Circuits(Fig. 5a)If the DC circuit is capacitive in nature with very little orno DC circuit inductance, the line current waveform willbe rounded in shape with a very poor form factor (peakto RMS current ratio). Wave shape will be largelycontrolled by the amount of reactance on the AC sideof the rectifier. This is true for some AC PWM driveswhich utilize a large DC capacitor as a voltage ripplefilter.
The quantity of harmonics in these loads is almostentirely controlled by the amount of AC line reactance.If the AC line reactance is relatively low (high ISC/IL), thecurrent will have a poor form factor and be rich inharmonics. If, on the other hand, the AC linereactance is relatively high (low ISC/IL), the form factorwill be improved and the harmonic content will belower.
8
Loads With Inductive/Capacitive DCCircuits (Fig. 5b)If the DC circuit contains both inductance andcapacitance, the nature of the line current waveformwill be similar to that of loads with inductive DC circuits.Most AC PWM drives fall into this category as theycontain a large DC inductor in addition to the DCcapacitor. The addition of the inductor is generallyintended to reduce the amount of ripple current in thecapacitor, so the DC presented to the inverter isimproved.
Loads With Inductive DC Circuits(Fig. 5c)If the DC filter is inductive in nature with very little or nocapacitance, the line current waveform will begenerally square in shape with fast rising edges and arelatively flat top (assuming the converter is operatingin “continuous” conduction). This is true because theDC inductance opposes a change in the magnitude ofcurrent flowing through it causing a relatively quickcommutation of current from one AC line to the otherand a somewhat constant level of current during theconduction period. This is generally the case for DCdrives supplying a motor armature and for currentsource inverter AC drives.
The line currents found in these loads can haveharmonic contents that closely approach thetheoretical square-wave values of 20% 5th, 14% 7th,9% 11th, 8% 13th, etc. The amount of AC sidereactance found in distribution systems is smallcompared to the DC side inductance. The addition ofline reactors or transformers will have only limitedeffect on the line current distortion. Inductance in theAC lines does affect how rapidly current commutatesfrom one AC line to the next and controls the voltagewaveform “line notching.” As the total AC inductanceincreases, the width of the line notches increases.
Modeling Results
Current Distortion vs. I SC/IL
A normal plant distribution system will contain bothlinear and non-linear loads. In the followingillustrations, the curves labelled 100% non-linear, 80%,60%, etc. indicate the portion of the total connectedload that is non-linear. For example, assume that a
plant has two 150 hp adjustable speed DC drives plusseven 100 hp motors that run “across-the-line.” Sincethe total connected load is 1000 hp, 300 hp of which isnon-linear in nature, the curve labeled 30% wouldapply.
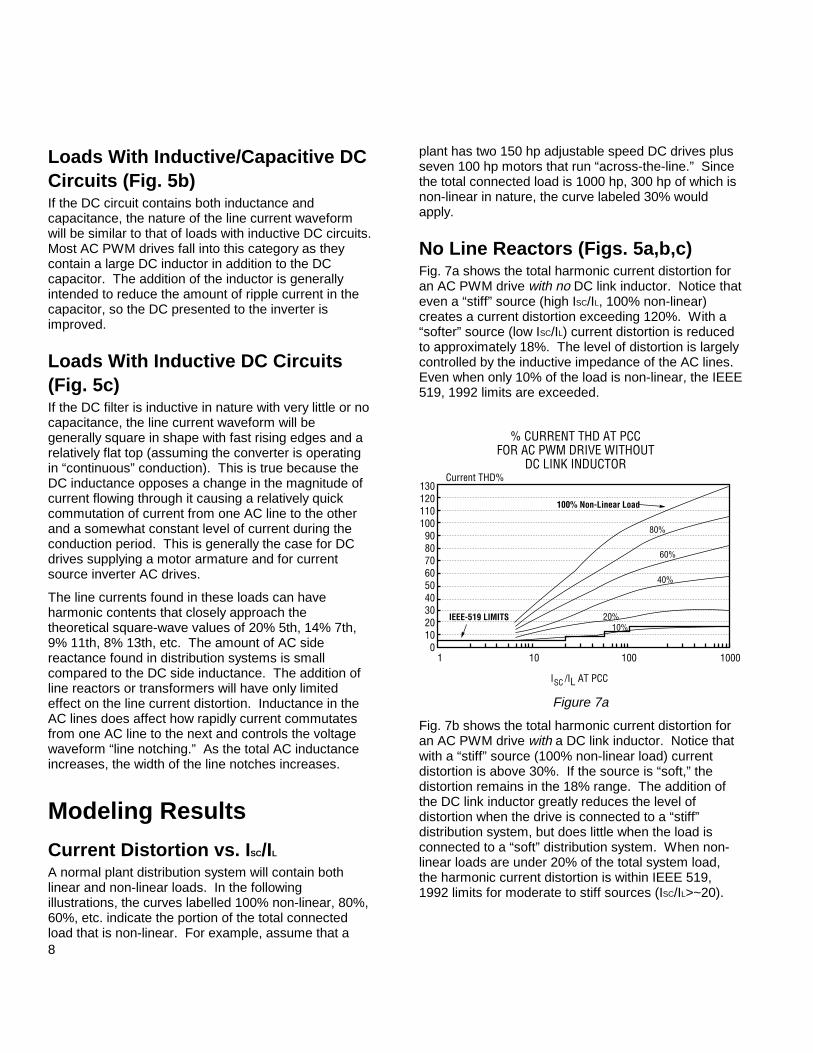
No Line Reactors (Figs. 5a,b,c)Fig. 7a shows the total harmonic current distortion foran AC PWM drive with no DC link inductor. Notice thateven a “stiff” source (high ISC/IL, 100% non-linear)creates a current distortion exceeding 120%. With a“softer” source (low ISC/IL) current distortion is reducedto approximately 18%. The level of distortion is largelycontrolled by the inductive impedance of the AC lines.Even when only 10% of the load is non-linear, the IEEE519, 1992 limits are exceeded.
Figure 7a
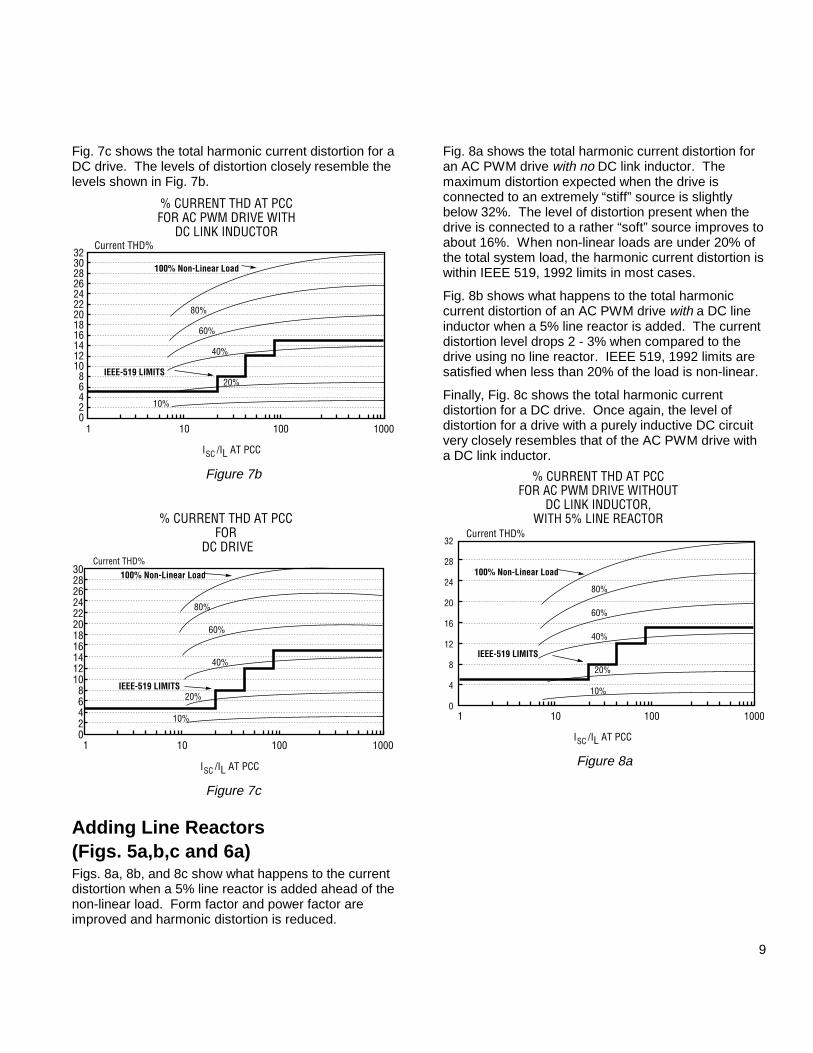
Fig. 7b shows the total harmonic current distortion foran AC PWM drive with a DC link inductor. Notice thatwith a “stiff” source (100% non-linear load) currentdistortion is above 30%. If the source is “soft,” thedistortion remains in the 18% range. The addition ofthe DC link inductor greatly reduces the level ofdistortion when the drive is connected to a “stiff”distribution system, but does little when the load isconnected to a “soft” distribution system. When non-linear loads are under 20% of the total system load,the harmonic current distortion is within IEEE 519,1992 limits for moderate to stiff sources (ISC/IL>~20).
9
Fig. 7c shows the total harmonic current distortion for aDC drive. The levels of distortion closely resemble thelevels shown in Fig. 7b.
Figure 7b
Figure 7c
Adding Line Reactors(Figs. 5a,b,c and 6a)Figs. 8a, 8b, and 8c show what happens to the currentdistortion when a 5% line reactor is added ahead of thenon-linear load. Form factor and power factor areimproved and harmonic distortion is reduced.
Fig. 8a shows the total harmonic current distortion foran AC PWM drive with no DC link inductor. Themaximum distortion expected when the drive isconnected to an extremely “stiff” source is slightlybelow 32%. The level of distortion present when thedrive is connected to a rather “soft” source improves toabout 16%. When non-linear loads are under 20% ofthe total system load, the harmonic current distortion iswithin IEEE 519, 1992 limits in most cases.
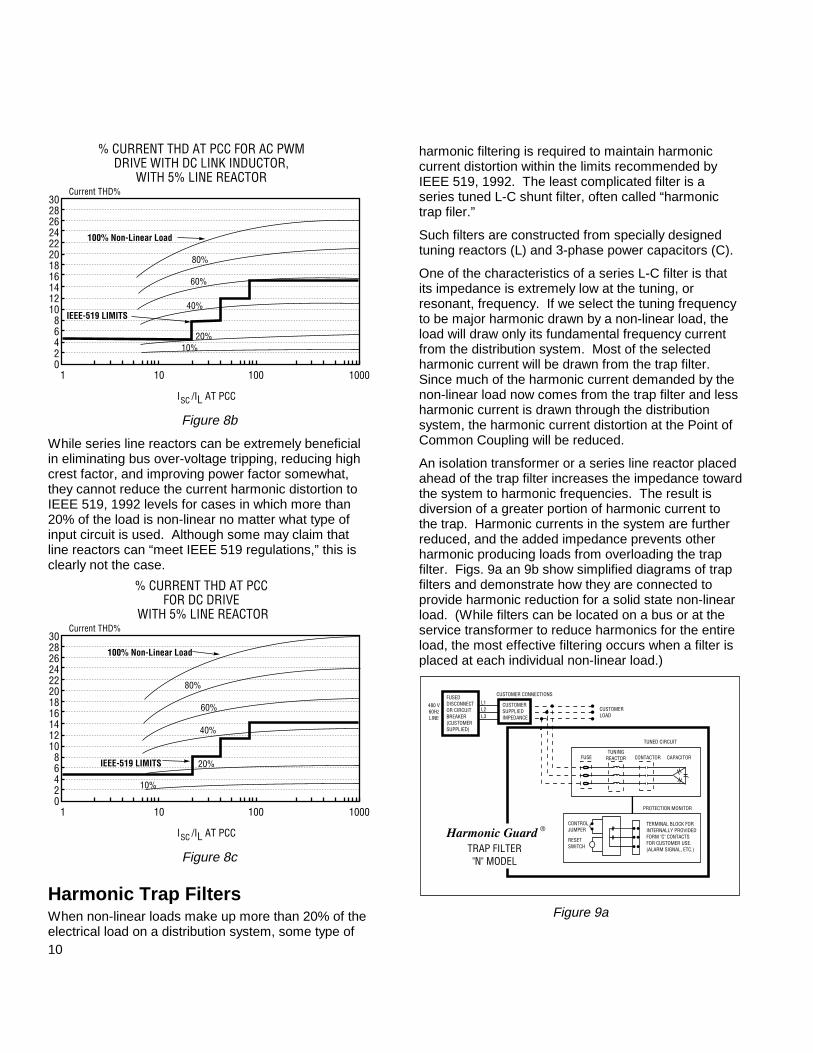
Fig. 8b shows what happens to the total harmoniccurrent distortion of an AC PWM drive with a DC lineinductor when a 5% line reactor is added. The currentdistortion level drops 2 - 3% when compared to thedrive using no line reactor. IEEE 519, 1992 limits aresatisfied when less than 20% of the load is non-linear.
Finally, Fig. 8c shows the total harmonic currentdistortion for a DC drive. Once again, the level ofdistortion for a drive with a purely inductive DC circuitvery closely resembles that of the AC PWM drive witha DC link inductor.
Figure 8a
10
Figure 8b
While series line reactors can be extremely beneficialin eliminating bus over-voltage tripping, reducing highcrest factor, and improving power factor somewhat,they cannot reduce the current harmonic distortion toIEEE 519, 1992 levels for cases in which more than20% of the load is non-linear no matter what type ofinput circuit is used. Although some may claim thatline reactors can “meet IEEE 519 regulations,” this isclearly not the case.
Figure 8c
Harmonic Trap FiltersWhen non-linear loads make up more than 20% of theelectrical load on a distribution system, some type of
harmonic filtering is required to maintain harmoniccurrent distortion within the limits recommended byIEEE 519, 1992. The least complicated filter is aseries tuned L-C shunt filter, often called “harmonictrap filer.”
Such filters are constructed from specially designedtuning reactors (L) and 3-phase power capacitors (C).
One of the characteristics of a series L-C filter is thatits impedance is extremely low at the tuning, orresonant, frequency. If we select the tuning frequencyto be major harmonic drawn by a non-linear load, theload will draw only its fundamental frequency currentfrom the distribution system. Most of the selectedharmonic current will be drawn from the trap filter.Since much of the harmonic current demanded by thenon-linear load now comes from the trap filter and lessharmonic current is drawn through the distributionsystem, the harmonic current distortion at the Point ofCommon Coupling will be reduced.
An isolation transformer or a series line reactor placedahead of the trap filter increases the impedance towardthe system to harmonic frequencies. The result isdiversion of a greater portion of harmonic current tothe trap. Harmonic currents in the system are furtherreduced, and the added impedance prevents otherharmonic producing loads from overloading the trapfilter. Figs. 9a an 9b show simplified diagrams of trapfilters and demonstrate how they are connected toprovide harmonic reduction for a solid state non-linearload. (While filters can be located on a bus or at theservice transformer to reduce harmonics for the entireload, the most effective filtering occurs when a filter isplaced at each individual non-linear load.)
Figure 9a

11
Figure 9b
TuningThe trap filter is always tuned just below the lowestharmonic present in the electrical system. In a typical3-phase 6-pulse rectifier, the 5th harmonic (300 Hz) isthe lowest harmonic, so the trap filter is tuned to 282Hz. The largest component of distortion (the 5th) willbe diverted into the trap filter. Because the filters arebroad band, a 5th harmonic tuned filter will absorbsignificant amounts of 7th harmonic current as well.The series impedance will significantly attenuate thehigher harmonic frequencies. Thus a single 5thharmonic tuned trap filter can reduce the harmoniccurrents at the PCC to within IEEE 519, 1992specifications in almost all cases. If further filtering isrequired, a multiple frequency trap filter (5th, 7th, 11th,13th) can also be installed. Filters can be constructed,using the same principles, for other fundamentalfrequencies (50 Hz, 400 Hz) and for any voltage.
Adding Harmonic Trap Filters(Figs. 5a,b,c and 6b)Fig. 10a shows the total harmonic current distortion fornon-linear loads with no DC link inductor when a 5%line reactor and a single harmonic trap filter tuned to282 Hz are added. If 100% of the loading in the plantis made up of this type of load, it is unlikely that thetotal harmonic current distortion will be below the IEEE519, 1992 limits. If, on the other hand, the portion ofthe load that is non-linear in nature is 40% or less, thelimits can be met for most source impedances. If thenon-linear load is between 40% and 100%, the limitsmay or may not be met depending on the (ISC/IL) ratio.Multiple filters may be needed.
Figure 10a
Figure 10b
Fig. 10b shows the total harmonic current distortion fornon-linear loads with a DC link inductor when a 5% linereactor and a single harmonic trap filter tuned to 282Hz are added. Even when 100% of the load in theplant is non-linear, it is likely that the total harmoniccurrent distortion will be below the IEEE 519, 1992limits.
The distortion of current exceeds the limits in only afew small ranges of source impedance (ISC/IL). Aslightly larger service transformer or a small reduction
12
in non-linear loads is all that is needed to meet thelimits.
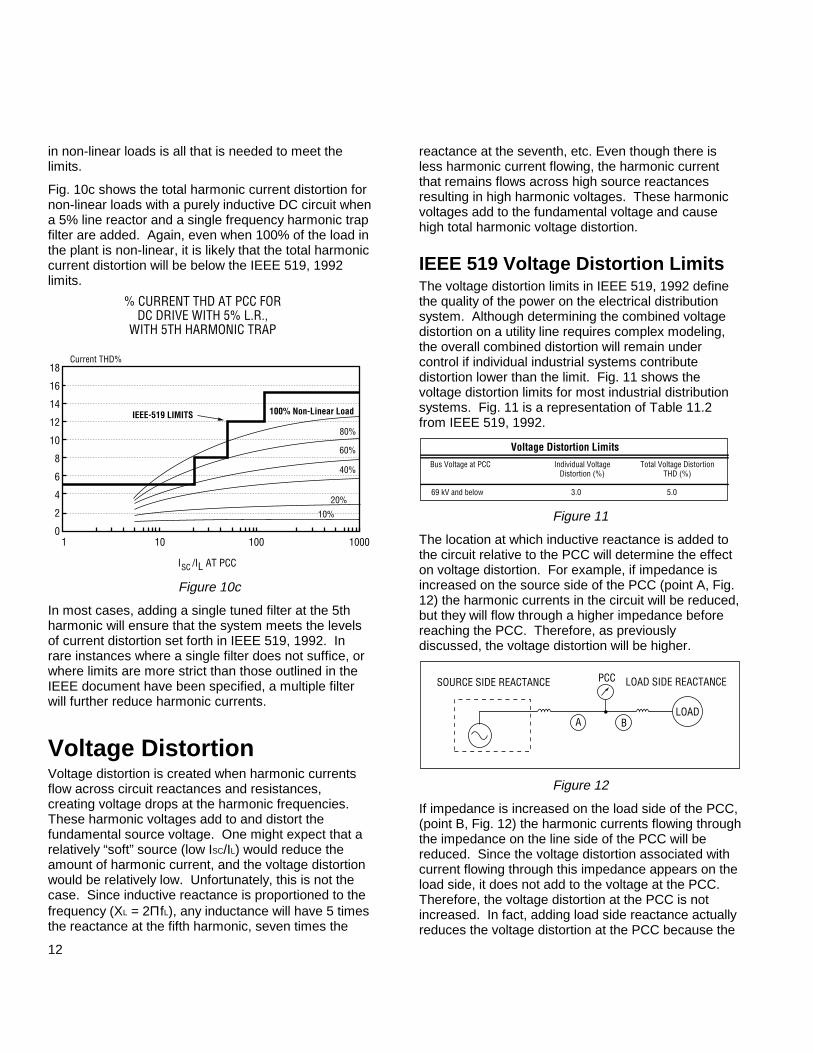
Fig. 10c shows the total harmonic current distortion fornon-linear loads with a purely inductive DC circuit whena 5% line reactor and a single frequency harmonic trapfilter are added. Again, even when 100% of the load inthe plant is non-linear, it is likely that the total harmoniccurrent distortion will be below the IEEE 519, 1992limits.
Figure 10c
In most cases, adding a single tuned filter at the 5thharmonic will ensure that the system meets the levelsof current distortion set forth in IEEE 519, 1992. Inrare instances where a single filter does not suffice, orwhere limits are more strict than those outlined in theIEEE document have been specified, a multiple filterwill further reduce harmonic currents.
Voltage DistortionVoltage distortion is created when harmonic currentsflow across circuit reactances and resistances,creating voltage drops at the harmonic frequencies.These harmonic voltages add to and distort thefundamental source voltage. One might expect that arelatively “soft” source (low ISC/IL) would reduce theamount of harmonic current, and the voltage distortionwould be relatively low. Unfortunately, this is not thecase. Since inductive reactance is proportioned to thefrequency (XL = 2ΠfL), any inductance will have 5 timesthe reactance at the fifth harmonic, seven times the
reactance at the seventh, etc. Even though there isless harmonic current flowing, the harmonic currentthat remains flows across high source reactancesresulting in high harmonic voltages. These harmonicvoltages add to the fundamental voltage and causehigh total harmonic voltage distortion.
IEEE 519 Voltage Distortion LimitsThe voltage distortion limits in IEEE 519, 1992 definethe quality of the power on the electrical distributionsystem. Although determining the combined voltagedistortion on a utility line requires complex modeling,the overall combined distortion will remain undercontrol if individual industrial systems contributedistortion lower than the limit. Fig. 11 shows thevoltage distortion limits for most industrial distributionsystems. Fig. 11 is a representation of Table 11.2from IEEE 519, 1992.
Figure 11
The location at which inductive reactance is added tothe circuit relative to the PCC will determine the effecton voltage distortion. For example, if impedance isincreased on the source side of the PCC (point A, Fig.12) the harmonic currents in the circuit will be reduced,but they will flow through a higher impedance beforereaching the PCC. Therefore, as previouslydiscussed, the voltage distortion will be higher.
Figure 12
If impedance is increased on the load side of the PCC,(point B, Fig. 12) the harmonic currents flowing throughthe impedance on the line side of the PCC will bereduced. Since the voltage distortion associated withcurrent flowing through this impedance appears on theload side, it does not add to the voltage at the PCC.Therefore, the voltage distortion at the PCC is notincreased. In fact, adding load side reactance actuallyreduces the voltage distortion at the PCC because the
13
harmonic currents flowing across the constant sourceimpedance have decreased.
One might be tempted to add large amounts of linereactance in front of non-linear loads in an effort toreduce the voltage distortion at the PCC.Unfortunately, this will result in an excessively highfundamental voltage drop across the reactor at full loadcurrent. This will starve the load of voltage anddegrade the no load to full load voltage regulations ofthe system. Thus, there is a limit to how much voltagedistortion can be decreased by adding line reactance.
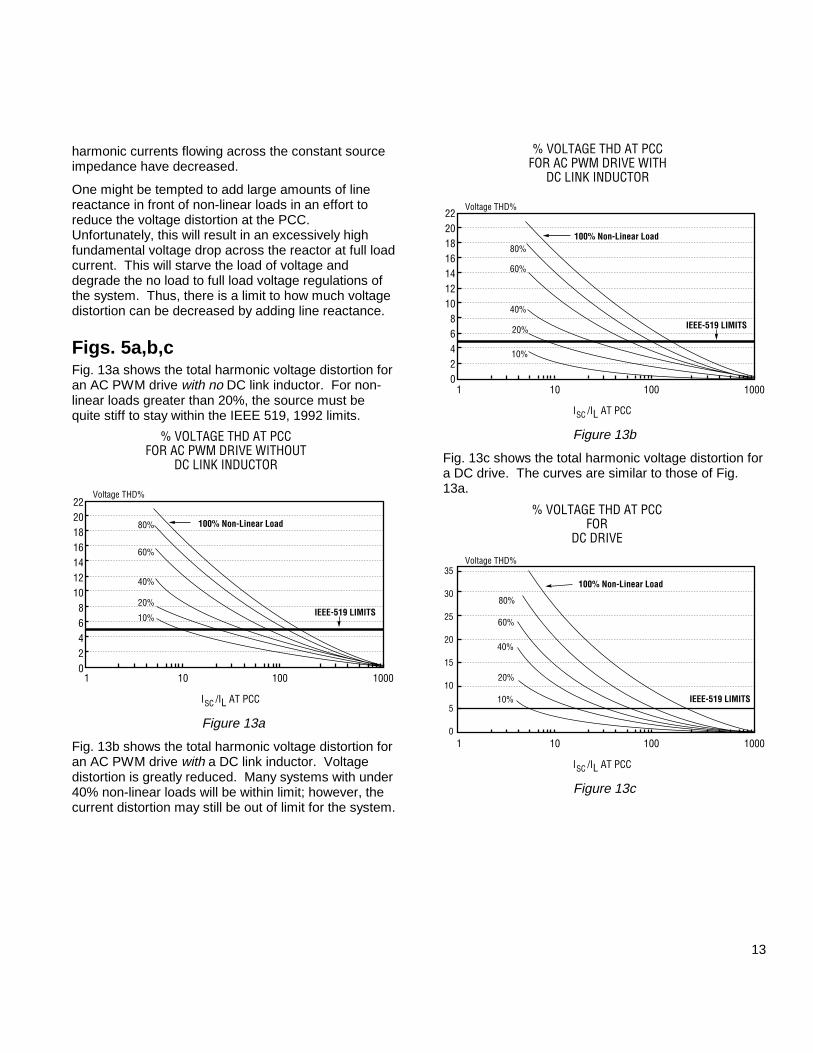
Figs. 5a,b,cFig. 13a shows the total harmonic voltage distortion foran AC PWM drive with no DC link inductor. For non-linear loads greater than 20%, the source must bequite stiff to stay within the IEEE 519, 1992 limits.
Figure 13a
Fig. 13b shows the total harmonic voltage distortion foran AC PWM drive with a DC link inductor. Voltagedistortion is greatly reduced. Many systems with under40% non-linear loads will be within limit; however, thecurrent distortion may still be out of limit for the system.
Figure 13b
Fig. 13c shows the total harmonic voltage distortion fora DC drive. The curves are similar to those of Fig.13a.
Figure 13c
14
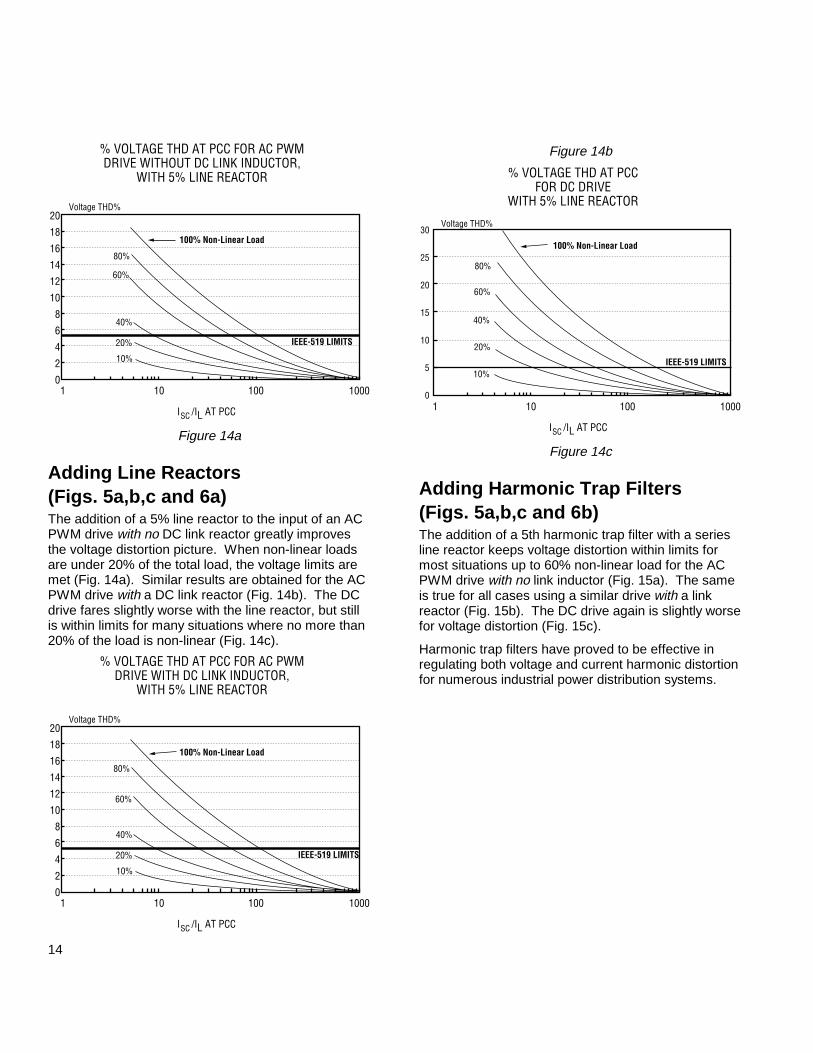
Figure 14a
Adding Line Reactors(Figs. 5a,b,c and 6a)The addition of a 5% line reactor to the input of an ACPWM drive with no DC link reactor greatly improvesthe voltage distortion picture. When non-linear loadsare under 20% of the total load, the voltage limits aremet (Fig. 14a). Similar results are obtained for the ACPWM drive with a DC link reactor (Fig. 14b). The DCdrive fares slightly worse with the line reactor, but stillis within limits for many situations where no more than20% of the load is non-linear (Fig. 14c).
Figure 14b
Figure 14c
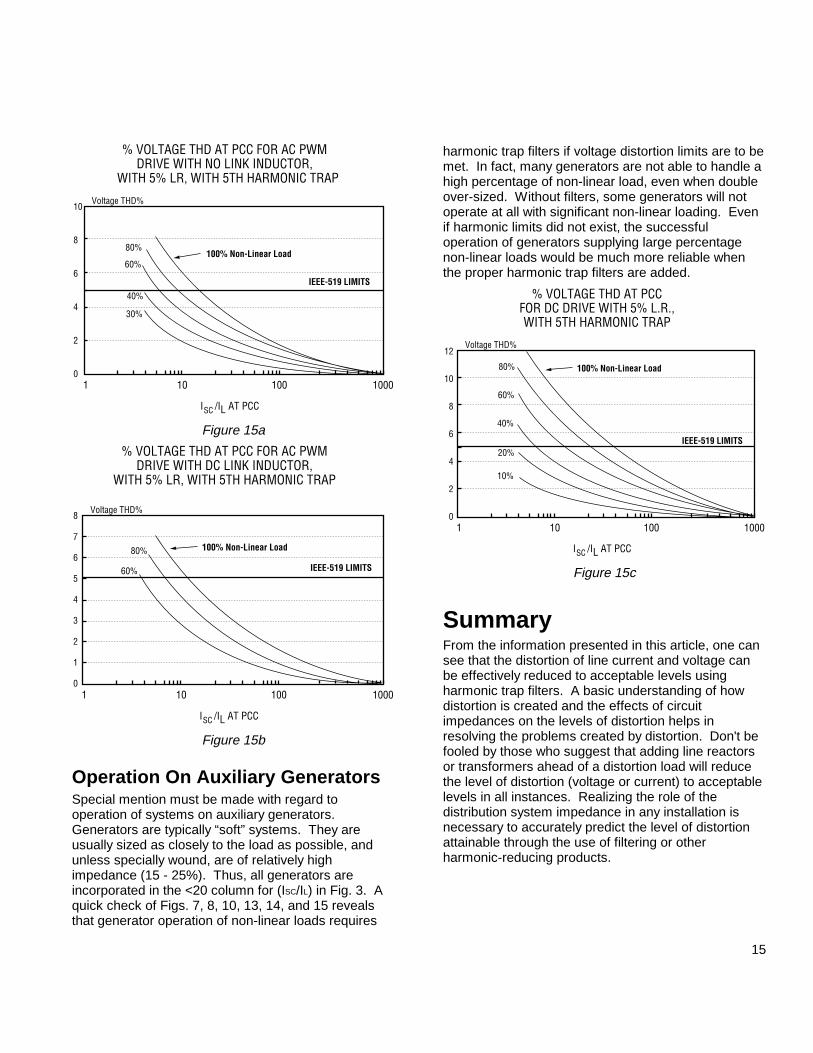
Adding Harmonic Trap Filters(Figs. 5a,b,c and 6b)The addition of a 5th harmonic trap filter with a seriesline reactor keeps voltage distortion within limits formost situations up to 60% non-linear load for the ACPWM drive with no link inductor (Fig. 15a). The sameis true for all cases using a similar drive with a linkreactor (Fig. 15b). The DC drive again is slightly worsefor voltage distortion (Fig. 15c).
Harmonic trap filters have proved to be effective inregulating both voltage and current harmonic distortionfor numerous industrial power distribution systems.
15
Figure 15a
Figure 15b
Operation On Auxiliary GeneratorsSpecial mention must be made with regard tooperation of systems on auxiliary generators.Generators are typically “soft” systems. They areusually sized as closely to the load as possible, andunless specially wound, are of relatively highimpedance (15 - 25%). Thus, all generators areincorporated in the <20 column for (ISC/IL) in Fig. 3. Aquick check of Figs. 7, 8, 10, 13, 14, and 15 revealsthat generator operation of non-linear loads requires
harmonic trap filters if voltage distortion limits are to bemet. In fact, many generators are not able to handle ahigh percentage of non-linear load, even when doubleover-sized. Without filters, some generators will notoperate at all with significant non-linear loading. Evenif harmonic limits did not exist, the successfuloperation of generators supplying large percentagenon-linear loads would be much more reliable whenthe proper harmonic trap filters are added.
Figure 15c
SummaryFrom the information presented in this article, one cansee that the distortion of line current and voltage canbe effectively reduced to acceptable levels usingharmonic trap filters. A basic understanding of howdistortion is created and the effects of circuitimpedances on the levels of distortion helps inresolving the problems created by distortion. Don't befooled by those who suggest that adding line reactorsor transformers ahead of a distortion load will reducethe level of distortion (voltage or current) to acceptablelevels in all instances. Realizing the role of thedistribution system impedance in any installation isnecessary to accurately predict the level of distortionattainable through the use of filtering or otherharmonic-reducing products.