meeting nutrient limits with activated sludge and control strategies | wastewater
TRANSCRIPT
Meeting Nutrient Limits with Activated Sludge & Strategies
MRWS ANNUAL CONFERENCE GREAT FALLS, MT
1

Nutrients Promote Growth of Algae
• Human health • Environmental • Economic
Excessive Algal Growth Has Many Undesirable Effects
2

Numeric Water Quality Standards for N & P
3

Status of Numeric Nutrient Water Quality Standards Montana Standards for Wadeable Streams Adopted
4

Montana Base Numeric Nutrient Standards
• TP – 25 to 150 µg/L • TN – 250 to 1,300 µg/L • Varies by USEPA Ecoregion • Seasonal • These are in-stream concentrations, not end-of-pipe
limits • Lakes/Reservoirs, Non-Wadeable Streams Standards
Development Ongoing
Wadeable Streams
5

Base Numeric Nutrient Standards Guidance Version 1.0 (July 2014)
• Facilities < 1 mgd • By 2016: 15 mg TN/L; 2.0 mg TP/L • After 3 x 5-yr. permit cycles: 8 mg TN/L; 0.8 mg TP/L
• Facilities > 1 mgd • By 2016: 10 mg TN/L, 1.0 mg TP/L • After 2 x 5-yr. permit cycles: 8 mg TN/L; 0.5 mg TP/L • TBD
• Monthly averages • Individual variances also possible
General Nutrient Standards Variance N&P Reduction Steps
6

Treatment Technology
7
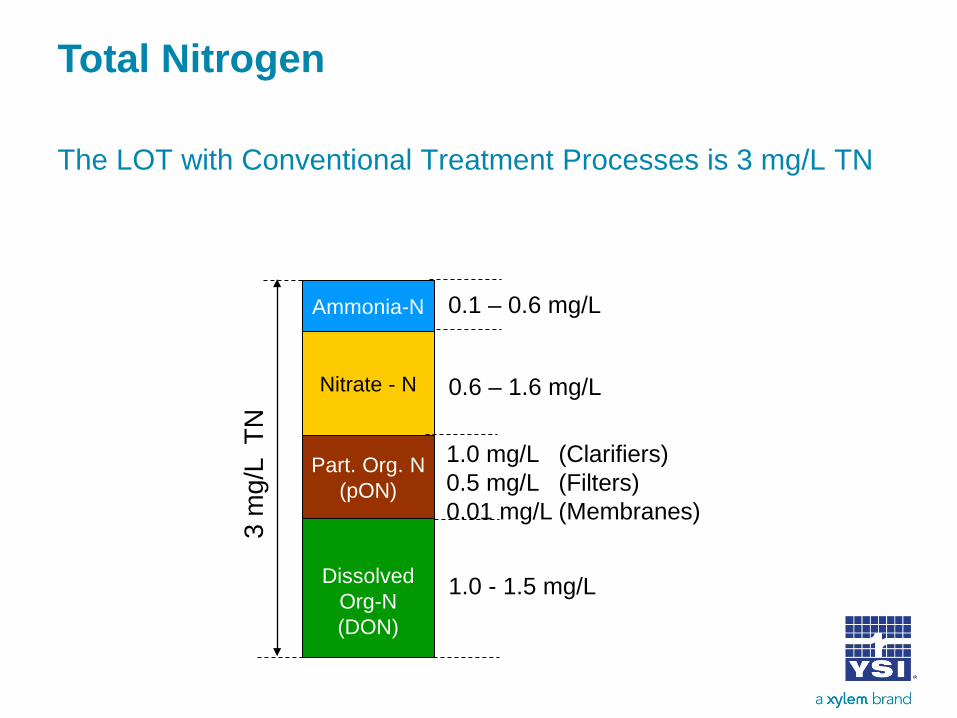
1.0 mg/L (Clarifiers) 0.5 mg/L (Filters) 0.01 mg/L (Membranes)
Total Nitrogen
The LOT with Conventional Treatment Processes is 3 mg/L TN
0.1 – 0.6 mg/L Ammonia-N
Nitrate - N
Dissolved
Org-N (DON)
Part. Org. N (pON)
0.6 – 1.6 mg/L
1.0 - 1.5 mg/L
3 m
g/L
TN

Biological Nitrogen Removal
N Removed by Synthesis
9
Source: Sedlak, R. Phosphorus and Nitrogen Removal from Municipal Wastewater Principles and Practice, 2nd ed., Lewis Publishers, 1991.
50
0
10
20
30
40 “more bugs”
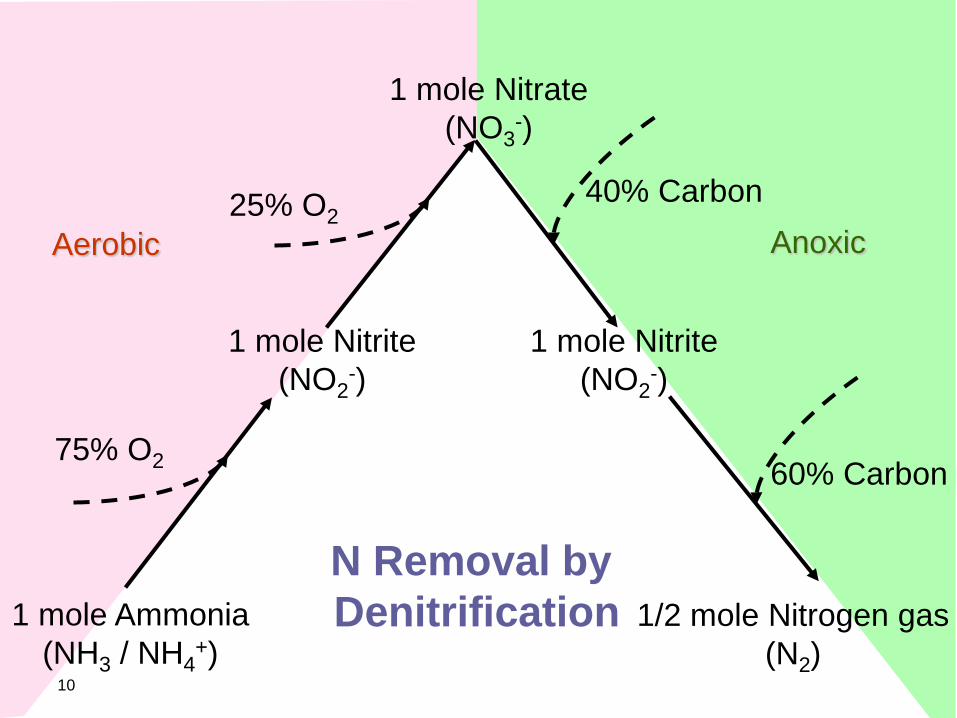
1 mole Ammonia (NH3 / NH4
+)
1 mole Nitrite (NO2
-)
1 mole Nitrate (NO3
-)
1 mole Nitrite (NO2
-)
1/2 mole Nitrogen gas (N2)
75% O2
25% O2 40% Carbon
60% Carbon
N Removal by Denitrification
Aerobic Anoxic
10

Total Phosphorus The LOT with Conventional Treatment Processes is 0.1 mg/L TP
Influent 6.0 mg/L 3.0 1.0 0.5 0.1 0.01
Second. Treatment
EBPR & Chem-P Removal
Conventional Filter
Tertiary Treatment

Effluent TP
Phosphorus Removal
Some ‘P’ Removal Occurs Normally
12
Soluble - P (Ortho-P)
Particulate P
Influent
Soluble - P
Particulate P
Secondary Effluent
TP
P removal by assimilation
WAS

Bio or Chem P Removal
Phosphorus Removal
Some ‘P’ Removal Occurs Normally
13
Soluble - P (Ortho-P)
Particulate P
Influent
Soluble - P
Particulate P
Particulate P
Treated Effluent
Effluent TP
WAS
Secondary Effluent
TP
Soluble - P P removal by assimilation

Nitrogen Removal
14
Clarifier
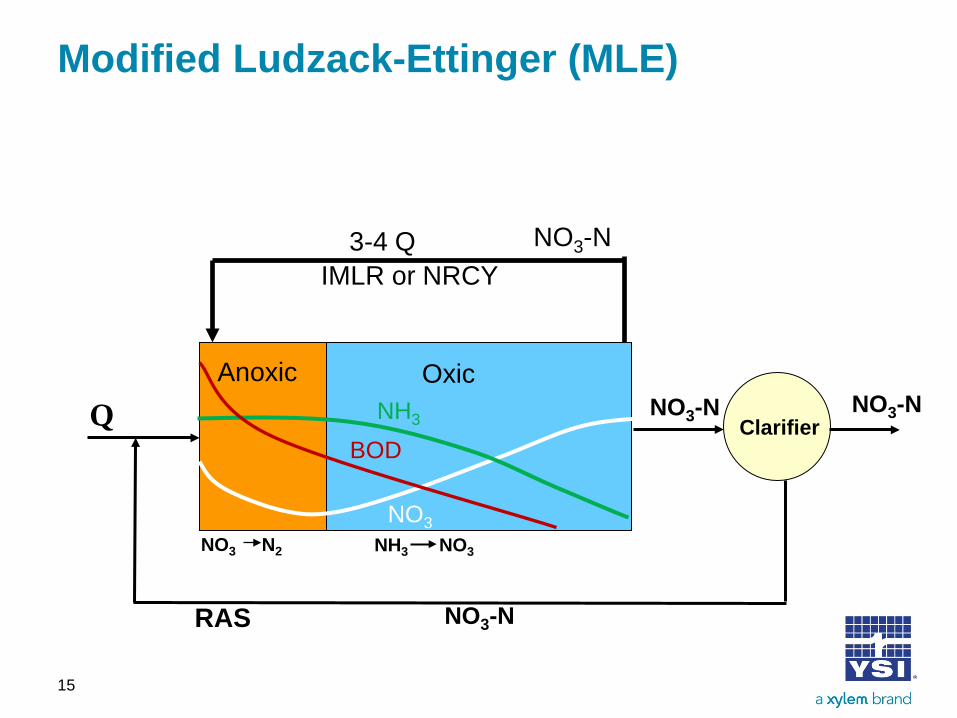
Modified Ludzack-Ettinger (MLE)
15
Anoxic Oxic
RAS
Q
NO3-N
NO3-N NO3-N
NH3 NO3 NO3 N2
NO3
NH3
3-4 Q NO3-N
BOD
IMLR or NRCY
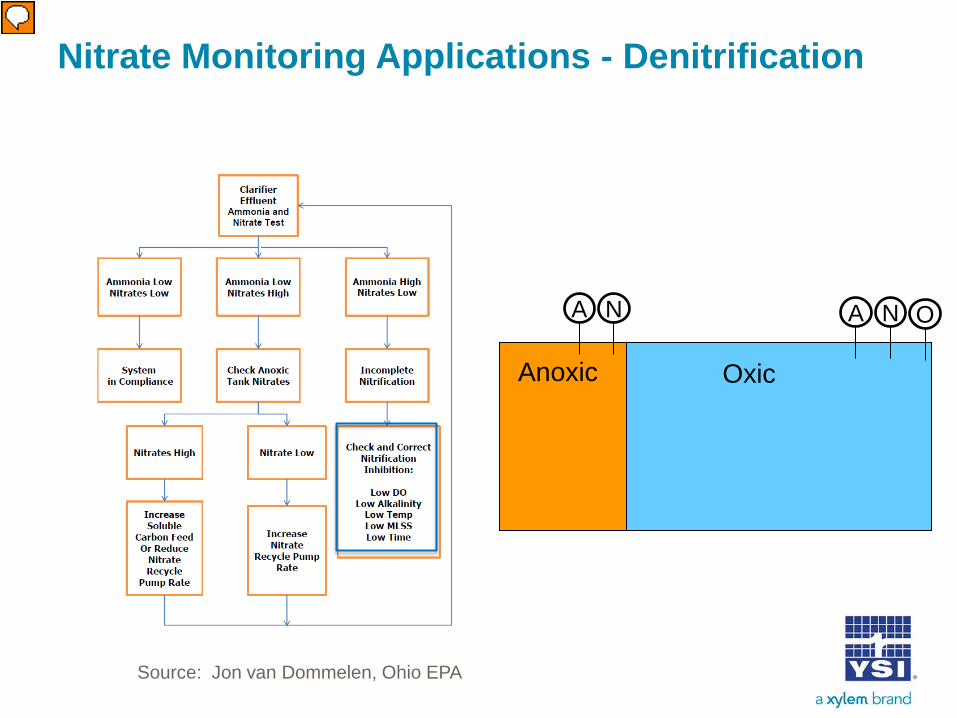
Nitrate Monitoring Applications - Denitrification
Source: Jon van Dommelen, Ohio EPA
Anoxic Oxic
A N A N O

ISE ammonium and nitrate
Reagentless Probes
• Measuring electrodes: NH4+, NO3
-,
• Compensation electrodes: K+, Cl-
• Stable calibration • Replaceable electrodes • Large measuring range
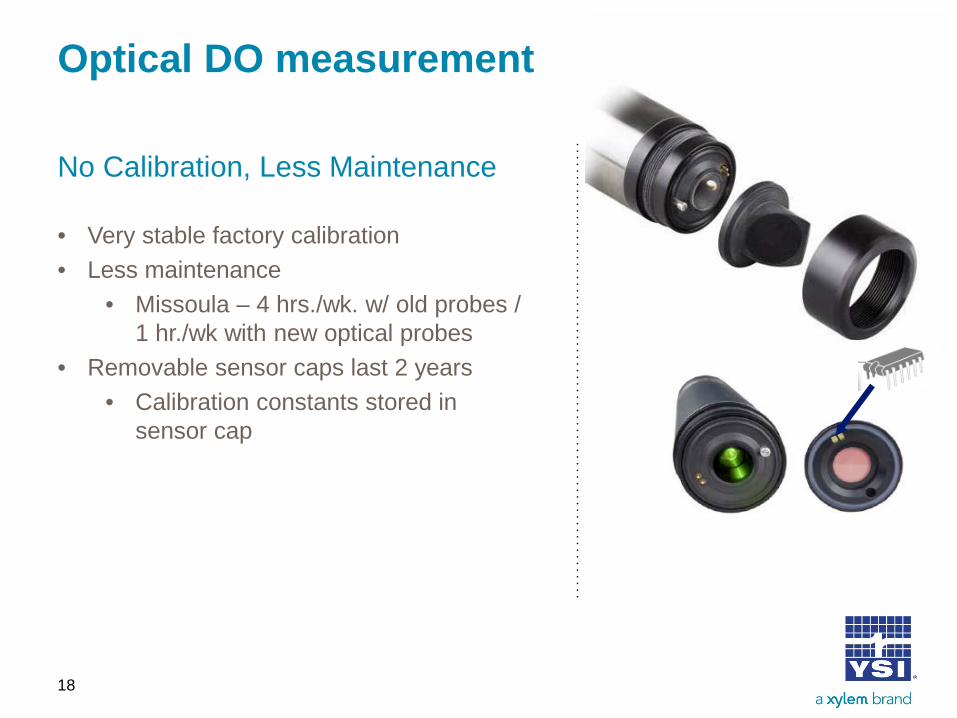
Optical DO measurement
No Calibration, Less Maintenance
• Very stable factory calibration • Less maintenance
• Missoula – 4 hrs./wk. w/ old probes / 1 hr./wk with new optical probes
• Removable sensor caps last 2 years • Calibration constants stored in
sensor cap
18

Scioto Reserve WWTP
• 0.423 mgd Design Flow • Land applies treated wastewater to an impoundment for
irrigation of golf course • In 2012, rules for land application change and
implementation begins • Effluent limits required 10 mg/L TIN
Scioto Reserve WWTP original design does not provide for denitrification


0
1
2
3
4
5
6
7
8
17:1
919
:39
21:5
90:
192:
394:
597:
199:
3911
:59
14:2
916
:49
19:0
921
:29
23:4
92:
094:
296:
499:
0911
:29
13:4
916
:09
18:2
920
:49
23:0
91:
293:
496:
098:
2910
:49
13:0
915
:29
17:4
920
:09
22:2
90:
493:
095:
297:
4910
:09
12:2
914
:49
17:0
919
:29
21:4
90:
092:
294:
497:
099:
2911
:49
14:0
916
:29
18:4
921
:10
23:3
01:
504:
106:
308:
5011
:10
13:3
015
:50
18:1
020
:30
22:5
01:
103:
305:
508:
10
2/12/2014 2/13/2014 2/14/2014 2/15/2014 2/16/2014 2/17/2014 2/18/2014 2/19/2014
Scioto Reserve WWTPVARiON Data
Aeration Tank NH3-N and DO
AT - DO AT - NH3-N
Tank Parameter
Date Time
Average of Concentration

Dissolved Oxygen and Performance
Balancing Nitrification - Denitrification
23
% o
f max
pro
cess
rate
Dissolved oxygen
Source: Gustaf Olsson, Lund University, Sweden
100%
0%

Anoxic Zone Monitoring
24
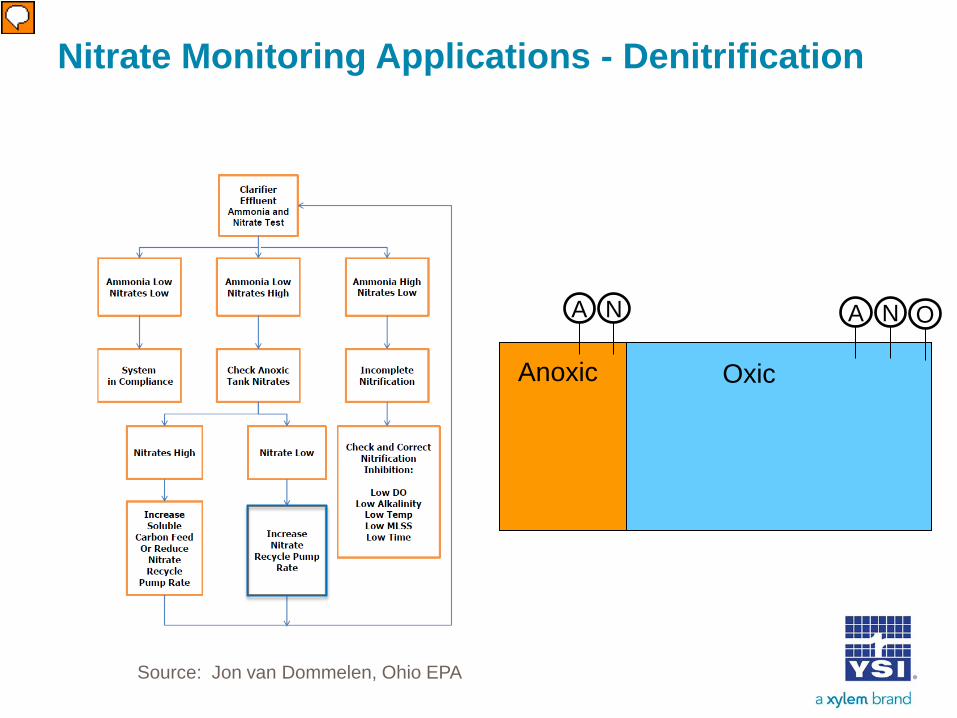
Nitrate Monitoring Applications - Denitrification
Source: Jon van Dommelen, Ohio EPA
Anoxic Oxic
A N A N O
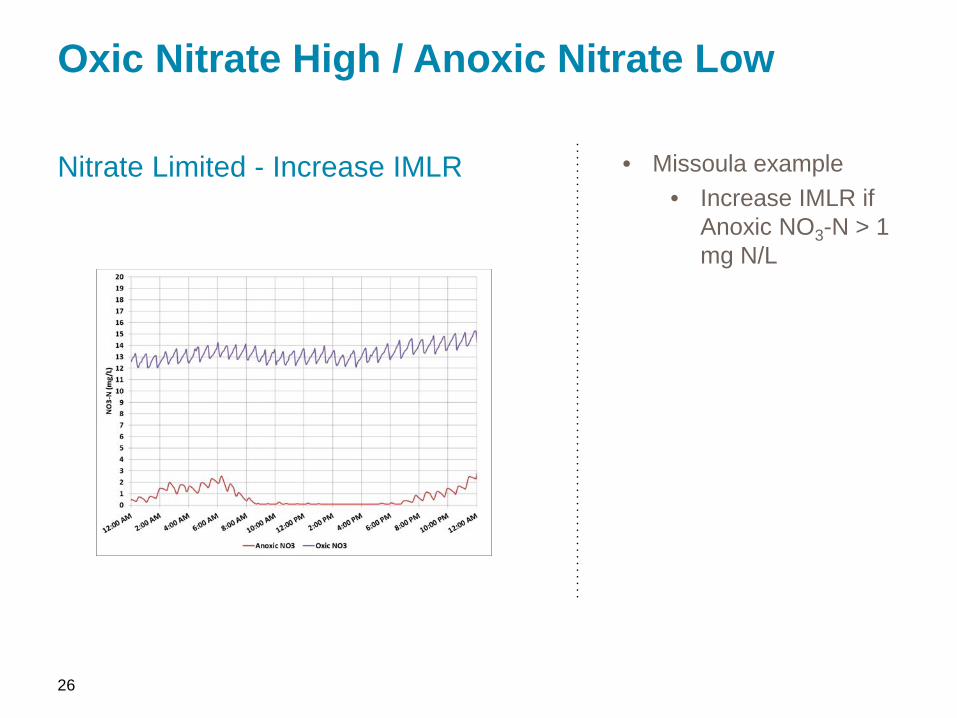
Oxic Nitrate High / Anoxic Nitrate Low
Nitrate Limited - Increase IMLR • Missoula example • Increase IMLR if
Anoxic NO3-N > 1 mg N/L
26

Nitrate Monitoring Applications - Denitrification
Source: Jon van Dommelen, Ohio EPA
Anoxic Oxic
A N A N O

Oxic nitrate high / anoxic nitrate high
Carbon Limited - Increase External Carbon
28
TIN limit = 10 mg/L
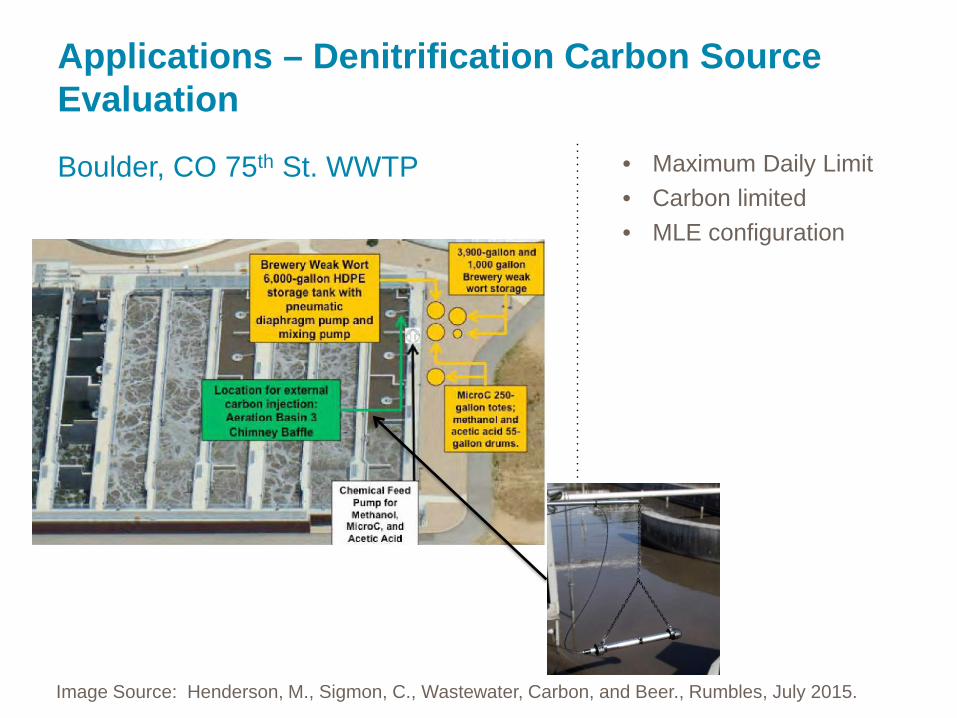
Applications – Denitrification Carbon Source Evaluation
Boulder, CO 75th St. WWTP • Maximum Daily Limit • Carbon limited • MLE configuration
Image Source: Henderson, M., Sigmon, C., Wastewater, Carbon, and Beer., Rumbles, July 2015.
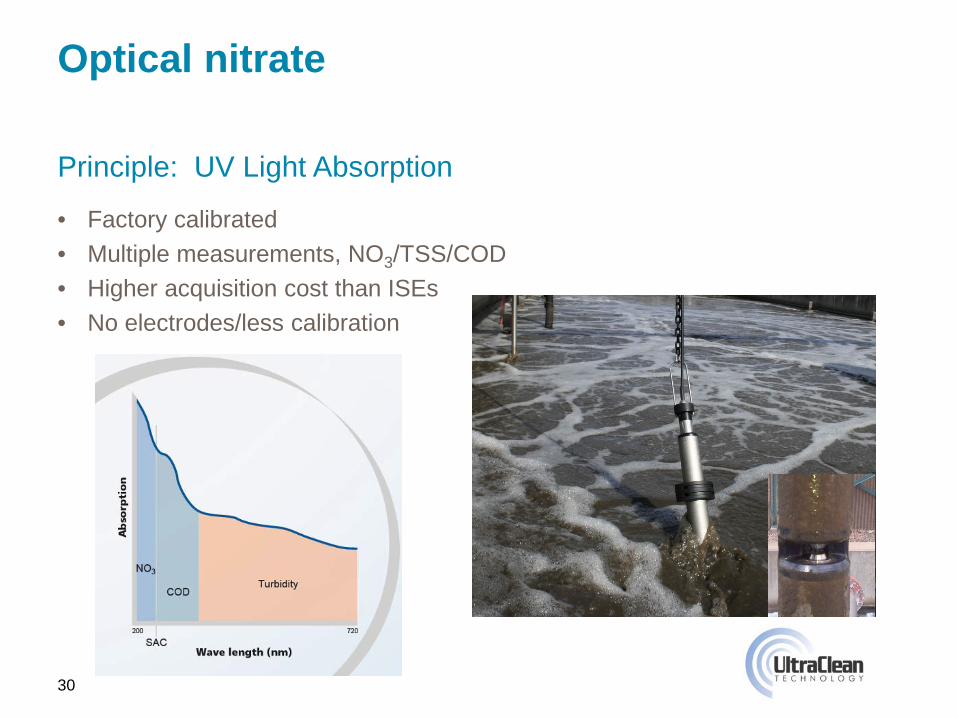
Optical nitrate
Principle: UV Light Absorption
• Factory calibrated • Multiple measurements, NO3/TSS/COD • Higher acquisition cost than ISEs • No electrodes/less calibration
30

Applications – Denitrification Carbon Source Evaluation
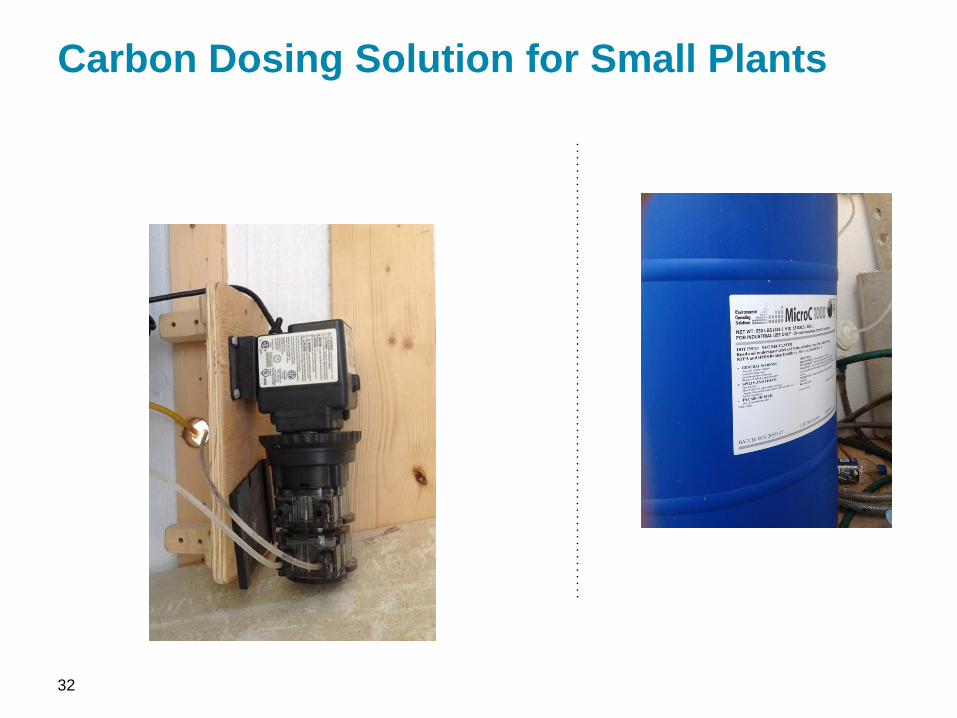
Carbon Dosing Solution for Small Plants
32
Phosphorus Removal
33

Chemical vs. Biological P Removal to Achieve 1.0 mg TP/L
34
Chemical Removal Biological Removal Capital Cost Low Moderate to High O&M Cost Low Moderate Cost of Chemicals Moderate to High Low Sludge Disposal Cost Increase Same or Lower Sustainability Low High Retrofit Simple Modest complexity Reliability High High (w/ chemical back-up)

Fox River WPCC, Brookfield, WI
‘P’
Fe P700
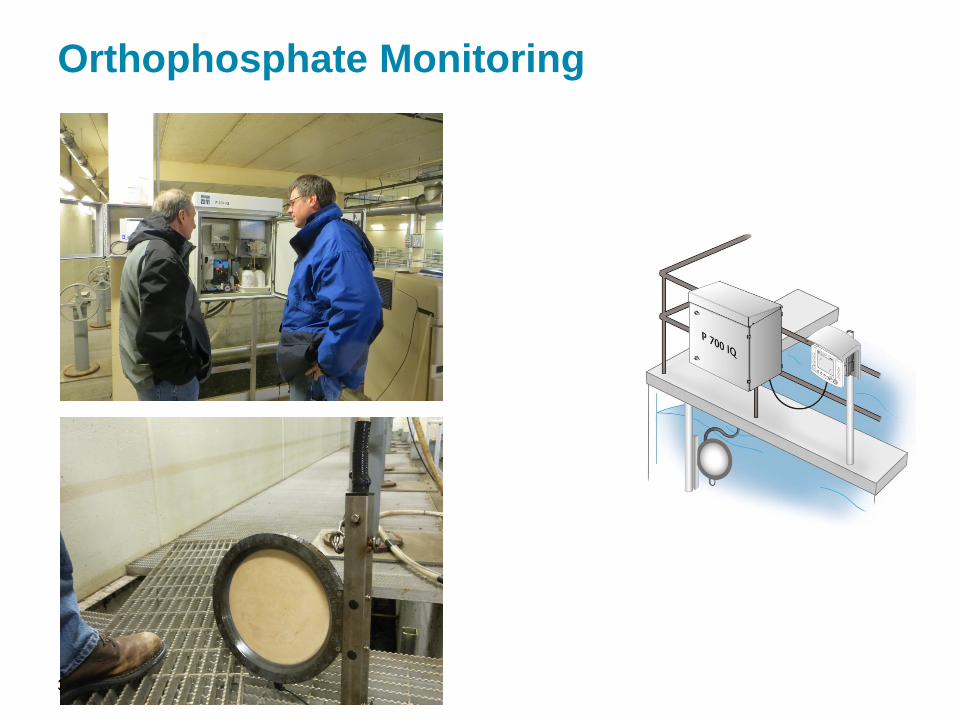
Orthophosphate Monitoring
36

Nitrogen & Phosphorus Removal
37

Why EBPR works? Energy Released by PHB oxidation is 24-36 times energy required for PHB storage
Enhanced Biological P Removal
Aerobic Anaerobic
Waste Sludge Loaded with P
BOD (VFA) uptake & C (PHB) Storage P release
Feed condition Battery charging
Ortho- P
• PHB Oxidized
• Excess P Uptake
Starved condition Battery discharging
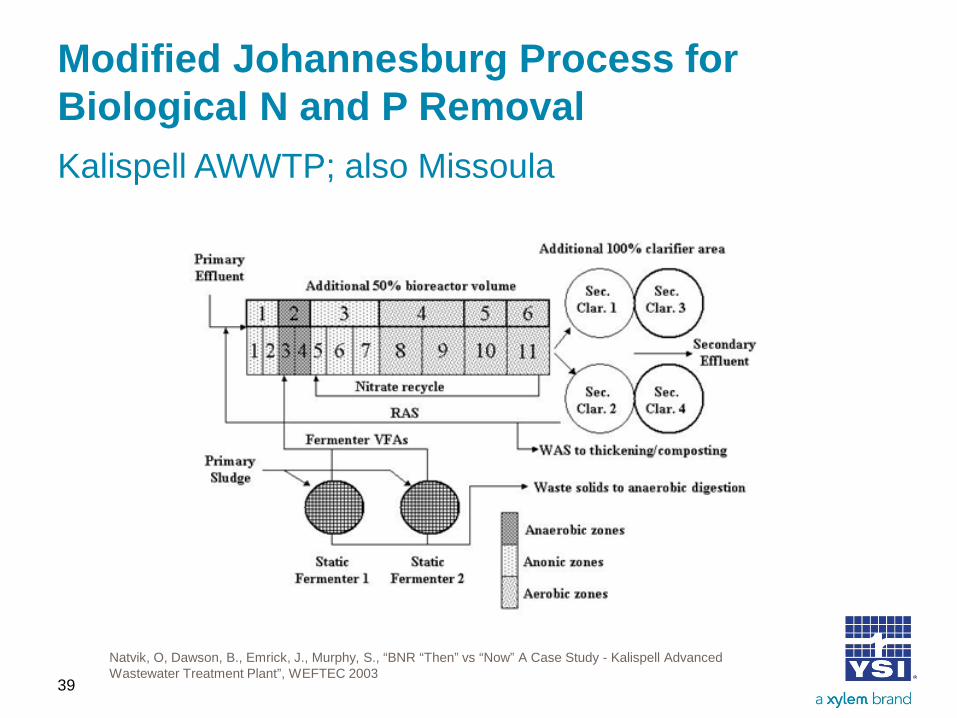
Modified Johannesburg Process for Biological N and P Removal Kalispell AWWTP; also Missoula
39
Natvik, O, Dawson, B., Emrick, J., Murphy, S., “BNR “Then” vs “Now” A Case Study - Kalispell Advanced Wastewater Treatment Plant”, WEFTEC 2003
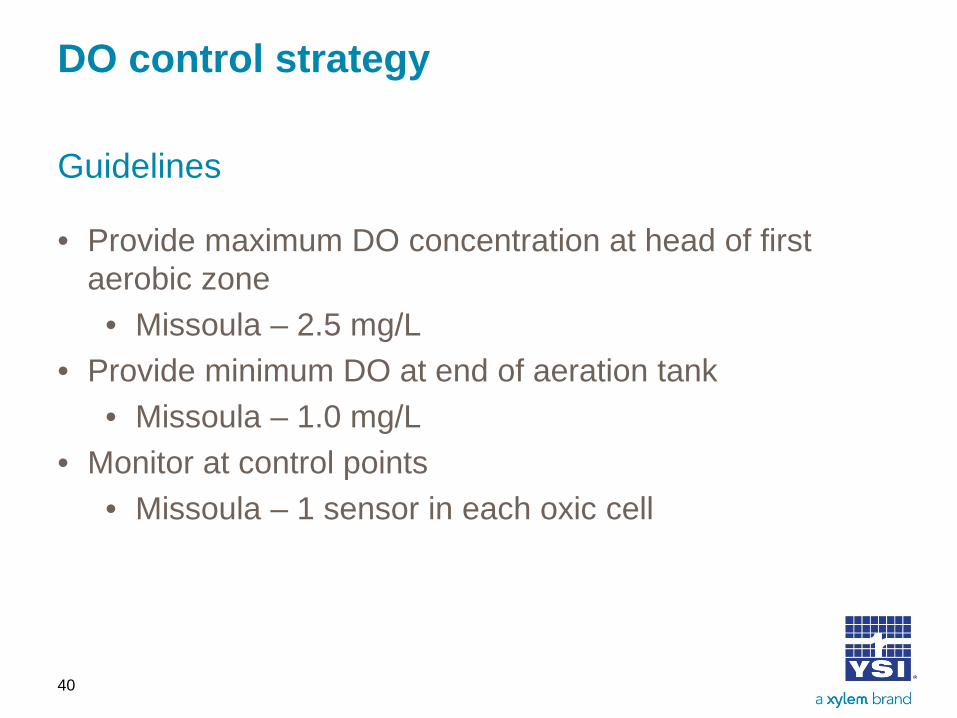
DO control strategy
• Provide maximum DO concentration at head of first aerobic zone
• Missoula – 2.5 mg/L • Provide minimum DO at end of aeration tank
• Missoula – 1.0 mg/L • Monitor at control points
• Missoula – 1 sensor in each oxic cell
Guidelines
40
Summary
• Nutrient limits are coming • Activated sludge can be modified to achieve biological
nutrient removal • Process control is critical • Modern sensor technology is readily available for reliable
continuous monitoring of DO, nitrate, ammonium, ortho-phosphate and other important parameters
41

Acknowledgements
• Ben Lewis, Ambiente H2O • Jon van Dommelen Ohio EPA • Gene Connell, Missoula Wastewater Division
Questions?
43
Ben Lewis
217 11th Street West Billings, MT 59102 [email protected] 406-969-2022 406-850-0030 Cell, 303/380-0664 fax