meghana ayyagari and thorsten beck · adb economics working paper series financial inclusion in...
TRANSCRIPT

ASIAN DEVELOPMENT BANK
AsiAn Development BAnk6 ADB Avenue, Mandaluyong City1550 Metro Manila, Philippineswww.adb.org
Financial Inclusion in Asia: An Overview
This paper provides an analysis of financial development and inclusion in developing Asia using data from a wide array of sources. In terms of aggregate measures of financial development, the region as a whole has superior banking sector depth compared to other developing regions; however, this masks a great deal of variation across Asian economies. On financial inclusion, the most commonly reported barriers are cost, geographic access, and lack of identification.
About the Asian Development Bank
ADB’s vision is an Asia and Pacific region free of poverty. Its mission is to help its developing member countries reduce poverty and improve the quality of life of their people. Despite the region’s many successes, it remains home to the majority of the world’s poor. ADB is committed to reducing poverty through inclusive economic growth, environmentally sustainable growth, and regional integration.
Based in Manila, ADB is owned by 67 members, including 48 from the region. Its main instruments for helping its developing member countries are policy dialogue, loans, equity investments, guarantees, grants, and technical assistance.
FInAncIAl InclusIOn In AsIA: An OvervIewMeghana Ayyagari and Thorsten Beck
adb economicsworking paper series
nO. 449
september 2015

ADB Economics Working Paper Series
Financial Inclusion in Asia: An Overview Meghana Ayyagari and Thorsten Beck
No. 449 | September 2015
Meghana Ayyagari ([email protected]) is Associate Professor of International Business and International Affairs at George Washington University. Thorsten Beck([email protected]) is Professor of Banking and Finance at Cass Business School in London and a research fellow of the Centre for Economic Policy Research (CEPR). This study was prepared as a background paper for the Asian Development Outlook 2015 theme chapter. We thank Nataliya Mylenko and participants at the ADB workshop for useful comments and suggestions.
ASIAN DEVELOPMENT BANK

Asian Development Bank 6 ADB Avenue, Mandaluyong City 1550 Metro Manila, Philippines www.adb.org
© 2015 by Asian Development Bank September 2015 ISSN 2313-6537 (Print), 2313-6545 (e-ISSN) Publication Stock No. WPS157603-2
The views expressed in this paper are those of the authors and do not necessarily reflect the views and policies of the Asian Development Bank (ADB) or its Board of Governors or the governments they represent.
ADB does not guarantee the accuracy of the data included in this publication and accepts no responsibility for any consequence of their use.
By making any designation of or reference to a particular territory or geographic area, or by using the term “country” in this document, ADB does not intend to make any judgments as to the legal or other status of any territory or area.
Note: In this publication, “$” refers to US dollars.
The ADB Economics Working Paper Series is a forum for stimulating discussion and eliciting feedback on ongoing and recently completed research and policy studies undertaken by the Asian Development Bank (ADB) staff, consultants, or resource persons. The series deals with key economic and development problems, particularly those facing the Asia and Pacific region; as well as conceptual, analytical, or methodological issues relating to project/program economic analysis, and statistical data and measurement. The series aims to enhance the knowledge on Asia’s development and policy challenges; strengthen analytical rigor and quality of ADB’s country partnership strategies, and its subregional and country operations; and improve the quality and availability of statistical data and development indicators for monitoring development effectiveness.
The ADB Economics Working Paper Series is a quick-disseminating, informal publication whose titles could subsequently be revised for publication as articles in professional journals or chapters in books. The series is maintained by the Economic Research and Regional Cooperation Department.

CONTENTS TABLES AND FIGURES iv ABSTRACT v I. INTRODUCTION 1 II. FINANCIAL INCLUSION IN ASIA: THE FACTS 2 A. Financial Development across Developing Asia 2 B. Access of Households to Finance in Developing Asia 3 C. Access of Firms to Finance in Developing Asia 6 III. FINANCIAL INCLUSION IN ASIA: THE CHALLENGES 9 A. Barriers to Access and Use of Financial Services by Households 9 B. Barriers to Access and Use of Financial Services by Firms 11 C. Benchmarking the Financial System in Asia 13 IV. CONCLUSION 16 REFERENCES 19

TABLES AND FIGURES TABLES 1. Financial Use and Access across Firms in Developing Economies, 2006–2014 7 2 Why Do Firms Not Apply for Loans? 12 FIGURES 1 Financial Development across Economies 2 2 Financial Development by Income Group 3 3 Financial Development across Developing Asia over Time 4 4 Formal Account Penetration Worldwide 5 5 Formal Account Penetration in Developing Asia 5 6 ATMs and Bank Branches per 100,000 Adults 6 7 Percentage of Firms with a Line of Credit/Loan in Developing Asia by Size of Firm 8 8 Financing Sources of Working Capital in Developing Asia by Size of Firm 9 9 Barriers to Account Penetration in Developing Asia, 2011 10 10 Constraints Faced by Firms in Developing Asia 12 11 Gap in Private Credit/Gross Domestic Product in Developing Asia 14 12 Gap in Account Penetration in Developing Asia 15 13 Gap in Share of Firms with Formal Credit in Developing Asia 16

ABSTRACT This paper provides an analysis of financial development and inclusion in developing Asia using data from a wide array of sources. We show that in terms of aggregate measures of financial development, the region as a whole has superior banking sector depth compared to other developing regions; however, this masks a great deal of variation across Asian economies. Furthermore, in terms of financial inclusion, fewer than 27% of adults in developing Asia have an account in a formal financial institution, and only 33% of enterprises report having a line of credit or a loan from a financial institution. Cost, geographic access, and lack of identification are the most commonly reported barriers to financial inclusion that can be addressed by policy makers. Keywords: financial development, financial inclusion, financial system JEL Classification: D14, G20, G21, G30

I. INTRODUCTION Financial inclusion defined broadly as access by enterprises and households to reasonably priced and appropriate formal financial services that meet the needs of enterprises and households has been adopted as a top development priority by policy makers around the world. In 2011, over 90 developing and emerging economy governments endorsed the Maya Declaration, the first global set of measurable commitments aimed at promoting financial inclusion. Others including the G-20, the World Bank, and the United Nations Secretary General’s High-Level Panel on the Post-2015 Development Agenda have recognized and embraced the goal of broader access to financial services to reduce income inequality, to boost job creation, and to achieve equitable growth.
This priority is backed by a growing body of research that shows that financial inclusion has significant benefits for both individuals and firms. For example, access to savings instruments has been shown to increase savings (Aportela 1999; Ashraf, Karlan, and Yin 2006), productive investment (Dupas and Robinson 2013), consumption (Dupas and Robinson 2013), and female empowerment (Ashraf, Karlan, and Yin 2010). In addition, lack of access to finance has been shown to lead to poverty traps and to inequality (e.g. Banerjee and Newman 1993; Galor and Zeira 1993; Aghion and Bolton 1997; Beck, Demirgüç-Kunt, and Levine 2007). Micro evidence in the form of financial diaries (Collins et al. 2009) has shown that even the poorest of the poor have a demand for financial services. A large body of literature has shown that access to finance is associated with faster growth both for firms (Beck, Demirgüç-Kunt, and Maksimovic 2005; Ayyagari, Demirgüç-Kunt, and Maksimovic 2008) and in the aggregate (see Levine 2005 for a review). Access to finance has also been shown to promote new firm entry (Klapper, Laeven, and Rajan 2006) and greater innovation (Ayyagari, Demirgüç-Kunt, and Maksimovic 2011).
By allowing broad access to financial services without price or nonprice barriers to their use, inclusive financial systems are especially likely to benefit the disadvantaged. Without inclusive financial systems, poor people are forced to rely on their own resources to meet their financial needs and face systemic or idiosyncratic shocks (Demirgüç-Kunt and Klapper 2013), and small enterprises must rely on their limited earnings to pursue promising growth opportunities. This has broader aggregate consequences leading to persistent income inequality and stunted economic growth.
In this paper, we take stock of the current state of financial inclusion in developing Asia. We
begin by documenting the different dimensions of financial inclusion in Section II, including both international comparisons as well as comparisons within the region and over time. In doing so, we use information from a wide array of databases. Our understanding of the reach of the finance sector and policies that foster inclusion has advanced significantly with the availability of databases such as the Global Findex Survey (Demirgüç-Kunt and Klapper 2013). This provides a new dimension on previous data such as the World Bank Enterprise Surveys that provide information on firms’ access to finance in developing economies and data on the use of financial services collected from bank regulators and supervisors (Beck, Demirgüç-Kunt, and Martinez Peria 2007; Honohan 2008; Kendall, Mylenko, and Ponce 2010).
In Section III, we use a cross-economy benchmarking exercise as a diagnostic tool to assess
the gap between the actual provision of financial services and the demand from the real sector. Section IV concludes with a discussion on policy implications for the region.

2 | ADB Economics Working Paper Series No. 449
II. FINANCIAL INCLUSION IN ASIA: THE FACTS
A. Financial Development across Developing Asia We begin by presenting an aggregate picture of financial development using three standard indicators of financial development from the Financial Development and Structure Database (Beck, Demirgüç-Kunt, and Levine 2000; Čihák et al. 2010): liquid liabilities to gross domestic product (GDP), bank deposits to GDP, and private credit to GDP.
Liquid liabilities to GDP is a traditional measure of financial depth (King and Levine 1993) and represents the ratio of currency plus demand and interest-bearing liabilities of banks and other financial intermediaries to GDP. Bank deposits to GDP is the ratio of all checking, savings, and time deposits in deposit monetary institutions to GDP and is a stock indicator of deposit resources available to the finance sector for its lending activities. While these indicators measure the liability side of the balance sheets, as an indicator of the asset side we use private credit to GDP, which is the claims on the private sector by deposit money banks and other financial institutions divided by GDP. Figure 1 presents the median values for the year 2011, the most recent year available.
Figure 1: Financial Development across Economies
GDP = gross domestic product, LAC = Latin America and the Caribbean, MENA = Middle East and North Africa, SSA = Sub-Saharan Africa. Source: Beck et al. 2014.
Figure 1 shows that the median economy in developing Asia fared worse across all three
indicators than the median in the high-income group and in the Middle East and North Africa (MENA) but fared better than the median in Europe, Latin America and the Caribbean (LAC), and Sub-Saharan Africa. For instance, the median private credit to GDP ratio was 41.44 in developing Asia compared to 37.40 in LAC and 18.78 in Sub-Saharan Africa.
In Figure 2, we find a very different picture. Specifically, within each income group, the median
economy in developing Asia had a higher level of private credit to GDP in 2011 compared to the
0
20
40
60
80
100
120
High income MENA DevelopingAsia
Europe LAC SSA
%
Private credit to GDP Bank deposits to GDP Liquid liabilities to GDP

Financial Inclusion in Asia: An Overview | 3
median in the rest of the world. For instance, there are four economies in developing Asia in the high-income group (Brunei Darussalam; Hong Kong, China; Republic of Korea; and Singapore) with a median private credit to GDP ratio of 102.67 compared with the ratio of 100.5 in the 35 economies in the high-income group in the rest of the world.
Figure 2: Financial Development by Income Group
FI = financial institution, GDP = gross domestic product. Note: The gross national income per capita thresholds for income classifications are: Low <$1,025; Lower middle: $1,026–$4,035; Upper middle: $4,036–$12,475; High income: >$12,475. Source: Beck et al. 2014.
In Figure 3 we added the stock market turnover ratio and used a balanced sample of
economies—15 in developing Asia—for which we have data on all four measures of financial development from 2001 to 2011. Figure 3 plots the median values across economies each year and shows that there was an increasing trend in private credit to GDP, liquid liabilities to GDP, and bank deposits to GDP. The stock market turnover ratio showed a large run-up from 2006 to 2009 and a decline thereafter following the global financial crisis in 2008.
B. Access of Households to Finance in Developing Asia Until recently, systematic indicators of the extent of financial inclusion and the degree to which different groups such as women, the poor, and people in rural areas are excluded from the formal financial system had been lacking for most economies. The 2011 Global Findex Database (Demirgüç-Kunt and Klapper 2013)1 now provides such indicators based on survey data from interviews with more than 150,000 nationally representative and randomly selected adults aged 15 and over in 148 economies. The surveys were carried out by Gallup, Inc. as part of the Gallup World Poll.
1 A new version of the database was released in April 2015 based on surveys in 2013 and 2014.
0
20
40
60
80
100
120
High income Upper-middleincome
Lower-middleincome
Low income
Priv
ate
cred
it by
dep
osit
mon
ey b
anks
and
FIs
to G
DP
(%)
Developing Asia Rest of the world

4 | ADB Economics Working Paper Series No. 449
Figure 3: Financial Development across Developing Asia over Time
GDP = gross domestic product. Source: Beck et al. 2014.
We begin by looking at account penetration in Figure 4 which is the percentage of adults who
have individual or joint ownership of an account at a formal financial institution (a bank, a credit union, a cooperative, a post office, or a microfinance institution). The global median is 38.2%, and the global average is 45.7% suggesting that more than 50% of adults worldwide report not having such an account. Figure 4, however, shows a huge variation between high-income and developing economies. While more than 90% of adults in the high-income group reported having an account, the median country in Sub-Saharan Africa reported fewer than 18% of adult account holders. The median economy in developing Asia fared better than Sub-Saharan Africa and MENA but still came in below the global median with an account penetration of just 26.7%. Within developing Asia there was a huge variation as seen in Figure 5. Account penetration was nearly universal in economies like the Republic of Korea and Singapore, whereas fewer than 1% of adults in Turkmenistan, and fewer than 5% in Cambodia, the Kyrgyz Republic, and Tajikistan held accounts.
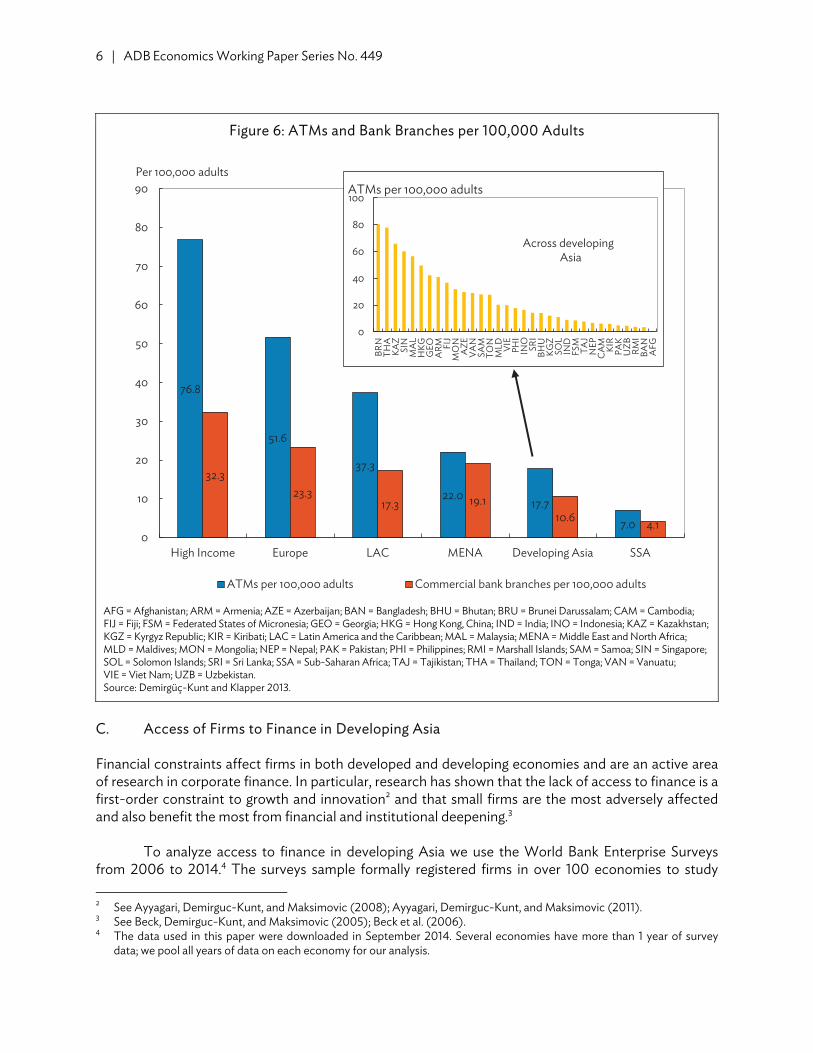
A complementary picture emerges when we focus on the supply-side data on financial
inclusion. Specifically, we use data for 2011 from the Financial Access Survey by the International Monetary Fund on two indicators: ATMs per 100,000 adults and commercial bank branches per 100,000 adults. While there is a positive, significant correlation between use and access, many of the economies in developing Asia are at the lower end of the spectrum.
0
20
40
60
80
100
2000 2001 2002 2003 2004 2005 2006 2007 2008 2009 2010 2011
%
Private credit to GDP Liquid liabilities to GDP
Stock market turnover ratio Bank deposits to GDP

Financial Inclusion in Asia: An Overview | 5
Figure 4: Formal Account Penetration Worldwide
LAC = Latin America and the Caribbean, MENA = Middle East and North Africa, SSA = Sub-Saharan Africa. Source: Demirgüç-Kunt and Klapper 2013.
Figure 5: Formal Account Penetration in Developing Asia
Lao PDR = Lao People’s Democratic Republic, PRC = People’s Republic of China. Source: Demirgüç-Kunt and Klapper 2013.
The median economy in developing Asia fared better than only the median in Sub-Saharan
Africa; the region trailed all the others. Within the region, however, there are again large differences as shown in the inset figure. The number of ATMs per 100,000 adults ranged from over 75 in Brunei Darussalam and Thailand (we do not have data on the Republic of Korea) to fewer than 5 in Afghanistan, Bangladesh, the Marshall Islands, Pakistan, and Uzbekistan (Figure 6).
93.3
52.8
27.7 26.7 24.4 17.50
10
20
30
40
50
60
70
80
90
100
Highincome
Europe LAC DevelopingAsia
MENA SSA
% o
f adu
lts w
ith an
acc
ount
at a
form
al
finan
cial
inst
itutio
n
Global median 38.2%
0 20 40 60 80 100
SingaporeRepublic of KoreaHong Kong, China
MongoliaThailandSri LankaMalaysia
PRCKazakhstanBangladesh
IndiaGeorgia
Lao PDRPhilippines
NepalUzbekistan
Viet NamIndonesia
ArmeniaAzerbaijan
PakistanAfghanistan
Kyrgyz RepublicCambodiaTajikistan
Turkmenistan
% of adults with an account at a formal financial institution
6 | ADB Economics Working Paper Series No. 449
Figure 6: ATMs and Bank Branches per 100,000 Adults
AFG = Afghanistan; ARM = Armenia; AZE = Azerbaijan; BAN = Bangladesh; BHU = Bhutan; BRU = Brunei Darussalam; CAM = Cambodia; FIJ = Fiji; FSM = Federated States of Micronesia; GEO = Georgia; HKG = Hong Kong, China; IND = India; INO = Indonesia; KAZ = Kazakhstan; KGZ = Kyrgyz Republic; KIR = Kiribati; LAC = Latin America and the Caribbean; MAL = Malaysia; MENA = Middle East and North Africa; MLD = Maldives; MON = Mongolia; NEP = Nepal; PAK = Pakistan; PHI = Philippines; RMI = Marshall Islands; SAM = Samoa; SIN = Singapore; SOL = Solomon Islands; SRI = Sri Lanka; SSA = Sub-Saharan Africa; TAJ = Tajikistan; THA = Thailand; TON = Tonga; VAN = Vanuatu; VIE = Viet Nam; UZB = Uzbekistan. Source: Demirgüç-Kunt and Klapper 2013.
C. Access of Firms to Finance in Developing Asia Financial constraints affect firms in both developed and developing economies and are an active area of research in corporate finance. In particular, research has shown that the lack of access to finance is a first-order constraint to growth and innovation2 and that small firms are the most adversely affected and also benefit the most from financial and institutional deepening.3
To analyze access to finance in developing Asia we use the World Bank Enterprise Surveys
from 2006 to 2014.4 The surveys sample formally registered firms in over 100 economies to study 2 See Ayyagari, Demirguc-Kunt, and Maksimovic (2008); Ayyagari, Demirguc-Kunt, and Maksimovic (2011). 3 See Beck, Demirguc-Kunt, and Maksimovic (2005); Beck et al. (2006). 4 The data used in this paper were downloaded in September 2014. Several economies have more than 1 year of survey
data; we pool all years of data on each economy for our analysis.
76.8
51.6
37.3
22.017.7
7.0
32.323.3
17.3 19.110.6 4.1
0
10
20
30
40
50
60
70
80
90
High Income Europe LAC MENA Developing Asia SSA
Per 100,000 adults
ATMs per 100,000 adults Commercial bank branches per 100,000 adults
0
20
40
60
80
100
BRN
THA
KAZ
SIN
MA
LH
KGG
EOA
RM FIJ
MO
NA
ZEVA
NSA
MTO
NM
LD VIE
PHI
INO
SRI
BHU
KGZ
SOL
IND
FSM
TAJ
NEP
CA
M KIR
PAK
UZB RM
IBA
NA
FG
ATMs per 100,000 adults
Across developing Asia

Financial Inclusion in Asia: An Overview | 7
business climate constraints to private sector growth and performance. They use standardized survey instruments and a uniform sampling methodology to minimize measurement error and to yield data that are comparable across economies. We use two main indicators: the presence of a checking and/or savings account and access to a line of credit or loan from a financial institution.
Regional comparisons in Table 1 show that the percentage of firms5 in developing Asia with a
checking/savings account was 84.24%, comparable to the percentage in Africa (83.94%) but lower than that in LAC (88.83%) and emerging Europe (92.13%). Similarly, when we look at lines of credit/loans from a financial institution, we find that the percentage for developing Asia (32.96%) trailed LAC (53.65%) and Europe (40.91%). Within developing Asia, East Asia6 and the Pacific7 performed better than the other subregions on both indicators. Overall, the table shows that while a large percentage of firms use a checking/saving accounts, access to external finance is limited.
Table 1: Financial Use and Access across Firms in Developing Economies, 2006–2014
Region
Percentage of enterprises that have a checking/savings account
(%)
Percentage of enterprises that have a line of credit/loan from a
financial institution (%) Middle East and North Africa 54.39 13.88
Developing Asia 84.24 32.96 Central Asia 88.23 29.67 East Asia 91.80 35.63 South Asia 79.72 31.19 Southeast Asia 77.19 35.54 The Pacific 94.56 39.36
Sub-Saharan Africa 83.94 19.03 Latin America and the Caribbean 88.83 53.65 Europe 92.13 40.91
Source: World Bank Enterprise Surveys. We next focus on which types of firms—small versus large—may be particularly disadvantaged in
access to credit in developing Asia. The enterprise surveys classify firms into small (5–19 employees), medium-sized (20–99 employees), and large (100+ employees). We focus on two questions: (a) line of credit or loan from a financial institution (same variable as in Table 2); and (b) the proportion of working capital that was financed (i) from internal funds/retained earnings, (ii) by borrowing from banks (private and state-owned), (iii) by borrowing from nonbank financial institutions, (iv) by purchases on credit from suppliers and advances from customers which we term trade credit, and (v) by other means (e.g. moneylenders, friends, relatives) all of which should sum to 100%.
Figure 7 shows that in developing Asia, the percentage of small firms that reported having a line
of credit/loan from a financial institution was much smaller than the percentages for medium-sized
5 We restrict our analysis to single establishment firms which are the majority of our sample (85%). Hence we use the term
establishment and firm interchangeably. 6 This includes the People’s Republic of China (PRC) and Mongolia. 7 This includes Fiji, the Federated States of Micronesia, Timor-Leste, Tonga, Vanuatu, and Samoa.

8 | ADB Economics Working Paper Series No. 449
and large firms. Figure 8 shows the average percentage of working capital financed from each of these sources by firm size. We see that on average, over 75% of working capital was funded from retained earnings. The share of working capital sourced from banks was the next largest and varied from 8.2% for small firms to 17.14% for large firms. Overall, the findings in Figures 7 and 8 suggest that in developing Asia, the access to credit of small firms is particularly constrained.
To summarize, the data present a mixed picture of achievements and challenges. On the one
hand, the median economy in developing Asia shows greater banking sector depth and a better stock market turnover ratio compared to the median developing economy in other regions of the world. On the other hand, the picture looks very bleak with few households accessing formal financial services and very few enterprises having access to external credit. In addition, there is wide variation within developing Asia with East Asia performing better on most indicators than Central Asia.
Figure 7: Percentage of Firms with a Line of Credit/Loan in Developing Asia by Size of Firm
FSM = Federated States of Micronesia, Lao PDR = Lao People’s Democratic Republic, PRC = People’s Republic of China. Source: World Bank Enterprise Surveys.
0 20 40 60 80 100
Timor-LesteAfghanistan
AzerbaijanMyanmarLao PDR
UzbekistanKyrgyz Republic
TajikistanPRC
IndonesiaPakistan
FijiKazakhstan
NepalPhilippines
BangladeshSri LankaArmenia
MongoliaGeorgiaBhutan
Viet NamVanuatu
SamoaFSM
Tonga
%Small (<20 employees) Medium-sized (20–99 employees)Large (100+ employees)

Financial Inclusion in Asia: An Overview | 9
Figure 8: Financing Sources of Working Capital in Developing Asia by Size of Firm
Source: World Bank Enterprise Surveys.
III. FINANCIAL INCLUSION IN ASIA: THE CHALLENGES
It is important to understand not only the actual use of and access to financial services but also the barriers to financial inclusion to better enable policy makers to design policies to close the gaps. We undertook a benchmarking exercise to assess the level of financial inclusion in Asia in comparison to what it should be compared with comparable economies.
A. Barriers to Access and Use of Financial Services by Households There are multiple barriers to financial inclusion across the world that represent a mix between supply-driven factors such as geographic distances and high transaction costs for banks to operate in remote locations and demand-driven factors such as lack of financial understanding or erratic cash flows and low incomes.
Individuals in the Global Findex Survey were asked to report reasons for not having a formal account and were allowed more than one response. Figure 9 plots the percentage of nonaccount holders in developing Asia who cited each of the following reasons: lack of money, too expensive, lack of documentation, too far away, religious reasons, lack of trust, and family member already has an account. For the “lack of money” reason we restricted the sample to nonaccount holders who cited only this reason; for the other reasons, we allowed multiple responses.
8.20 13.18 17.14
0
20
40
60
80
100
Small (<20 employees) Medium-sized (20–99employees)
Large (100+ employees)
%
Other (moneylenders, friends, relatives, etc.) Trade creditNonbank financial institutions BanksInternal funds/Retained earnings

10 | ADB Economics Working Paper Series No. 449
Figure 9: Barriers to Account Penetration in Developing Asia, 2011
Notes: Respondents were allowed more than one response. The data for lack of money reports the percentage of adults who reported only this reason. Source: Demirgüç-Kunt and Klapper 2013.
Lack of money was cited by 76.2% of adults as the only reason for not having a formal account.
When we looked within developing Asia (statistics not shown), the numbers showed that lack of money was uniformly high (above 70%) across all subregions. Cost and geographic access were the next most frequently cited at just over 21%. Clearly, the fixed costs associated with opening and maintaining an account are an important barrier to financial inclusion as are the great distances that people, especially those in rural areas, have to travel to reach a bank branch. The density of bank branches and ATM penetration relative to the population provide a crude indication of the physical barriers to access, and as discussed in Figure 6, developing Asia scored worse on both indicators than all other regions except Sub-Saharan Africa.
To some extent, cost and physical access barriers can be overcome by technology and
alternate delivery channels that have gained importance over the past decades. These include mobile banking where trucks drive through remote areas providing financial services according to a schedule, mobile phone finance that allows clients to do financial transactions over the phone, and e-finance that allows clients to access services through the Internet. These channels do not, however, seem to be very prevalent in developing Asia as suggested by recent statistics from the Global Findex Survey. The percentage of respondents who used wire transfers or the internet to pay bills or to buy things using money from their accounts was only 2.05% in the median economy in developing Asia compared to 44.8% in the median high-income economy. These numbers were all below 8% in the median developing economy in Europe, LAC, MENA, and Sub-Saharan Africa. Furthermore, fewer than 1.5% of adults in developing Asia reported using mobile phones to send money or to pay bills.
6.16
14.47
17.48
17.95
21.80
21.89
76.22
0 20 40 60 80 100
% of adults reporting barrier as a reason for not having an account
Lack of money Too expensiveToo far away Family member already has oneLack of documentation Lack of trustReligious reasons

Financial Inclusion in Asia: An Overview | 11
Potential customers also face onerous documentation barriers that restrict their eligibility to access financial services. In the Global Findex Survey, over 17% of adults without an account in developing Asia cited a lack of documentation as the reason for not having one. Banks worldwide demand identification to open a new account, but in many places banks also demand other documents such as ID cards, recommendation letters, or proof of domicile among others.
The reporting on different barriers to access in the Global Findex Survey also varied within
developing Asia and was positively correlated with income. For instance, the percentage of nonaccount holders reporting cost, physical access, and lack of documentation was the least in East Asia (11.07%, 17.11%, and 11.39%, respectively). Interestingly, a family member already having an account was cited most often in East Asia (38.03%) as the reason for not having one. Religious reasons were most heavily cited in South Asia at 10.54% of adults. B. Barriers to Access and Use of Financial Services by Firms Over the past decade, the World Bank Enterprise Surveys have greatly expanded the information available about access constraints. The surveys ask firm managers to report to what extent access to external finance constitutes an obstacle to the growth and operation of their businesses on a scale of 0 (no obstacle) to 4 (severe obstacle).
Beck, Demirgüç-Kunt, and Maksimovic (2005) used an earlier version of these data to show that financing obstacles had a significant impact on firm growth and that the smallest firms were most adversely affected. Access to finance was not the only obstacle that firms in developing economies complained about; in fact, there was a laundry list of them that affected their day-to-day operations and growth as shown in Figure 10 which reports the average value for each obstacle. However, Ayyagari, Demirgüç-Kunt, and Maksimovic (2008) showed that not all these obstacles were equally constraining and that financing obstacles were the most robust constraints on growth.
As discussed in Section II, bank finance is the largest source of external finance, yet we found
that a large percentage of firms did not have access to a bank loan or line of credit. Table 2 sheds some light on the problem by presenting the percentage of firms that reported reasons for not applying for a loan. The data suggest that while some firms are excluded from bank finance because of high interest rates, collateral requirements, cumbersome paperwork and the like, a large proportion simply have no demand for finance or good projects that require it. This ranges from 37.16% in Africa to 65.38% in LAC. Within developing Asia, 14.75% of firms reported unfavorable interest rates, 10.81% reported complex application procedures, and 8.21% cited collateral requirements as reasons for not applying for a loan.
These numbers hide a great deal of variation across economies. For instance the percentage of firms that reported stringent collateral requirements was as high as 18% in Afghanistan and Indonesia. Secured loans are the most common type of loans in the formal finance sector throughout the world. Using data from the enterprise surveys, we found 75% of firms worldwide reported that the most recent loan or line of credit required some form of collateral; this number was highest in developing Asia at 88%.

12 | ADB Economics Working Paper Series No. 449
Figure 10: Constraints Faced by Firms in Developing Asia
Source: World Bank Enterprise Surveys.
Table 2: Why Do Firms Not Apply for Loans?
Developing Asia Europe LAC MENA SSA
No need 55.36 64.77 65.38 48.32 37.16 Unfavorable interest rates 14.75 19.84 12.30 11.74 19.25 Complex application procedures 10.81 7.13 5.81 9.64 17.41 Collateral requirements 8.21 4.94 4.62 7.55 11.56 Size of loan and maturity are insufficient 3.36 1.13 1.06 3.77 2.26 Did not think it would be approved 3.22 0.40 2.42 3.04 6.05 Other 4.29 1.80 8.41 15.93 6.32
LAC = Latin America and the Caribbean, MENA = Middle East and North Africa, SSA = Sub-Saharan Africa. Source: World Bank Enterprise Surveys.
0 0.2 0.4 0.6 0.8 1 1.2 1.4 1.6
Electricity
Tax rates
Political instability
Access to finance
Corruption
Informal sector competitors
Inadequately educated workforce
Tax administration
Transportation
Access to land
Street crime
Customs and trade regulations
Business licensing and permits
Courts
Labor regulations
Business constraint

Financial Inclusion in Asia: An Overview | 13
A related issue is the type of collateral that firms have versus that which banks can accept. Alvarez de la Campa (2011) reported that in developing countries, nearly 78% of the capital stock of enterprises was in the form of movable assets such as machinery, equipment, or receivables; however, inadequate legal and regulatory environments in developing countries make banks reluctant to accept movable assets as collateral. For instance, Safavian, Fleisig, and Steinbuks (2006) argued that nearly 90% of movable property that could serve as collateral for a loan in the United States would be unacceptable to a lender in Nigeria.
There is recent evidence that policy efforts directed at introducing credit registries and
collateral registries can reduce information asymmetries between borrowers and lenders and can improve access to finance (Love and Mylenko 2005; Love, Martinez Peria, and Singh 2013). Liberti and Mian (2010) also found that not only do firms in more financially developed economies use more movable assets as collateral but also that the cost of collateral declines with improved financial development. Of the 18 developing economies that reformed their collateral registries between 2005 and 2012, six were in developing Asia (Cambodia, Georgia, India, the Federated States of Micronesia, Solomon Islands, and Vanuatu) suggesting that more can be done along these lines. C. Benchmarking the Financial System in Asia
In this section we assess the levels of financial development and inclusion in developing Asia using the benchmarking exercise developed by Beck et al. (2008) and De la Torre, Feyen, and Ize (2013). The discussion below borrows heavily from Beck and Feyen (2013).
The analyses so far have shown that there is a large variation in the range and depth of financial service provision across economies. The sources of this large variation are the existence of different types of market frictions that restrict the efficient operation of financial institutions and of markets as well as the ability of these institutions to overcome those frictions. Typical market frictions include fixed transactions costs and default risks, both systemic risk and contract or borrower-specific idiosyncratic risk (Beck and de la Torre 2007; de la Torre, Feyen, and Ize, 2013; Beck and Feyen 2013). The extent to which these market frictions can be overcome by financial institutions and markets is critically influenced by a number of characteristics of an economy that affect both the supply of financial services and the demand for financial services, including those related to the broader sociopolitical and structural environment in which the financial system operates (e.g., market size, population distribution, demographic structure, income level) and policy variables that are often directly related to the finance sector (e.g., macroeconomic fundamentals, the available technology, contractual and information frameworks underpinning the financial system, and regulatory and supervisory frameworks). Our benchmarking exercise focuses on the structural characteristics below.
We constructed a time-varying benchmark for different finance sector indicators using their
predicted values from regressions on an array of characteristics as proxies for frictions of income, size, population density, and demographic structure. Without attributing causality, this benchmark serves as a “structural depth line” as defined in Beck and Feyen (2013), which is the level of financial development predicted by structural country characteristics that are not directly related to policies and/or to the finance sector.
The specific regression estimated in the benchmarking exercise is as follows:
FDi,t = Xi,t+i,t

14 | ADB Economics Working Paper Series No. 449
where FD is the log of an indicator of financial development, X is an array of structural economy-specific factors, and the subscripts i and t relate to economies and years, respectively. The regression includes several characteristics that theory predicts will be associated with the level of financial development. First, the log of GDP per capita and its square (to account for possible nonlinearities) are proxies for general demand and supply-side constraints related to low income. Second, the log of population is a proxy for market size in line with the discussion on scale economies. Third, the log of population density is a proxy for geographic barriers and thus the ease of financial service provision. Fourth, the log of the age-dependency ratio is included to capture demographic trends and corresponding savings behavior. Finally, dummy variables for offshore centers, transition economies, and oil-exporting economies are included to control for specific circumstances as they face specific challenges and development experiences that impact their financial systems.
In Figures 11, 12, and 13 we present the gap between the actual and predicted levels of financial development in 2011 using three financial indicators: private credit to GDP (%), accounts per 100,000 adults, and percent of firms with lines of credit. Figure 11 shows that for the whole of developing Asia, the median gap is 1.62 suggesting that the predicted value of private credit to GDP (%) is 1.62 percentage points below the actual value. This is consistent with our findings in Section II that in terms of banking sector depth, the median economy in developing Asia performs better than the median elsewhere. There is, however, a lot of variation within the region. When we look at median values within each subregion, we find that the actual level of private credit to GDP (%) is 5.99 percentage points above the predicted value in Central Asia and 17.77 percentage points above the predicted value in South Asia. In the other subregions, however, specifically in Southeast Asia, the Pacific, and East Asia,8 the actual value is lower than the predicted value.
Figure 11: Gap in Private Credit/Gross Domestic Product in Developing Asia
Source: Authors’ calculations.
8 The gap is positive for the PRC and Mongolia but negative for Hong Kong, China and the Republic of Korea.
1.62
5.99
–8.04
17.77
–0.85 –0.54
–10
–5
0
5
10
15
20
DevelopingAsia
Central Asia East Asia South Asia SoutheastAsia
The Pacific
Gap
= A
ctua
l val
ue -
Pred
icte
d va
lue

Financial Inclusion in Asia: An Overview | 15
Figure 12 shows that in developing Asia, the median gap between the actual and predicted
values of accounts per 1,000 adults is –8.15 accounts; however East Asia is way ahead with a median value of 1,431.43 accounts in commercial banks per 1,000 adults. The median gap in South Asia is also positive at 269.22 accounts, but the gap is negative in Southeast Asia, the Pacific, and Central Asia suggesting that while these subregions seem to be satisfactory in terms of financial development in comparison with a benchmark sample, they particularly trail in financial inclusion.
Figure 12: Gap in Account Penetration in Developing Asia (Number of depositors per 1,000 adults)
Source: Authors’ calculations.
In Figure 13, we look at the gap in access to credit for firms. Since there is less data available per
subregion for this variable (one economy in East Asia and two in South Asia), we show data for all economies in developing Asia rather than by subregion. Figure 13 shows that when we look at access to credit, there is a large variation among firms ranging from Indonesia where the predicted share is 27 percentage points below the actual share of enterprises with a formal loan to Tajikistan where the actual level is 25 percentage points above the predicted level.
Overall, this section shows that for the region as a whole, the median economy stands where it
is predicted to do so by a cross-economy benchmarking exercise; however, there is a large variation within the region with some economies ahead and some lagging in deepening and inclusion.
–8.15
–357.82
1,431.43
269.22
–18.12 –53.80
–800
–400
0
400
800
1,200
1,600
DevelopingAsia
Central Asia East Asia South Asia SoutheastAsia
The Pacific
Gap
in a
ccou
nt p
enet
ratio
n =
Act
ual v
alue
-Pr
edic
ted
valu
e

16 | ADB Economics Working Paper Series No. 449
Figure 13: Gap in Share of Firms with Formal Credit in Developing Asia
FSM = Federated States of Micronesia, Lao PDR = Lao People’s Democratic Republic. Source: Authors’ calculations.
IV. CONCLUSION
This paper documented the state of financial development and inclusion across developing Asia. Our main findings are first that the median level of banking sector depth appears to be higher than that of the median in most other developing regions of the world though it trails the median of the high-income group. These aggregate data, however, mask an enormous variation within the region with the median economy in East Asia at the highest level of financial development followed by Southeast Asia, South Asia, the Pacific, and Central Asia.
The picture is, however, bleaker when we focus on financial inclusion. For households, we find
that account penetration is nearly universal in the Republic of Korea and Singapore whereas fewer than 5% of adults in Cambodia, the Kyrgyz Republic, Tajikistan, and Turkmenistan hold accounts in formal financial institutions. The median for the region as a whole trails that of high-income economies, LAC, and emerging Europe.
On the supply side, the region trails all the other regions except Sub-Saharan Africa (as shown
in Figure 6) in terms of the number of ATMs and commercial bank branches per 100,000 adults. The
–30 –20 –10 0 10 20 30
IndonesiaFiji
Timor-LesteLao PDR
AzerbaijanPhilippinesUzbekistan
FSMArmeniaGeorgia
MongoliaTonga
Viet NamKyrgyz Republic
KazakhstanNepal
BhutanVanuatu
SamoaTajikistan
Gap in share of firms with line of credit =Actual value - Predicted value

Financial Inclusion in Asia: An Overview | 17
percentage of firms that has a line of credit/loan from a financial institution in developing Asia is lower than that in LAC and in emerging Europe. We also find that small firms in particular are constrained in accessing formal credit from a financial institution. Overall, the data present a mixed picture of overall financial development but also severe challenges in access to and use of financial services.
Second, an analysis of the constraints to financial inclusion for households (as shown in
Figure 9) shows that lack of money, geographic access, and fixed costs associated with opening and maintaining an account are important barriers. In addition, over 17% of nonaccount holders in developing Asia cited lack of documentation as the reason for not having a formal account. For firms, the data suggest that a large percentage in developing Asia lacks access to a loan or line of credit; of these, 14.75% reported unfavorable interest rates, 10.81% reported complex application procedures, and 8.21% reported collateral requirements as reasons for not applying for a loan. Developing Asia also has the highest percentage of firms (88%) reporting that their most recent loan or line of credit required some form of collateral. This in turn suggests that collateral reform laws that ease onerous requirements may be an important policy lever to improve financial inclusion. While some firms are excluded from bank finance because of high interest rates, collateral requirements, and cumbersome paperwork, a large proportion simply have no demand for finance or good projects that require it.
The benchmarking exercise compared each economy’s actual value of financial development
and inclusion to a predicted value from a regression model that included socioeconomic and demographic characteristics such as market size, population distribution, demographic structure, and income level. For banking sector depth, we found that the median gap between the actual and predicted value was +1.62 suggesting the actual value of private credit to GDP (%) was 1.62 percentage points above the predicted value, though this gap varied between –8.05 for East Asia to +17.77 for South Asia. When we looked at indicators of financial inclusion in developing Asia, the median actual number of accounts per 1,000 adults was 8.15 accounts fewer than the predicted value; however, these numbers varied dramatically across subregions. The actual value of account penetration in the median East Asian economy was 1,431.43 accounts more than the predicted value whereas this gap was –357.82 in Central Asia.
The above findings have important policy repercussions for developing Asia. Focusing on
innovations to expand access to savings and payment services to the previously unbanked population can help low-income households to smooth income shocks and lifetime variations in income and consumption needs and to integrate into the modern market economy. Competition and a favorable regulatory framework are critical in this context.

REFERENCES Aghion, P. and P. Bolton. 1997. A Theory of Trickle-Down Growth and Development. Review of
Economics Studies. 64. (2) pp. 151–72. Alvarez de la Campa, A. 2011. Increasing Access to Credit through Reforming Secured Transactions in
the MENA Region. Policy Research Working Paper Series No. 5613. Washington, DC: World Bank.
Aportela, F. 1999. Effects of Financial Access on Savings by Low-Income People. Mexico City: Banco de
Mexico Research Department. Ashraf, N., D. Karlan, and W. Yin. 2006. Tying Odysseus to the Mast: Evidence from a Commitment
Savings Product in the Philippines. Quarterly Journal of Economics. 121 (2). pp. 673–97. ———. 2010. Female Empowerment: Further Evidence from a Commitment Savings Product in the
Philippines. World Development. 28 (3). pp. 333–44. Ayyagari, M., A. Demirgüç-Kunt, and V. Maksimovic. 2008. How Important are Financing Constraints?
The Role of Finance in the Business Environment. World Bank Economic Review. 22 (3). pp. 483–516.
———. 2011. Firm Innovation in Emerging Markets: Role of Governance and Finance. Journal of
Financial and Quantitative Analysis. 46 (6). pp. 1545–80. Banerjee, A. and A. Newman. 1993. Occupational Choice and the Process of Development. Journal of
Political Economy. 101 (2). pp. 274–98. Beck, T. and A. de la Torre. 2007. The Basic Analytics of Access to Financial Service. Financial Markets,
Institution and Instruments. 16 (2). pp. 79–117. Beck, T., A. Demirgüç-Kunt., L. Laeven, and V. Maksimovic. 2006. The Determinants of Financing
Obstacles. Journal of International Money and Finance. 25 (6). pp. 932–52. Beck, T., A. Demirgüç-Kunt, and R. Levine. 2000. A New Database on Financial Development and
Structure. The World Bank Economic Review. 14 (3). pp. 597–605. ———. 2007. Finance, Inequality, and the Poor. Journal of Economic Growth. 12 (1). pp. 27–49. Beck, T., A. Demirgüç-Kunt, R. Levine, M. Čihák, and E. Feyen. 2014. World Bank Financial
Development and Structure Dataset. http://go.worldbank.org/ X23UD9QUX0
Beck, T., A. Demirgüç-Kunt, and V. Maksimovic. 2005. Financial and Legal Constraints to Growth:
Does Firm Size Matter? Journal of Finance. 60 (1). pp. 137–77. Beck, T., A. Demirgüç-Kunt, and S. Martinez Peria. 2007. Reaching Out: Access To and Use of Banking
Services across Countries. Journal of Financial Economics. 85 (1). pp. 234–66.

20 | References
Beck, T. and E. Feyen. 2013. Benchmarking Financial Systems: Introducing the Financial Possibility Frontier. Policy Research Working Paper Series No. 6615. Washington, DC: World Bank.
Beck, T., E. Feyen, A. Ize, and F. Moizeszowicz. 2008. Benchmarking Financial Development. Policy
Research Working Paper Series No. 4638. Washington, DC: World Bank. Čihák, M., A. Demirgüç-Kunt, E. Feyen, and R. Levine. 2010. Benchmarking Financial Development
around the World. Policy Research Working Paper Series No. 6175. Washington, DC: World Bank. Collins, D., J. Morduch, S. Rutherford, and O. Ruthven. 2009. Portfolios of the Poor: How the World’s Poor
Live on $2 a Day. Princeton, NJ: Princeton University Press. de la Torre, A., E. Feyen, and A. Ize. 2013. Financial Development: Structure and Dynamics. World Bank
Economic Review. 27 (3). pp. 514–41. Demirgüç-Kunt, A. and L. Klapper. 2013. Measuring Financial Inclusion: Explaining Variation in Use of
Financial Services across and within Countries (The Global Findex Database). Brookings Papers on Economic Activity. Washington, DC: Brookings Institution.
Dupas, P. and J. Robinson. 2013. Savings Constraints and Microenterprise Development: Evidence
from a Field Experiment in Kenya. American Economic Journal: Applied Economics. 5 (1). pp. 163–92.
Galor, O. and J. Zeira. 1993. Income Distribution and Macroeconomics. Review of Economic Studies. 60
(1). pp. 35–52. Honohan, P. 2008. Cross-Country Variation in Household Access to Financial Services. Journal of
Banking and Finance. 32 (11). pp. 2493–2500. International Monetary Fund (IMF). 2011. Financial Access Survey. http://fas.imf.org/Default.aspx Kendall, J., N. Mylenko, and A. Ponce. 2010. Measuring Financial Access around the World. Policy
Research Working Paper Series No. 5253. Washington, DC: World Bank. King, R. and R. Levine. 1993. Finance and Growth: Schumpeter Might be Right. Quarterly Journal of
Economics. 108 (3). pp. 717–37. Klapper, L., L. Laeven, and R. Rajan. 2006. Entry Regulation as a Barrier to Entrepreneurship. Journal of
Financial Economics. 82 (3). pp. 591–629. Levine, R. 2005. Finance and Growth: Theory and Evidence. In P. Aghion and S.H. Durlauf, eds.
Handbook of Economic Growth Vol. 1. Elsevier: Amsterdam. Liberti, J. M. and A. R. Mian. 2010. Collateral Spread and Financial Development. Journal of Finance. 65
(1). pp. 147–77. Love, I., S. Martinez Peria, and S. Singh. 2013. Collateral Registries for Movable Assets: Does Their
Introduction Spur Firms’ Access to Bank Finance? Policy Research Working Paper Series No. 6477. Washington, DC: World Bank.

References | 21
Love, I. and N. Mylenko. 2005. Credit Reporting and Financing Constraints. Credit Technology 50.
pp. 7–33. Safavian, M., H. Fleisig, and J. Steinbuks. 2006. Unlocking Dead Capital: How Reforming Collateral
Laws Improves Access to Finance. Public Policy for the Private Sector Note No. 307. Washington, DC: World Bank.
World Bank. World Enterprise Surveys 2006–2014. http://www.enterprisesurveys.org

ASIAN DEVELOPMENT BANK
AsiAn Development BAnk6 ADB Avenue, Mandaluyong City1550 Metro Manila, Philippineswww.adb.org
Financial Inclusion in Asia: An Overview
This paper provides an analysis of financial development and inclusion in developing Asia using data from a wide array of sources. In terms of aggregate measures of financial development, the region as a whole has superior banking sector depth compared to other developing regions; however, this masks a great deal of variation across Asian economies. On financial inclusion, the most commonly reported barriers are cost, geographic access, and lack of identification.
About the Asian Development Bank
ADB’s vision is an Asia and Pacific region free of poverty. Its mission is to help its developing member countries reduce poverty and improve the quality of life of their people. Despite the region’s many successes, it remains home to the majority of the world’s poor. ADB is committed to reducing poverty through inclusive economic growth, environmentally sustainable growth, and regional integration.
Based in Manila, ADB is owned by 67 members, including 48 from the region. Its main instruments for helping its developing member countries are policy dialogue, loans, equity investments, guarantees, grants, and technical assistance.
FInAncIAl InclusIOn In AsIA: An OvervIewMeghana Ayyagari and Thorsten Beck
adb economicsworking paper series
nO. 449
september 2015