memo 090616 kks - university of wisconsin system · urban stormwater pollution analysis university...
TRANSCRIPT
AECOM 200 Indiana Avenue, Stevens Point, Wisconsin 54481 T 715.341.8110 F 715.341.7390 www.earthtech.aecom.com
Background/Scope of Work The analysis described in this memorandum was conducted in partial fulfillment of the University of Wisconsin-Stevens Point (UWSP) Campus Municipal Separate Storm Sewer System (MS4) General Permit. This report documents the stormwater pollution analysis conducted for the area of the UWSP campus regulated under the MS4 permit. The permit requires an estimate of the annual stormwater pollution loadings (sediment and phosphorus) for all storm sewer outfalls that meet the regulatory definition of an “MS4”. This pollution loading analysis establishes the base pollution load and the pollution reduction resulting from the existing stormwater best management practices (BMPs) on the campus. The analysis used the Windows™ version of an urban pollution loading model “Source Loading and Management Model” (WinSLAMM) to model annual pollution loadings under the following two scenarios: 1. Base Conditions: October 1, 2004, land use conditions with no BMPs applied.
2. Existing Conditions: October 1, 2004, land use conditions with the BMPs as of
January 2009 applied. The existing BMPs are described later in this memorandum. If under scenario 2, the existing BMPs were not sufficient to meet the required 20 percent and 40 percent Total Suspended Solids (TSS) reduction requirements, additional BMPs would be evaluated to achieve this goal.
Memorandum
Date: June 16, 2009 To: Carl Rasmussen, UW Stevens Point Don Popoff, P.E., Director of Public Works, City of Stevens Point From: Kurt Schoen, P.E., P.H. Joe Hanson, EIT Subject:: University of Wisconsin – Stevens Point: Urban Stormwater
Pollution Loading Analysis Stevens Point, Wisconsin AECOM Project No. 105408

Urban Stormwater Pollution Analysis University of Wisconsin – Stevens Point Page 2
L:\work\Projects\105408\wp\m1\memo_090616_kks.doc
Summary of Methods for Pollution Loading Model – Base and Existing Conditions This section summarizes the analysis conducted for UWSP to determine the base conditions pollution load and the amount of pollution load reduction currently being achieved by UWSP’s existing BMPs. The pollution loads are established using the policies and procedures set forth by the Wisconsin Department of Natural Resources (WDNR) to analyze pollution loading in developed urban areas were followed throughout the process. These policies can be found at the WDNR website: http://www.dnr.state.wi.us/runoff/stormwater/muni.htm. Pollution Loading Model Input Information A GIS database was created characterizing the UWSP campus in terms of urban stormwater pollution generation. Information in the database includes: 1. Subbasin delineations (delineations by campus staff) 2. Hydrologic soil groups (USDA NRCS soil data) 3. Land use conditions as of October 2004 4. Biofilter locations (provided by campus staff) 5. Connected or disconnected impervious surfaces (based on storm sewer mapping) Note: Campus staff delineated drainage basins captured by the university storm sewers, primarily directly connected impervious roofs and parking lots. All campus areas not draining into storm sewers were grouped into several subbasins by AECOM. This process was reviewed with Brad Johnson, WDNR West Central Region Stormwater Specialist. Area of Analysis All of the lands within the campus boundary of UWSP as of October 1, 2004, were analyzed with the exceptions as described below. The following list summarizes the lands excluded from the analysis in accordance with WDNR policies: 1. Undeveloped land greater than 5 acres (the entire Schmeeckle Reserve). 2. City of Stevens Point owned right-of-way for all streets intersecting and surrounding the campus
lands. Stormwater Model Description WinSLAMM version 9.3.1 was used to conduct the analysis. The following supporting parameters files were used: 1. WisReg – Madison Five year Rainfall.ran WI_GEO01.ppd 2. WI_SL06 Dec06.rsv 3. WI_AVG01.psc 4. WI_DLV01.prr 5. WI_Res and Other Urban Dec06.std 6. WI_Com Inst Indust Dec06.std WinSLAMM data files were created specifically to represent each source area present on the campus. Source areas in WinSLAMM consist of rooftop, parking, driveway, sidewalk, and
Urban Stormwater Pollution Analysis University of Wisconsin – Stevens Point Page 3
L:\work\Projects\105408\wp\m1\memo_090616_kks.doc
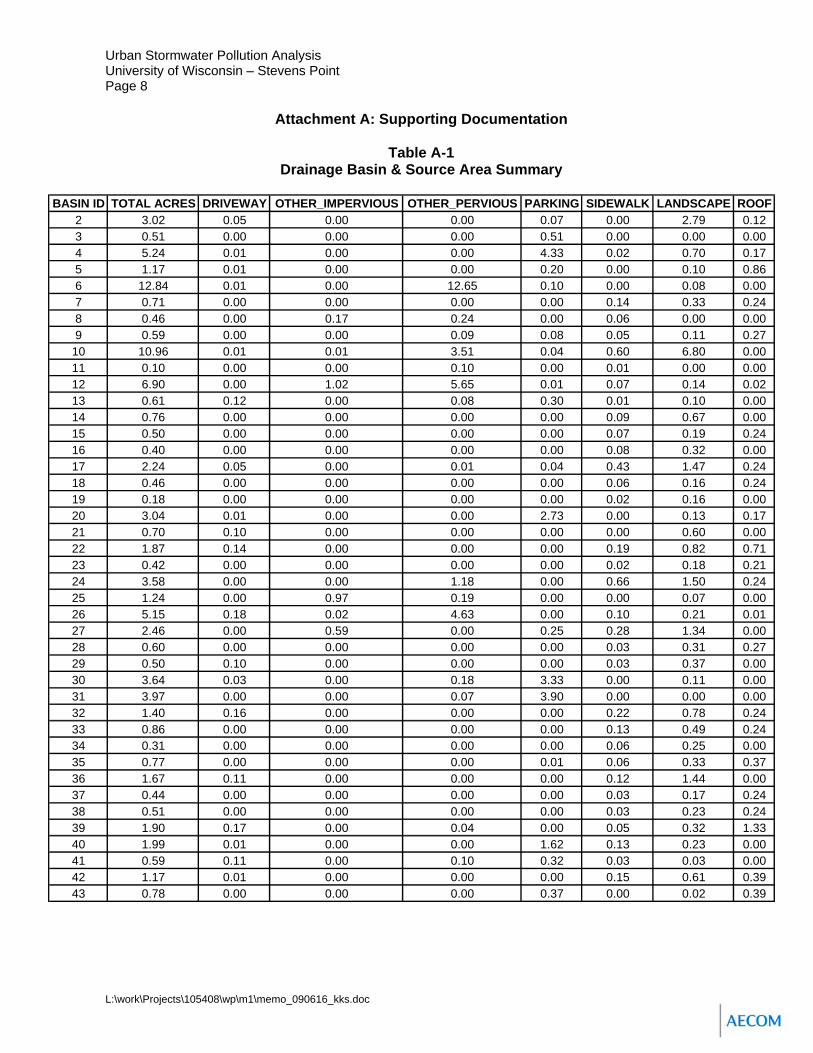
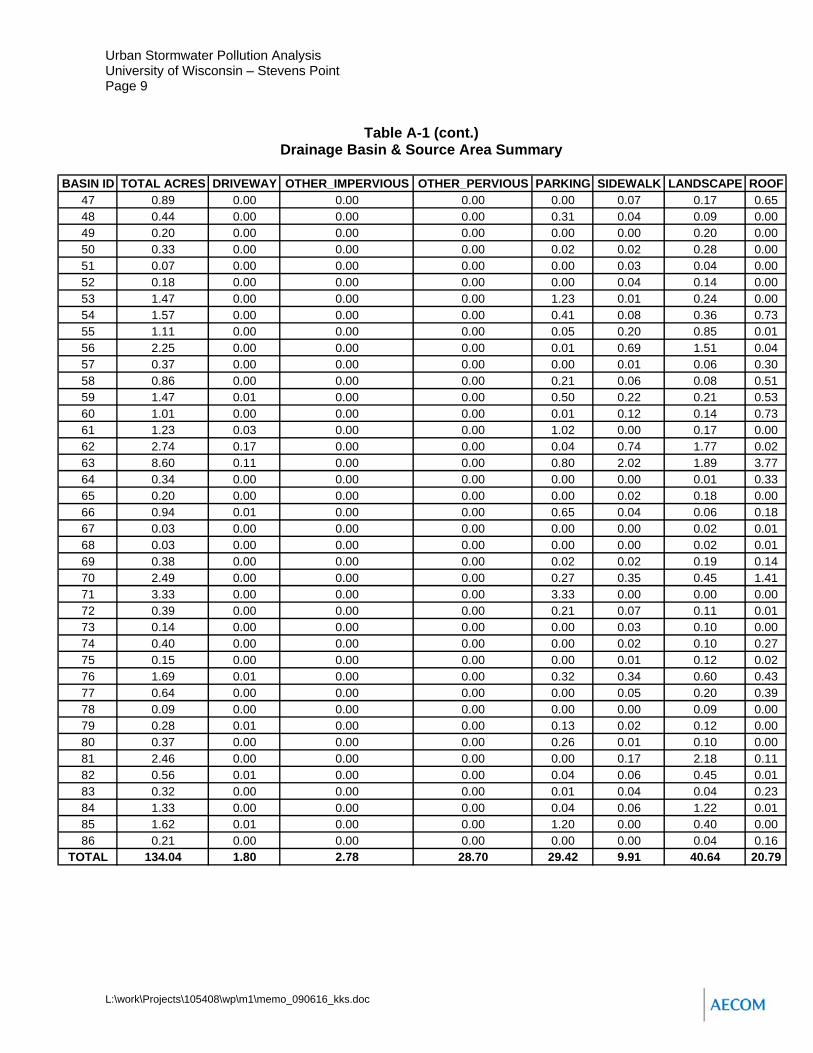
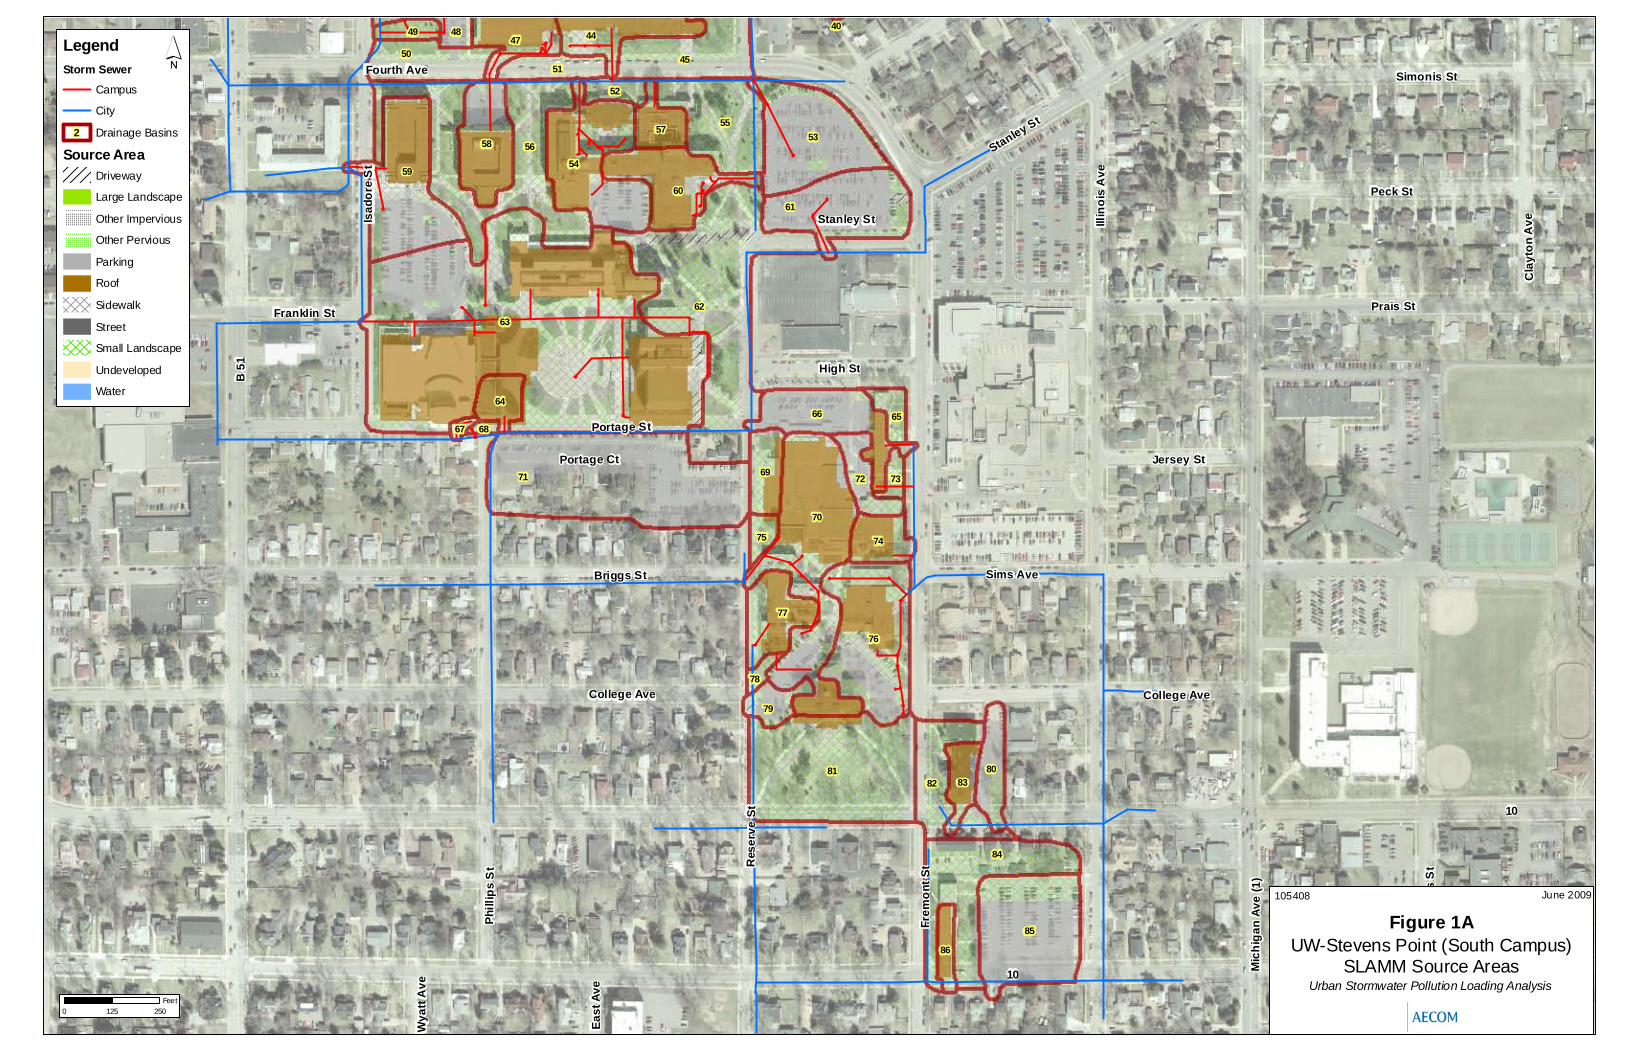
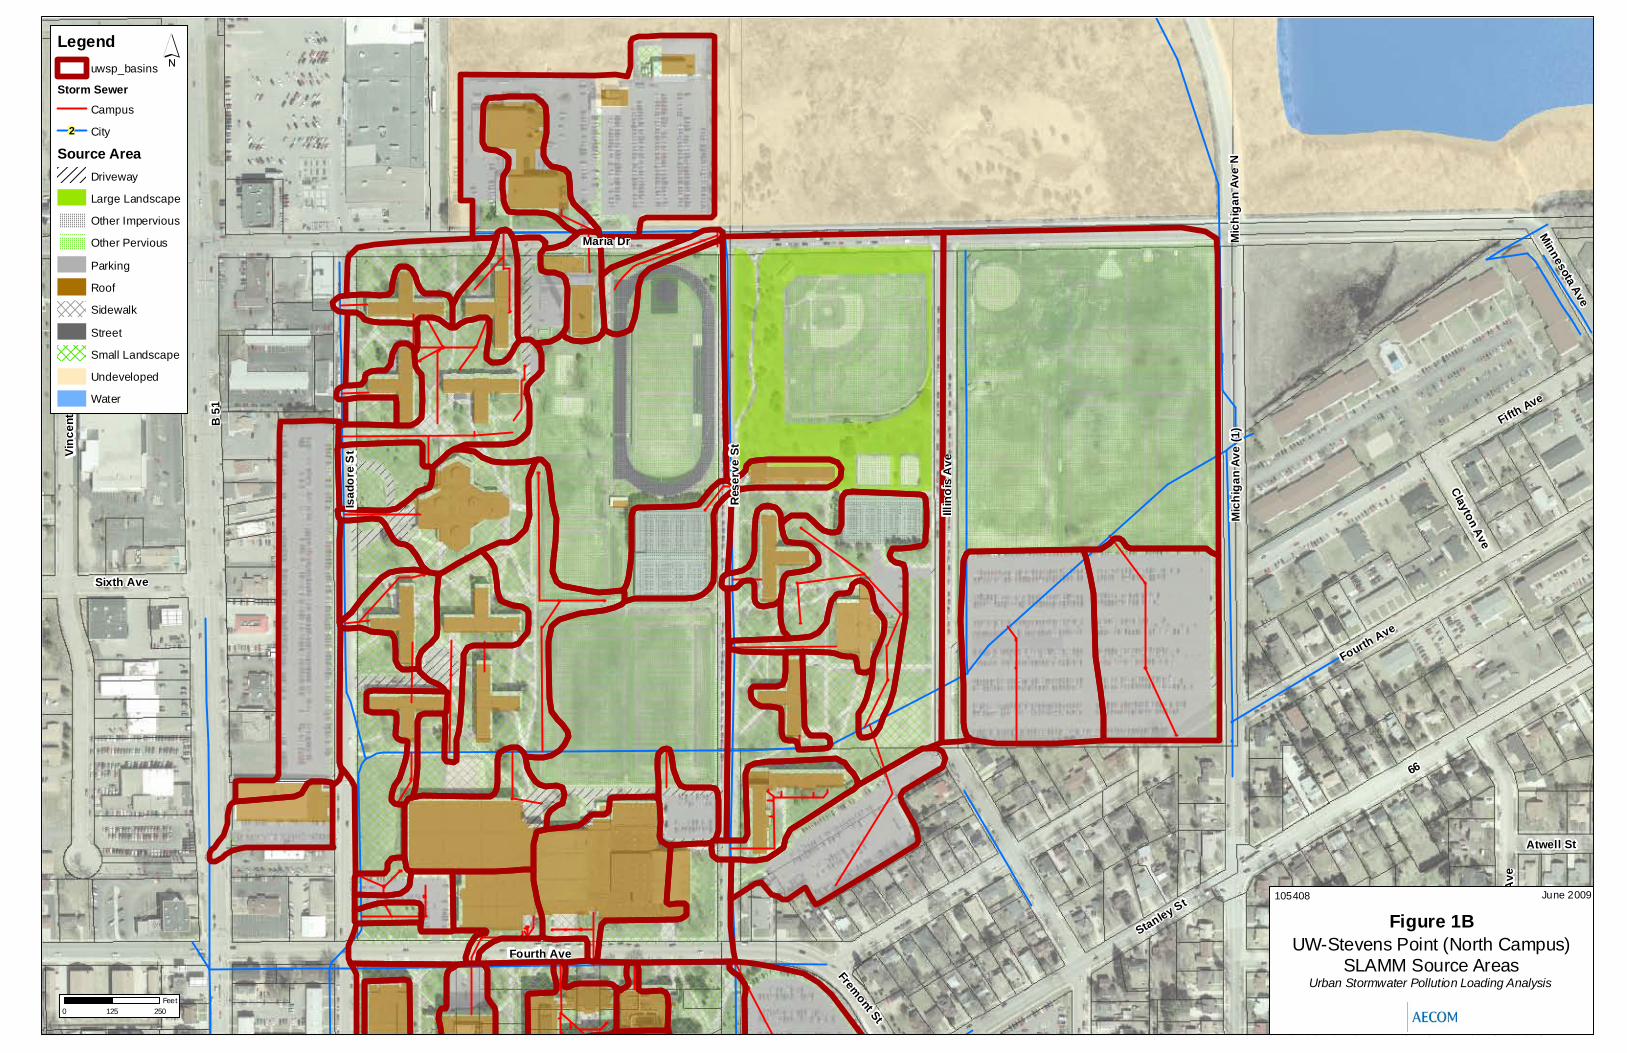
landscaped areas. The different source areas and their coverage on the campus are shown on Figure 1 following this memorandum. The source areas present on the UWSP campus are summarized by drainage basin in Table A-1. Existing Stormwater BMPs UWSP currently has two types of existing BMPs in place. These practices are: 1. Biofilters 2. Disconnected impervious source areas The existing BMPs are described below.
1. Biofilters: Biofilters are specially constructed landscaped depressions in the ground
surface. During rain events, stormwater enters the biofilter and soaks into an area with a mixture of sand, compost and top soil before being allowed to either infiltrate into the ground or exit through one or more under drain pipes. Biofilters also feature landscaping of various plant species which contribute with aesthetic value and enhance the infiltration rate of the soil.
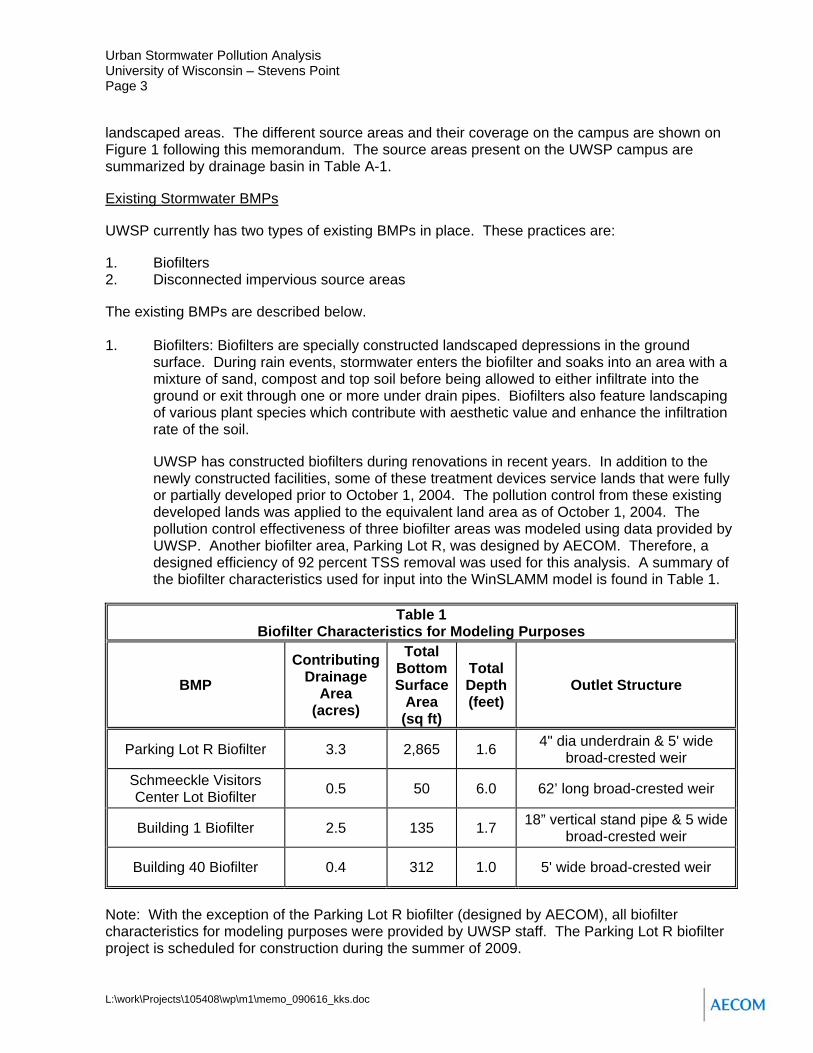
UWSP has constructed biofilters during renovations in recent years. In addition to the newly constructed facilities, some of these treatment devices service lands that were fully or partially developed prior to October 1, 2004. The pollution control from these existing developed lands was applied to the equivalent land area as of October 1, 2004. The pollution control effectiveness of three biofilter areas was modeled using data provided by UWSP. Another biofilter area, Parking Lot R, was designed by AECOM. Therefore, a designed efficiency of 92 percent TSS removal was used for this analysis. A summary of the biofilter characteristics used for input into the WinSLAMM model is found in Table 1.
Table 1
Biofilter Characteristics for Modeling Purposes
BMP Contributing
Drainage Area
(acres)
Total Bottom Surface
Area (sq ft)
Total Depth (feet)
Outlet Structure
Parking Lot R Biofilter 3.3 2,865 1.6 4" dia underdrain & 5' wide broad-crested weir
Schmeeckle Visitors Center Lot Biofilter 0.5 50 6.0 62’ long broad-crested weir
Building 1 Biofilter 2.5 135 1.7 18” vertical stand pipe & 5 wide broad-crested weir
Building 40 Biofilter 0.4 312 1.0 5' wide broad-crested weir
Note: With the exception of the Parking Lot R biofilter (designed by AECOM), all biofilter characteristics for modeling purposes were provided by UWSP staff. The Parking Lot R biofilter project is scheduled for construction during the summer of 2009.

Urban Stormwater Pollution Analysis University of Wisconsin – Stevens Point Page 4
L:\work\Projects\105408\wp\m1\memo_090616_kks.doc
2. Disconnection: This refers to impervious surfaces, such as rooftops or parking lots, which
drain directly onto pervious (vegetated) surfaces and allow for some stormwater infiltration before runoff enters the conveyance system. Directly connected source areas are those impervious surfaces that drain into a stormwater conveyance system without passing over pervious surfaces.
In accordance with WDNR policies, the analyzed base condition used a fixed connection factor for impervious source areas. Upon investigation of the UWSP campus and based on feedback from campus staff, it was estimated that certain drainage basins on the campus had a higher degree of “disconnection” than the fixed base condition. Thus the higher disconnection factor was taken into account when modeling the campus under the existing managed condition.
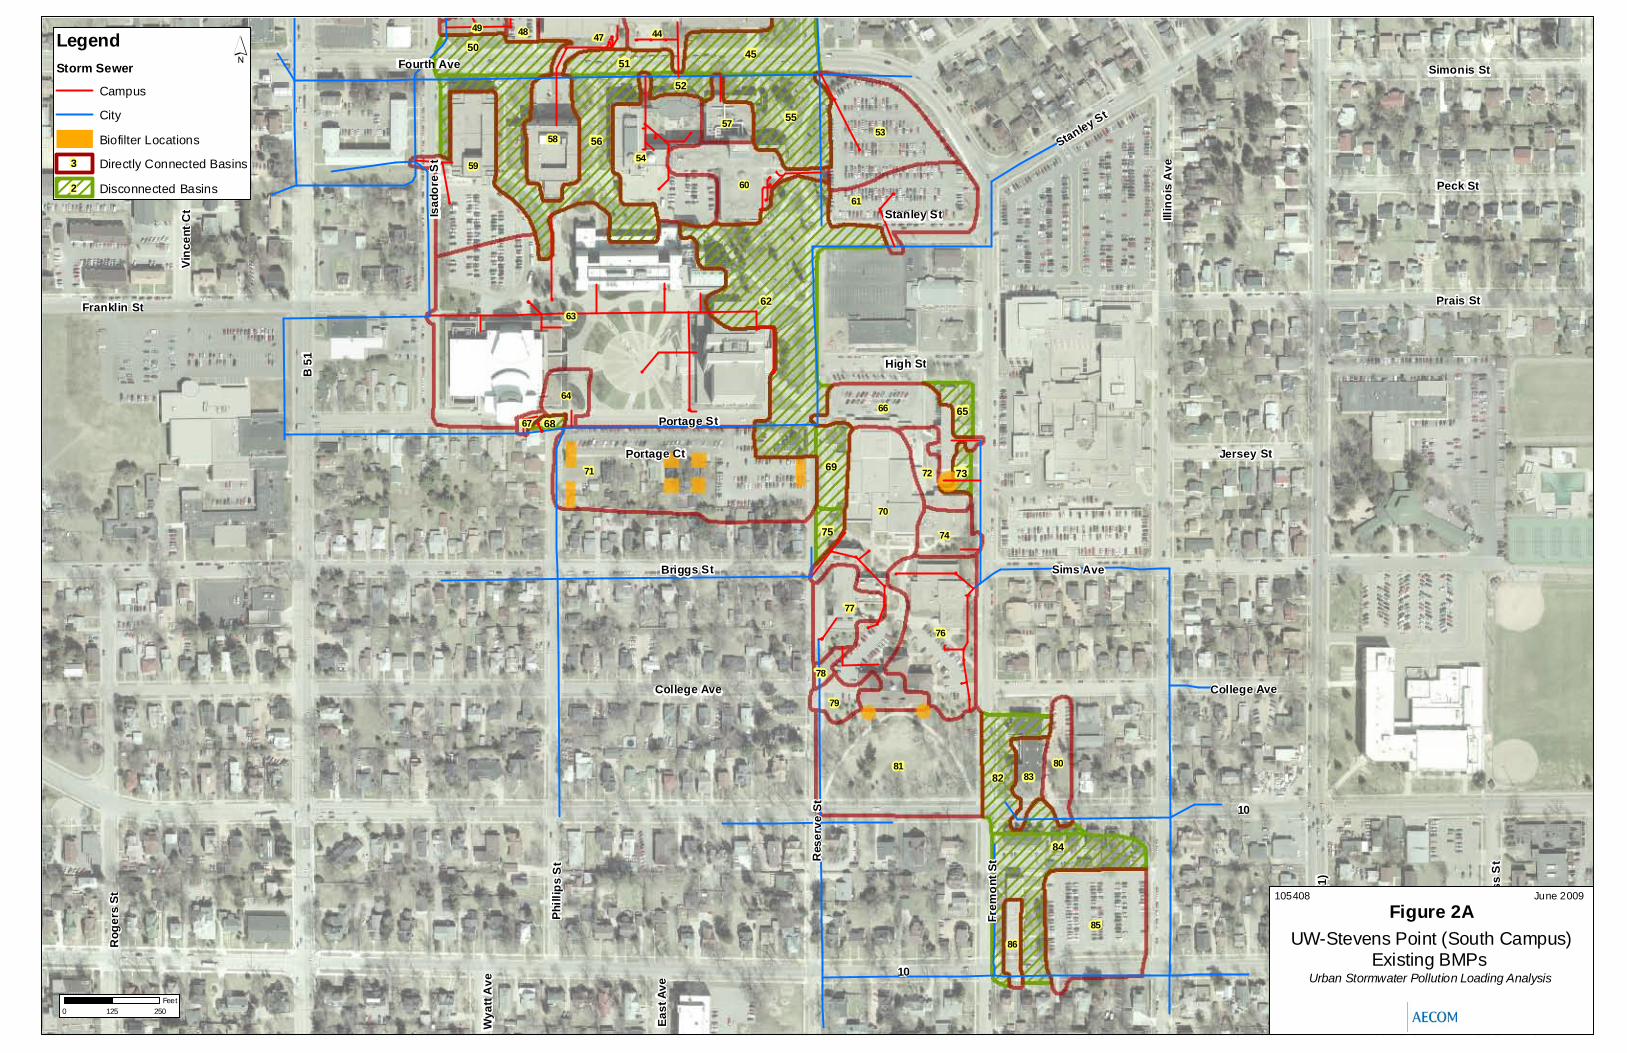
The BMPs on campus were modeled for the TSS reduction capabilities. The approximate locations of the existing BMPs are shown on Figure 2. The BMPs were modeled to determine the pollution reduction of the load generated by contributing drainage areas under the October 1, 2004, land use conditions.
Table 2 BMP Descriptions and Drainage Area Characteristics
BMP Drainage
Area
Total BMP Drainage
Area
BMP Surface
Area Treatment EfficiencyLocation BMP
Type Site
Description Subbasin
Name (acres) (acres) (sq. ft.) (%)
Portage St. & Phillips St. Biofilter Parking Lot R 71 3.33 3.33 2,865 92
North Point Dr. Biofilter Schmeekle
Visitors Center Lot
3 0.51 0.51 50 95
College Ave. Biofilter Building 1 81 2.46 2.46 135 79
Briggs St. Biofilter Building 40 72 0.39 0.39 312 88 Results - Base and Existing Conditions The results of the WinSLAMM modeling analysis are shown in Table 3. This table shows the annual TSS and Total Phosphorus (TP) loadings under the base and existing conditions (see definitions on page one of this memo).

Urban Stormwater Pollution Analysis University of Wisconsin – Stevens Point Page 5
L:\work\Projects\105408\wp\m1\memo_090616_kks.doc
Table 3 Annual Base and Existing Conditions Pollution Loads
BMP Reduction
Scenario TSS Load
(tons/yr)Individual(tons/yr)
Individual(%)
Cumulative(%)
TP Load (lbs/yr)
Base Conditions 17.0 0.0 0.0 0.0 107 Adding disconnection 16.0 1.0 5.8 5.8 99 Counting existing biofiltration 15.8 0.2 0.5 6.3 98
Sum of Existing Conditions 15.8 1.2 ---- 6.3 98 Adding Parking Lot R biofiltration 14.8 1.0 6.6 12.9 94
Expected Conditions, Fall 2009 14.8 2.2 ---- 12.9 94
The campus annual base conditions TSS load is 17.0 tons per year. After accounting for the TSS control from the existing BMPs analyzed, the existing conditions TSS load is 15.8 tons per year, which represents a TSS reduction of 6.3 percent. The Parking Lot R biofilters have been designed and approved; construction is planned for the summer of 2009. With the operation of these new biofilters, the campus expected conditions TSS load will be 14.8 tons per year, which represents a TSS reduction of 12.9 percent. Two figures showing information relevant to the modeling effort can be found at the end of this memo: 1. Figure 1: UWSP campus WinSLAMM Source Area Map: These maps divide the campus
into three areas and show the source areas for each drainage system within the modeled campus area that was used in the WinSLAMM input (data) files.
2. Figure 2: Existing Best Management Practices: These maps divide the campus into three
areas and show the approximate locations of the existing BMPs and the current campus parcel boundaries.
Proposed Management Since the existing BMPs do not achieve the 20 percent or 40 percent TSS control required under the MS4 permit, additional stormwater BMPs were investigated. The campus needs to reduce its TSS loading by an additional 2.2 tons per year to achieve a 20 percent reduction and 5.8 tons per year to achieve a 40 percent reduction. Load per Source Area The first step in determining the location and size of the proposed BMPs is to conduct an analysis that characterizes the project area based on relative pollution load generation. BMPs that are applied to areas with a relatively large pollution load are generally more cost effective. The no-controls condition pollution loading for each impervious source area identified on the UWSP campus was calculated. The cumulative load for each impervious source area is listed in

Urban Stormwater Pollution Analysis University of Wisconsin – Stevens Point Page 6
L:\work\Projects\105408\wp\m1\memo_090616_kks.doc
Table 4. Note: There are other pervious source areas not shown on Table 4 which account for the base loading difference between 17.0 and 14.6 tons/yr.
Table 4 Sediment (TSS) Loading by Source Area
Source Area Area (acres)
TSS Load (tons / yr)
Roof 20.8 1.9 Parking Lot 29.4 9.9 Driveway 1.8 0.7 Sidewalk 9.9 2.0
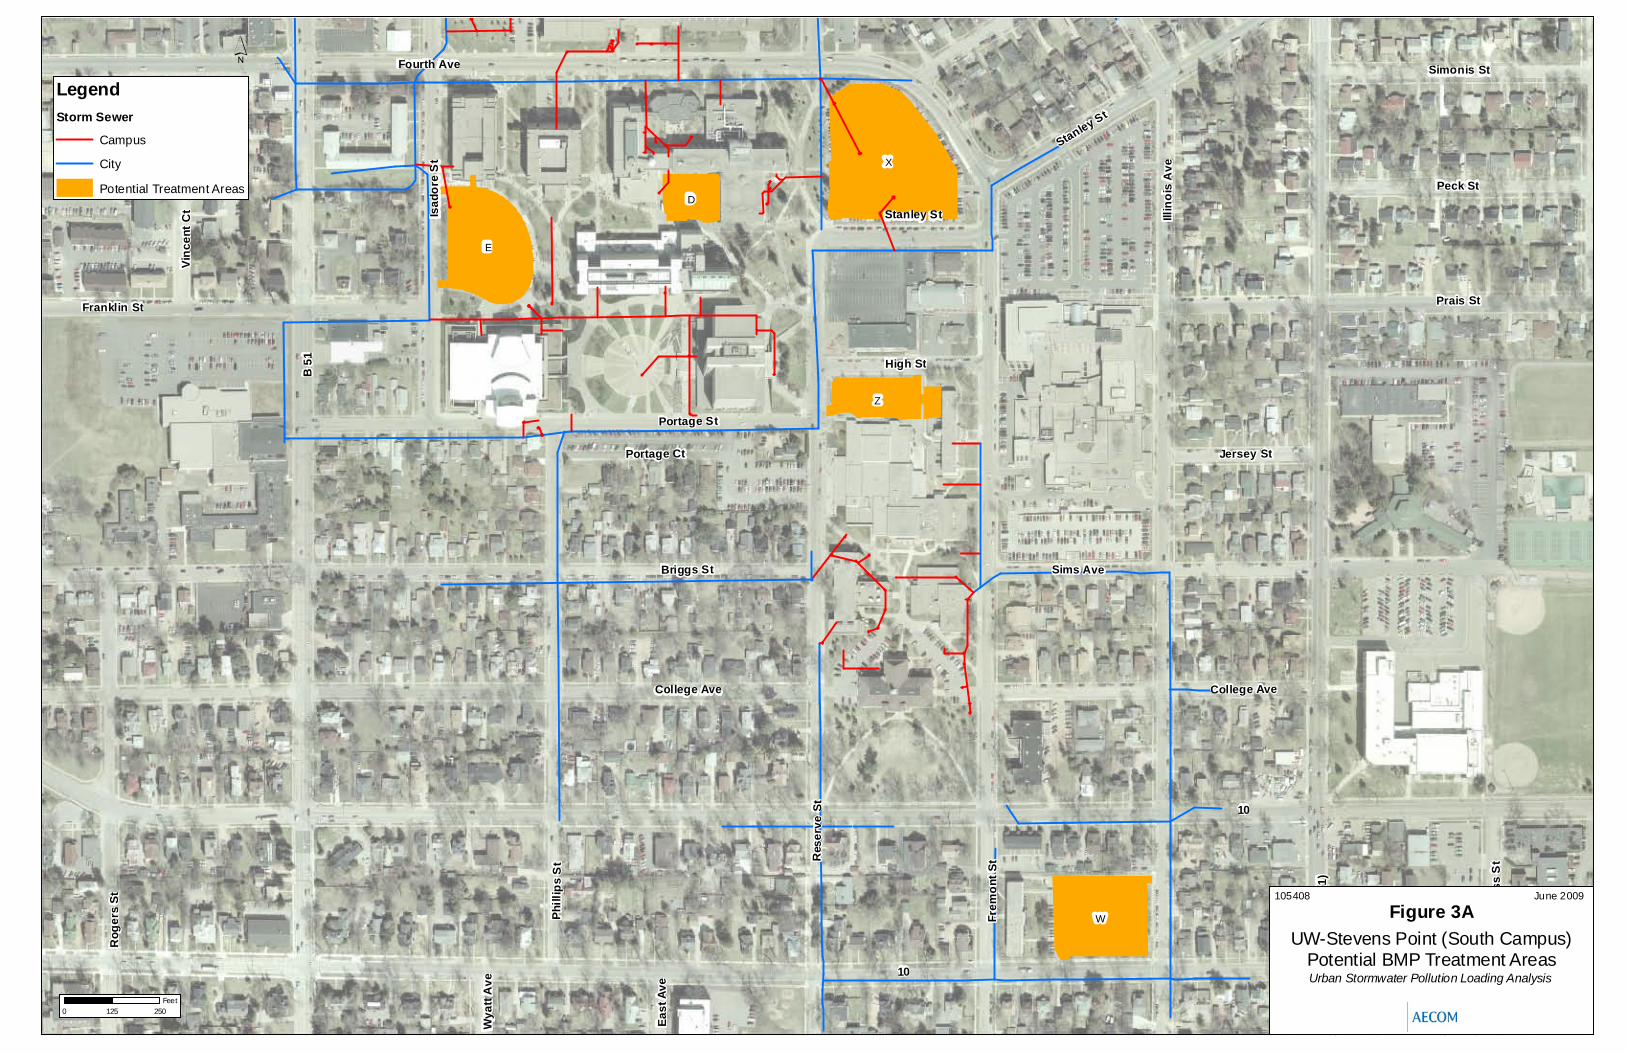
As shown in the table, parking lots account for the highest sediment loading for impervious surfaces on campus. Sidewalks account for the next highest sediment loading on campus. Even if 100 percent of the sediment from rooftops and sidewalks were treated, the 40 percent reduction goal (reduce the sediment load by an additional 5.8 tons/yr) could not be achieved. Therefore, the conceptual application of new best management practices would be best used in treatment of the parking lot runoff. Because the parking lots are scattered throughout the campus, a centralized treatment approach (wet detention ponds) was deemed to be not feasible. UWSP has previously added biofilters to existing parking lots during reconstruction projects. It is recommended that the campus continue this practice until the 40 percent TSS reduction goal has been met. Table 5 shows the pollution control results that these proposed biofilters would yield when applied to certain parking lots. The table includes a list of some of the existing parking lots that have not yet been reconstructed to feature biofilter treatment devices.
Table 5: Proposed Best Management Practices: Pollution Control
R 3.33 Biofilter 1.20 1.00 1.00 13%Q 7.18 Biofilter 2.44 2.20 3.20 25%P 2.91 Biofilter 0.99 0.89 4.09 30%X 2.47 Biofilter 0.84 0.76 4.84 35%J 2.31 Biofilter 0.79 0.71 5.55 39%T 1.53 Biofilter 0.52 0.47 6.02 42%W 1.22 Biofilter 0.41 0.37 6.39 44%E 0.96 Biofilter 0.33 0.29 6.69 46%H 0.67 Biofilter 0.23 0.21 6.89 47%Z 0.64 Biofilter 0.22 0.20 7.09 48%D 0.58 Biofilter 0.20 0.18 7.26 49%
Total: 23.80 8.16 7.26 7.26
TSS Control (tons/yr)
Cumulative Percent TSS Control (%)
Area (acres)
Parking Lot ID
Proposed Treatment
TSS Base Load (tons/yr)
Cumulative TSS Control (tons/yr)
As shown in Table 5, the proposed biofilter treatment of the parking lots listed would provide an additional 7.26 tons of TSS control per year, which exceeds the 40 percent goal of 5.8 tons. The first parking lot listed in Table 5 is Parking Lot R which is scheduled for reconstruction in the

Urban Stormwater Pollution Analysis University of Wisconsin – Stevens Point Page 7
L:\work\Projects\105408\wp\m1\memo_090616_kks.doc
summer of 2009. The table shows the treatment of parking lot areas beyond the 40 percent goal so that UWSP can choose an appropriate combination of parking lots to reconstruct. Conclusions
As stated in the UWSP MS4 Permit, the campus must provide:
“2.7.1 To the maximum extent practicable, implementation of storm water management practices necessary to achieve a 20% reduction in the annual average mass of total suspended solids discharging from the MS4 to surface waters of the state as compared to implementing no storm water management controls, by March 10, 2008. The permittee may elect to meet the 20% total suspended solids standard on a watershed or regional basis by working with other permittee(s) to provide regional treatment that collectively meets the standard. Note: Pursuant to s. NR 151.13(2), Wis. Adm. Code, the total suspended solids reduction requirement increases to 40% by March 10, 2013.”
The stormwater pollution modeling evaluation conducted for the UWSP followed the guidelines provided by the WDNR for compliance with the MS4 Permit. As a result of this evaluation the following conclusions are made: 1. After accounting for all of the existing BMPs, UWSP is currently reducing its pollution load
by about 1.2 tons of TSS per year (a 6.3% reduction). Therefore, the campus has not met the TSS reduction requirements of their MS4 Permit for the 2008 goal (20 percent). The 2013 goal (40 percent) also has not been met.
2. Since both the 20 and 40 percent TSS removal goals have not been met, additional best management practices are necessary for UWSP to gain MS4 compliance. Proposed BMPs include new biofilter design and construction to treat approximately 15 acres of existing parking lots.
3. The UWSP should review these results with the WDNR to finalize their MS4 permit compliance for the TSS reduction requirements.
Urban Stormwater Pollution Analysis University of Wisconsin – Stevens Point Page 8
L:\work\Projects\105408\wp\m1\memo_090616_kks.doc
Attachment A: Supporting Documentation
Table A-1 Drainage Basin & Source Area Summary
BASIN ID TOTAL ACRES DRIVEWAY OTHER_IMPERVIOUS OTHER_PERVIOUS PARKING SIDEWALK LANDSCAPE ROOF
2 3.02 0.05 0.00 0.00 0.07 0.00 2.79 0.123 0.51 0.00 0.00 0.00 0.51 0.00 0.00 0.004 5.24 0.01 0.00 0.00 4.33 0.02 0.70 0.175 1.17 0.01 0.00 0.00 0.20 0.00 0.10 0.866 12.84 0.01 0.00 12.65 0.10 0.00 0.08 0.007 0.71 0.00 0.00 0.00 0.00 0.14 0.33 0.248 0.46 0.00 0.17 0.24 0.00 0.06 0.00 0.009 0.59 0.00 0.00 0.09 0.08 0.05 0.11 0.27
10 10.96 0.01 0.01 3.51 0.04 0.60 6.80 0.0011 0.10 0.00 0.00 0.10 0.00 0.01 0.00 0.0012 6.90 0.00 1.02 5.65 0.01 0.07 0.14 0.0213 0.61 0.12 0.00 0.08 0.30 0.01 0.10 0.0014 0.76 0.00 0.00 0.00 0.00 0.09 0.67 0.0015 0.50 0.00 0.00 0.00 0.00 0.07 0.19 0.2416 0.40 0.00 0.00 0.00 0.00 0.08 0.32 0.0017 2.24 0.05 0.00 0.01 0.04 0.43 1.47 0.2418 0.46 0.00 0.00 0.00 0.00 0.06 0.16 0.2419 0.18 0.00 0.00 0.00 0.00 0.02 0.16 0.0020 3.04 0.01 0.00 0.00 2.73 0.00 0.13 0.1721 0.70 0.10 0.00 0.00 0.00 0.00 0.60 0.0022 1.87 0.14 0.00 0.00 0.00 0.19 0.82 0.7123 0.42 0.00 0.00 0.00 0.00 0.02 0.18 0.2124 3.58 0.00 0.00 1.18 0.00 0.66 1.50 0.2425 1.24 0.00 0.97 0.19 0.00 0.00 0.07 0.0026 5.15 0.18 0.02 4.63 0.00 0.10 0.21 0.0127 2.46 0.00 0.59 0.00 0.25 0.28 1.34 0.0028 0.60 0.00 0.00 0.00 0.00 0.03 0.31 0.2729 0.50 0.10 0.00 0.00 0.00 0.03 0.37 0.0030 3.64 0.03 0.00 0.18 3.33 0.00 0.11 0.0031 3.97 0.00 0.00 0.07 3.90 0.00 0.00 0.0032 1.40 0.16 0.00 0.00 0.00 0.22 0.78 0.2433 0.86 0.00 0.00 0.00 0.00 0.13 0.49 0.2434 0.31 0.00 0.00 0.00 0.00 0.06 0.25 0.0035 0.77 0.00 0.00 0.00 0.01 0.06 0.33 0.3736 1.67 0.11 0.00 0.00 0.00 0.12 1.44 0.0037 0.44 0.00 0.00 0.00 0.00 0.03 0.17 0.2438 0.51 0.00 0.00 0.00 0.00 0.03 0.23 0.2439 1.90 0.17 0.00 0.04 0.00 0.05 0.32 1.3340 1.99 0.01 0.00 0.00 1.62 0.13 0.23 0.0041 0.59 0.11 0.00 0.10 0.32 0.03 0.03 0.0042 1.17 0.01 0.00 0.00 0.00 0.15 0.61 0.3943 0.78 0.00 0.00 0.00 0.37 0.00 0.02 0.39
Urban Stormwater Pollution Analysis University of Wisconsin – Stevens Point Page 9
L:\work\Projects\105408\wp\m1\memo_090616_kks.doc
Table A-1 (cont.) Drainage Basin & Source Area Summary
BASIN ID TOTAL ACRES DRIVEWAY OTHER_IMPERVIOUS OTHER_PERVIOUS PARKING SIDEWALK LANDSCAPE ROOF
47 0.89 0.00 0.00 0.00 0.00 0.07 0.17 0.6548 0.44 0.00 0.00 0.00 0.31 0.04 0.09 0.0049 0.20 0.00 0.00 0.00 0.00 0.00 0.20 0.0050 0.33 0.00 0.00 0.00 0.02 0.02 0.28 0.0051 0.07 0.00 0.00 0.00 0.00 0.03 0.04 0.0052 0.18 0.00 0.00 0.00 0.00 0.04 0.14 0.0053 1.47 0.00 0.00 0.00 1.23 0.01 0.24 0.0054 1.57 0.00 0.00 0.00 0.41 0.08 0.36 0.7355 1.11 0.00 0.00 0.00 0.05 0.20 0.85 0.0156 2.25 0.00 0.00 0.00 0.01 0.69 1.51 0.0457 0.37 0.00 0.00 0.00 0.00 0.01 0.06 0.3058 0.86 0.00 0.00 0.00 0.21 0.06 0.08 0.5159 1.47 0.01 0.00 0.00 0.50 0.22 0.21 0.5360 1.01 0.00 0.00 0.00 0.01 0.12 0.14 0.7361 1.23 0.03 0.00 0.00 1.02 0.00 0.17 0.0062 2.74 0.17 0.00 0.00 0.04 0.74 1.77 0.0263 8.60 0.11 0.00 0.00 0.80 2.02 1.89 3.7764 0.34 0.00 0.00 0.00 0.00 0.00 0.01 0.3365 0.20 0.00 0.00 0.00 0.00 0.02 0.18 0.0066 0.94 0.01 0.00 0.00 0.65 0.04 0.06 0.1867 0.03 0.00 0.00 0.00 0.00 0.00 0.02 0.0168 0.03 0.00 0.00 0.00 0.00 0.00 0.02 0.0169 0.38 0.00 0.00 0.00 0.02 0.02 0.19 0.1470 2.49 0.00 0.00 0.00 0.27 0.35 0.45 1.4171 3.33 0.00 0.00 0.00 3.33 0.00 0.00 0.0072 0.39 0.00 0.00 0.00 0.21 0.07 0.11 0.0173 0.14 0.00 0.00 0.00 0.00 0.03 0.10 0.0074 0.40 0.00 0.00 0.00 0.00 0.02 0.10 0.2775 0.15 0.00 0.00 0.00 0.00 0.01 0.12 0.0276 1.69 0.01 0.00 0.00 0.32 0.34 0.60 0.4377 0.64 0.00 0.00 0.00 0.00 0.05 0.20 0.3978 0.09 0.00 0.00 0.00 0.00 0.00 0.09 0.0079 0.28 0.01 0.00 0.00 0.13 0.02 0.12 0.0080 0.37 0.00 0.00 0.00 0.26 0.01 0.10 0.0081 2.46 0.00 0.00 0.00 0.00 0.17 2.18 0.1182 0.56 0.01 0.00 0.00 0.04 0.06 0.45 0.0183 0.32 0.00 0.00 0.00 0.01 0.04 0.04 0.2384 1.33 0.00 0.00 0.00 0.04 0.06 1.22 0.0185 1.62 0.01 0.00 0.00 1.20 0.00 0.40 0.0086 0.21 0.00 0.00 0.00 0.00 0.00 0.04 0.16
TOTAL 134.04 1.80 2.78 28.70 29.42 9.91 40.64 20.79
Urban Stormwater Pollution Analysis University of Wisconsin – Stevens Point Page 10
L:\work\Projects\105408\wp\m1\memo_090616_kks.doc
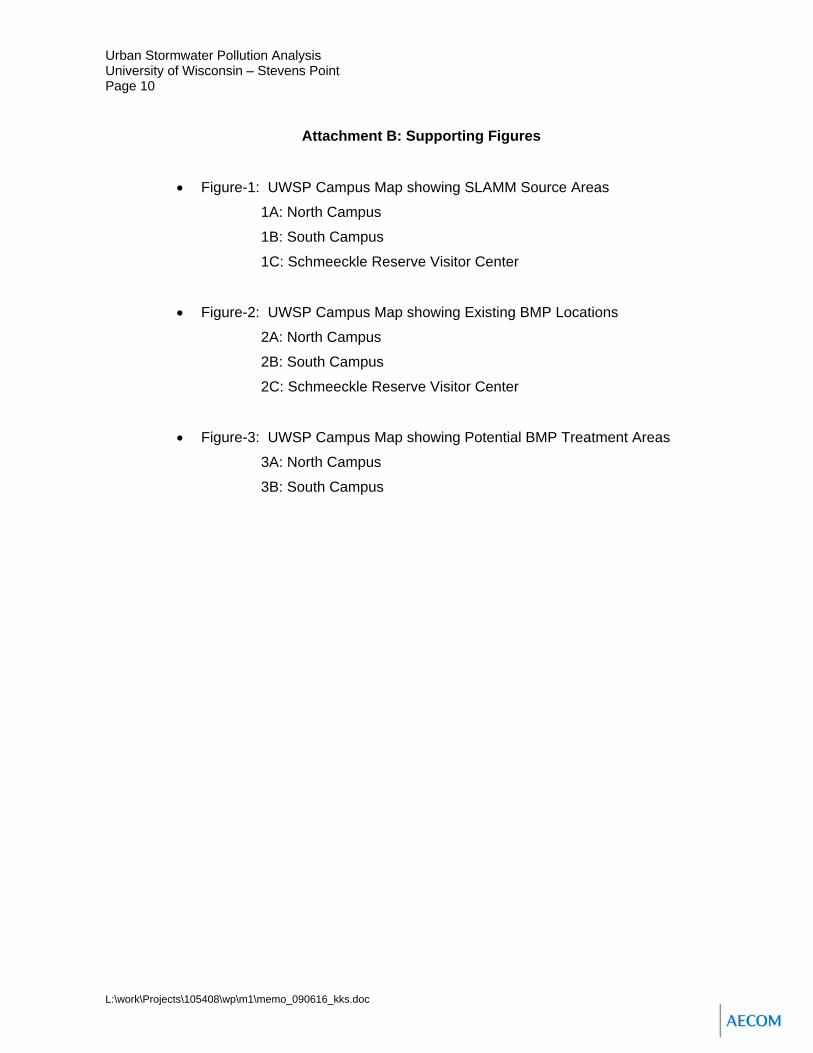
Attachment B: Supporting Figures
• Figure-1: UWSP Campus Map showing SLAMM Source Areas
1A: North Campus
1B: South Campus
1C: Schmeeckle Reserve Visitor Center
• Figure-2: UWSP Campus Map showing Existing BMP Locations
2A: North Campus
2B: South Campus
2C: Schmeeckle Reserve Visitor Center
• Figure-3: UWSP Campus Map showing Potential BMP Treatment Areas
3A: North Campus
3B: South Campus
10
Fourth Ave
B 5
1
Res
erve
St
Frem
ont S
t
Portage St
Sims Ave
Peck St
Prais St
Mic
higa
n Av
e (1
)
Simonis St
Briggs St
Cla
yton
AveIs
ador
e S
tHigh St
College Ave
Illin
ois
Ave
Stanley St
Portage Ct
Cro
ss S
t
Jersey St
Phill
ips
St
Vinc
ent C
t
Franklin St
East
Ave
Wya
tt A
ve
College Ave
10
Stanley St
6362
71
81
70
56
76
85
5459
84
53
61
55
45
66
60
82
58
50
77
4447
80
74
6972
51
57
64
83
79
65
86
52
49 48
75
73
78
67 68
40
0 250125Feet
LegendStorm Sewer
Campus
City
Drainage Basins
Source AreaDriveway
Large Landscape
Other Impervious
Other Pervious
Parking
Roof
Sidewalk
Street
Small Landscape
Undeveloped
Water
´
2
June 2009105408
UW-Stevens Point (South Campus)SLAMM Source Areas
Urban Stormwater Pollution Loading Analysis
Figure 1A
B 5
1
66
Isad
ore
St
Res
erve
St
Vinc
ent S
t
Illin
ois
Ave
Maria Dr
Fourth Ave Simonis St
Mic
higa
n Av
e (1
) Fifth Ave
Stanley St
Sixth Ave
Mic
higa
n Av
e N
Clayton Ave
Atwell St
Fremont St
Minnesota Ave
Fourth Ave
Cla
yton
Ave
Legenduwsp_basins
Storm Sewer
Campus
City
Source AreaDriveway
Large Landscape
Other Impervious
Other Pervious
Parking
Roof
Sidewalk
Street
Small Landscape
Undeveloped
Water
0 250125Feet
´
June 2009105408
UW-Stevens Point (North Campus)SLAMM Source Areas
Urban Stormwater Pollution Loading Analysis
Figure 1B
2

North Point Dr
Legenduwsp_basins
Storm SewerCODE
Campus
City
UW-SP SLAMMSource Area
Driveway
Large Landscape
Other Impervious
Other Pervious
Parking
Roof
Sidewalk
Street
Small Landscape
Undeveloped
Water
roads
Stevens_pt_parcels08
Stpnt2002.sidRGB
Red: Band_1
Green: Band_2
Blue: Band_3
0 7537.5Feet
´2
June 2009105408
UW-Stevens Point (Schmeeckle Reserve Visitor Center)
SLAMM Source AreasUrban Stormwater Pollution Loading Analysis
Figure 1C
10
Fourth Ave
B 5
1
Res
erve
St
Frem
ont S
t
Portage St
Rog
ers
St
Sims Ave
Peck St
Prais St
Mic
higa
n Av
e (1
)
Briggs St
Simonis St
Isad
ore
St
High St
College Ave
Illin
ois
Ave
Stanley St
Portage Ct
Cro
ss S
t
Jersey St
Phill
ips
St
Franklin St
Vinc
ent C
t
East
Ave
Wya
tt A
ve
College Ave
10
Stanley St
62
56
84
55
45
82
50
69
51
65
52
75
73
68
63
71
81
70
76
85
5459
53
61
66
60
58
77
4447
80
74
72
57
64
83
79
86
49 48
78
67
LegendStorm Sewer
Campus
City
Biofilter Locations
Directly Connected Basins
Disconnected Basins
0 250125Feet
´
June 2009105408
UW-Stevens Point (South Campus)Existing BMPs
Urban Stormwater Pollution Loading Analysis
Figure 2A
2
3

B 5
1
66
Isad
ore
St
Res
erve
St
Vinc
ent S
t
Illin
ois
Ave
Maria Dr
Fourth Ave
Mic
higa
n Av
e (1
)
Sixth Ave
Simonis St
Academy Ave
Stanley St
Mic
higa
n Av
e N
Clayton Ave
Fifth Ave
Fremont St
Fourth Ave
6
10
12
26
36
45
14
55
21
50
29
56 56
16
34
52
19
51
11
4
31 30
20
24
27
44
17
4039
22
5
32
25
42
79
47
43
33
8
53
35
13
28
41
54
15
38
18
37
58
48
23
5759
46
49
20
LegendStorm SewerCODE
Campus
City
Biofilter Locations
Directly Connected Basins
Disconnected Basins
0 250125Feet
´
June 2009105408
UW-Stevens Point (North Campus)Existing BMPs
Urban Stormwater Pollution Loading Analysis
Figure 2B
2
3
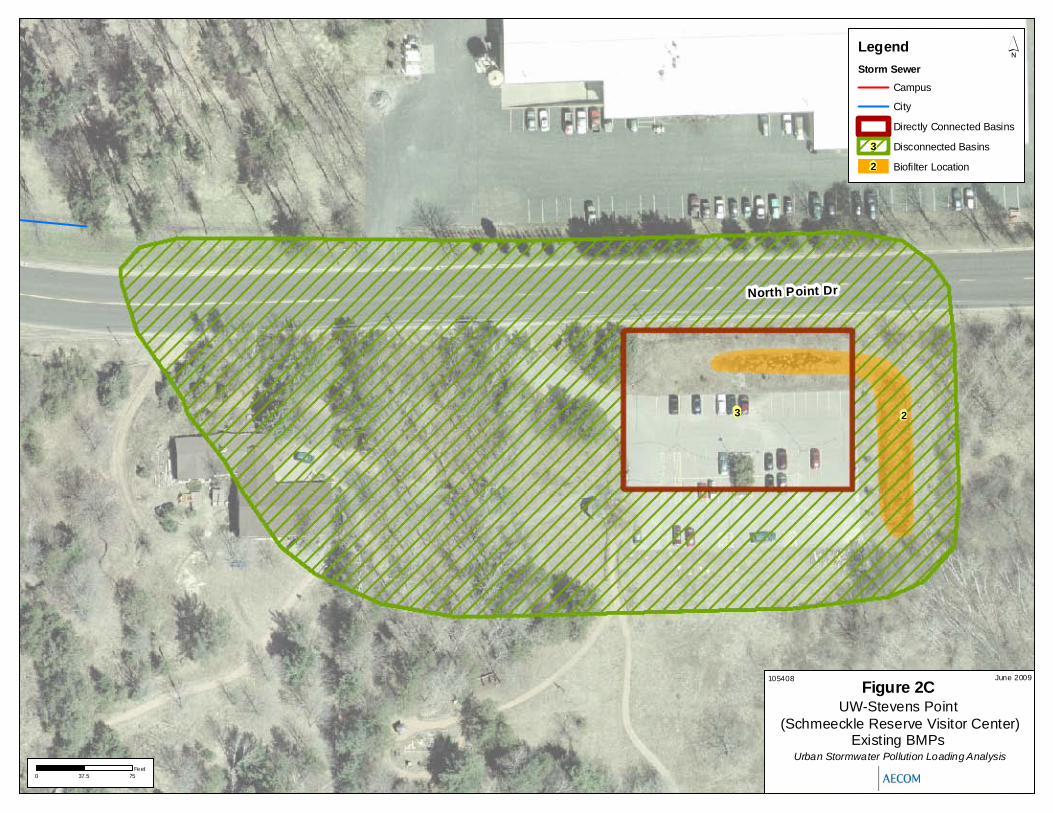
North Point Dr
23
0 7537.5Feet
LegendStorm Sewer
Campus
City
Directly Connected Basins
Disconnected Basins
Biofilter Location
´
3
June 2009105408
UW-Stevens Point (Schmeeckle Reserve Visitor Center)
Existing BMPs Urban Stormwater Pollution Loading Analysis
Figure 2C
2
10
Fourth Ave
B 5
1
Res
erve
St
Frem
ont S
t
Portage St
Rog
ers
St
Sims Ave
Peck St
Prais St
Mic
higa
n Av
e (1
)
Briggs St
Simonis St
Isad
ore
St
High St
College Ave
Illin
ois
Ave
Stanley St
Portage Ct
Cro
ss S
t
Jersey St
Phill
ips
St
Franklin St
Vinc
ent C
t
East
Ave
Wya
tt A
ve
College Ave
10
Stanley St
X
E
W
Z
D
LegendStorm Sewer
Campus
City
Potential Treatment Areas
0 250125Feet
´
June 2009105408
UW-Stevens Point (South Campus)Potential BMP Treatment AreasUrban Stormwater Pollution Loading Analysis
Figure 3A

B 5
1
Isad
ore
St
66
Res
erve
StVi
ncen
t St
Illin
ois
Ave
Maria Dr
Mic
higa
n Av
e (1
)
Sixth Ave
Fourth Ave
Academy Ave
Mic
higa
n Av
e N
Stanley St
Fourth Ave
Q
P
J
T
HLegendStorm Sewer
Campus
City
Potential Treatment Areas
0 250125Feet
´
June 2009105408
UW-Stevens Point (North Campus)Potential Treatment Areas
Urban Stormwater Pollution Loading Analysis
Figure 3B