metabolic remodeling of the human red blood cell membrane · metabolic remodeling of the human red...
TRANSCRIPT
Metabolic remodeling of the humanred blood cell membraneYongKeun Parka,b, Catherine A. Bestc, Thorsten Authd,e, Nir S. Govf, Samuel A. Safrane, Gabriel Popescug,Subra Sureshb,h,1, and Michael S. Felda,1
aG. R. Harrison Spectroscopy Laboratory and hSchool of Engineering, Massachusetts Institute of Technology, Cambridge, MA 02139;bHarvard-Massachusetts Institute of Technology Division of Health Science and Technology, Massachusetts Institute of Technology, Cambridge, MA 02139;cCollege of Medicine and gQuantitative Light Imaging Laboratory, Department of Electrical and Computer Engineering, Beckman Institute for AdvancedScience & Technology University of Illinois at Urbana-Champaign, Urbana, IL 61801; dForschungszentrum Jülich, Institute for Solid State Research,52425 Jülich, Germany; and eDepartment of Materials and Interfaces and fDepartment of Chemical Physics, Weizmann Institute of Science,P.O. Box. 26, Rehovot 76100, Israel
Edited by Zdenek P. Bazant, Northwestern University, Evanston, IL, and approved November 25, 2009 (received for review September 18, 2009)
The remarkable deformability of the human red blood cell (RBC)results from the coupled dynamic response of the phospholipidbilayer and the spectrin molecular network. Herewe present quan-titative connections between spectrin morphology and membranefluctuations of human RBCs by using dynamic full-field laser in-terferometry techniques. We present conclusive evidence thatthe presence of adenosine 5′-triphosphate (ATP) facilitates non-equilibrium dynamic fluctuations in the RBC membrane that arehighly correlated with the biconcave shape of RBCs. Spatial analy-sis of the fluctuations reveals that these non-equilibrium mem-brane vibrations are enhanced at the scale of spectrin mesh size.Our results indicate that the dynamic remodeling of the coupledmembranes powered by ATP results in non-equilibrium membranefluctuations manifesting from both metabolic and thermal ener-gies and also maintains the biconcave shape of RBCs.
ATP ∣ imaging technique ∣ membrane fluctuation ∣ RBC ∣ spectrin
As they travel through small blood vessels and organs, RBCsundergo repeated severe deformation. The coupling and
interactions between the phospholipid bilayer and the spectrinnetwork govern the deformability of RBCs (1). The fluid-likelipid bilayer is coupled to the two-dimensional spectrin networkthat comprises an approximately hexagonal lattice via proteinjunctional complexes. The RBC membrane is remarkably softand elastic, and thus exhibits fluctuations with amplitudes ofthe order of tens of nanometers. The dynamics of the RBC mem-brane is strongly related to the membrane structure and mechan-ical properties and has been explored extensively (2–6). However,experimental results available to date on RBC membrane fluctu-ations have provided only limited information on select regions ofthe cell membrane with limited spatial and/or temporal resolu-tion (7–9). No full-field measurements of membrane fluctuationsin the entire RBC arising in response to well-controlled metabolicactivity have been made so far and, consequently, different tech-niques have led to different interpretations of the mechanisticorigins of dynamic RBC membrane fluctuations with and withoutmetabolic activity (7–9).
The RBC membrane is not a static but a metabolically regu-lated active structure. It is known that biochemical energy controlsits static and dynamic characteristics. The presence of ATP is notonly crucial in maintaining the biconcave shape of the RBCmem-brane (10), but was also shown to increase the dynamic membranefluctuations (7, 9). However, the regulatory mechanism of ATP inRBC membranes still remains elusive. Furthermore, these staticand dynamic effects of ATP on RBC membrane fluctuations havehitherto been regarded as separate phenomena and have neverbeen explored simultaneously.
Here, we present dynamic, full-field, and quantitative measure-ments of ATP effects on RBC membrane morphology and fluctu-ations. We show that in the presence of ATP, the RBC membranefluctuations have a non-equilibrium, metabolic component in
addition to a thermal one. The characteristics of this metaboli-cally driven dynamics are observed only in the convex regionsof the RBC membrane, with a periodic spacing on the order ofthe spectrin molecular network length scale. We demonstratethrough systematic experiments that the metabolic energy ofATP dynamically remodels the coupling between a lipid layerand a spectrin network that governs both the biconcave shapeand non-equilibrium fluctuations in RBC membranes. Throughthese observations, we also rationalize the origins of differingmechanistic interpretations of RBC membrane fluctuations(commonly referred to as “flickering”) specifically in the contextof the role of ATP.
Results and DiscussionsATP Effect on the RBC Morphology. We first address the effects ofATP on the morphology of RBC membranes. RBC samples wereprepared under four different conditions: healthy RBCs, RBCswith irreversibly depleted ATP, metabolically depleted ATP,and repleted ATP groups. After collection, a group of healthyRBCs was minimally prepared (see Materials and Methods).For RBCs in the irreversibly depleted ATP group, the cytoplasmicpool of ATP was depleted by inosine and iodoacetamide. For themetabolically depleted ATP group, healthy RBCs were incubatedin a glucose-free medium for 24 h. For RBCs in the ATP-repletedgroup, cytoplasmic ATP was first metabolically depleted andthen regenerated through the addition of D-glucose. To quanti-tatively measure the cell thickness map, we employed DiffractionPhase Microscopy (DPM) (11, 12). By extracting the optical path-length shifts produced across the cell, we measured the cellthickness with nanometer sensitivity and millisecond temporalresolution. From the measured cell thickness profiles at a giventime t, hðx; y; tÞ, we calculated time-averaged heights hhðx; yÞi(Fig. 1A–D). We observed the characteristic biconcave shapefor healthy RBCs. When ATP was depleted for both the irre-versibly and the metabolically depleted groups, we observed lossof biconcave shape and echinocyte shape transformation. Re-introducing ATP resulted in the recovery of biconcave shape. Thisshows that ATP is crucial to maintaining the biconcave shape ofRBCs (13).
Author contributions: Y.P., C.A.B., G.P., and M.S.F. designed research; Y.P. performedresearch; Y.P., T.A., N.S.G., S.A.S., and G.P. analyzed data; Y.P., G.P., S.S., and M.S.F. wrotethe paper; and C.A.B. and S.S. contributed new reagents/analytic tools.
The authors declare no conflict of interest.
This article is a PNAS Direct Submission.
Freely available online through the PNAS open access option.1Towhom correspondencemay be addressed. E-mails: [email protected] or [email protected]
This article contains supporting information online at www.pnas.org/cgi/content/full/0910785107/DCSupplemental.
www.pnas.org/cgi/doi/10.1073/pnas.0910785107 PNAS ∣ January 26, 2010 ∣ vol. 107 ∣ no. 4 ∣ 1289–1294
ENGINEE
RING
CELL
BIOLO
GY

Enhanced Membrane Fluctuations in the Presence of ATP. To probedynamic membrane fluctuations, we analyzed the membrane dis-placement map by subtracting the averaged shape from the cellthickness map, Δhðx; y; tÞ ¼ hðx; y; tÞ − hhðx; yÞi (Fig. 1E–H andSupporting Information Movies S1–4). Compared to healthyRBCs, the fluctuation amplitudes were decreased in both ATP-depleted groups. Reintroducing ATP, however, increased thefluctuation amplitudes to healthy RBC levels. We calculatedthe RMS displacement of membrane fluctuations,
ffiffiffiffiffiffiffiffiffiffiffiffihΔh2i
p, that
covers the entire cell area for 2 s at 120 frame∕s (Fig. 2).The RMS displacement of healthy RBCs is 41.5� 5.7 nm.Fluctuations significantly decreased to 32.0� 7.8 nm and 33.4�8.7 nm in both the irreversibly and metabolically ATP-depletedgroups, respectively. However, the fluctuations in the ATP-re-pleted group returned to the level of healthy RBCs(48.4� 10.2 nm). This is in agreement with an earlier reportusing the point measurement technique (9, 10).
ATP Results in Non-equilibrium Dynamics for Membrane Fluctuations.We showed that the membrane fluctuations indeed decrease in
the absence of ATP, which is consistent with the previous resultsby using point measurement techniques (7, 9). However, thisresult does not yet answer the question of whether ATP drives“active,” non-equilibrium dynamics or simply modifies mem-brane elastic properties. Of course, the two different situa-tions can give rise to fundamentally different dynamics: (i)out-of-equilibrium fluctuations or (ii) equilibrium Gaussian fluc-tuations. To answer this question, we calculated the non-Gaussianparameter, κ, for the membrane fluctuations (Fig. 3A–D). Theo-retically, κ ¼ 2 for purely thermally-driven Gaussian motionand κ increases above two for active non-equilibrium dynamics(14). For healthy RBCs, the average value of κ was 2.8, whichshows that membrane fluctuations contain non-equilibriumdynamic components, particularly on short length and time scales(q > 5 rad∕μm and Δt < 0.5 s). With depletion of ATP, κ de-creased to two, as expected in purely thermally-driven dynamics(the average values of κ were 2.06 and 2.19 for the irreversiblydepleted and metabolically depleted ATP groups, resp.). Reintro-ducing ATP increased κ to healthy RBC levels (average valueκ ¼ 2.98). Our data clearly proves that active, metabolic energyfrom ATP contributes an enhancement in RMS displacements by44.9%. This measured value is lower than predicted by a theoret-ical model where an increase of at least 100% was expected (14).However, it can be explained by recognizing that the ATP effect ismore significant at large q-values, comparable with the size of thespectrin network (15). For example, the ATP-mediated RMS dis-placement at q ¼ 17� 0.5 rad∕μm showed an increase of 143%compared with the thermal components. Thus, in our overall as-sessment that includes all spatial frequencies, ATP enhancementis likely to be underestimated.
Even though RBC membrane dynamics have been exploredextensively, no definitive experiment has determined whetherflickering is purely thermally driven or contains active contribu-tions. First observed a century ago, its origin is generally believedto be thermal forces (2, 16). Different interference-microscopictechniques have been employed to study membrane fluctuationsand mechanical properties assuming Brownian dynamics (3, 5).In contrast, a technique that qualitatively measured the localfluctuations of RBC membranes reported a correlation betweenthe ATP concentration and the fluctuation amplitude (9, 10).However, recent experimental work, in which only edge shapesof RBCs were probed, showed no relation between ATPdepletion and membrane fluctuations (8). Theoretically, RBCmembrane fluctuations were traditionally studied by using mod-els of thermally-driven equilibrium systems (2, 3). A recent
Fig. 1. Effects of ATP on morphology and dynamic fluctuation in RBC membrane. Topography of a healthy RBC, (A) of an ATP-depleted RBC (irreversible-ATPgroup), (B) of an ATP-depleted RBC (metabolic-ATP group), (C, and of a RBC with recovered ATP level (þATP group), (D) resp. (E–H) Instantaneous displacementmaps of membrane fluctuation in the Fig. 1A–D, resp. The scale bar is 2 μm. The colorbar scales are in μm and nm, resp.
Fig. 2. RMS displacements of membrane fluctuations for different ATPconditions: healthy RBCs, irreversibly ATP-depleted RBCs, metabolicallyATP-depleted RBCs, and RBCs in which ATP was reintroduced to metabolicallyATP-depleted RBCs. Each symbol represents an individual RBC and thehorizontal line is the mean value.
1290 ∣ www.pnas.org/cgi/doi/10.1073/pnas.0910785107 Park et al.

theoretical model (15, 17), validated by simulation (18, 19),showed that local breaking and reforming of the spectrin networkcan result in enhanced fluctuations. Our results here showed thatthe depletion of ATP decreased the fluctuations in RBC mem-branes that can be reversed when ATP is reintroduced. Further-more, measurement of the non-Gaussian parameter κ revealedthat the enhanced membrane fluctuations in the presence of ATPare indeed governed by non-equilibrium dynamics, and do notonly reflect the change of the mechanical properties of RBCs.
Biconcave Shapes Are Coupled With ATP-Dependent Enhanced Mem-brane Fluctuations. To study further spatial aspects of active mo-tion, we analyzed the morphologies and fluctuations for RBCs ina polar coordinate system with its origin at cell center. Assumingcylindrical symmetry, the average height of the RBC mem-brane,hhðrÞi, and the membrane mean-squared displacements,hh2ðrÞi, are shown as functions of the radial distance, r (Fig. 4).
In healthy RBCs, the membrane fluctuations are enhancedand strongly localized at the outer convex region (the shadedarea in Fig. 4), whereas both ATP depletion groups showed littlevariation in membrane fluctuations over the cell surface. Re-markably, reintroducing ATP restores not only the biconcaveshape, but also enhances the fluctuations in the outer convexarea. This is striking because continuum equilibrium models pre-dict a stronger restoring force and a decreased fluctuation am-plitude in regions of high membrane curvature (20). Our resultsshow that active contributions are spatially inhomogeneous andcorrelated with the maintenance of the biconcave shape. Thisstrongly suggests that the RBC membrane cortex, especiallythe coupling and interaction between a lipid layer and spectrinnetwork, is actively and dynamically remodeled in the presenceof ATP. It also rationalizes different mechanistic inferences re-ported in the literature from prior measurement of membranefluctuations (7, 8, 10). Probing the edge shape of RBCs alone
Fig. 3. Non-equilibrium dynamic in RBC membranes. Averaged non-Gaussian parameter, κ, versus a lag time, Δt, and a spatial frequency, q, for membranefluctuation in healthy RBC, (A) irreversible ATP-depletion group, (B) metabolic ATP-depletion group, (C) and after reintroducing ATP to metabolic-depletiongroup, (D) resp. N ¼ 40 RBCs per each group.
Fig. 4. Correlation between biconcave shape and enhanced membrane fluctuations. (A–D) Averaged height as a function of the distance from the center ofcells for healthy RBCs, (A) for RBCs in the irreversibly ATP-depleted group, (B) for RBCs in the metabolically ATP-depleted group, (C) and for RBCs in which ATPwas reintroduced to the metabolically ATP-depleted group, (D) resp. (E-H) Averaged squared height fluctuations as a function of the distance from the centerof cells in Fig. 3A–D, resp. Thick lines show the average value and the areas represent standard deviation for 40 RBCs.
Park et al. PNAS ∣ January 26, 2010 ∣ vol. 107 ∣ no. 4 ∣ 1291
ENGINEE
RING
CELL
BIOLO
GY
does not capture ATP-dependent enhanced fluctuations (8) be-cause they are localized on the convex region on RBC membraneand may not be significant only after 1 h of ATP depletion. Pointmeasurement techniques that measure the averaged dynamics ofthe RBC membrane could measure ATP-dependence (7, 9, 10).
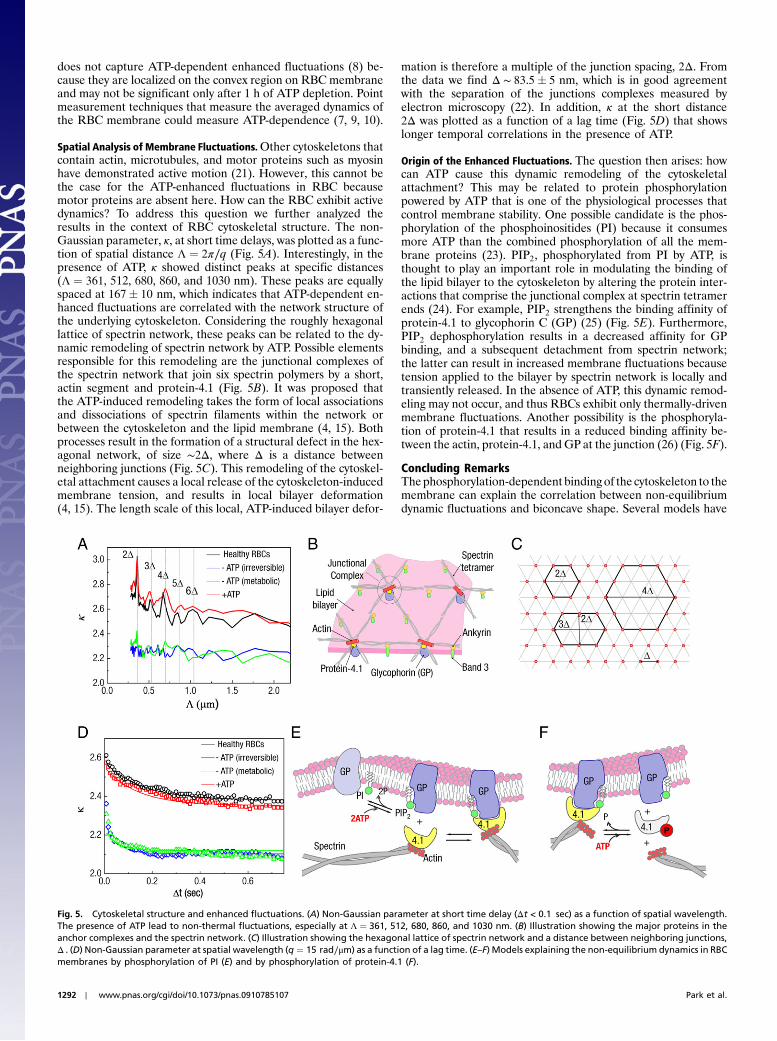
Spatial Analysis of Membrane Fluctuations.Other cytoskeletons thatcontain actin, microtubules, and motor proteins such as myosinhave demonstrated active motion (21). However, this cannot bethe case for the ATP-enhanced fluctuations in RBC becausemotor proteins are absent here. How can the RBC exhibit activedynamics? To address this question we further analyzed theresults in the context of RBC cytoskeletal structure. The non-Gaussian parameter, κ, at short time delays, was plotted as a func-tion of spatial distance Λ ¼ 2π∕q (Fig. 5A). Interestingly, in thepresence of ATP, κ showed distinct peaks at specific distances(Λ ¼ 361, 512, 680, 860, and 1030 nm). These peaks are equallyspaced at 167� 10 nm, which indicates that ATP-dependent en-hanced fluctuations are correlated with the network structure ofthe underlying cytoskeleton. Considering the roughly hexagonallattice of spectrin network, these peaks can be related to the dy-namic remodeling of spectrin network by ATP. Possible elementsresponsible for this remodeling are the junctional complexes ofthe spectrin network that join six spectrin polymers by a short,actin segment and protein-4.1 (Fig. 5B). It was proposed thatthe ATP-induced remodeling takes the form of local associationsand dissociations of spectrin filaments within the network orbetween the cytoskeleton and the lipid membrane (4, 15). Bothprocesses result in the formation of a structural defect in the hex-agonal network, of size ∼2Δ, where Δ is a distance betweenneighboring junctions (Fig. 5C). This remodeling of the cytoskel-etal attachment causes a local release of the cytoskeleton-inducedmembrane tension, and results in local bilayer deformation(4, 15). The length scale of this local, ATP-induced bilayer defor-
mation is therefore a multiple of the junction spacing, 2Δ. Fromthe data we find Δ ∼ 83.5� 5 nm, which is in good agreementwith the separation of the junctions complexes measured byelectron microscopy (22). In addition, κ at the short distance2Δ was plotted as a function of a lag time (Fig. 5D) that showslonger temporal correlations in the presence of ATP.
Origin of the Enhanced Fluctuations. The question then arises: howcan ATP cause this dynamic remodeling of the cytoskeletalattachment? This may be related to protein phosphorylationpowered by ATP that is one of the physiological processes thatcontrol membrane stability. One possible candidate is the phos-phorylation of the phosphoinositides (PI) because it consumesmore ATP than the combined phosphorylation of all the mem-brane proteins (23). PIP2, phosphorylated from PI by ATP, isthought to play an important role in modulating the binding ofthe lipid bilayer to the cytoskeleton by altering the protein inter-actions that comprise the junctional complex at spectrin tetramerends (24). For example, PIP2 strengthens the binding affinity ofprotein-4.1 to glycophorin C (GP) (25) (Fig. 5E). Furthermore,PIP2 dephosphorylation results in a decreased affinity for GPbinding, and a subsequent detachment from spectrin network;the latter can result in increased membrane fluctuations becausetension applied to the bilayer by spectrin network is locally andtransiently released. In the absence of ATP, this dynamic remod-eling may not occur, and thus RBCs exhibit only thermally-drivenmembrane fluctuations. Another possibility is the phosphoryla-tion of protein-4.1 that results in a reduced binding affinity be-tween the actin, protein-4.1, and GP at the junction (26) (Fig. 5F).
Concluding RemarksThephosphorylation-dependent binding of the cytoskeleton to themembrane can explain the correlation between non-equilibriumdynamic fluctuations and biconcave shape. Several models have
Fig. 5. Cytoskeletal structure and enhanced fluctuations. (A) Non-Gaussian parameter at short time delay (Δt < 0.1 sec) as a function of spatial wavelength.The presence of ATP lead to non-thermal fluctuations, especially at Λ ¼ 361, 512, 680, 860, and 1030 nm. (B) Illustration showing the major proteins in theanchor complexes and the spectrin network. (C) Illustration showing the hexagonal lattice of spectrin network and a distance between neighboring junctions,Δ . (D) Non-Gaussian parameter at spatial wavelength (q ¼ 15 rad∕μm) as a function of a lag time. (E–F) Models explaining the non-equilibrium dynamics in RBCmembranes by phosphorylation of PI (E) and by phosphorylation of protein-4.1 (F).
1292 ∣ www.pnas.org/cgi/doi/10.1073/pnas.0910785107 Park et al.

been proposed to explain the biconcave shape of RBC (27) but itstill remains as an unsolved puzzle. It was proposed that the ATP-regulated interaction between the junction complexes and themembrane plays a role in maintaining the biconcave shape (25).A theoretical model that relates ATP-induced unbinding toRBC shape showed that this active process lowers the overall cy-toskeleton shear rigidity and the tension that the spectrin networkimposes on the membrane (15, 17). Our results provide furtherexperimental evidence for themetabolism-dependent shape trans-formation. We show that ATP-dependent transient binding ofjunctional complexes are localized over the cell outer area, andthat the spectrin network should therefore exert a lower tensionon the membrane. We also note that, in the absence of ATP,the shapes of RBC are similar to those of patients withhereditary elliptocytosis, where GP does not properly interactwith protein 4.1, resulting in the lack of biconcave shape anddeformability (28, 29). This dynamic remodeling of the spectrinnetwork offers a possible explanation for the observed metabolicdependence of red cell deformability (30). Taken together, wehave shown that the biconcave shape and non-equilibrium dy-namics in the membrane are both consequences of the samebiochemical activity: the dissociations of the cytoskeleton at thespectrin junctions powered by ATP metabolism.
In summary, we have presented definitive evidence that mem-brane fluctuations in the RBC membrane have a metabolic aswell as thermal energy component that are localized at the outerarea of the cell. Our results suggest that the spectrin-bilayer bind-ing, through local remodeling of the spectrin junctions, gives riseto this non-equilibrium dynamics. This remodeling is also impor-tant in determining cell deformability and the unique biconcaveshape of RBCs. Our results are in good qualitative agreementwith previously proposed theoretical models (15, 17). The valuesmeasured for the ATP-mediated fluctuation amplitudes, whichare lower than those predicted theoretically, can be understoodby the spatial inhomogeneity of active motions. Whether this dy-namic remodeling of the RBC cytoskeleton is beneficial in physi-ological conditions remains an open question and is now acces-sible to direct experimental study.
Materials and MethodsDiffraction Phase Microscopy. An Ar2þ laser (λ ¼ 514 nm) was used asillumination source for an inverted microscope (IX71, Olympus). The micro-scope was equipped with a 40 × objective lens (0.75 NA) that facilitates adiffraction-limited transverse resolution of about 400 nm. With the addi-tional relay optics used outside the microscope, the overall magnificationof the system was approximately 200×. An Electron Multiplying ChargeCoupled Device (Photonmax 512B, Princeton Instruments, Inc.) was used to
image interferogram. DPM employs the principle of laser interferometryin a common path geometry and, thus, provides full-field quantitativephase images of RBCs with unprecedented optical path-length stability(11, 12). The instantaneous cell thickness map is obtained as hðx; y; tÞ ¼ðλ∕2πΔnÞΔφðx; y; tÞ with Δφ being the quantitative phase image measuredby DPM. The refractive index contrast Δn between the RBC and the surround-ing PBS mainly originated from hemoglobin protein that is optically homo-geneous in cytosol. We used the Δn of red blood cells calibrated fromTomographic Phase Microscopy (31). The DPM optical path-length stabilityis 2.4 mrad, which corresponds to a membrane displacement of 3.3 nm (11).
Sample Preparation. Human RBCs were collected in vacutainer tubes contain-ing EDTA, and then immediately centrifuged at 2000 × g for 10 min at 10 °Cto separate RBCs from the plasma. The RBCs were washed three times withPBS. For the irreversibly ATP-depleted group, RBCs were incubated withoutglucose, in the presence of 5 mM inosine (A3221, Sigma–Aldrich) and 3 mMiodoacetamide (I1024, Sigma–Aldrich) for 2 h at 20 °C. Inosine consumes ATPand iodoacetamide blocks ATP production by inhibiting glyceraldehydes-3phosdehydrogenase. For metabolically ATP-depleted group, healthy RBCswere incubated in glucose-free PBS for 24 h at 37 °C. For the ATP-repletedgroup, 10 mM of D-glucose was added to the RBC suspension in metabolic-ATP group. D-glucose is transported into RBC cytosol and converted into ATPvia glycolytic pathways.
Non-Gaussian Parameter. The non-Gaussian parameter, κ, is defined by thesecond and fourth moments of the membrane height displacement. First,the displacement maps of membrane fluctuations, Δhðx; y; tÞ, were decom-posed into Fourier modes Δhðq;ΔtÞ. The lag time is Δt and the spatial fre-queny, q ¼ 2π∕Λ, where Λ is a spatial distance. The non-Gaussianparameter is then calculated from the second and forth moments of themembrane height displacement as κ ¼ hjhðq;ΔtÞ − hðq; 0Þj4i∕hjhðq;ΔtÞ−hðq; 0Þj2i2 ¼ hjhqj4i∕hjhqj2i2. When hq is defined as hq ¼ aq þ ibq, ha2qi ¼hb2
qi ¼ 12 hjhqj2i and ha4qi ¼ hb4
qi ¼ 38 hjhqj4i (14). For Δt longer than the relaxa-
tion time of the membrane, the difference of two normally distributed vari-ables is also normally distributed, κ ¼ hjhqj4i∕hjhqj2i2 ¼ 8
3 3∕4 ¼ 2.
Statistical Analysis. P values are calculated by two-tailed Mann_Whitney ranksum tests comparing the RMS fluctuations between various test conditions.All the numbers follow the � sign in the text is a standard deviation.
ACKNOWLEDGMENTS. This research was supported by the National Institutesof Health (P41-RR02594-18). Y.P. has been supported by Samsung Scholarship,and Whitaker Health Science Fellowship. T.A. acknowledges support fromthe Minerva Foundation. N.S.G. acknowledges support from the BinationalScience Foundation (Grant 2006285). S.A.S. acknowledges support from theU.S.-Israel Binational Science Foundation and the Israel Science Foundation.S.S. acknowledges support from the Interdisciplinary Research Group on In-fectious Diseases, which is funded by the Singapore-MITAlliance for Researchand Technology Center and from the National Institutes of Health (GrantsR01 HL094270-01A1 and 1-R01-GM076689-01). G.P. acknowledges supportfrom National Science Foundation (CAREER: 08-46660).
1. Mohandas N, Evans E (1994) Mechanical properties of the red cell membrane in rela-tion to molecular structure and genetic defects. Ann Rev Bioph Biom, 23(1):787–818.
2. Brochard F, Lennon JF (1975) Frequency spectrum of the flicker phenomenon inerythrocytes. J Phys-Paris, 36:1035–1047.
3. Zilker A, Engelhardt H, Sackmann E (1987) Dynamic reflection interference contrast(RIC-) microscopy: Anew method to study surface excitations of cells and to measuremembrane bending elastic moduli. J Phys-Paris, 48:2139–2151.
4. Gov N, Zilman AG, Safran S (2003) Cytoskeleton confinement and tension of red bloodcell membranes. Phys Rev Lett, 90(22):228101–228104.
5. Popescu G, et al. (2006) Optical measurement of cell membrane tension. Phys Rev Lett,97(21):218101–218104.
6. Popescu G, Park YK, Dasari RR, Badizadegan K, FeldMS (2007) Coherence properties ofred blood cell membrane motions. Phys Rev E, 76(3):31902–31905.
7. Tuvia S, et al. (1997) Cell membrane fluctuations are regulated by medium macrovisc-osity: Evidence for a metabolic driving force. P Natl Acad Sci USA, 94(10):5045–5049.
8. Evans J, Gratzer W, Mohandas N, Parker K, Sleep J (2008) Fluctuations of the red bloodcell membrane: Relation to mechanical properties and lack of ATP dependence.Biophys J, 94(10):4134–4144.
9. Betz T, Lenz M, Joanny J, Sykes C (2009) ATP-dependent mechanics of red blood cells.P Natl Acad Sci USA, 106(36):15312–15317.
10. Tuvia S, Levin S, Bitler A, Korenstein R (1998) Mechanical fluctuations of the mem-brane-skeleton are dependent on F-actin ATPase in human erythrocytes. J Cell Biol,141(7):1551–1561.
11. Park YK, Popescu G, Badizadegan K, Dasari RR, Feld MS (2006) Diffraction phase andfluorescence microscopy. Opt Express, 14(18):8263–8268.
12. Popescu G, Ikeda T, Dasari RR, Feld MS (2006) Diffraction phase microscopy for quan-tifying cell structure and dynamics. Opt Lett, 31(6):775–777.
13. Sheetz M, Singer S (1977) On the mechanism of ATP-induced shape changes in humanerythrocyte membranes. I. The role of the spectrin complex. J Cell Biol, 73(3):638–646.
14. Lawrence C, Gov N, Brown F (2006) Nonequilibrium membrane fluctuations driven byactive proteins. J Chem Phys, 124:074903–074915.
15. Gov NS, Safran SA (2005) Red blood cell membrane fluctuations and shape controlledby ATP-induced cytoskeletal defects. Biophys J, 88(3):1859–1874.
16. Parpart A, Hoffman J (1956) Flicker in erythrocytes. “Vibratory movements in thecytoplasm?”. J Cell Compar Physl, 47(2):295–303.
17. Gov NS (2007) Active elastic network: Cytoskeleton of the red blood cell. Phys Rev E, 75(1):11921–11926.
18. Li J, Lykotrafitis G, Dao M, Suresh S (2007) Cytoskeletal dynamics of human erythro-cyte. P Natl Acad Sci USA, 104(12):4937–4942.
19. Zhang R, Brown F (2008) Cytoskeleton mediated effective elastic properties of modelred blood cell membranes. J Chem Phys, 129:065101–065114.
20. Auth T, Safran S, Gov N (2007) Fluctuations of coupled fluid and solid membranes withapplication to red blood cells. Phys Rev E, 76(5):51910–51918.
21. Mizuno D, Tardin C, Schmidt C, MacKintosh F (2007) Nonequilibrium mechanics ofactive cytoskeletal networks. Science, 315(5810):370–373.
22. Liu F, Mizukami H, Sarnaik S, Ostafin A (2005) Calcium-dependent human erythro-cyte cytoskeleton stability analysis through atomic force microscopy. J Struct Biol,150(2):200–210.
23. Muller E, et al. (1986) Turnover of phosphomonoester groups and compartmentationof polyphosphoinositides in human erythrocytes. Biochem J, 235(3):775–783.
Park et al. PNAS ∣ January 26, 2010 ∣ vol. 107 ∣ no. 4 ∣ 1293
ENGINEE
RING
CELL
BIOLO
GY

24. Patel V, Fairbanks G (1981) Spectrin phosphorylation and shape change of humanerythrocyte ghosts. J Cell Biol, 88(2):430–440.
25. Agre P, Parker J (1989) Red blood cell membranes: structure, function, clinical implica-tions (CRC Press, New York).
26. Manno S, Takakuwa Y, Mohandas N (2005) Modulation of erythrocyte membranemechanical function by protein 4.1 phosphorylation. J Biol Chem, 280(9):7581–7587.
27. Beutler E (1995) Williams hematology (McGraw-Hill, New York), Ch. 22.28. Tchernia G, Mohandas N, Shohet S (1981) Deficiency of skeletal membrane protein
band 4.1 in homozygous hereditary elliptocytosis. Implications for erythrocyte mem-brane stability. J Clin Invest, 68(2):454–460.
29. Weed R, LaCelle P, Merrill E (2006) Mechanical response of human red blood cells in
health and disease: Some structure-property-function relationships. J Mater Res, 21
(8):1872–1877.
30. Fred M, Pickens M (1969) Metabolic dependence of red cell deformability. J Clin
Invest, 48(5):795–809.
31. Park Y-K, et al. (2008) Refractive index maps and membrane dynamics of human
red blood cells parasitized by Plasmodium falciparum. P Natl Acad Sci USA,
105(37):13730–13735.
1294 ∣ www.pnas.org/cgi/doi/10.1073/pnas.0910785107 Park et al.