metal stream/royalty portfolio r g i as of december 31, 2016...metal stream/royalty portfolio as of...
TRANSCRIPT

Tons of Ore
(M) (opt) (M) (M) (opt) (M) (opt) (M) (opt)
United States
Kinross
1.75 - 2.5% NSR 11
Barrick
GSR1
0.40 - 5.0% GSR 12
GSR2
0.40 - 5.0% GSR 12
GSR30.71% GSR
NVR14.83% NVR
NVR1C4.43% NVR
Kinross
1.0% - 2.0% NSR 14, 15
0.6% - 0.9% NSR (M-ACE) 14, 15
Barrick0.9% NSR
West Kirkland / Clover Nevada1.5% NSR
Newmont1.8% NSR
Silver Standard2.0% NSR
OPERATOR, PROPERTY AND ROYALTY 3
0.693 0.05 0.020 1.13 0.236 2.60
0.03 0.006 9.01 0.014
51.35 0.018
2.78 0.236
31.64
4.90
0.00 0.333
0.161 0.46
0.436 90.49 0.0190.02318.95 0.00 0.000 0.00 0.000
0.657 0.09
0.012
0.77 0.018 9.85 0.017 2.01
0.017
0.000
36.64 0.089 3.245
0.034 2.695 0.00
0.018
2.02
0.021
97.96
0.671
0.46 0.3540.378
0.014
9.880.77
7.69 0.014
0.030 2.970
0.016 0.080 0.64 6.29 0.013 2.45 0.011
35.62
0.00
0.013
0.00 0.000
3.32
0.056 0.00
0.049
0.008 11.77 0.00916.55
0.02 0.000
0.946
78.26 0.000
0.008
37.81 0.018
0.000
0.017 0.588
0.012 1.728 0.00 0.000143.21 0.00 0.00 0.000
Average Gold
Grade
Gold Contained
Ozs 10
Tons
Bald Mountain
Cortez (Pipeline and Crossroads)
Marigold
Gold 2
PROVEN + PROBABLE RESERVES 4,5,6
ADDITIONAL MINERALIZED MATERIAL 7,8,9
Measured Indicated Inferred
Tons
Average Gold
Grade Tons
Average Gold
Grade
Average Gold
Grade
Goldstrike (SJ Claims)
Leeville
Gold Hill 13
Hasbrouck (DEV)
ROYALGOLD,INC Metal Stream/Royalty Portfolio
As of December 31, 2016 1
1

Tons of Ore
(M) (opt) (M) (M) (opt) (M) (opt) (M) (opt)
United States (cont.)
Waterton Precious Metals Fund
Cordillleran - 3.0% NSR 16, 17
Rayrock - 2.94% NSR 16, 18
KGHM
3.0% NSR
Waterton Precious Metals Fund
3.0% NSR
Golden Queen / Gauss LLC
3.0% NSR 19
Newmont2.0% GV
Coeur Mining
0.0% - 2.0% NSR 20
Canada
Sabina Gold & SilverGeorge Lake
2.35% NSR 21
Goose Lake
1.94576% NSR 22
Yamana / Agnico Eagle
1.0% - 1.5% NSR 23
OPERATOR, PROPERTY AND ROYALTY 3
0.0270.38
3.88 0.091 2.50
0.000
204.42
1.04
203.48
0.603
0.010
0.019 24.94 0.040
0.000
23.58
0.00
0.01351.05
0.025
0.005 41.63
2.72
0.0630.42
0.005
1.73 0.014 0.024 3.19
0.086 0.036
23.87 0.025 2.16 0.031
0.019
0.023 0.00
0.984 0.029 39.99
0.57 0.069 0.02
159.47 0.827 0.006 25.80 0.005
14.84
0.041
5.84 0.191 3.140.184 0.27313.62
0.000
3.60 0.109
2.52 0.056
0.000
0.40
2.503
2.692
7.050.00 0.000
0.292
Ruby Hill
Pinson
Robinson
PROVEN + PROBABLE RESERVES 4,5,6
ADDITIONAL MINERALIZED MATERIAL 7,8,9
Back River (DEV)
Canadian Malartic
Average Gold
Grade
Twin Creeks
Wharf
89.79 0.030
0.162 5.33 0.1840.00
7.56
Average Gold
Grade
Gold Contained
Ozs 10
Measured Indicated Inferred
Tons
Soledad Mountain (DEV)
Tons
Average Gold
Grade Tons
Average Gold
Grade
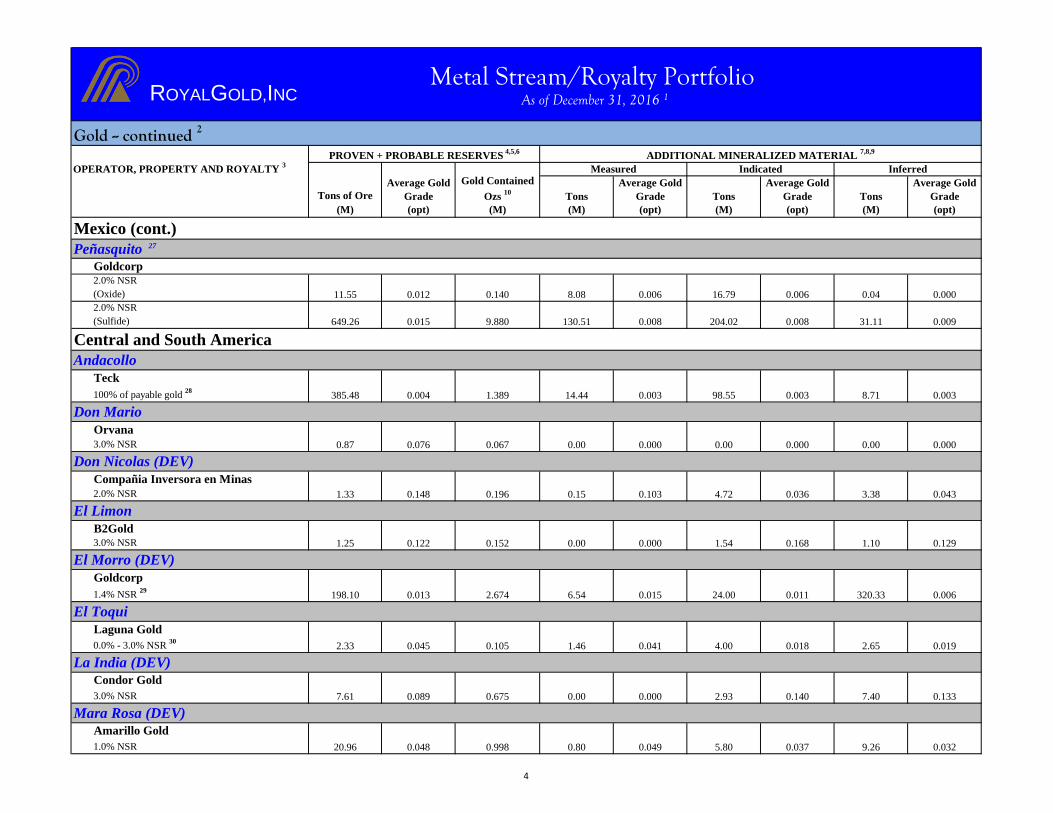
Gold -- continued 2
0.064 0.483 0.033
ROYALGOLD,INC Metal Stream/Royalty Portfolio
As of December 31, 2016 1
2

Tons of Ore
(M) (opt) (M) (M) (opt) (M) (opt) (M) (opt)
Canada (cont.)
Kirkland Lake Gold0.00013 x gold price
Capstone Mining2.0% NSR
Centerra Gold
35% of gold produced 24
Anaconda Mining7.5% NPI
New Gold
6.5% of gold produced 25
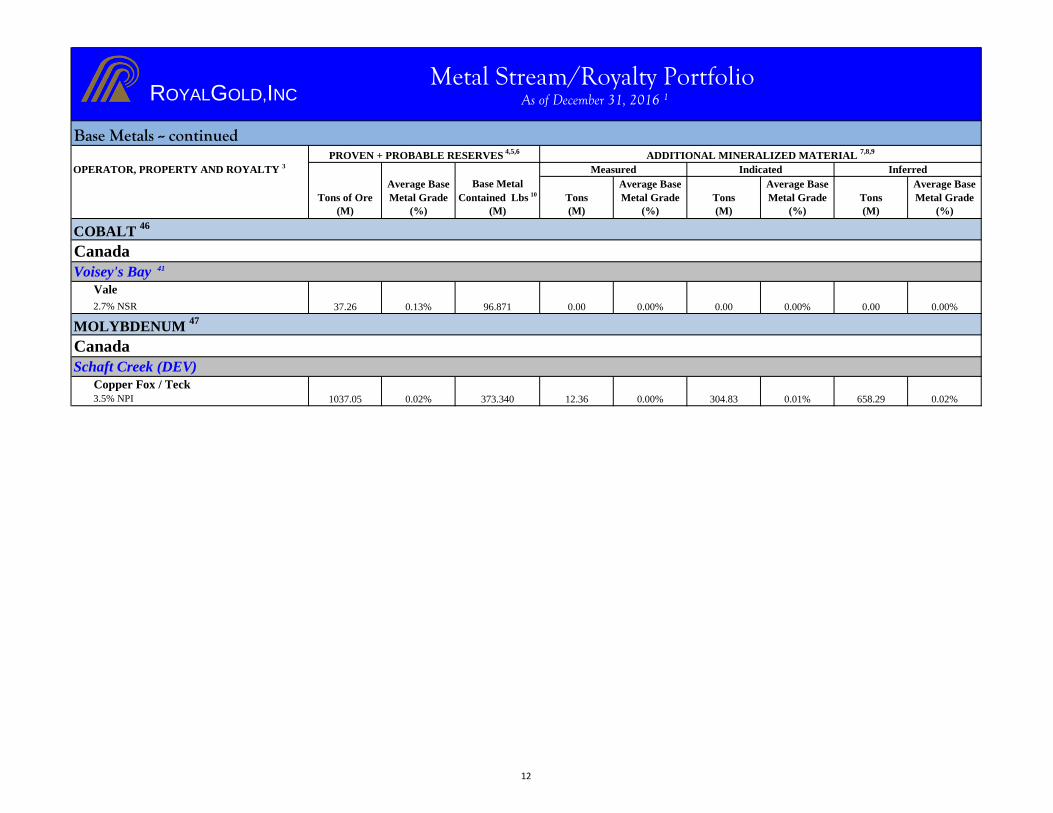
Copper Fox / Teck
3.5% NPI
Barrick0.97% NSR
Mexico
Pan American Silver3.25% NSR
Alamos
1.0 - 5.0% NSR 26
OPERATOR, PROPERTY AND ROYALTY 3
0.0400.034 1.884
0.570
0.060
0.000
2.91 0.00
12.36 0.005 304.83 658.29
3.93 0.06518.35
0.0051037.05 5.775 0.0050.006
0.052 0.952 0.14 0.080 30.46 0.031
74.34 0.033 11.33 0.029
0.021 1.507 2.09 0.007 3.53 0.012 1.87 0.02970.66
9.53
0.011 5.799
0.032
0.019
0.006
0.000
184.43
0.126 3.33 0.120 9.58
0.92
0.138
0.0620.280.0000.00
0.008
1.20 0.01011.51
4.35 0.131
0.032 84.45 0.032 19.94
0.175
550.00
Mount Milligan
Schaft Creek (DEV)
Pine Cove (DEV)
Williams
PROVEN + PROBABLE RESERVES 4,5,6
ADDITIONAL MINERALIZED MATERIAL 7,8,9
Holt
Kutcho Creek (DEV)
Rainy River (DEV)
12.18 0.009
0.011
84.46
0.124 0.00
4.37
114.95 0.033 3.772 5.12
Gold -- continued 2
Mulatos
Average Gold
Grade
Gold Contained
Ozs 10
Measured Indicated Inferred
Tons
Average Gold
Grade Tons
Average Gold
Grade Tons
Average Gold
Grade
Dolores
55.11
ROYALGOLD,INC Metal Stream/Royalty Portfolio
As of December 31, 2016 1
3
Tons of Ore
(M) (opt) (M) (M) (opt) (M) (opt) (M) (opt)
Mexico (cont.)
Goldcorp2.0% NSR
(Oxide)
2.0% NSR
(Sulfide)
Central and South America
Teck
100% of payable gold 28
Orvana
3.0% NSR
Compañia Inversora en Minas
2.0% NSR
B2Gold3.0% NSR
Goldcorp
1.4% NSR 29
Laguna Gold
0.0% - 3.0% NSR 30
Condor Gold
3.0% NSR
Amarillo Gold
1.0% NSR
OPERATOR, PROPERTY AND ROYALTY 3
0.148
0.0060.140
0.105
2.674
0.041
0.036 3.38
0.00 0.000
0.15
0.0452.33
0.032
1.10 0.1290.00 0.000
1.46
1.25 0.122 0.152
7.61 0.089 0.675
0.011
0.018
4.72
4.00 2.65 0.019
0.049 5.80 0.037
0.013
2.93
6.54 0.015
1.33 0.103 0.043
1.54 0.168
198.10 320.33 0.00624.00
9.2620.96
130.51
0.067
11.55
0.000.87
0.008
98.55
0.012
649.26
16.79
0.004
0.000.076
0.008 31.11
0.000
9.880
385.48 14.44
0.009
0.003
0.000
1.389
0.000
0.003
Gold -- continued 2
Don Nicolas (DEV)
Average Gold
Grade
Gold Contained
Ozs 10
Measured Indicated Inferred
Tons
Average Gold
Grade
ADDITIONAL MINERALIZED MATERIAL 7,8,9
Average Gold
Grade
PROVEN + PROBABLE RESERVES 4,5,6
Tons
Peñasquito 27
El Toqui
Mara Rosa (DEV)
Don Mario
La India (DEV)
Andacollo
Tons
Average Gold
Grade
El Limon
El Morro (DEV)
8.08
0.003 8.71
0.006 0.04
0.000 0.00
204.020.015
0.048 0.998 0.80
0.196
0.140 7.40 0.133
ROYALGOLD,INC Metal Stream/Royalty Portfolio
As of December 31, 2016 1
4
Tons of Ore
(M) (opt) (M) (M) (opt) (M) (opt) (M) (opt)
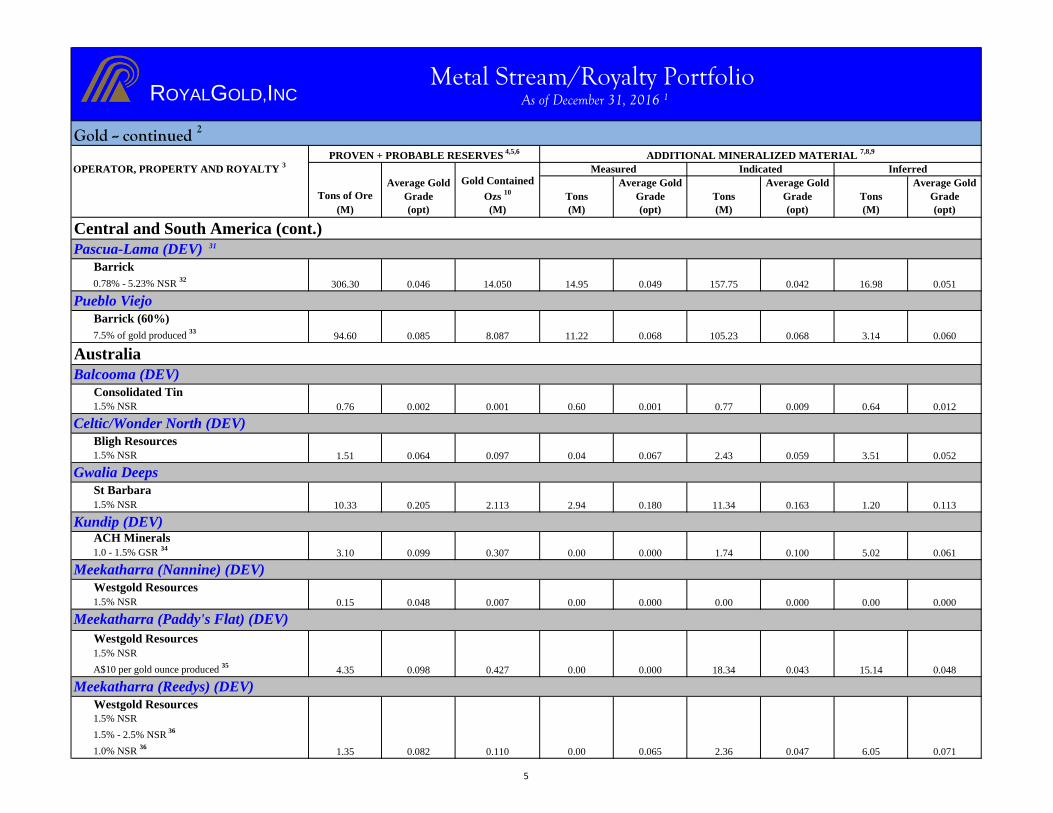
Central and South America (cont.)
Barrick
0.78% - 5.23% NSR 32
Barrick (60%)
7.5% of gold produced 33
Australia
Consolidated Tin1.5% NSR
Bligh Resources1.5% NSR
St Barbara
1.5% NSR
ACH Minerals
1.0 - 1.5% GSR 34
Westgold Resources
1.5% NSR
Westgold Resources
1.5% NSR
A$10 per gold ounce produced 35
Westgold Resources1.5% NSR
1.5% - 2.5% NSR 36
1.0% NSR 36
OPERATOR, PROPERTY AND ROYALTY 3
0.048
3.10
0.15 0.00
0.11310.33
0.000 0.000 0.00 0.000
1.74 0.100
0.007 0.00
0.205
0.061
0.0480.04318.344.35 0.098 0.427 15.140.00 0.000
0.0710.0470.065 6.051.35 0.000.082 0.110 2.36
94.60 0.085 8.087 11.22
0.04
0.60 0.77 0.0120.0090.001
0.059 3.512.430.064
0.002
0.067
0.76
1.51
0.640.001
0.052
0.163 1.202.113
5.02
2.94 0.180 11.34
0.099 0.307 0.00 0.000
105.23
306.30
0.068 3.14
0.051157.75
0.060
0.04214.050 14.95 0.0490.046 16.98
Average Gold
Grade Tons
Average Gold
Grade Tons
Average Gold
Grade
PROVEN + PROBABLE RESERVES 4,5,6
0.097
Indicated Inferred
Tons
Pascua-Lama (DEV) 31
Kundip (DEV)
Gwalia Deeps
Meekatharra (Reedys) (DEV)
Meekatharra (Nannine) (DEV)
ADDITIONAL MINERALIZED MATERIAL 7,8,9
Gold -- continued 2
Celtic/Wonder North (DEV)
Pueblo Viejo
Meekatharra (Paddy's Flat) (DEV)
Balcooma (DEV)
Average Gold
Grade
Gold Contained
Ozs 10
Measured
0.068
ROYALGOLD,INC Metal Stream/Royalty Portfolio
As of December 31, 2016 1
5
Tons of Ore
(M) (opt) (M) (M) (opt) (M) (opt) (M) (opt)
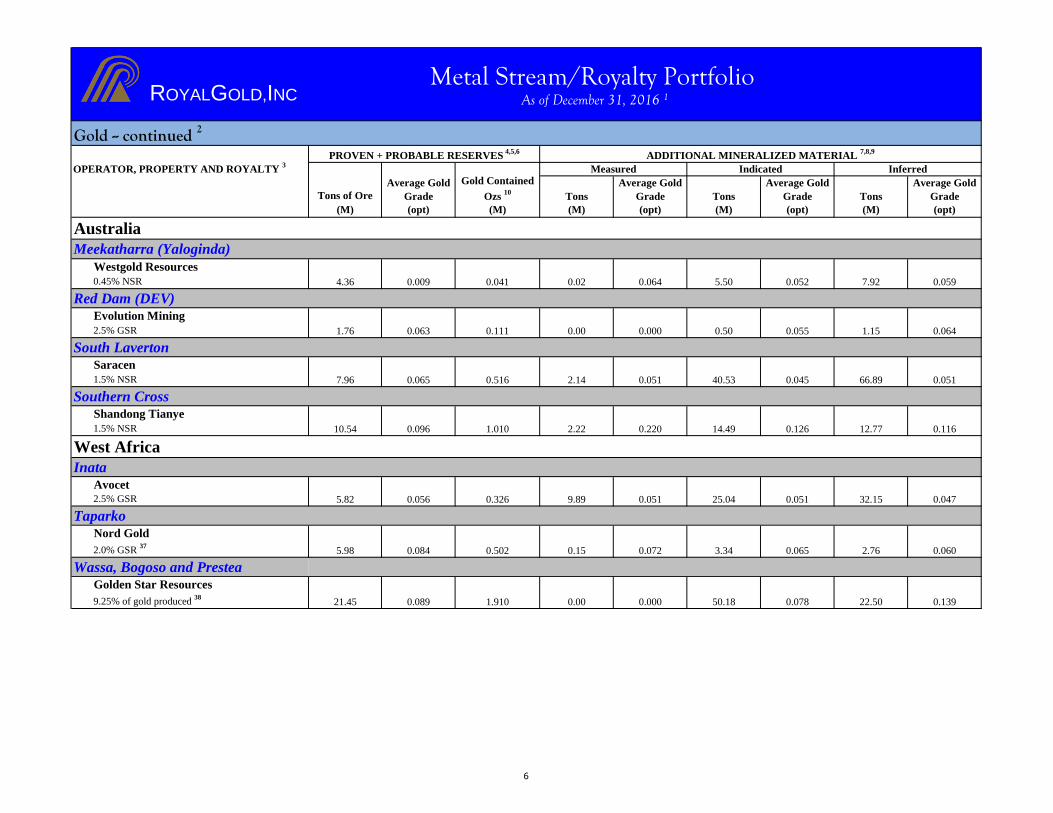
Australia
Westgold Resources
0.45% NSR
Evolution Mining
2.5% GSR
Saracen
1.5% NSR
Shandong Tianye
1.5% NSR
West Africa
Avocet2.5% GSR
Nord Gold
2.0% GSR 37
Golden Star Resources
9.25% of gold produced 38
OPERATOR, PROPERTY AND ROYALTY 3
0.0590.0525.504.36 0.009 0.041 0.02 0.064 7.92
0.063 0.111 0.00 0.000 0.50 0.055 1.151.76 0.064
0.139
2.14 0.0510.045
12.77 0.116
0.326
14.49
9.89
0.000
0.126
0.051
0.051
1.910 22.500.00
5.82
40.53
0.047
21.45
0.220
5.98 0.084 0.502 0.15 0.072 3.34 0.065 2.76 0.060
50.18 0.078
32.150.051
66.89
25.04
0.516
0.096
0.089
0.056
1.01010.54 2.22
7.96 0.065
Average Gold
Grade
Inata
Southern Cross
PROVEN + PROBABLE RESERVES 4,5,6
Wassa, Bogoso and Prestea
South Laverton
Gold -- continued 2
Meekatharra (Yaloginda)
Red Dam (DEV)
Taparko
Gold Contained
Ozs 10
Measured Indicated Inferred
Tons
Average Gold
Grade Tons
Average Gold
Grade Tons
Average Gold
Grade
ADDITIONAL MINERALIZED MATERIAL 7,8,9
ROYALGOLD,INC Metal Stream/Royalty Portfolio
As of December 31, 2016 1
6
(M) (opt) (M) (M) (opt) (M) (opt) (M) (opt)
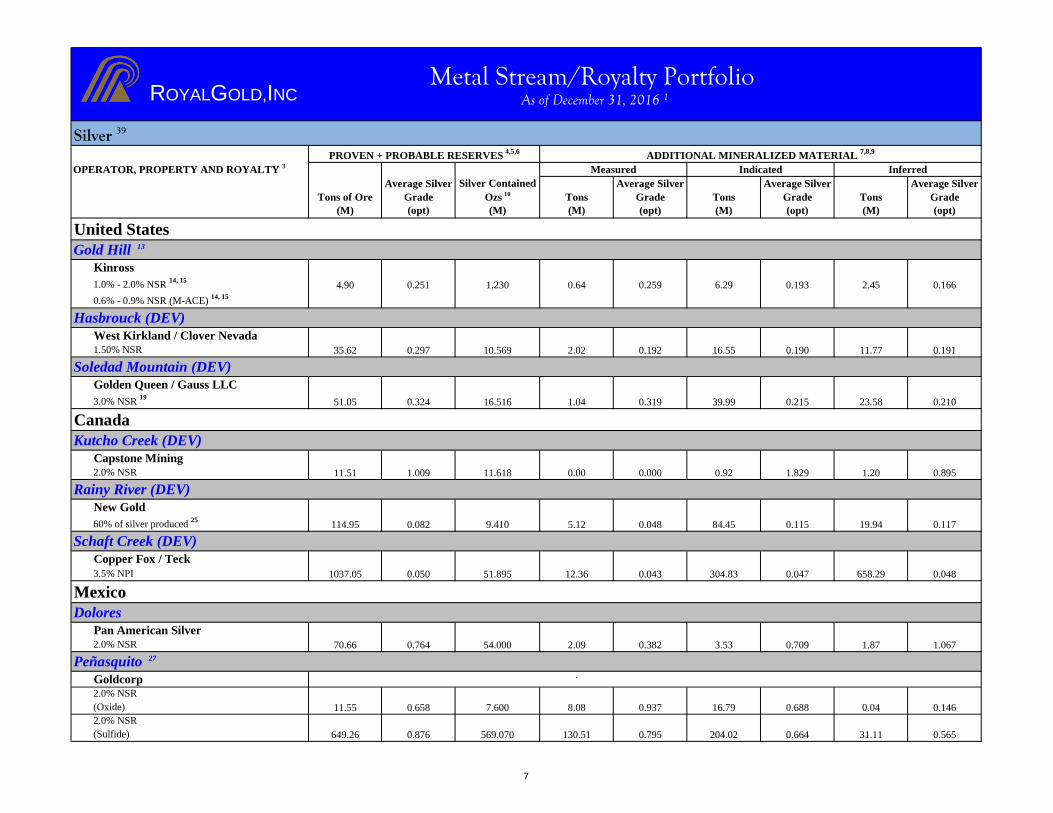
United States
Kinross
1.0% - 2.0% NSR 14, 15
0.6% - 0.9% NSR (M-ACE) 14, 15
West Kirkland / Clover Nevada1.50% NSR
Golden Queen / Gauss LLC
3.0% NSR 19
Canada
Capstone Mining2.0% NSR
New Gold
60% of silver produced 25
Copper Fox / Teck
3.5% NPI
Mexico
Pan American Silver2.0% NSR
Goldcorp `
2.0% NSR
(Oxide)
2.0% NSR
(Sulfide)
OPERATOR, PROPERTY AND ROYALTY 3
54.000 2.09
7.600 8.08 0.937
70.66
0.146
0.7090.382
11.55 0.658 16.79 0.688
0.764
0.565649.26 0.876
1.87
0.04
0.664 31.11569.070 204.020.795130.51
1.20 0.895
658.29
0.00
11.77 0.191
1.230
0.115 19.94 0.117
0.259 6.29 0.193 2.45
5.12 0.048 84.45
0.050
114.95 0.082
0.210
1.8291.009
35.62 0.297 10.569 2.02 0.192 16.55 0.190
0.166
304.830.043
51.05
11.51
9.410
11.618 0.92
1.04 0.3190.324 39.99
0.000
0.215 23.58
12.36
4.90 0.251
16.516
0.64
0.04851.8951037.05 0.047
Soledad Mountain (DEV)
Peñasquito 27
3.53 1.067
Inferred
PROVEN + PROBABLE RESERVES 4,5,6
Gold Hill 13
Silver Contained
Ozs 10
Average Silver
Grade
ADDITIONAL MINERALIZED MATERIAL 7,8,9
Indicated
Kutcho Creek (DEV)
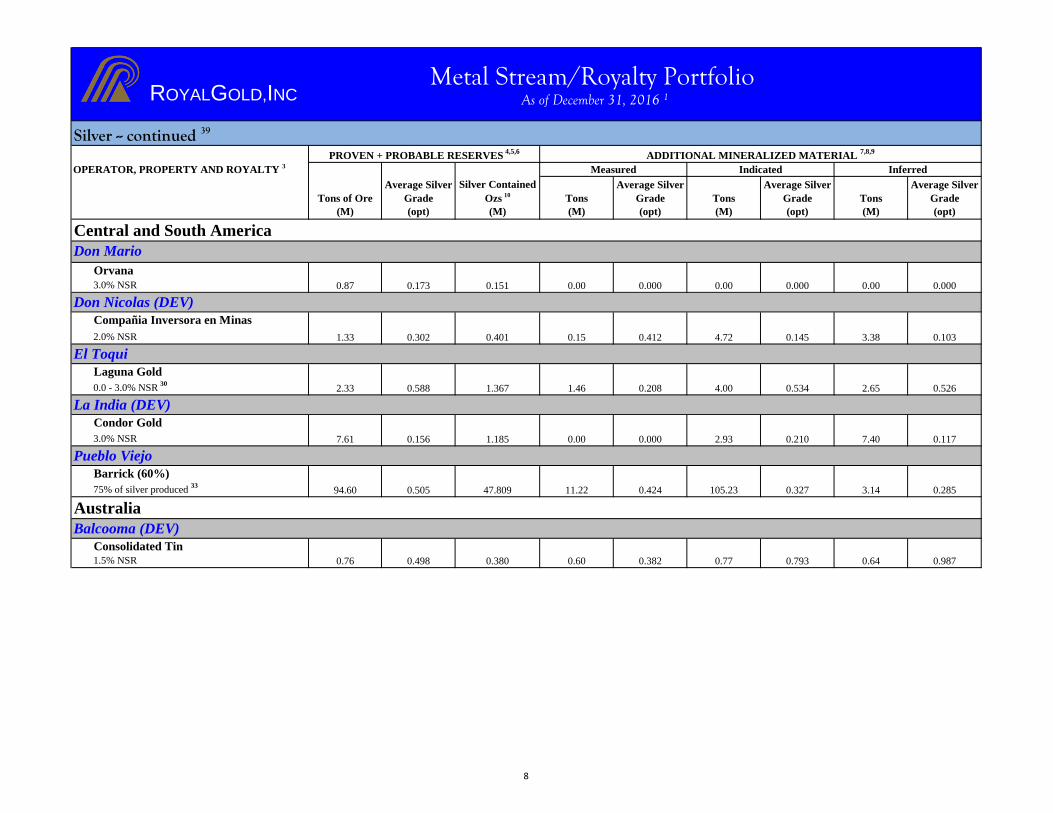
Silver 39
Average Silver
GradeTons of Ore TonsTons
Average Silver
Grade
Rainy River (DEV)
Measured
Average Silver
Grade Tons
Hasbrouck (DEV)
Dolores
Schaft Creek (DEV)
ROYALGOLD,INC Metal Stream/Royalty Portfolio
As of December 31, 2016 1
7
(M) (opt) (M) (M) (opt) (M) (opt) (M) (opt)
Central and South America
Orvana
3.0% NSR
Compañia Inversora en Minas
2.0% NSR
Laguna Gold
0.0 - 3.0% NSR 30
Condor Gold
3.0% NSR
Barrick (60%)
75% of silver produced 33
Australia
Consolidated Tin1.5% NSR
0.412
1.185
Balcooma (DEV)
0.76 0.498 0.380 0.60 0.382 0.77 0.793 0.64 0.987
OPERATOR, PROPERTY AND ROYALTY 3
0.15
105.23
4.72
0.000
0.145
0.526
1.33 0.302
0.87 0.173
3.38
0.151 0.00 0.000
0.000
0.327 3.14 0.285
2.65
0.00 0.000
7.402.93 0.2107.61 0.00
1.46 0.208 4.00 0.534
94.60 0.505 47.809 11.22 0.424
2.33 0.588 1.367
0.00
La India (DEV)
0.1170.156
Average Silver
GradeTons
El Toqui
0.1030.401
Don Mario
Pueblo Viejo
Tons of Ore
Inferred
Tons
Don Nicolas (DEV)
Average Silver
GradeTons
Silver Contained
Ozs 10
Average Silver
Grade
Average Silver
Grade
Silver -- continued 39
PROVEN + PROBABLE RESERVES 4,5,6
ADDITIONAL MINERALIZED MATERIAL 7,8,9
Measured Indicated
ROYALGOLD,INC Metal Stream/Royalty Portfolio
As of December 31, 2016 1
8
(M) (%) (M) (M) (%) (M) (%) (M) (%)
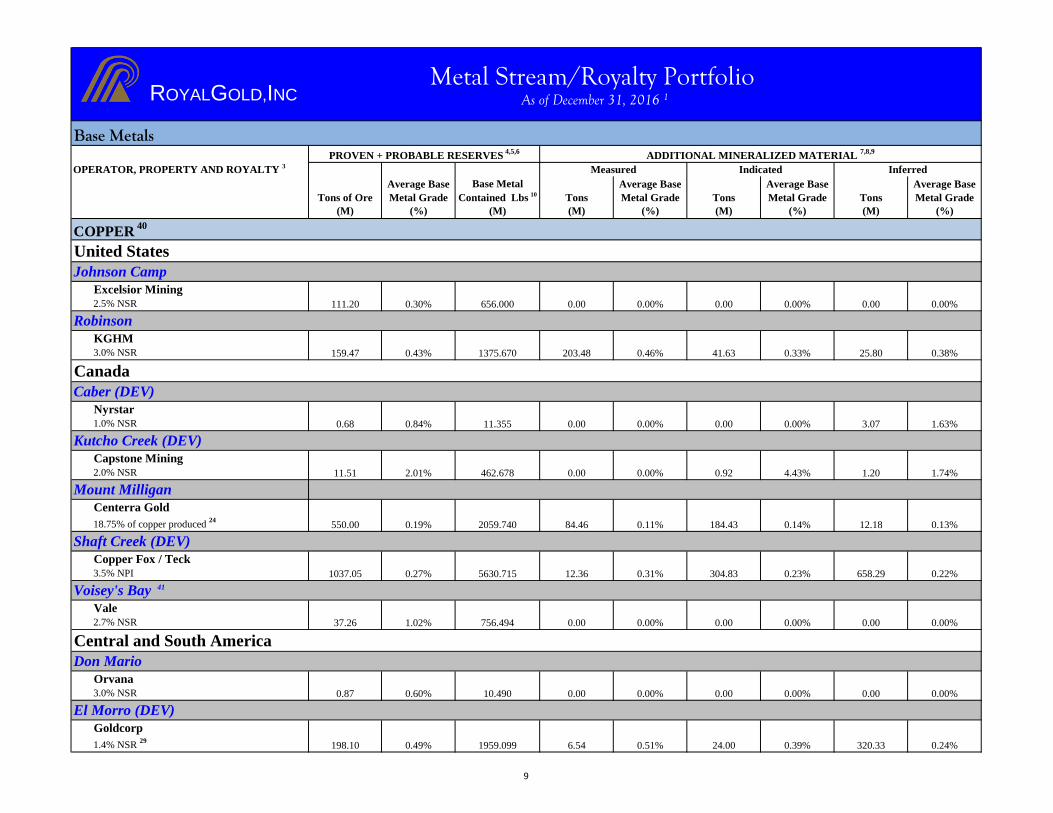
United States
Excelsior Mining2.5% NSR
KGHM3.0% NSR
Canada
Nyrstar1.0% NSR
Capstone Mining2.0% NSR
Centerra Gold
18.75% of copper produced 24
Copper Fox / Teck3.5% NPI
Vale2.7% NSR
Central and South America
Orvana3.0% NSR
Goldcorp
1.4% NSR 29
OPERATOR, PROPERTY AND ROYALTY 3
1037.05
0.38%
304.83
462.678
0.00%
3.07
756.494
0.00% 0.00
159.47
0.00%
0.00%
0.30% 656.000 0.00 0.00%
0.46%
0.22%
0.43%
111.20
0.23% 658.29
1375.670 203.48
2.01%
1.02%
25.80
0.00
0.00
0.27% 5630.715
0.00
37.26
1.20 1.74%
1.63%
0.00%0.00
11.51
0.00 0.00% 0.00
0.68
0.00 0.00%
0.00% 0.92 4.43%
41.63 0.33%
ADDITIONAL MINERALIZED MATERIAL 7,8,9
Tons of Ore
Johnson Camp
12.36 0.31%
0.84% 11.355
0.00
320.33
0.00
Base Metals
Voisey's Bay 41
Shaft Creek (DEV)
COPPER 40
Base Metal
Contained Lbs 10
Don Mario
El Morro (DEV)
Robinson
Kutcho Creek (DEV)
Caber (DEV)
Tons
Average Base
Metal GradeTons
Inferred
Average Base
Metal Grade
0.00%
0.24%
0.00%
24.00 0.39%
0.00%0.000.87 0.60% 10.490
198.10 0.49% 1959.099 6.54 0.51%
Tons
Average Base
Metal Grade
Indicated
Average Base
Metal Grade
Measured
PROVEN + PROBABLE RESERVES 4,5,6
Mount Milligan
550.00 0.19% 2059.740 84.46 0.11% 184.43 0.14% 12.18 0.13%
As of December 31, 2015 1 As of December 31, 2015 1
ROYALGOLD,INC Metal Stream/Royalty Portfolio
As of December 31, 2016 1
9
(M) (%) (M) (M) (%) (M) (%) (M) (%)
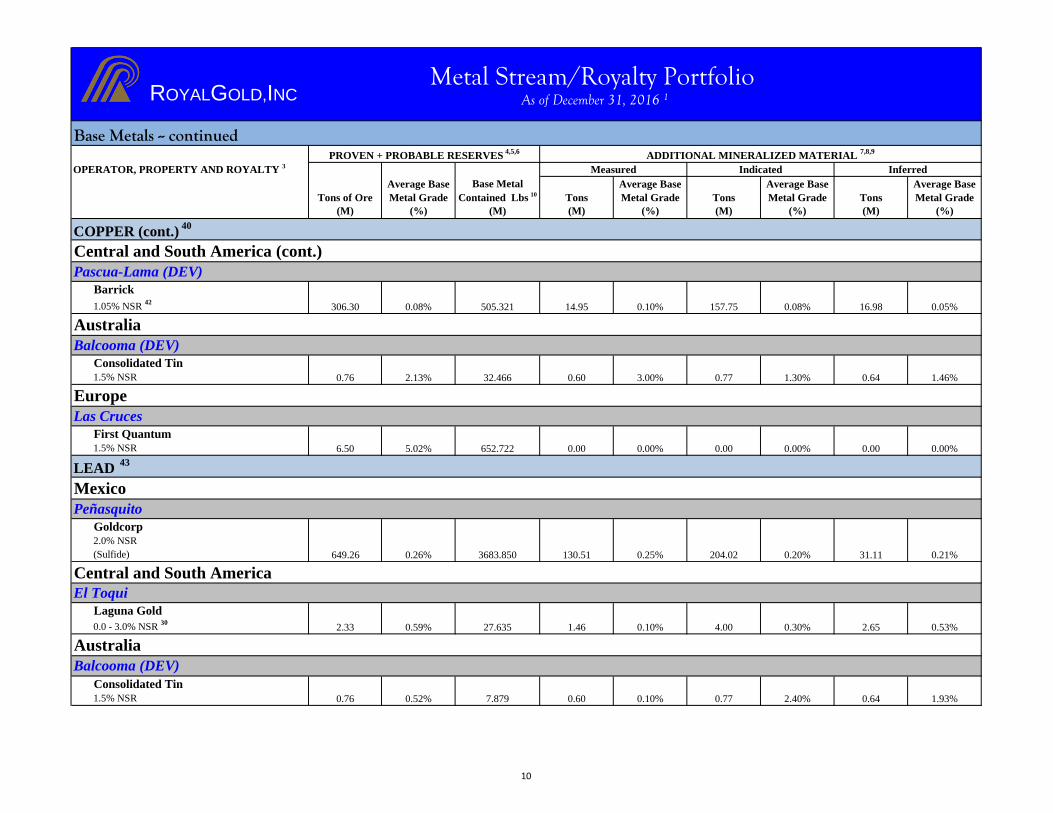
Central and South America (cont.)
Barrick
1.05% NSR 42
Australia
Consolidated Tin1.5% NSR
Europe
First Quantum1.5% NSR
Mexico
Goldcorp2.0% NSR
(Sulfide)
Central and South America
Laguna Gold
0.0 - 3.0% NSR 30
Australia
Consolidated Tin1.5% NSR
505.321
1.46%
0.00
0.60
0.00
2.13% 32.466
31.113683.850 130.51 204.02 0.21%0.20%0.25%
0.53%0.59% 27.635 1.46 4.00 0.30% 2.652.33 0.10%
1.93%7.879 0.640.10%0.52% 0.77 2.40%0.600.76
Peñasquito
LEAD 43
Tons of Ore
Average Base
Metal Grade
Base Metal
Contained Lbs 10 Tons
Pascua-Lama (DEV)
Average Base
Metal Grade
PROVEN + PROBABLE RESERVES 4,5,6
Average Base
Metal Grade
Base Metals -- continued
Tons
Average Base
Metal Grade
Balcooma (DEV)
Las Cruces
Tons
Measured Indicated
COPPER (cont.) 40
Inferred
ADDITIONAL MINERALIZED MATERIAL 7,8,9
OPERATOR, PROPERTY AND ROYALTY 3
0.10%
0.00%
16.9814.95 0.05%
0.00 0.00%
306.30 0.08%
0.641.30%0.76
652.722
157.75 0.08%
6.50 5.02% 0.00%
3.00% 0.77
649.26 0.26%
Balcooma (DEV)
El Toqui
ROYALGOLD,INC Metal Stream/Royalty Portfolio
As of December 31, 2016 1
10
(M) (%) (M) (M) (%) (M) (%) (M) (%)
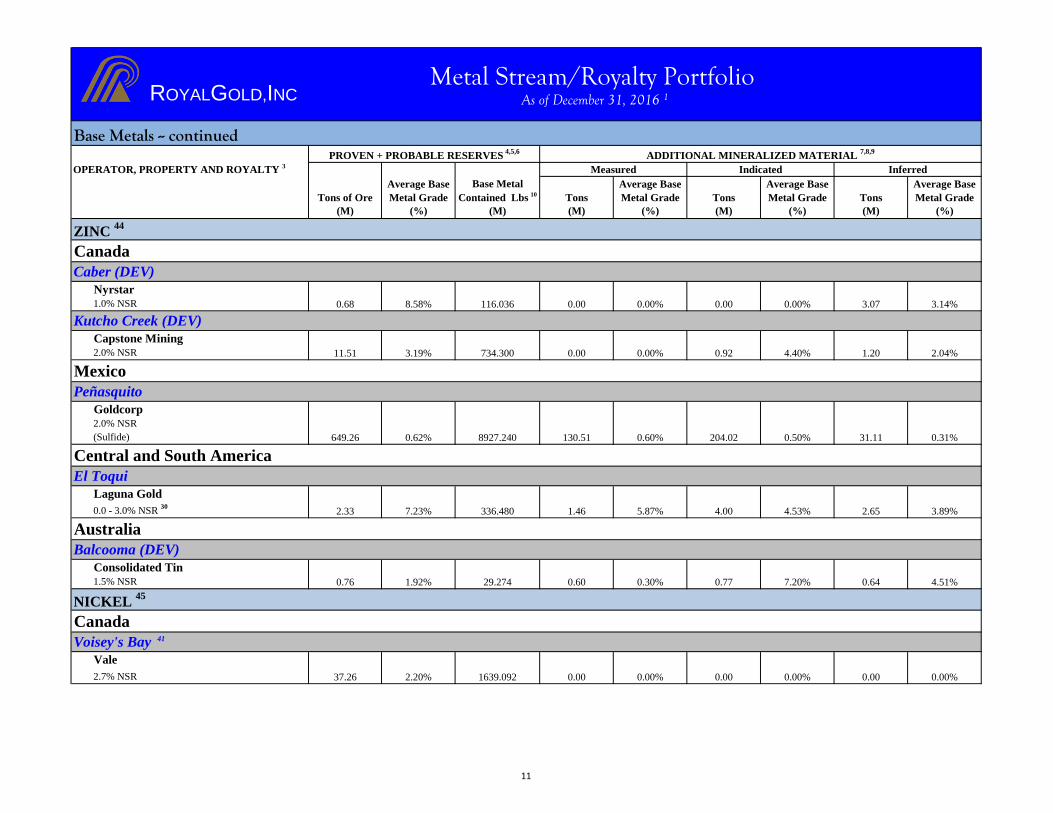
Canada
Nyrstar1.0% NSR
Capstone Mining2.0% NSR
Mexico
Goldcorp2.0% NSR
(Sulfide)
Central and South America
Laguna Gold
0.0 - 3.0% NSR 30
Australia
Consolidated Tin1.5% NSR
Canada
Vale
2.7% NSR
OPERATOR, PROPERTY AND ROYALTY 3
130.51 0.60% 204.02 0.50% 31.11 0.31%
37.26 0.00 0.00% 0.00%0.002.20% 1639.092 0.00 0.00%
0.30% 0.77 7.20% 0.640.76 1.92% 29.274 0.60 4.51%
2.65 3.89%
0.00 0.00% 0.00%0.68 8.58%
1.46 5.87% 4.00 4.53%2.33 7.23% 336.480
11.51 3.19% 734.300 0.00
649.26 0.62% 8927.240
3.07
1.20
116.036
2.04%4.40%
0.00
0.00% 0.92
3.14%
Indicated
Base Metals -- continuedADDITIONAL MINERALIZED MATERIAL
7,8,9
Inferred
Tons of Ore
Average Base
Metal Grade
Base Metal
Contained Lbs 10
Measured
PROVEN + PROBABLE RESERVES 4,5,6
Tons
Caber (DEV)
Average Base
Metal Grade Tons
Average Base
Metal Grade Tons
Average Base
Metal Grade
Balcooma (DEV)
Voisey's Bay 41
NICKEL 45
Peñasquito
Kutcho Creek (DEV)
El Toqui
ZINC 44
ROYALGOLD,INC Metal Stream/Royalty Portfolio
As of December 31, 2016 1
11
(M) (%) (M) (M) (%) (M) (%) (M) (%)
Canada
Vale
2.7% NSR
Canada
Copper Fox / Teck3.5% NPI
OPERATOR, PROPERTY AND ROYALTY 3
0.00%37.26
373.340 12.36 0.00% 304.831037.05 0.02%
0.13% 96.871
0.01% 658.29 0.02%
0.00% 0.000.00 0.00%0.00
MOLYBDENUM 47
Schaft Creek (DEV)
Voisey's Bay 41
COBALT 46
Base Metals -- continued
Average Base
Metal GradeTons of Ore
Average Base
Metal Grade
Base Metal
Contained Lbs 10
Measured Indicated Inferred
Tons Tons
Average Base
Metal Grade Tons
Average Base
Metal Grade
PROVEN + PROBABLE RESERVES 4,5,6
ADDITIONAL MINERALIZED MATERIAL 7,8,9
ROYALGOLD,INC Metal Stream/Royalty Portfolio
As of December 31, 2016 1
12

1
2
3
4
5 Royal Gold has disclosed a number of reserve estimates that are provided by operators that are foreign issuers and are not based on the U.S. Securities and Exchange
Commission's definitions for proven and probable reserves. For Canadian issuers, definitions of "mineral reserve," "proven mineral reserve," and "probable mineral
reserve" conform to the Canadian Institute of Mining, Metallurgy and Petroleum definitions of these terms as of the effective date of estimation as required by National
Instrument 43-101 of the Canadian Securities Administrators. For Australian issuers, definitions of "mineral reserve," "proven mineral reserve," and "probable mineral
reserve" conform with the Australasian Code for Reporting of Mineral Resources and Ore Reserves prepared by the Joint Ore Reserves Committee of the Australasian
Institute of Mining and Metallurgy, Australian Institute of Geoscientists and Minerals Council of Australia, as amended ("JORC Code"). Royal Gold does not reconcile
the reserve estimates provided by the operators with definitions of reserves used by the U.S. Securities and Exchange Commission.
Footnotes
“Reserve” is that part of a mineral deposit which could be economically and legally extracted or produced at the time of the reserve determination.
“Proven (Measured) Reserves” are reserves for which (a) quantity is computed from dimensions revealed in outcrops, trenches, workings or drill holes, and the grade is
computed from the results of detailed sampling, and (b) the sites for inspection, sampling and measurement are spaced so closely and the geologic character is so well
defined that the size, shape, depth and mineral content of the reserves are well established.
“Probable (Indicated) Reserves” are reserves for which the quantity and grade are computed from information similar to that used for proven (measured) reserves, but
the sites for inspection, sampling and measurement are farther apart or are otherwise less adequately spaced. The degree of assurance of probable (indicated) reserves,
although lower than that for proven (measured) reserves, is high enough to assume geological continuity between points of observation.
Gold reserves were calculated by the operators at the following per ounce prices: A$1,550 – Meekatharra (Nannine, Paddy's Flat, Reedys and Yaloginda) and Southern
Cross; A$1,500 – South Laverton; $1,450 – Kundip; A$1,400 – Celtic/Wonder North; $1,366 – Schaft Creek; A$1,350 – Gwalia; A$1,310 – Red Dam; $1,300 –
Dolores, El Morro and Pinson; $1,250 – Back River, El Limon, Holt, Inata, La India, Marigold, Mulatos, Soledad Mountain and Wharf; $1,225 – Hasbrouck Mountain;
$1,200 – Andacollo, Bald Mountain, Canadian Malartic, El Toqui, Gold Hill, Leeville, Mara Rosa, Mount Milligan, Pascua-Lama, Peñasquito, Robinson, Taparko and
Twin Creeks; $1,100 – Don Mario, Don Nicolas, Ruby Hill and Wassa and Prestea; $1,000 – Cortez, Goldstrike, Pueblo Viejo and Williams; and $983 – Pine Cove.
No gold price was reported for Balcooma, Caber or Kutcho Creek.
See royalty definitions on page 18.
Set forth below are the definitions of proven and probable reserves used by the U.S. Securities and Exchange Commission.
Reserves have been reported by the operators of record as of December 31, 2016, with the exception of the following properties: Mara Rosa – March 7, 2017; Don
Mario – September 30, 2016; Southern Cross – July 24, 2016; Gwalia Deeps, Meekatharra (Nannine, Paddy's Flat, Reedys and Yaloginda) and Peñasquito – June 30,
2016; El Toqui, Red Dam, Robinson, Taparko – December 31, 2015; Back River – August 15, 2015; South Laverton – June 30, 2015; Hasbrouck Mountain – June 3,
2015; El Morro, Inata, La India, Pinson, Rainy River, Ruby Hill and Soledad Mountain – December 31, 2014; Kundip – June 30, 2014; Celtic/Wonder North –
November 21, 2013; Schaft Creek – December 31, 2012; Don Nicolas and Johnson Camp – December 31, 2011; Balcooma – June 30, 2011; Kutcho Creek – February
15, 2011; Pine Cove – June 30, 2010; and Caber – July 18, 2007.
For further information about Royal Gold, Inc.'s metal streams, royalties and similar interests, please see our Annual Report on Form 10-K and other Public Reports.
ROYALGOLD,INC Metal Stream/Royalty Portfolio
As of December 31, 2016 1
13
6
7
8
9
10
11
12 GSR sliding-scale schedule (price of gold per ounce – royalty rate): Below $210 – 0.40%; $210 to $229.99 – 0.50%; $230 to $249.99 – 0.75%; $250 to $269.99 –
1.30%; $270 to $309.99 – 2.25%; $310 to $329.99 – 2.60%; $330 to $349.99 – 3.00%; $350 to $369.99 – 3.40%; $370 to $389.99 – $3.75%; $390 to $409.99 – 4.0%;
$410 to $429.99 – 4.25%; $430 to $449.99 – 4.50%; $450 to $469.99 – 4.75%; $470 and higher – 5.00%.
“Contained ounces” or “contained pounds” do not take into account recovery losses in mining and processing the ore.
Mineralized material is that part of a mineral system that has potential economic significance but cannot be included in the proven and probable ore reserve estimates
until further drilling and metallurgical work is completed, and until other economic and technical feasibility factors based upon such work have been resolved. The U.S.
Securities and Exchange Commission does not recognize this term. Investors are cautioned not to assume that any part or all of the mineral deposits in these categories
will ever be converted into reserves.
Some of the operators are Canadian and Australian issuers. Canadian and Australian issuers use the terms "mineral resources" and its subcategories "measured,"
"indicated" and "inferred" mineral resources. For Canadian issuers, the definitions of "mineral resource," "measured mineral resource," "indicated mineral resource" and
"inferred mineral resource" conform to the Canadian Institute of Mining, Metallurgy and Petroleum definitions of those terms as of the effective date of estimation, as
required by National Instrument 43-101 of the Canadian Securities Administrators. For Australian issuers, the definitions of "mineral resource," "measured mineral
resource," "indicated mineral resource" and "inferred mineral resource" conform with the JORC Code. While such terms are recognized and required by Canadian and
Australian regulations, the U.S. Securities and Exchange Commission does not recognize them. In each case, the mineralized material reported hereunder are estimates
previously disclosed by the relevant operator, without reference to the underlying data used to calculate the estimates. Accordingly, Royal Gold is not able to reconcile
the estimates prepared in reliance on National Instrument 43-101 or JORC Code with terms recognized by the U.S. Securities and Exchange Commission. Investors are
cautioned not to assume that any part or all of the mineral deposits in these categories will ever be converted into reserves.
The additional mineralized material reported are either estimates received by the various operators or are based on documentation material provided to Royal Gold or
which is derived from recent publicly available information from the operators of the various properties or various recent National Instrument 43-101 or JORC Code
reports filed by operators. Accordingly, Royal Gold is not able to reconcile the resource estimates prepared in reliance on National Instrument 43-101 or JORC Code
with definitions of the U.S. Securities and Exchange Commission. Investors are cautioned not to assume that any part or all of the mineral deposits in these categories
will ever be converted into reserves.
Footnotes (continued)The reserves reported are either estimates received from the various operators or are based on documentation material provided to Royal Gold or which is derived from
recent publicly available information from the operators of the various properties or various recent National Instrument 43-101 or JORC Code reports filed by operators.
Accordingly, Royal Gold is not able to reconcile the reserve estimates prepared in reliance on National Instrument 43-101 or JORC Code with definitions of the U.S.
Securities and Exchange Commission.
NSR sliding-scale schedule (price of gold per ounce – royalty rate): Below $375 – 1.75%; >$375 to $400 – 2.0%; >$400 to $425 – 2.25%; >$425 – 2.5%. All price
points are stated in 1986 dollars and are subject to adjustment in accordance with a blended index comprised of labor, diesel fuel, industrial commodities and mining
machinery.
ROYALGOLD,INC Metal Stream/Royalty Portfolio
As of December 31, 2016 1
14
13
14
15
16
17
18
19
20
21
22
23
24
25
26
27
28
29
30
New Gold will deliver: (a) gold in amounts equal to 6.50% of gold produced until 230,000 ounces have been delivered, and 3.25% of gold produced thereafter, and (b)
silver in amounts equal to 60% of silver produced until 3.10 million ounces have been delivered, and 30% of silver produced thereafter, in each case at a purchase price
equal to 25% of the spot price per ounce delivered.
Royalty only applies to Section 29 which currently holds about 95% of the reserves reported for the property.
The 0.6% to 0.9% sliding-scale NSR applies to the M-ACE claims. The operator did not break out reserves or resources subject to the M-ACE claims royalty.
Teck will deliver gold in amounts equal to 100% of payable gold until 900,000 ounces have been delivered, and 50% of payable gold thereafter, subject to a fixed
payable percentage of 89%, at a purchase price equal to 15% of the monthly average gold price for the month preceding the delivery date for each ounce delivered.
The Company’s royalty is subject to a 2.0 million ounce cap on gold production. There have been approximately 1.67 million ounces of cumulative production as of
March 31, 2017. NSR sliding-scale schedule (price of gold per ounce – royalty rate): $0.00 to $299.99 – 1.0%; $300 to $324.99 – 1.50%; $325 to $349.99 – 2.0%;
$350 to $374.99 – 3.0%; $375 to $399.99 – 4.0%; $400 or higher – 5.0%.
The 1.0% to 2.0% sliding-scale schedule (price of gold per ounce – royalty rate): Below $350 – 1.0%; > $350 – 2.0%. The 0.6% to 0.9% NSR sliding-scale schedule
(price of gold per ounce – royalty rate): Below $300 – 0.6%; $300 to $350 – 0.7%; > $350 to $400 – 0.8%; > $400 – 0.9%. The silver royalty rate is based on the
price of gold.
NSR sliding-scale schedule (price of gold per ounce – royalty rate): $0.00 to under $350 – 0.0%; $350 to under $400 – 0.5%; $400 to under $500 – 1.0%; $500 or
higher – 2.0%.
George Lake royalty applies to production above 800,000 ounces.
Goose Lake royalty applies to production above 400,000 ounces.
Thompson Creek will deliver 35% of gold produced and 18.75% of copper produced. The purchase price for gold is equal to the lesser of $435 per ounce delivered or
the prevailing spot price and the purchase price for copper is 15% of the spot price per metric tonne delivered.
NSR sliding-scale schedule (price of gold per ounce – royalty rate): $0.00 to $350 – 1.0%; above $350 – 1.5%.
The royalty covers approximately 30% of the La Fortuna deposit. Reserves attributable to Royal Gold's royalty represent 3/7 of Goldcorp's reporting of 70% of the total
reserve.
All metals are paid based on zinc prices. NSR sliding-scale schedule (price of zinc per pound – royalty rate): Below $0.50 – 0.0%; $0.50 to below $0.55 – 1.0%; $0.55
to below $0.60 – 2.0%; $0.60 or higher – 3.0%.
An additional Cordilleran royalty applies to a portion of Section 28.
Additional Rayrock royalties apply to Sections 28, 32 and 33; these royalty rates vary depending on pre-existing royalties. The Rayrock royalties take effect once
200,000 ounces of gold have been produced from open pit mines on the property. As of March 31, 2017, approximately 103,000 ounces have been produced.
Royalty is capped at $300,000 plus simple interest.
Operator reports reserves by material type. The sulfide material will be processed by milling. The oxide material will be processed by heap leaching.
Footnotes (continued)The royalty is capped at $10 million. As of March 31, 2017, royalty payments of approximately $4.7 million have been received.
ROYALGOLD,INC Metal Stream/Royalty Portfolio
As of December 31, 2016 1
15
31
32
33
34
35
36
37
38
39
40
41
42
Barrick will deliver: (a) gold in amounts equal to 7.50% of Barrick’s 60% interest in gold produced until 990,000 ounces have been delivered, and 3.75% of Barrick’s
60% interest in gold produced thereafter, at a purchase price equal to 30% of the spot price per ounce delivered until 550,000 ounces have been delivered, and 60% of
the spot price per ounce delivered thereafter; and (b) silver in amounts equal to 75% of Barrick’s 60% interest in silver produced, subject to a minimum silver recovery
of 70%, until 50 million ounces have been delivered, and 37.50% of Barrick’s 60% interest in silver produced thereafter, at a purchase price equal to 30% of the spot
price per ounce delivered until 23.10 million ounces of silver have been delivered, and 60% of the spot price per ounce delivered thereafter.
Golden Star will deliver 9.25% of gold produced, until the earlier of (a) December 31, 2017 or (b) the date at which the Wassa and Prestea underground projects achieve
commercial production, at which point Golden Star will deliver 10.5% (or 10.9% if Royal Gold’s total investment increases from $145 million to $150 million) of gold
produced until 240,000 ounces have been delivered (or 250,000 ounces if the total investment increases from $145 million to $150 million), at a purchase price equal to
20% of the spot price per ounce delivered. Thereafter, Golden Star will deliver 5.5% of gold produced, at a purchase price equal to 30% of the spot price per ounce
delivered.
Copper reserves were calculated by the operators at the following prices per pound: $3.52 – Schaft Creek; $3.21 – Robinson; $3.00 – El Morro; $2.95 – Mount
Milligan; $2.75 – Don Mario and Pascua Lama; $2.70 – Las Cruces; $2.61 – Voisey's Bay; and $2.50 – Johnson Camp. No copper reserve price was reported for
Balcooma, Caber or Kutcho Creek.
Additional mineralized material figures are from December 31, 2005 and have not been updated by the operator.
Royalty applies to all copper production from an area of interest in Chile. Only that portion of the reserves pertaining to our royalty interest in Chile is reflected here.
This royalty will take effect after January 1, 2017.
There is a 0.75% GSR milling royalty that applies to ore that is mined outside of the defined area of the Taparko-Bouroum project that is processed through the Taparko
facilities up to a maximum of 1.1 million tons per year.
Silver reserves were calculated by the operators at the following prices per ounce: $25.96 – Schaft Creek; $25.00 – Don Nicolas; $20.00 – Gold Hill; $18.50 – Dolores;
$18.00 – El Toqui and Peñasquito; $17.50 – Hasbrouck Mountain; $17.00 – Soledad; $16.50 – Don Mario; and $13.75 – Pueblo Viejo. No silver price was reported for
Balcooma or Kutcho Creek.
Footnotes (continued)
The royalty rate is 1.0% until 250,000 ounces of gold have been recovered, and 1.5% thereafter.
The A$10 per ounce royalty applies on production above 50,000 ounces.
The 1.5% to 2.5% NSR sliding-scale royalty pays at a rate of 1.5% for the first 75,000 ounces produced in any 12 month period and at a rate of 2.5% on production
above 75,000 ounces during that 12 month period. The 1.0% NSR royalty applies to the Rand area only.
NSR sliding-scale schedule (price of gold per ounce – royalty rate): less than or equal to $325 – 0.78%; $400 – 1.57%; $500 – $2.72%; $600 – 3.56%; $700 – 4.39%;
greater than or equal to $800 – 5.23%. Royalty is interpolated between lower and upper endpoints.
Royalty applies to all gold production from an area of interest in Chile. Only that portion of the reserves pertaining to our royalty interest in Chile is reflected here.
Approximately 20% of the royalty is limited to the first 14.0 million ounces of gold produced from the project. Also, 24% of the royalty can be extended beyond 14.0
million ounces produced for $4.4 million. In addition, a one-time payment totaling $8.4 million will be made if gold prices exceed $600 per ounce for any six-month
period within the first 36 months of commercial production.
ROYALGOLD,INC Metal Stream/Royalty Portfolio
As of December 31, 2016 1
16
43
44
45
46
47
NOTE: Not included in the Metal Stream/Royalty Portfolio are Allan, Belcourt, Rambler North, Sega, Skyline and one oil and gas property.
Lead reserve price was calculated by the operators at the following prices per pound: $0.91 – El Toqui; and $0.90 – Peñasquito. No lead reserve price was reported for
Balcooma.
Zinc reserve price was calculated by the operators at the following prices per pound: $0.95 – El Toqui and Peñasquito. No zinc reserve price was reported for
Balcooma, Caber or Kutcho Creek.
Nickel reserve price was calculated by the operator at the following price per pound: $5.79 – Voisey's Bay.
Cobalt reserve price was calculated by the operator at the following price per pound: $12.70 – Voisey's Bay.
Molybdenum reserve price was calculated by the operator at the following price per pound: $15.30 – Schaft Creek.
Footnotes (continued)
ROYALGOLD,INC Metal Stream/Royalty Portfolio
As of December 31, 2016 1
17

Sliding-Scale Royalty: A royalty rate that fluctuates based on contract-specified variables such as metal price or production volume.
Net Smelter Return (“NSR”) Royalty: A defined percentage of the gross revenue from a resource extraction operation, less a proportionate share of incidental
transportation, insurance, refining and smelting costs.
Net Value Royalty (“NVR”): A defined percentage of the gross revenue from a resource extraction operation, less certain contract-defined costs.
Royalty: The right to receive a percentage or other denomination of mineral production from a mining operation.
Gross Smelter Return (“GSR”) Royalty: A defined percentage of the gross revenue from a resource extraction operation, less, if applicable, certain contract-defined
costs paid by, or charged to, the operator.
Gross Value ("GV") Royalty: A defined percentage of the gross value, revenue or proceeds from a resource extraction operation, without deductions of any kind.
Stream: A purchase agreement that provides, in exchange for an upfront deposit payment, the right to purchase all or a portion of one or more metals produced from a
mine, at a price determined for the life of the transaction by the purchase agreement.
Milling Royalty: A royalty on ore throughput at a mill.
Net Profits Interest (“NPI”) Royalty: A defined percentage of the gross revenue from a resource extraction operation, after recovery of certain contract-defined pre-
production costs, and after deduction of certain contract-defined mining, milling, processing, transportation, administrative, marketing and other costs.
Glossary
The Company’s royalty portfolio contains several different types of royalties or similar interests which are defined as follows:
ROYALGOLD,INC Metal Stream/Royalty Portfolio
As of December 31, 2016 1
18