metalloinvest jpmorgan 2011 · pdf filestrategic location of key production assets* 6 ... *...
TRANSCRIPT

METALLOINVEST
J.P. Morgan Annual Russia Credit Conference
Moscow November 2011
Corporate presentation

Disclaimer
1
Assumes the following RUB/USD FX rates for 2008, 2009, 2010, H1 2011 and 9M 2011: daily average over the period – 24.8553, 31.7231, 30.3692, 28.6242 and 28.7664 respectively;
at balance sheet dates – 29.3804, 30.2442, 30.4769, 28.0758 and 31.8751 respectively.
These materials contains certain forward-looking statements, particularly those relating to anticipated demand and consumption, global economic recovery,
commodity prices, management aims and objectives, strategy, production, anticipated investment and the anticipated completion of previously announced
transactions. Metalloinvest will not update these statements to reflect events and circumstances occurring after the date hereof. By their nature, forward-looking
statements involve risks and uncertainties because they relate to events and depend on circumstances that will or may occur in the future. Actual results may differ
from those expressed in such statements depending on a variety of factors, including future levels of industry product supply, demand and pricing, operational
problems, general economic conditions, political stability and economic growth in relevant areas of the world, changes in laws and governmental regulations,
exchange rate fluctuations, development and use of new technology, changes in public expectations and other changes in business conditions, the actions of
competitors, natural disasters and adverse weather conditions, wars and acts of terrorism or sabotage, other factors discussed elsewhere in this document, as well
as many other risks affecting Metalloinvest and its operations.
These materials does not constitute or form part of any advertisement of securities, any offer or invitation to sell or issue or any solicitation of any offer to purchase
or subscribe for, any securities of Metalloinvest in any jurisdiction, nor shall they or any part of them nor the fact of their presentation, communication or distribution
form the basis of, or be relied on in connection with, any contract or investment decision. No representation or warranty, express or implied, is given by
Metalloinvest, its affiliates or any of their respective advisers, officers, employees or agents, as to the accuracy of the information or opinions or for any loss
howsoever arising, directly or indirectly, from any use of these materials or their contents.

Agenda
2
o METALLOINVEST overview
o Market positions
o Debt profile
o Strategy
o Appendices
3
11
14
19
24
METALLOINVEST overview
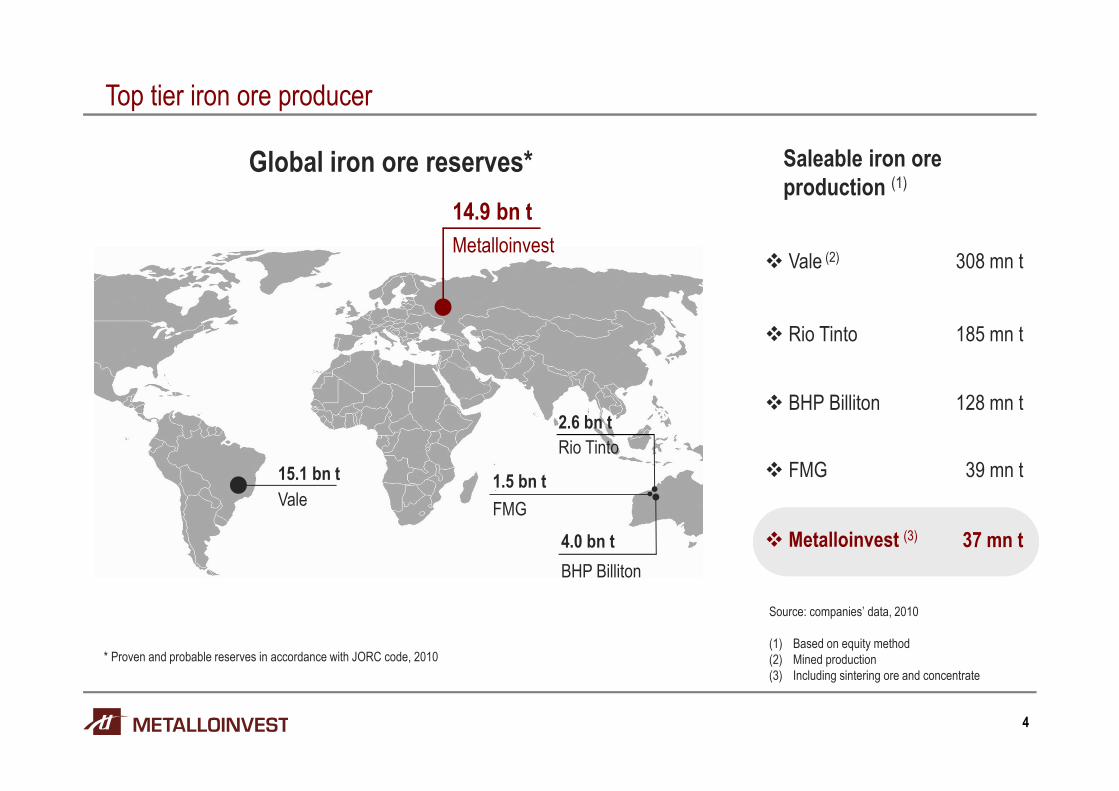
Top tier iron ore producer
4
� Metalloinvest (3) 37 mn t
14.9 bn t
Global iron ore reserves*
* Proven and probable reserves in accordance with JORC code, 2010
15.1 bn t
Vale
Metalloinvest
FMG
1.5 bn t
Saleable iron ore
production (1)
� Vale (2)
� Rio Tinto
� BHP Billiton
� FMG
308 mn t
185 mn t
128 mn t
39 mn t
BHP Billiton
Rio Tinto
4.0 bn t
2.6 bn t
Source: companies’ data, 2010
(1) Based on equity method
(2) Mined production
(3) Including sintering ore and concentrate
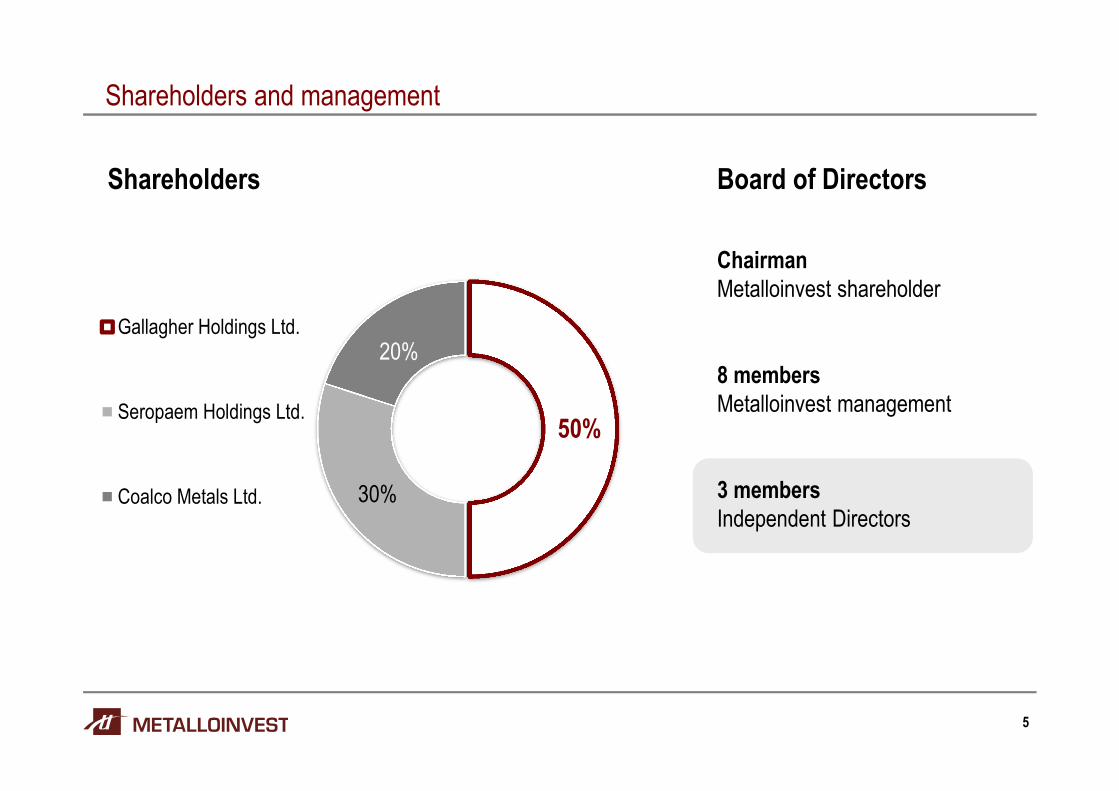
Shareholders and management
5
50%
30%
20%Gallagher Holdings Ltd.
Seropaem Holdings Ltd.
Coalco Metals Ltd.
Shareholders Board of Directors
Chairman
Metalloinvest shareholder
8 members
Metalloinvest management
3 members
Independent Directors

Strategic location of key production assets*
6
LGOK
• The largest iron ore producer in the CIS
• The highest quality among CIS peers
• The largest HBI producer in Europe and
CIS
Reserves 4.2 bn t
Concentrate
Pellets
HBI
19.8 mn t
8.8 mn t
2.3 mn t
MGOK
• The largest standalone iron ore reserves
in CIS
• 2nd largest Russian iron ore producer
• First to introduce flotation technology in
Russia
Reserves 10.7 bn t
Concentrate
Pellets
15.3 mn t
9.7 mn t
OEMK
• Unique coke-free technology
• Low-cost producer
• Maintained 100% capacity through crisis
Pellets
DRI
Crude steel
Steel products
3.5 mn t
2.4 mn t
3.3 mn t
3.1 mn t
Ural Steel
• High value-added niche steel products
• Large producer of merchant pig iron
• 50% self-sufficiency in electricity
Hot metal
Crude steel
Steel products
2.6 mn t
2.8 mn t
2.3 mn t
RUSSIA
MGOK
LGOK
OEMK Ural Steel
Open pit mining (project)Steelmaking
Open pit mining
Udokan
* Production figures in the charts stand for 2010

2.1 2.2 2.3 1.8
2.4 2.4 2.4
2.0
4.5 4.6 4.73.8
2008 2009 2010 9M 2011
LGOK (HBI) OEMK (DRI)
8.0 7.5 8.86.6
8.5 8.59.7
7.4
3.5 3.4
3.5
2.9
20.0 19.422.0
16.8
2008 2009 2010 9M 2011
LGOK MGOK OEMK
Key production figures
7
19.7
16.0
19.8
16.4
15.6
13.8
15.3
12.2
35.4
29.9
35.1
28.7
2008 2009 2010 9M 2011
LGOK MGOK
Pellets
HBI/DRI
Iron ore concentrate, mn t High value-added iron ore products, mn t
65-70%

Diversified customer base with focus on EM
8
Iron ore mining plants Key customers
RUSSIA & CIS
MMK
NLMK
Evraz
Mechel
China & South East Asia
Baosteel Group
Hebei Jingye I&S
Kobe Steel
Xilin Group
Europe & MENA
ArcelorMittal
Tata Corus
US Steel Kosice
Gulf Industrial Investment
30%
43%
27%
* Figures are based on the Company’s iron ore, pellets and HBI/DRI shipments in tonnes for 9M 2011

Financials performance
9
9.3
4.7
7.2
5.1
3.6
0.8
2.62.0
0.3 0.4
1.21.0
0
1
2
3
4
5
6
7
8
9
10
2008 2009 2010 H1 2011
Revenue
EBITDA
Net Income
USD bn

Key strengths
10
Best-in-class profitability metrics
#2iron ore reserve base
in the world
#5global iron ore player
& regional champion
#1supplier of merchant HBI
in the world
#1cost curve ranking
in pellets & HBI
Market positions

A leading supplier of high value-added iron ore products*
12
64%
36%
HBI
World Metalloinvest
89%
11%
Pellets
World Metalloinvest
Source: AME, Company data, 2010 Source: CRU, Company data, 2010
* Charts provide the data on the Company’s market share in global shipments

The highest performance among Russian peers
13
21%
6%
18% 17%
39%
25%
28%27%
39%
18%
36%39%
0%
10%
20%
30%
40%
50%
2008 2009 2010 H1 2011
EBITDA EBITDAmarginUSD mn
2,204
687
1,606
783
6,206
1,444
3,263
2,043
3,564
838
2,588
1,982
0
1,000
2,000
3,000
4,000
5,000
6,000
7,000
2008 2009 2010 H1 2011
Russian peers*
Metalloinvest
* Severstal, NLMK, MMK, Mechel, Evraz

Debt profile

Credit portfolio performance
15
6.1
5.4
4.1
6.2
5.5
0.2 0.4 0.2 0.4 0.4
1.7
6.5
1.6
1.81.5
0
1
2
3
4
5
6
7
8
0
1
2
3
4
5
6
7
8
2008 2009 2010 H1 2011 Q3 2011
Total Debt Cash & equivalents Total Debt/EBITDA LTM* (rhs)
USD bn Rx
* Last twelve-months period

Credit portfolio structure
16
56%
13%
18%
13%
Breakdown by type of source
PXF
Eurobonds
Sberbank
Others 73%
24%
3%
Breakdown by currency
USD
RUR
EUR
* Data as of October 1, 2011

Credit portfolio performance
17
21.6 23.019.6
29.5
33.6
7.8% 7.8%
6.6%
4.8% 4.8%
2%
3%
4%
5%
6%
7%
8%
9%
10%
0
5
10
15
20
25
30
35
40
2008 2009 2010 H1 2011 Q3 2011
Weighted Average Life Interest rate (RHS)
Months %

Debt maturity profile
18
0.1 0.8
1.2
1.0
1.0
1.4
5.5
0
1
2
3
4
5
6
Q4 2011 2012 2013 2014 2015 2015+ Total Debt*
* Data as of October 1, 2011
USD bn

Strategy

Strategy highlights
20
Iron ore HVA*
production increase
HBI/DRI & Pellets
Maintaining global leadership on HBI market
Steel segment
profitability growth
Product mix widening & focus on niche markets
Installation of new high-efficiency equipment
M&A activityFinancial investments in Metals & Mining industry
Diversification of commodity portfolio
Iron ore reserve base
development
Exposure to Emerging markets
Focus on new customers & Logistics
Cost efficiency
improvements
Application of new technologies
Production facilities improvements & economy of scale
* HVA means high value-added products
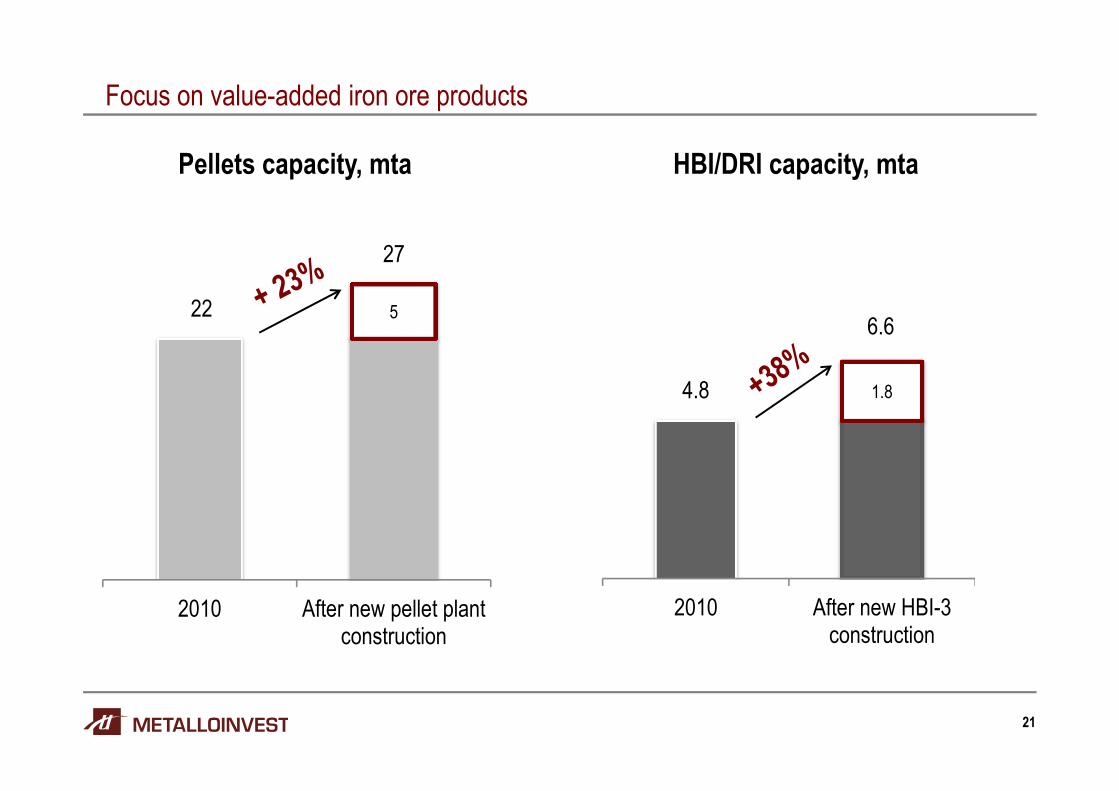
Focus on value-added iron ore products
21
4.8
6.6
1.8
2010 After new HBI-3construction
22
27
5
2010 After new pellet plantconstruction
Pellets capacity, mta HBI/DRI capacity, mta
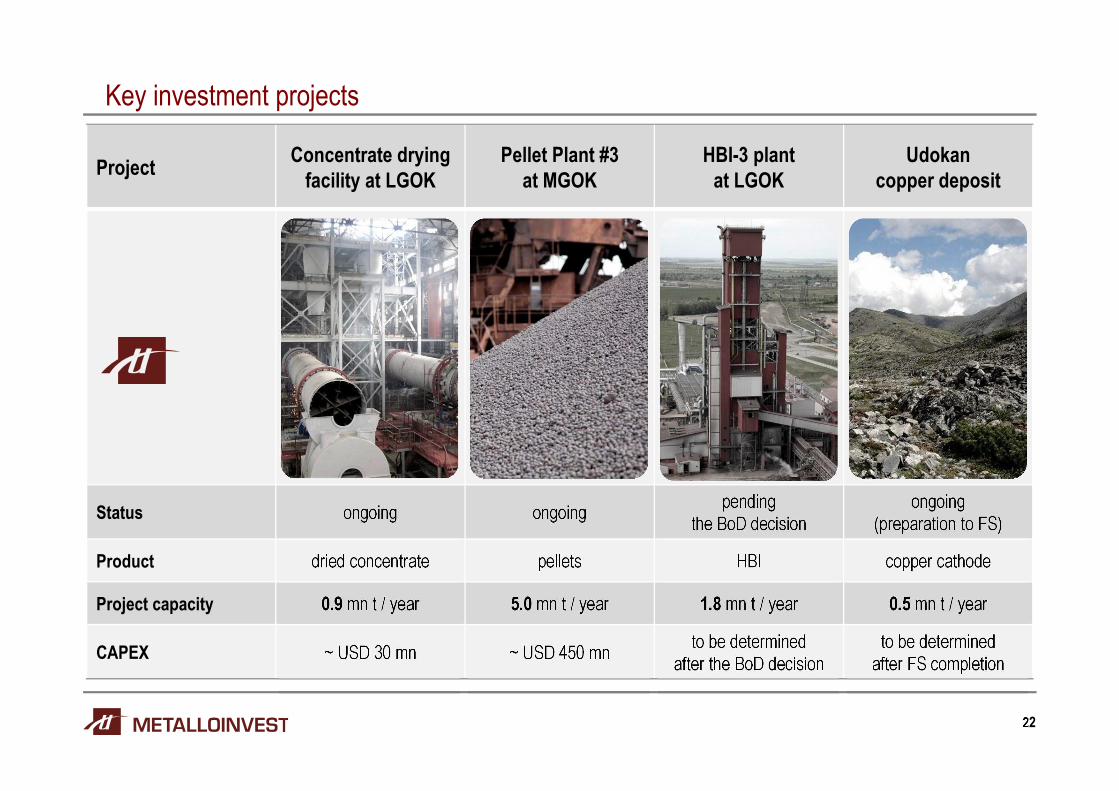
Key investment projects
22
ProjectConcentrate drying
facility at LGOK
Pellet Plant #3
at MGOK
HBI-3 plant
at LGOK
Udokan
copper deposit
Status ongoing ongoingpending
the BoD decision
ongoing
(preparation to FS)
Product dried concentrate pellets HBI copper cathode
Project capacity 0.9 mn t / year 5.0 mn t / year 1.8 mn t / year 0.5 mn t / year
CAPEX ~ USD 30 mn ~ USD 450 mnto be determined
after the BoD decision
to be determined
after FS completion

Rating agencies
Financial
institutions
Investors
Independent reserves
auditors
International insurance
companies
Sep-Dec 2011Jan-Aug 201120102007 2008
Integration in Global Economy
23
Increase in iron ore P&P
reserves up to 14.9 bn tonnes
by IMC
New PXF USD 3.1 bn
loan obtained
USD 1.6 bn
syndicated loan by
Deutsche Bank
USD 0.7 bn
syndicated loan
by ABN / BNPP
USD 750 mn
Eurobonds issue (LSE)
Web-site improvements
13.8 bn tonnes of
P&P* reserves by IMC
Ba3, positive by Moody’s
BB-, stable by Fitch
Ba3, stable
by Moody’s
Business partners 2009
IR dep. establishment
Debut Disclosure
Broader coverage by
international insurance
companies
* P&P – proved and probable reserves based on JORC code

Appendices

HBI – unique HVA product
25
Supply side
Constrained supply (high quality iron ore and abundance of natural gas required)
HBI produced only in handful of countries(India, Mexico, Russia, Venezuela, etc.)
Demand side
Growing number of mini-mills and scrap shortage
Technological shift to EAF steelmaking
Scrap shortage & scrap quality decrease in CIS
Market position
The only HBI producer in Russia and CIS
The largest commercial HBI supplier globallywith 36% market share
Efficiency and environment33% - energy savings over traditional pig iron production
44% - greenhouse gas emission reduction over traditional steelmaking route (sinter&coke & BF&BOF)
High-quality material (low non-ferrous metals content)
HBI -direct substitute of scrap

METALLOINVEST & Capital Markets
26
70
80
90
100
110
July August September October
Eurobonds issue
Buy-back
Key parameters
Date
July 2011
Maturity
5 years
Value
USD 750 mn
Coupon rate
6.5%
* In August-September the Company repurchased its Eurobonds at the total amount of USD 52 mn (par value)

For more details:
Artem Lavrischev
Head of Investor Relations
T: +7 (495) 981 55 55, ext. 7243
Thank You