methodology for preliminary design of electrical microgrids...
TRANSCRIPT

SANDIA REPORTSAND2015-8433Unlimited ReleasePrinted September 30, 2015
Methodology for Preliminary DesignOf Electrical Microgrids
Richard Jensen, Ph.D, P.E., Jason Stamp, Ph.D., John Eddy, Ph.D., Jordan Henry,and Karina Munoz-RamosSandia National Laboratories
Tarek AbdallahU.S. Army Corps of Engineers
Prepared bySandia National LaboratoriesAlbuquerque, New Mexico 87185 and Livermore, California 94550
Sandia National Laboratories is a multi-program laboratory managed and operated bySandia Corporation, a wholly owned subsidiary of Lockheed Martin Corporation, for the U.S.Department of Energy’s National Nuclear Security Administration under contract DE-AC04-94AL85000.
Approved for public release; further dissemination unlimited.

Issued by Sandia National Laboratories, operated for the United States Department of Energyby Sandia Corporation.
NOTICE: This report was prepared as an account of work sponsored by an agency of the UnitedStates Government. Neither the United States Government, nor any agency thereof, nor anyof their employees, nor any of their contractors, subcontractors, or their employees, make anywarranty, express or implied, or assume any legal liability or responsibility for the accuracy,completeness, or usefulness of any information, apparatus, product, or process disclosed, or rep-resent that its use would not infringe privately owned rights. Reference herein to any specificcommercial product, process, or service by trade name, trademark, manufacturer, or otherwise,does not necessarily constitute or imply its endorsement, recommendation, or favoring by theUnited States Government, any agency thereof, or any of their contractors or subcontractors.The views and opinions expressed herein do not necessarily state or reflect those of the UnitedStates Government, any agency thereof, or any of their contractors.
Printed in the United States of America. This report has been reproduced directly from the bestavailable copy.
Available to DOE and DOE contractors from:
U.S. Department of EnergyOffice of Scientific and Technical InformationP.O. Box 62Oak Ridge, TN 37831
Telephone: (865) 576-8401Facsimile: (865) 576-5728E-Mail: [email protected] ordering: http://www.osti.gov/bridge
Available to the public from:
U.S. Department of CommerceNational Technical Information Service5285 Port Royal RdSpringfield, VA 22161
Telephone: (800) 553-6847Facsimile: (703) 605-6900E-Mail: [email protected] ordering: http://www.ntis.gov/help/ordermethods.asp?loc=7-4-0#online
DEP
ARTMENT OF ENERGY
• • UN
ITED
STATES OF AM
ERI C
A
2

SAND2015-8433Unlimited Release
Printed September 30, 2015
Methodology for Preliminary DesignOf Electrical Microgrids
Richard Jensen, Ph.D., P.E.Geomechanics Department
Jason Stamp, Ph.D.Special Cyber Initiatives Department
John Eddy, Ph.D.Systems Readiness & Sustainment Technology Department
Jordan HenryCritical Infrastructure Systems Department
Karina Munoz-Ramos and Ben SchenkmanMilitary & Energy Systems Analysis Department
Sandia National LaboratoriesP.O. Box 5800
Albuquerque, NM 87185-1188
Tarek AbdallahConstruction Engineering Research Laboratory
U.S. Army Corps of EngineersP.O. Box 9005
Champaign, IL 61821-9005
Abstract
Many critical loads rely on simple backup generation to provide electricity in the event of apower outage. An Energy Surety MicrogridTM can protect against outages caused by singlegenerator failures to improve reliability. An ESM will also provide a host of other benefits,including integration of renewable energy, fuel optimization, and maximizing the value of
3

energy storage. The ESM concept includes a categorization for microgrid value proposi-tions, and quantifies how the investment can be justified during either grid-connected orutility outage conditions. In contrast with many approaches, the ESM approach explic-itly sets requirements based on unlikely extreme conditions, including the need to protectagainst determined cyber adversaries. During the United States (US) Department of Defense(DOD)/Department of Energy (DOE) Smart Power Infrastructure Demonstration for EnergyReliability and Security (SPIDERS) effort, the ESM methodology was successfully used todevelop the preliminary designs, which direct supported the contracting, construction, andtesting for three military bases.
4

Acknowledgements
Sandia National Laboratories and the SPIDERS technical team would like to acknowledgethe following for help in the project:
• Mike Hightower, who has been the key driving force for Energy Surety Microgrids
• Juan Torres and Abbas Akhil, who developed the concept of microgrids for militaryinstallations
• Merrill Smith, U.S. Department of Energy SPIDERS Program Manager
• Ross Roley and Rich Trundy from U.S. Pacific Command
• Bill Waugaman and Bill Beary from U.S. Northern Command
• Melanie Johnson and Harold Sanborn of the U.S. Army Corps of Engineers Construc-tion Engineering Research Laboratory
• Experts from the National Renewable Energy Laboratory, Idaho National Laboratory,Oak Ridge National Laboratory, and Pacific Northwest National Laboratory
5

6

Contents
Abbreviations and Acronyms 12
1 Introduction and Rationale 13
2 Value Propositions for Energy Resilience Improvements 15
3 Energy Surety Microgrid Concept of Operations 19
4 Energy Surety Microgrid Design Process 23
4.1 Data Gathering and Stakeholder Coordination . . . . . . . . . . . . . . . . . . . . . . . . . 23
4.2 Technical Modeling and Simulation . . . . . . . . . . . . . . . . . . . . . . . . . . . . . . . . . . . 26
4.3 Analysis Activities . . . . . . . . . . . . . . . . . . . . . . . . . . . . . . . . . . . . . . . . . . . . . . . . 28
5 Examples from the SPIDERS Program 31
5.1 Phase I: Joint Base Pearl Harbor-Hickam . . . . . . . . . . . . . . . . . . . . . . . . . . . . . . 31
5.2 Phase II: Ft Carson . . . . . . . . . . . . . . . . . . . . . . . . . . . . . . . . . . . . . . . . . . . . . . . 33
5.3 Phase III: Camp Smith . . . . . . . . . . . . . . . . . . . . . . . . . . . . . . . . . . . . . . . . . . . . 34
6 Conclusions 37
6.1 Success of Preliminary Design Methodology . . . . . . . . . . . . . . . . . . . . . . . . . . . . 37
6.2 Microgrid Lessons Learned . . . . . . . . . . . . . . . . . . . . . . . . . . . . . . . . . . . . . . . . . 37
Bibliography 37
7

Appendices
A Sandia National Laboratories / DOE Contact Information 41
8
List of Figures
3.1 Basic Energy Surety MicrogridTM (ESM) concept of operations (CONOPS)(solid lines indicated energized equipment, and dashed are de-energized) . . . . 21
4.1 Technical analysis approach for ESM preliminary design. . . . . . . . . . . . . . . . . . 24
List of Tables
2.1 Taxonomy for benefits from grid resiliency investments . . . . . . . . . . . . . . . . . . . 16
9

10

Abbreviations and Acronyms
ATS automatic transfer switch
CONOPS concept of operations
COTS commercial off-the-shelf
CSWG Cyber Security Working Group
DBT design basis threat
DER distributed energy resource
DHS Department of Homeland Security
DOD Department of Defense
DOE Department of Energy
DSM design screening model
EMS energy management system
ENM electrical network model
ESM Energy Surety MicrogridTM
EV electric vehicle
FEMA Federal Emergency Management Agency
GIS geographic information system
HILF high impact/low frequency
ICS industrial control system
IEE Institution of Electrical Engineers
IEEE Institute of Electrical and Electronics Engineers
JBPHH Joint Base Pearl Harbor-Hickam
LV low voltage
MC Monte Carlo
11

MDT Microgrid Design Toolset
MV medium voltage
NCSD National Cyber Security Division
NIST National Institute of Standards and Technology
NISTIR NIST Interagency Report
NPV net present value
O & M operations & maintenance
PES Power Engineering Society
PRM performance reliability model
PV photovoltaic
RE renewable energy
RFP request-for-proposal
ROM rough order of magnitude
SGIP Smart Grid Interoperability Panel
SNL Sandia National Laboratories
SPIDERS Smart Power Infrastructure Demonstration for Energy Reliability and Security
TMO Technology Management Optimization
UFC Unified Facilities Criteria
UPS uninterruptible power supply
US United States
V2G vehicle-to-grid
WWTP waste water treatment plant
12

Chapter 1
Introduction and Rationale
Over the past century, the use of electricity has become one of the defining features of amodern society. The use of electricity has become so engrained in every facet of our livesthat its loss has a tremendous negative effect, as was evident during recent natural disasterssuch as super storm Sandy [1].
To address the need of secure and reliable electric power, Sandia National Laborato-ries (SNL) has developed a methodology for designing electric microgrids called the ESMmethodology. Thus far, ESM reports have been developed for over 20 Department of De-fense (DOD) installations and ten civilian sites [2], several are under contraction or complete.Thus far, the scope of the projects intended for ESM are single customer or campus-scalemicrogrids, although this could change with the evolution of the ESM approach under theDepartment of Energy (DOE)-funded Microgrid Design Toolset (MDT) program [3].
An ESM is defined as an integrated energy system consisting of loads and distributedenergy resources (DERs) operating as a coherent unit, either in parallel with or islanded fromthe power grid, whose main purpose is support of critical loads during severe contingencies.Since an ESM can be operated independently of the power grid, they are invaluable infacilities that have high uptime requirements, in either terms of protecting life (such ashospitals), security (military installations), or economic factors (manufacturing facilities withhigh restart costs or sites with high opportunity cost). An ESM improves resiliency in regionssusceptible to natural disaster [4] or unreliable grids, possibly also caused by poor securityagainst malevolent threats.
The six key properties of an ESM are:
• Safety
• Reliability
• Security
• Sustainability
• Cost Effectiveness
• Resiliency
13

The first attribute, safety, ensures that energy is provided in a safe manner. The micro-grid must function well during an unplanned power outage but also must be designed withsafety as a top concern. As an example, an ESM design must ensure that interconnectingDER does not compromise safety, particularly in light of evolving standards like IEEE 1547.
The second feature, reliability, reflects a power system’s ability to meet its mission-criticalelectric demands. Although it is not possible to ever achieve 100% reliability, installing amicrogrid system can significantly improve electrical availability. By itself, conventionalbuilding-dedicated on-site generation reduces the number of critical load failures associatedwith long-distance power transmission. However, a microgrid configuration further reducesthe likelihood that the failure of any one generator will affect critical load; if a microgrid iswell designed, other generators in the network will have sufficient energy for all critical load.
Security makes a power system more resilient to various cyber and physical threats,including terrorist attacks. Threats against power systems have escalated in recent years.As a result, cyber security standards and effective design approaches [5] must be consideredand included in a microgrid design from the very beginning.
Sustainability is the ability to reliably operate power systems for extended periods oftime and in a manner that will not compromise the future. Sustainability can be improvedat a microgrid site, for example, by including renewable sources of distributed generationsuch as solar or wind power, thus reducing – or even eliminating – a facility’s dependencyon fossil fuel resources. The microgrid itself will allow for generation dispatch that canimprove energy conversion efficiency (which can be poor for generators operating at lowoutput capacity) and thus conserve and extend onsite fuel supplies during extended outages.An ESM can enhance maintenance capabilities by allowing for necessary downtime of sitebackup and microgrid generators during extended outages without interruption of service,as well as enabling full-load testing of machinery while grid-connected. The ESM designmay feature analysis to reflect resource availability and promote strategies to minimize oreliminate dependency on depleting resources (and potentially also reduce carbon emissions).
Cost effectiveness reflects the importance of providing power at the reasonable investmentcost. The addition of renewable energy (RE), for example, reduces a site’s dependence onthe utility grid and also on a sites fuel storage when utility power is unavailable, thusleading to cost savings. Thus far, ESM designs have leveraged as much existing on-siteequipment as possible – including generators, RE, medium voltage (MV), and low voltage(LV) – to minimize implementation costs. And ESMs can easily reduce energy costs duringnormal, grid-connected operations by controlling microgrid resources to reduce utility costsor perhaps generate revenue through contractual relationships or markets.
Finally, resiliency has recently become a key R&D focus both in the United States (US)and internationally. As defined by [6], resiliency can have a number of different meanings,but the ESM approach specifically aims to manage risk from unusual or severe energy threats(either natural or man-made) by cost-effective strengthening. An ESM at a site improvesenergy flexibility, as non-critical (but still desirable) loads can be selectively energized duringextended outages. An ESM design includes quantitative evaluation of the resiliency benefits.
14
Chapter 2
Value Propositions for EnergyResilience Improvements
The term design basis threat (DBT) is borrowed from the nuclear industry, where it is acomprehensive document that identifies threats a facility must withstand. The DBT theninforms the design of the facility and its systems. For an ESM, a DBT defines the moststringent conditions (threats) that must be met by the system design. These threats may beenvironmental (such as a hurricane) or man-made (such as a cyber or physical attack), andis typically one of the first decisions reached between microgrid analysts and the prospectiveESM stakeholders.
For prior ESM work by SNL, DBTs have included:
• Regional electrical blackout lasting 72 hours
• Regional electrical blackout lasting 24 hours at 0.4 probability, 72 hours at 0.3, 1 weekat 0.2, and 1 month at 0.1
• Flood level at the Federal Emergency Management Agency (FEMA) 100 year floodplain plus 2.5 feet [4]
• Active cyber security threats with specified characteristics against microgrid industrialcontrol system (ICS) [7]
A key concept for an ESM is that energy surety investments are intended primarily toimprove performance for the DBT – the energy resiliency for the site. Obviously, investmentsin energy surety can also provide improvement during normal periods, or more conventionalemergencies (not to the level of the DBT). The three operating conditions for an ESM aredefined as:
• Normal: No emergency conditions.
• Typical Emergency: Abnormal conditions that fall under the purview of good plan-ning or engineering (like utility outages in line with historical reliability figures, etc.).
• Abnormal Emergency: High impact/low frequency (HILF) events, which are in-cluded in the DBT.
15

Different types of value propositions can apply to each operating condition. The valuepropositions can be categorized as:
• Technical: Applies to benefits that are not immediately quantifiable using dollars orenvironmental measures; these measures are quantifiable using engineering or othermetrics, like expected outage durations, fuel consumption, etc.
• Financial: Benefits that are calculated in dollars (possibly as a net present value).
• Environmental: Values for the environment, like reduced emissions or pullutants.
Overall, the value propositions may be sorted as shown in Table 2.1.
Table 2.1. Taxonomy for benefits from grid resiliency in-vestments
Operating Mode
NormalTypical
EmergencyAbnormalEmergency
Abbreviation N TE AE
Ben
efit Technical TC N-TC TE-TC AE-TC
Financial FN N-FN TE-FN AE-FN
Environmental EN N-EN TE-EN AE-EN
Although all nine boxes are theoretically relevant, the technical benefits during abnor-mal emergency events have dominated ESM designs in SNL’s experience. However, the otherbenefits can help with the cost and investment justification and should be calculated whenfeasible and useful (contributing to cost effectiveness, mentioned previously). This is a keyinvestment issue, particularly since normal conditions dominate as a fraction of operatingtime, and may allow for financial benefits through revenue generation or cost avoidance(through site energy or demand reduction, peak shaving/shifting, energy contracts with thelocal utility, participation in local markets, etc.). Conceptually, the investment in energysurety – performance during DBT and other HILF events – is amortized by the improvedperformance that the investment provides during normal (grid-connected) and typical emer-gency conditions. And that is a fundamental design criterion, since the DBT is frequentlywithout any good quantification of its frequency or likelihood of occurrence, which makes itdifficult to compare to conventional investment criteria. Conversely, the normal and typi-cal emergency conditions are well-established, and so the value of the ESM investments inimproving those can be easily expressed succinctly, perhaps as a net present value (NPV).The stakeholders for an ESM can compare the difference of the NPV of the ESM costs andthe NPV of the benefits during normal and typical emergency conditions to the expected,
16

quantified benefits calculated by the performance reliability model (PRM) for DBT condi-tions (which are not expressed financially). This represents their investment in energy suretyand resiliency for the planned microgrid site. Obviously, if the first quantity (the difference)is negative, then the DBT performance is “free” and the project is very easy to justify (inSNL’s experience, this is not the case). This perspective simplifies the ESM investmentquestion for stakeholders.
Some examples for two high priority value areas include:
• Abnormal emergency, technical (AE-TC):
– Improved energy availability for critical loads during extreme events, includingdifferentiated reliability
– Reduced loss of energy availability for DBT events
– More rapid recovery for energy during DBT events
– Flexibility to easily power non-critical loads during extended outages
– Better fuel endurance
– Better maintenance opportunities
• Normal, financial (N-FN):
– Reducing energy billing costs through energy consumption management
– Revenue from market/demand response participation
– Revenue from energy contracts with utilities
– Possible savings from reduced fuel usage for islanded systems
– Lower operations & maintenance (O & M) costs from easier maintenance
Other potentially important microgrid benefits are also possible. For “normal, technical”(N-TC) operations, benefits might be improved power quality for equipment [8] or simplerbackup generator testing through improved control and flexibility. An ESM that can optimizeefficiency and RE could have a big “normal, environmental” (N-EN) impact with loweredemissions by reducing consumption and offsetting utility generation. Finally, for “typicalemergency, technical” (TE-TC), an ESM will improve reliability for critical loads, sincesystems designed for resiliency could be used to support critical load during normal outagesif there are failures in normal backup procedures or equipment (basically, starting microgridoperations quickly to support the load).
One other benefit that does not seem the fit the taxonomy is that to the rollout ofan advanced energy infrastructure is the improvement in energy awareness, resulting fromthe communications and sensing infrastructure that is a necessary component for moderncontrol. The data accrued from these systems will enable data-driven decisions on energymanagement. This is a particular boon for a site with little or no existing monitoring thatacquires a microgrid.
17

18

Chapter 3
Concept of Operations (CONOPS) foran ESM
For design purposes, ESM loads are sorted into the following types:
• Tier C – those loads / buildings that are critical to the mission or function of thefacility; these loads usually have dedicated backup generators. Critical loads, furthersubgrouped as Tier C/U (uninterruptible) and Tier C/I (interruptible, can withstandmomentary losses of power without loss of critical function, like while waiting for abackup generator to start)
• Tier P – those loads / buildings that are of high priority (“nice to have”), but thatcan be switched on or off of microgrids at the discretion of the designated emergencyauthorities.
• Tier O – those other loads / buildings that will not be powered during islanded,microgrid operations.
With respect to design, an ESM is always planned to make optimal use of existing onsiteresources. This means that existing MV infrastructure between buildings and areas within asite will preferably be configured to support microgrid operations (minimally impacting thenormal utility supply). This must be done carefully to ensure that protection requirementsare satisfied and ensure ESM safety (one of its six core properties). Likewise, in-place LVequipment will be leveraged. In either case, the final ESM design can certainly augment orreplace the onsite equipment, but specific decisions about re-use, upgrade, or replacementare ultimately cost-benefit tradeoffs.
Candidate sites for ESMs already have critical load, and so probably also include backupgeneration and uninterruptible power supply (UPS). Re-using existing generation for an ESMis not free, as the controls would need to be altered and integrated into the microgrid energymanagement system (EMS), but this could be less expensive than purchasing new generation(which is obviously an option). To electrically integrate existing generation with automatictransfer switchs (ATSs), a breaker with synchronizing check functionality is installed betweenthe ATS’s “normal” (utility-connected) side and the generator side. In microgrid mode, thisswitch is closed – safely – and the generator can back-feed the site’s MV system through theexisting transformer.
19

The recommended connection above allows the ATS to remain in-place, and the obviousquestion is why that would be a desired characteristic. While the contemporary installationof an ESM does not rely on advanced equipment or control – indeed, commercial off-the-shelf(COTS) products are generally suitable – the idea is novel enough that an ESM should “dono harm.” The site should be able to operate as it would have prior to the ESM installationin the event of unexpected microgrid failures, or even breakdowns in training for operationsstaff. In the future, the need to fallback capability will diminish, but right now it is a keyfeature.
A microgrid can support a seamless transition to microgrid operation, or or it may not.(Here, the word “seamless” refers to the electrical loads not perceiving any interruptionin service.) In the case of an unplanned and unexpected utility outage, an intentionallack of requirement to support seamless transition is likely a good cost-benefit proposition.Critical loads that require uninterrupted service (Tier C/U) will almost certainly alreadyhave UPSs, and these may be relied upon during the post-outage period before microgridoperations. Otherwise, the site’s ESM would need to have constantly running generation orsignificant energy storage, at increased capital and operating cost. However, the constructionand testing of a microgrid should have as low of impact to ongoing site operations as istechnically and programmatically feasible. A key element of this is to ensure that varioussystems can transfer to microgrid or backup modes seamlessly, when the transfer is planned orforeseeable. Seamless transition out of islanded microgrid mode is always desirable, providedit is achievable per interconnection requirements.
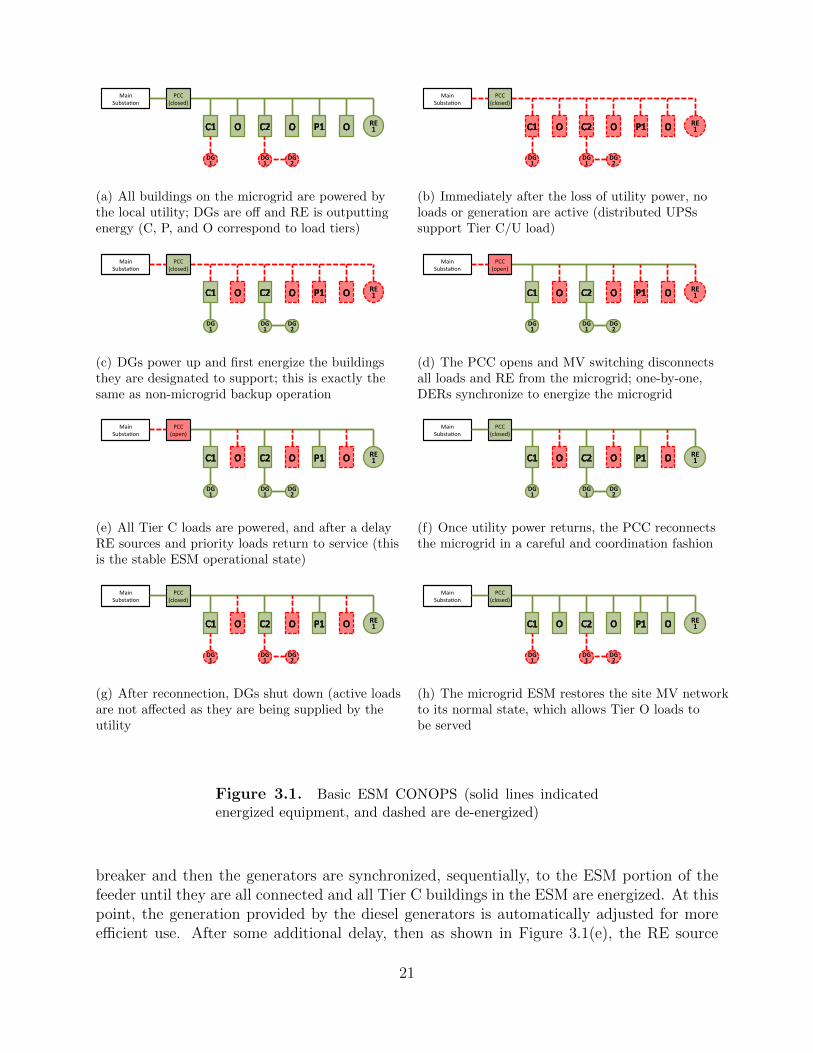
Diagrams can best illustrate the process used to transition the Smart Power InfrastructureDemonstration for Energy Reliability and Security (SPIDERS) sites into a simple microgridwithout seamless transition, respecting the “do no harm” dictum. Figure 3.1(a) illustratesan ESM feeder with a PCC main breaker dividing the upstream non-ESM portion of thefeeder from the downstream ESM portion of the feeder. Green signifies that the system haspower and red signifies loss of power. The ESM consists of a collection of Tier C / TierP mission buildings and Tier O buildings, designated by C, P, and O. The Tier C missionbuildings may be connected to DERs (likely, at least one diesel backup generator). Notethat in this example, an RE source is not attached to a particular building but is connectedto the grid as an independent generation asset. As shown in Figure 3.1(b), all buildings losepower immediately after the utility is lost.
During this period prior to microgrid activation, the Tier C-U load is powered by theirdistributed UPS; later, Tier C/U and C/I are powered by local generator systems as shown inFigure 3.1(c). The RE source is also shut down due to IEEE standard 1547, which does notallow any inverter based power generation to operate on a de-energized grid. If loss of poweris greater than some predetermined interval, then on-site personnel can enable microgridoperation. This step can also be automated with the triggering mechanism being a lengthof time or specified set of conditions. The first step is that the control system sends signalsto disconnect all building feeds, in order to prepare for carefully managing the step-by-stepinterconnection of the ESM (this also prevents Tier O buildings from being powered duringthe outage). In Figure 3.1(d), the microgrid is isolated from the utility by opening the PCC
20
PCC (closed)
Main Substa4on
DG 1
DG 1
DG 2
RE 1
(a) All buildings on the microgrid are powered bythe local utility; DGs are off and RE is outputtingenergy (C, P, and O correspond to load tiers)
PCC (closed)
Main Substa4on
DG 1
DG 1
DG 2
RE 1
(b) Immediately after the loss of utility power, noloads or generation are active (distributed UPSssupport Tier C/U load)
PCC (closed)
Main Substa4on
DG 1
DG 1
DG 2
RE 1
(c) DGs power up and first energize the buildingsthey are designated to support; this is exactly thesame as non-microgrid backup operation
PCC (open)
Main Substa4on
DG 1
DG 1
DG 2
RE 1
(d) The PCC opens and MV switching disconnectsall loads and RE from the microgrid; one-by-one,DERs synchronize to energize the microgrid
PCC (open)
Main Substa4on
DG 1
DG 1
DG 2
RE 1
(e) All Tier C loads are powered, and after a delayRE sources and priority loads return to service (thisis the stable ESM operational state)
PCC (closed)
Main Substa4on
DG 1
DG 1
DG 2
RE 1
(f) Once utility power returns, the PCC reconnectsthe microgrid in a careful and coordination fashion
PCC (closed)
Main Substa4on
RE 1
DG 1
DG 1
DG 2
(g) After reconnection, DGs shut down (active loadsare not affected as they are being supplied by theutility
PCC (closed)
Main Substa4on
RE 1
DG 1
DG 1
DG 2
(h) The microgrid ESM restores the site MV networkto its normal state, which allows Tier O loads tobe served
Figure 3.1. Basic ESM CONOPS (solid lines indicatedenergized equipment, and dashed are de-energized)
breaker and then the generators are synchronized, sequentially, to the ESM portion of thefeeder until they are all connected and all Tier C buildings in the ESM are energized. At thispoint, the generation provided by the diesel generators is automatically adjusted for moreefficient use. After some additional delay, then as shown in Figure 3.1(e), the RE source
21

can come back online to start supplying power and site personnel can elect to supply TierP loads. When utility power is restored for some long enough interval deemed sufficient bysite personnel, the ESM is reconnected to the utility as depicted in Figure 3.1(f) (possiblya seamless transfer, but not necessarily). Later, the DER is deactivated as shown in Figure3.1(g). Lastly, in Figure 3.1(h) the Tier O loads are restored to the MV network and thesite resumes its normal, grid-connected operations.
22

Chapter 4
ESM Design Process
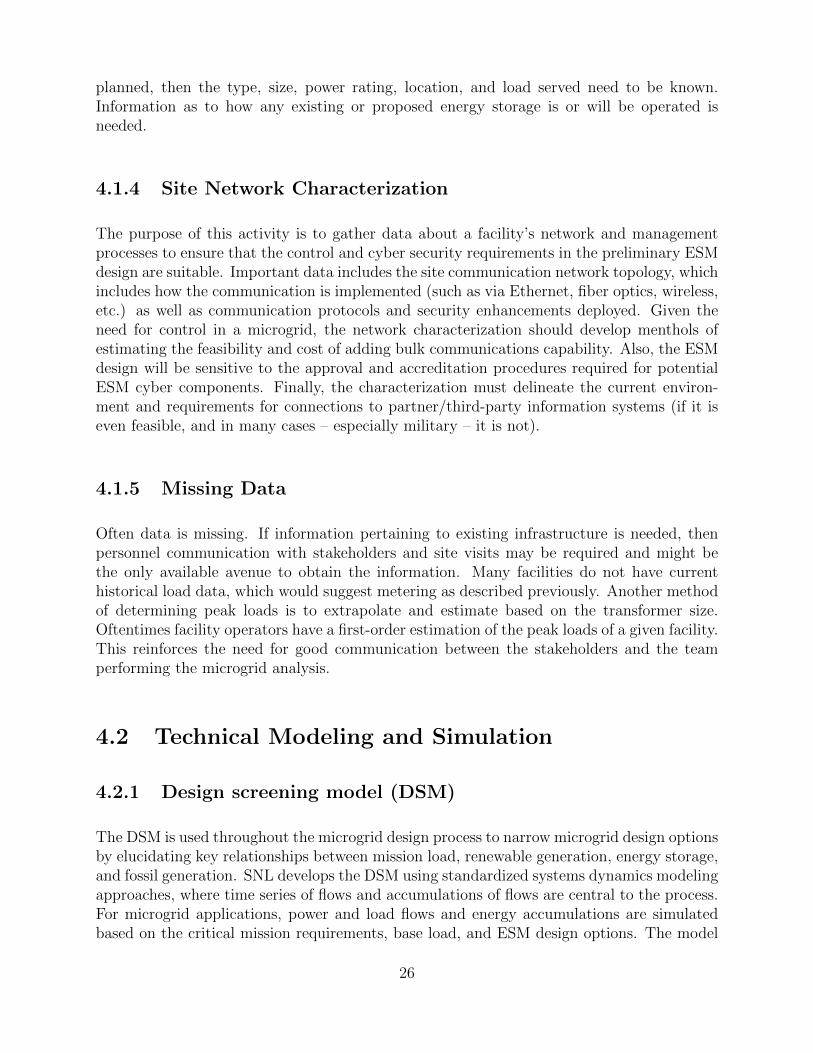
The goal of a preliminary design is to provide a site microgrid framework as a list of re-quirements and recommendations, with a clear summary for the customer/stakeholder toenable them to understand the limits, tradeoffs, and potential costs and benefits of imple-menting the microgrid. Thus far, many preliminary design reports for ESMs have beenformatted for ready inclusion in requests-for-proposal to streamline the acquisition processfor the stakeholders. The approach for a full ESM design assessment is shown in Figure 4.1.
4.1 Data Gathering and Stakeholder Coordination
Developing the ESM includes a number of technical analysis activities, but it is foremost amethodology and approach. The foundation of the process is coordination between a group ofexpert analysts and the site’s stakeholders. The experience of the analysts can support dataelicitation and normalizing for stakeholder’s knowledge and opinions, but ultimately it is thelatter which defines the project space. Stakeholder personnel whose involvement is vital tothe successful defining and implementation of the microgrid include the facilities manager,the energy manager, and key points-of-contact for site O & M, such as the site electricalengineer. During this stage of the process, additional consideration must be made for futurechange, including future probable change in personnel and succession of responsibility forsystem operations.
4.1.1 Mission/DBT Characterization
The first step is defining and characterizing the mission space of the facility, and the DBTthat will be referenced during the design. Knowing the extent of critical power needs boundsthe problem. Additionally, it also helps define which buildings are needed to maintain thecritical mission of the facility. Next is to determine which buildings and loads fall intothe critical/non-interruptible, critical/interruptible, priority, and other ESM load categories.The relative locations (geospatially and electrically) of the loads also need to be determined,as well as any temporal relationship[s between critical facilities and mission space. As for theDBT, different stakeholders face different challenges; for military applications, very advanced
23

Rene
wab
le(Ene
rgy(
Resource(
Characteriza6
on(
START
Set(U
p(De
sign(
Screen
ing(
Mod
el((D
SM)(
Set(U
p(Electrical(
Network(Mod
el(
(ENM)(
Set(U
p(Pe
rforman
ce/(
Reliability(Mod
el(
(PRM
)(
Deliver(
Prelim
inary(
Design(
END
Commun
ica6
ons(
and(Inform
a6on
(Networks(
Characteriza6
on(
Design((
Adeq
uate?(
(
Controls,(
Protec6o
n,(and
(Cybe
r(Security
(Re
quire
men
ts(
Site(Coo
rdina6
on,(
Data(Collec6on
,(an
d(Site(Visits(
Mission
(&(Design(
Basis(T
hreat(
Characteriza6
on(
Facility(
Electrical(
Characteriza6
on(
Compo
nents(a
nd(
Network(De
sign(
Analysis(
(includ
ing(TM
O)(
Develop(Ini6al(
Design(Op6
ons((
&(Perform
ance(
Requ
iremen
ts(
Data(Gathe
ring(an
d(Stakeh
olde
r(Coo
rdina6
on(
Technical(M
odeling(an
d(Simula6
on(
Analysis(Ac6vi6e
s(
Figure
4.1.
Tec
hn
ical
anal
ysi
sap
pro
ach
for
ES
Mp
reli
mi-
nary
des
ign
.
24

cyber adversaries are reasonable to assume. The geography and history of the facility willinform the disaster elements of the DBT.
4.1.2 Facility Electrical Characterization
In order to adequately characterize the site’s electrical distribution system it is necessary toobtain as much information about the site as possible. The information can be grouped intothree principal categories: physical equipment, load data, and operations. For the physicalequipment, one-line drawings, both LV and MV are invaluable. One-line drawings show howthe existing electrical distribution system is laid out and what equipment is currently inthe field (including feeders, buses, transformers, switches, normally-open/normally-closed,conductor size, and shunt compensation). One-line drawings for the individual buildingsand loads are also beneficial. Drawings such as site layouts that have geographic informationsystem (GIS) information detailing specific locations of buildings, loads, roadways, and otherinfrastructure are helpful when trying to narrow down feasible options and in determiningrough order of magnitude (ROM) cost estimations. Detailed information on existing backupgeneration including size, location, ratings (voltage and power), fuel used, and fuel storagecapacity is also needed. Load data such as peak load and load profiles are necessary, for boththe electrical distribution system as a whole as well as for individual buildings and loads,including Tier C, P, and O loads. A designation as to which buildings are critical or if onlya portion of a building load is critical is also required. If this data is not available, eithermetering needs to be deployed, or estimates will be calculated. When metering, the desiredsuite of data to be captured is kW, true power factor, displacement power factor, kVAR/kVA,voltage/current, and measures of power quality such as THD or harmonic levels. The desiredinterval is one minute with a maximum interval of five minutes and a minimum duration ofone month, though one year is preferable since it can capture the seasonal variation of theload profile.
Another important aspect of site characterization is an understanding of the potentialfor future growth of the loads and a variance of the loads due to a change in function.Any planned or proposed changes to the site’s function and future needs to be accountedfor, including near-term modernization/upgrades and proposed installation of RE generationresources. Lastly, detailed information on the normal and emergency operations includingprocedures enacted during a grid outage (especially continuity of operations planning) arerequired.
4.1.3 RE Resource Characterization
Any information on existing renewable energy resources photovoltaic (PV), wind, biomass,etc. (make, size, location, and ratings) that may impact the loads on the system must becollected. Additionally, any planned or proposed systems need to be noted and incorporatedinto the microgrid design plan. If any electrical energy storage systems are existing or
25
planned, then the type, size, power rating, location, and load served need to be known.Information as to how any existing or proposed energy storage is or will be operated isneeded.
4.1.4 Site Network Characterization
The purpose of this activity is to gather data about a facility’s network and managementprocesses to ensure that the control and cyber security requirements in the preliminary ESMdesign are suitable. Important data includes the site communication network topology, whichincludes how the communication is implemented (such as via Ethernet, fiber optics, wireless,etc.) as well as communication protocols and security enhancements deployed. Given theneed for control in a microgrid, the network characterization should develop menthols ofestimating the feasibility and cost of adding bulk communications capability. Also, the ESMdesign will be sensitive to the approval and accreditation procedures required for potentialESM cyber components. Finally, the characterization must delineate the current environ-ment and requirements for connections to partner/third-party information systems (if it iseven feasible, and in many cases – especially military – it is not).
4.1.5 Missing Data
Often data is missing. If information pertaining to existing infrastructure is needed, thenpersonnel communication with stakeholders and site visits may be required and might bethe only available avenue to obtain the information. Many facilities do not have currenthistorical load data, which would suggest metering as described previously. Another methodof determining peak loads is to extrapolate and estimate based on the transformer size.Oftentimes facility operators have a first-order estimation of the peak loads of a given facility.This reinforces the need for good communication between the stakeholders and the teamperforming the microgrid analysis.
4.2 Technical Modeling and Simulation
4.2.1 Design screening model (DSM)
The DSM is used throughout the microgrid design process to narrow microgrid design optionsby elucidating key relationships between mission load, renewable generation, energy storage,and fossil generation. SNL develops the DSM using standardized systems dynamics modelingapproaches, where time series of flows and accumulations of flows are central to the process.For microgrid applications, power and load flows and energy accumulations are simulatedbased on the critical mission requirements, base load, and ESM design options. The model
26

can track many other aspects of microgrid performance including: building diesel generatorduty cycles, ramp rates, building heat consumption, and battery charge-discharge cycles andassociated stored energy requirements. The outputs of the DSM are used to develop theoptions space for the ESM design. Done carefully, the DSM may also be leveraged as a toolfor eliciting key information from stakeholders by describing possible microgrid options andfunctionality.
4.2.2 Electrical network model (ENM)
Ensuring that all sources operate within their power limits and that other equipment (liketransmissions lines and transformers) are not overloaded are essential requirements of anESM. A load flow study, also referred to as a power flow study, is a common tool used forAC analysis of a power system in steady state and to ensure that all requirements discussedabove are met during the planning stages of a power system. Similar analysis is used forheat generation, flow, and consumption. The ENM also includes the development of aproposed one-line diagram for the ESM. A one-line diagram consists of a set of schematicsrepresenting the full energy system and may include generators, buses, loads, distributionlines, transformers, protective devices, heat sources and sinks, etc.
4.2.3 Performance reliability model (PRM)
An ESM design includes quantitative analysis for the proposed microgrid improvementsagainst some set of the selected value propositions for the DBTs. One well-accepted methodfor valuing the performance of an engineered system is Monte Carlo (MC) sampling. Theprocess has been used extensively for power system planning, with formulations for bothgeneration adequacy and system adequacy assessment (the latter includes the electrical net-work, while the former is more about simple generator capacity). The desired analysis willleverage existing system adequacy assessment formulations [9] [10] [11].
Existing software called the PRM is used to calculate performance metrics. It includes afew specific characteristics:
• The DBT is expressed as a probability density function of expected utility outages (inhours)
• Instead of a bulk power system, the analysis is for microgrids, which share similaritieswith bulk power
• A sequential MC is used, covering the entire outage interval; this allowed modeling foroperational characteristics (like generator conditional restart attempts)
• The system includes the ability for multiple energy islands and backup connectionsbetween them
27
• Currently modeled are diesel generators (and fuel consumption), all three tiers of load(including C/U and C/I), energy storage, lines, transformers, UPSs, RE, etc.
• New DER, lines, transformers, storage, or microgrid operation schemes can be analyzed
• Outage rates, recovery rates, variable RE output, variable loads, and start probabilitiesare included
• The system uses an event-driven simulation approach, which allows for variable timesteps (seconds, hours, others) and maximum execution efficiency (calculating newstates only when things change)
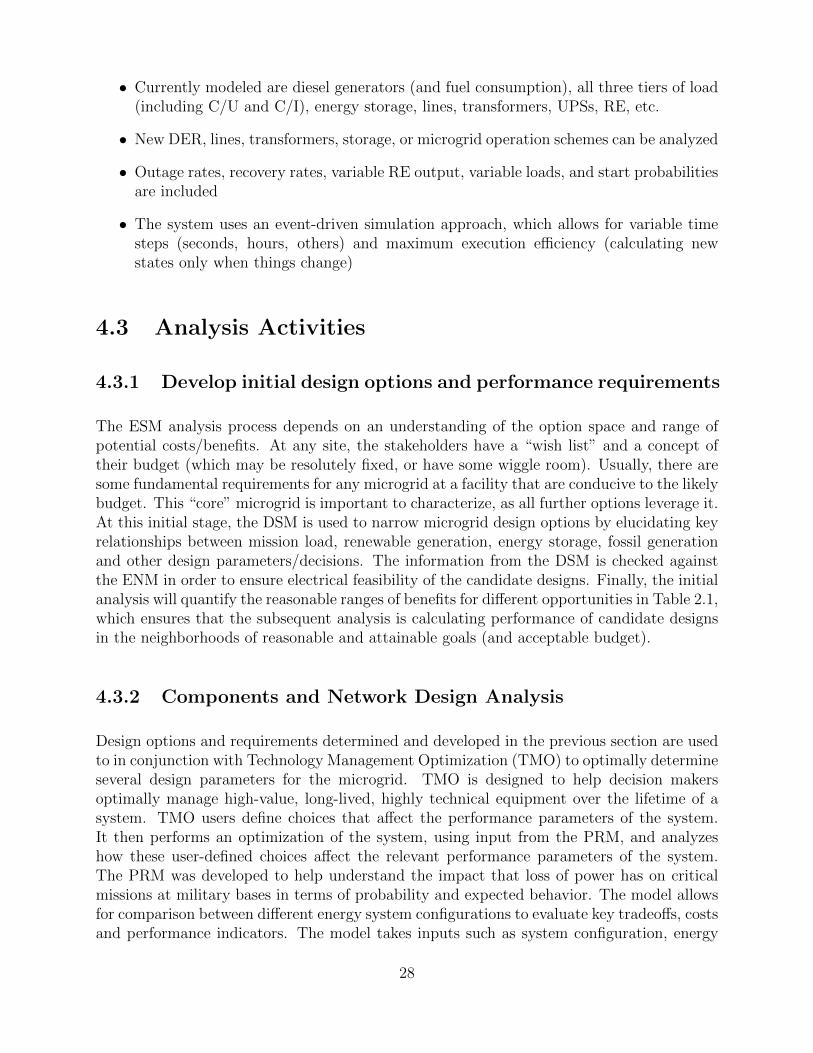
4.3 Analysis Activities
4.3.1 Develop initial design options and performance requirements
The ESM analysis process depends on an understanding of the option space and range ofpotential costs/benefits. At any site, the stakeholders have a “wish list” and a concept oftheir budget (which may be resolutely fixed, or have some wiggle room). Usually, there aresome fundamental requirements for any microgrid at a facility that are conducive to the likelybudget. This “core” microgrid is important to characterize, as all further options leverage it.At this initial stage, the DSM is used to narrow microgrid design options by elucidating keyrelationships between mission load, renewable generation, energy storage, fossil generationand other design parameters/decisions. The information from the DSM is checked againstthe ENM in order to ensure electrical feasibility of the candidate designs. Finally, the initialanalysis will quantify the reasonable ranges of benefits for different opportunities in Table 2.1,which ensures that the subsequent analysis is calculating performance of candidate designsin the neighborhoods of reasonable and attainable goals (and acceptable budget).
4.3.2 Components and Network Design Analysis
Design options and requirements determined and developed in the previous section are usedto in conjunction with Technology Management Optimization (TMO) to optimally determineseveral design parameters for the microgrid. TMO is designed to help decision makersoptimally manage high-value, long-lived, highly technical equipment over the lifetime of asystem. TMO users define choices that affect the performance parameters of the system.It then performs an optimization of the system, using input from the PRM, and analyzeshow these user-defined choices affect the relevant performance parameters of the system.The PRM was developed to help understand the impact that loss of power has on criticalmissions at military bases in terms of probability and expected behavior. The model allowsfor comparison between different energy system configurations to evaluate key tradeoffs, costsand performance indicators. The model takes inputs such as system configuration, energy
28

assets, etc. and calculates applicable metrics described in the introduction. This modelis used as an external evaluator by TMO. TMO is run using a multi-objective optimizerapproach, resulting in a set of solutions. The analysis and optimization of the design resultsfrom the interaction between TMO and PRM, where statistics of interest based on candidatedesign parameters are fed from PRM to TMO. Then, based on the input statistics, TMOcalculates the fitness of the design. The TMO and PRM compares the performance andreliability of these conceptual design options to a baseline performance and reliability ofthe existing system without any improvements to meet the DBT in order to make thesecomparisons. A prerequisite for this analysis is the determination of a starting point uponwhich this further analysis can be done. The limits and objectives were chosen based oninitial PRM runs. It is important to note that TMO will take into account the limits andobjectives when finding Pareto Optimal Solutions but if none of the solutions can meet theobjective values for the parameters, TMO will consider those that get closest to the objective”more fit” for the particular parameter. The scores of the design are retained in memory byTMO while a new set of design parameters are fed back to PRM. As this design iterationcycles through, a set of Pareto optimal points are developed by TMO. TMO and PRManalysis collectively determines the performance versus the reliability of a set of options aswell as costs for the sets required and optimal buildings or loads.
4.3.3 Controls, Protection, and Cyber Security Requirements
A safe, secure, reliable, and sustainable microgrid requires a cyber security architecturecommensurate with the criticality of facilities on the microgrid and the level of risk deemedacceptable by the stakeholders. Industry standard best practices for typical power grid ICS,including those found in NERC CIP and NISTIR 7628 [12], should be incorporated wherepossible; however, it is recommended that most microgrids should be more robust than thatof traditional ICSs given that:
• Most microgrids will be used in emergency situations and may be critical to continuityof emergency operations
• Microgrids must function during active attack by a capable adversary
As such, traditional design and implementation of an ICS is likely not sufficient for imple-menting a robust and secure microgrid. Therefore, in addition to referenced best practices,additional rigor should be applied to strengthen defense-in-depth for the microgrid controlsystems. Best practices for securing ICSs often leverage network segmentation [13, 14]; how-ever, in most cases, network segmentation is focused on separation of the control systemnetwork from other less-trusted networks, such as an enterprise network and the Internet.The concept of network segmentation within the control system itself should be leveraged tofurther reinforce defense-in-depth practices. Such a scheme is consistent with Sandia’s Cy-ber Security Reference Architecture [5] developed for DOD microgrid implementations andprovides a framework for a higher level of security than industry best practices can providealone.
29

30

Chapter 5
Examples from the SPIDERSProgram
To demonstrate the value of microgrids on DOD installations, the DOD and the DOE jointlyfunded a demonstration project called SPIDERS. The SPIDERS project comprises threecandidate sites: Joint Base Pearl Harbor-Hickam (JBPHH), located in Honolulu, Hawaii; FtCarson, located in Colorado Springs, Colorado; and Camp Smith, also located in Honolulu.The SPIDERS project is unique because it included conceptual, preliminary, and detailed(engineering) design, in addition to construction, commissioning, and demonstration of thethree microgrids, each of which will be transitioned to the installations as fully operationalinfrastructure improvements.
The technical progression of the project followed the crawl, walk, run philosophy ofstarting small and progressing in complexity with each subsequent phase. One of the pro-gram’s metrics for success was the off-grid endurance of the microgrid during electrical poweroutages. To optimize system performance in this respect, the ESM design optimized the re-newable energy contribution to the system as well as generator fuel efficiency. SNL alsoconsidered the energy security and resilience of the system by including “N+1” generatorredundancy and available capacity based on the peak critical load.
An overarching philosophy and key to acceptance by the facilities was that the SPIDERSdesign would “do no harm” in the installation of the microgrid. Functionally, this meant thatthe facility could deactivate the microgrid at any time and revert back to the conventionalback-up system that was in place prior to the installation of the SPIDERS microgrid. Ineach of the following subsections, a brief description of the extent of the installed microgridand the results of the improvement with the installed microgrid are given.
5.1 Phase I: Joint Base Pearl Harbor-Hickam
5.1.1 Objectives
The goal of SPIDERS JBPHH (Phase 1) was to quantifiably demonstrate that SPIDERS de-livered an energy secure and cyber secure microgrid architecture with the ability to maintain
31

operational surety through robust, reliable, and resilient electric power generation and dis-tribution. In keeping with the “crawl” aspect of project progression, this phase had severalbasic objectives:
• Reliable power to critical loads
• Circuit level MV diesel integration
• Demonstration of CONOPS
• Utilization of RE
• Energy optimization to reduce fuel consumption
• Cyber-secure control system
• Demonstrate “do no harm” principle
• Develop training for onsite operators
5.1.2 Design and Implementation
The waste water treatment plant (WWTP) and part of its associated feeder at JBPHHwas selected for implementation of a microgrid. The initial backup power configuration wastwo diesel generators, 600 kW and 1600 kW. Due to the site’s construction, during gridoutages both generators were required to run, even though both were significantly oversizedfor their respective loads. Additionally, a critical/non-interruptible (C/U) water treatmentsystem had no UPS. There was also a 146 kW PV system connected to a separate circuitfrom the WWTP that would not be able to supply power to the system during an outage,given that there is no MV connectivity then. Overall, during an outage event, the existingsystem had resources that were poorly matched to the existing load (resulting in extremeunder-utilization of generators) and a renewable resource that would sit idle. To remedythis situation, the microgrid design implemented the replacement of the 600 kW generatorwith a 800 kW generator (rated based on SNL modeling that showed this generator alonewould be optimal for most WWTP load conditions), the installation of a UPS, and linkedthe system together to allow for one of the two generators to power all critical loads in theWWTP as well as connected the existing PV to the system. The preliminary design basedon the ESM process was used in the request-for-proposal (RFP) to describe requirements,design options, costs, and the expected quantitative benefits.
5.1.3 Results
There were significant results from on the ESM at JBPHH. Some of the key results are asfollows:
32

• Renewable Integration: During a 72-hour demonstration period, the 146 kW PVarray achieved a capacity factor of 12.5. Of the approximately 43 MWh of energyproduced, 1.3 MWh of that was produced by the PV array, and directly reduced theconsumption of diesel fuel. By providing over a megawatt-hour of power, the PV arraywas successfully integrated into SPIDERS operations.
• Emissions Reduction: The demonstration resulted in an estimated 1,138-poundreduction of carbon-dioxide emissions. NOx, SOx, and particulate matter (PM-10)emissions are estimated to have all decreased by a noticeable amount as well. This canbe attributed to RE integration and decreased fuel usage (due to operating the dieselgenerators more efficiently).
• Operational Endurance: The facility was supported primarily by the 800kW dieselgenerator, supplemented with the 146 kW photovoltaic array when available and the1600 kW diesel generator when necessary. Using these assets the microgrid was ableto run 93.9 hours on the same amount of fuel it would traditionally have required torun for 72 hours (a 30.4% increase in operational endurance).
• Reliability: The final microgrid configuration increased energy reliability (as eithergenerator could carry the critical load for most conditions).
All of the objectives were met or exceeded.
5.2 Phase II: Ft Carson
5.2.1 Objectives
The goal of SPIDERS Ft Carson (Phase 2) was to advance the microgrid concepts demon-strated at JBPHH as well as to include the following capabilities:
• Greater scale involving multiple feeders
• Prioritized loads/assets (now including Tier P)
• Large-scale renewable integration
• Energy storage incorporating vehicle-to-grid (V2G)
• Robust cyber security
SPIDERS at Ft Carson was also unique in that it was one of the first microgrids to fullyleverage V2G technology using bi-directional electric vehicle (EV) aggregation points to allowthe microgrid to fully exploit the EVs as both energy storage and back up facility electricalneeds.
33

5.2.2 Design and Implementation
Each critical facility located within the microgrid boundary had a building-dedicated emer-gency generator. Each of these units typically operated at very low load factors and norenewable resources were part of the contingency power solution before the microgrid wasinstalled. SPIDERS networked each of these generators and interconnected a 2MW PVsystem to allow the renewable resource to contribute to the microgrid system during electri-cal power outages. Again, the optimal preliminary design was used as the major technicalcomponent of the RFP.
5.2.3 Results
Again, the system was tested over a 72-hour demonstration window. The results from PhaseII at Ft. Carson added on the JBPHH experience:
• Renewable Integration: An existing third-party-financed PV system was integratedinto the microgrid, and the bi-directional V2G integration provided energy storagestabilization/power factor correction for the microgrid using five EVs
• Energy Security and Demand Response: The microgrid demonstrated that fastdemand response and energy marketplace participation is possible using microgridcontrols to manage the solar array and fossil-fuel-based generation.
All of the other objectives were met. The larger scale of the microgrid did not negativelyaffect the timing for the control systems.
5.3 Phase III: Camp Smith
5.3.1 Objectives
The major goal of SPIDERS Camp Smith (Phase 3) was to deliver a fully mature microgriddesign using the lessons learned from JBPHH and Ft Carson. Camp Smith will be DOD’sfirst installation-scale microgrid (the microgrid is sized to backup all installation loads).Camp Smith also includes the following capabilities:
• Tier 4I EPA-certified clean diesel generation for utility support, ancillary services andrevenue generation
• Automatic load shedding
• Fully developed cyber security architecture
34
5.3.2 Design and Implementation
Camp Smith also previously relied on load-dedicated generation during outage events. Thiscontingency solution includes many legacy generation technologies and systems that do notprovide comprehensive backup to their facilities. To elevate the energy security and efficiencyof the site, the microgrid design includes four Tier 4I generators that will serve as keyresources for the microgrid along with a subset of the existing generator fleet. This iscombined with 300kW of existing PV and strategic energy storage to deliver a fully resilientand efficient microgrid. The final microgrid configuration at Camp Smith is expected tosignificantly increase the energy security at the site when compared with the legacy, spotgeneration currently in place. The initial site development and microgrid operation planswere delineated in the ESM preliminary design report, which also includes estimates thatquantify the expected benefits (which will be tested when construction is complete in late2015).
35

36

Chapter 6
Conclusions
6.1 Success of Preliminary Design Methodology
Microgrid demonstrations like SPIDERS have shown that microgrid technology can help thefederal and private sectors meet both their energy resilience and renewable energy goals.While integrating microgrid technology into existing infrastructure is often challenging, elec-trical system modeling and critical load analysis is an important first step to ensuring thefinal design is sufficient to meet the user’s operational and performance requirements. Basedon SPIDERS experience, the organization, analysis, and output of the ESM design method-ology is extremely conducive to fielding effective military microgrids.
6.2 Microgrid Lessons Learned
Apart from the design methodology, the SPIDERS program has identified several impor-tant lessons learned and best practices for planning, construction, and evaluating microgridsystems. As part of the SPIDERS program, DOD is updating its Unified Facilities Criteria(UFC) and construction guidance to include microgrid standards, performance metrics, andbest practices. DOD is publishing best practices and lessons learned for utility companies,industry groups, and the private sector.
37

38
References
[1] Bob Magill, Climate Central, (2013) “Superstorm Sandy Forces Cities to RethinkHow They Get Power,” http://www.weather.com/science/environment/news/micro-power-grids-sandy-forcing-cities-rethink-power-supply-20130910, online; accessed 6 May2015.
[2] Mike Hightower, Sandia National Laboratories, (2012) “Support of Renewable and Dis-tributed System Integration and Microgrids,” http://energy.gov/sites/prod/files/3 Energy Surety Microgrids.pdf, online; accessed 6 May 2015.
[3] J. Stamp, “Department of Energy Briefing: Integrated Microgrid Design and Optimiza-tion Tools,” Microgrid Global Summit 2014, Newport Beach, California, May 2014.
[4] J. Stamp, M. Baca, J. Eddy et al., “City of Hoboken Energy Surety Analysis: Pre-liminary Design Summary,” Sandia National Laboratories (SNL), Albuquerque, NM,Sandia Report SAND2014-17842, September 2014.
[5] C. Veitch, J. Henry, B. Richardson et al., “Microgrid Cyber Security Reference Ar-chitecture V1,” SNL, Albuquerque, NM, Sandia Report SAND2013-5472, September2013.
[6] Executive Office of the President, (2013) “Economic Benefits of Increasing ElectricGrid Resilience to Weather Outages,” http://energy.gov/sites/prod/files/2013/08/f2/Grid\%20Resiliency\%20Report FINAL.pdf, online; accessed 6 May 2015.
[7] D. Duggan, S. Thomas, C. Veitch et al., “Categorizing Threat: Building and Usinga Generic Threat Matrix,” SNL, Albuquerque, NM, Sandia Report SAND2007-5791,September 2007.
[8] I. Hiroshi Irie, Mitsubishi Research Institute, (2012) “?Sendai Microgrid – Introduc-tion and Use Case,” http://e2rg.com/microgrid-2012/Sendai Irie.pdf, online; accessed6 May 2015.
[9] R. Billinton and W. Li, Reliability Assessment of Electric Power Systems Using MonteCarlo Methods. Plenum Press, New York, 1994.
[10] R. Allan, R. Billinton et al., “Reliability Assessment of Composite Generation andTransmission Systems,” Institute of Electrical and Electronics Engineers (IEEE) PowerEngineering Society (PES), Tutorial Manual, 1989, 90EH0311-1-PWR.
[11] J. Ubeda and R. Allan, “Sequential Simulation Applied to Composite System ReliabilityEvaluation,” Institution of Electrical Engineers (IEE) Proceedings C, vol. 139, pp. 81–86, March 1992.
39

[12] Smart Grid Interoperability Panel (SGIP)–Cyber Security Working Group (CSWG),“Guidelines for Smart Grid Cyber Security,” National Institute of Standards and Tech-nology (NIST), NIST Interagency Report (NISTIR) 7628, Vol. 1–3, August 2010.
[13] National Cyber Security Division (NCSD), “Recommended Practice: Improving Indus-trial Control Systems Cybersecurity with Defense-in-depth Strategies,” Department ofHomeland Security (DHS), Special Publication (SP), 2009, 800-82.
[14] K. Stouffer, J. Falco, and K. Scarfone, “Guide to industrial Control Systems (ICS)Security,” NIST, Special Publication (SP), 2011, 800-82.
40

Appendix A
Sandia National Laboratories / DOEContact Information
Name Organization
Sandia National LaboratoriesJason Stamp P.O. Box 5800
SPIDERS Design Team Lead Albuquerque, NM [email protected]
Sandia National LaboratoriesRichard Jensen P.O. Box 5800
SPIDERS Assistant Technical Manager Albuquerque, NM [email protected]
Sandia National LaboratoriesAlan Nanco P.O. Box 5800
Sandia Management Lead Albuquerque, NM [email protected]
U.S. Department of EnergyMerrill Smith 1000 Independence Avenue, SW
DOE Program Manager Washington, DC [email protected]
41

42

Report Distribution
1 Tarek AbdallahU.S. Army Corps of Engineers2902 Newmark DriveChampaign, IL 61826
1 Bill BearyNORAD / U.S. Northern CommandPeterson AFB, CO 80914
1 Melanie JohnsonU.S. Army Corps of Engineers2902 Newmark DriveChampaign, IL 61826
1 Ross RoleyU.S. Pacific CommandCamp Smith, HI 96861
1 Harold SanbornU.S. Army Corps of Engineers2902 Newmark DriveChampaign, IL 61826
1 Merrill Smith1000 Independence Avenue SWWashington, DC 20585
1 Bill WaugamanU.S. Northern CommandPeterson AFB, CO 80914
1 MS0671 Jordan Henry, 56281 MS0671 Neeta Rattan, 56231 MS0671 Jason Stamp, 56231 MS0751 Richard Jensen, 69141 MS1188 John Eddy, 61331 MS1188 Karina Munoz, 61141 MS1188 Ben Schenkman, 61141 MS0899 RIM-Reports Management, 9532 (electronic copy)
43

44

v1.32JES
45
