methodologyarticle openaccess nanite
TRANSCRIPT

Müller et al. BMC Bioinformatics (2019) 20:465 https://doi.org/10.1186/s12859-019-3010-3
METHODOLOGY ARTICLE Open Access
nanite: using machine learning to assessthe quality of atomic forcemicroscopy-enabled nano-indentation dataPaul Müller1* , Shada Abuhattum1,2,3, Stephanie Möllmert1, Elke Ulbricht1, Anna V. Taubenberger1
and Jochen Guck1,3
Abstract
Background: Atomic force microscopy (AFM) allows the mechanical characterization of single cells and live tissueby quantifying force-distance (FD) data in nano-indentation experiments. One of the main problems when dealingwith biological tissue is the fact that the measured FD curves can be disturbed. These disturbances are caused, forinstance, by passive cell movement, adhesive forces between the AFM probe and the cell, or insufficient attachmentof the tissue to the supporting cover slide. In practice, the resulting artifacts are easily spotted by an experimenterwho then manually sorts out curves before proceeding with data evaluation. However, this manual sorting stepbecomes increasingly cumbersome for studies that involve numerous measurements or for quantitative imagingbased on FD maps.
Results: We introduce the Python package nanite, which automates all basic aspects of FD data analysis, includingdata import, tip-sample separation, base line correction, contact point retrieval, and model fitting. In addition, naniteenables the automation of the sorting step using supervised learning. This learning approach relates subjectiveratings to predefined features extracted from FD curves. For ratings ranging from 0 to 10, our approach achieves amean squared error below 1.0 rating points and a classification accuracy between good and poor curves that is above87%. We showcase our approach by quantifying Young’s moduli of the zebrafish spinal cord at different classificationthresholds and by introducing data quality as a new dimension for quantitative AFM image analysis.
Conclusion: The addition of quality-based sorting using supervised learning enables a fully automated andreproducible FD data analysis pipeline for biological samples in AFM.
Keywords: Machine learning, Atomic force microscopy, Elasticity, Sorting
BackgroundThe mechanical properties of cells and tissues are animportant regulator in development, homeostasis, anddisease [1–4]. To assess the mechanical properties oftissues at the single cell level, atomic force microscopy(AFM) has emerged as one of the most popular tech-niques, as it enables the detection of forces over a widerange (5 pN to 100 nN) at a high spatial resolution (downto 10 nm) [5].
*Correspondence: [email protected] Center, Center for Molecular and Cellular Bioengineering,Technische Universität Dresden, Tatzberg 47/49, 01307 Dresden, GermanyFull list of author information is available at the end of the article
In practice, the mechanical characterization of cells andtissues is realized by bringing the AFM cantilever intocontact with the sample and recording the force whileindenting the sample. In addition to basic indentationexperiments, dynamic modes, such as time-dependentstress relaxation, creep compliance, or oscillatory prob-ing [6–11], have been used to assess the viscoelasticproperties of cells and tissues. Here, we focus on basicindentation which employs AFM tips of various shapes(e.g. spherical, conical, pyramidal) to indent the sam-ple up to a predefined force (several nN) while record-ing the force-distance (FD) curve. These FD curves arethen preprocessed (tip-sample separation, base line cor-rection, contact point retrieval) and fitted with contact
© The Author(s). 2019 Open Access This article is distributed under the terms of the Creative Commons Attribution 4.0International License (http://creativecommons.org/licenses/by/4.0/), which permits unrestricted use, distribution, andreproduction in any medium, provided you give appropriate credit to the original author(s) and the source, provide a link to theCreative Commons license, and indicate if changes were made. The Creative Commons Public Domain Dedication waiver(http://creativecommons.org/publicdomain/zero/1.0/) applies to the data made available in this article, unless otherwise stated.

Müller et al. BMC Bioinformatics (2019) 20:465 Page 2 of 9
models for the given indenter geometry. For large datasets, preprocessing and fitting is time-consuming andneeds specialized personnel. Thus, Minelli et al. pro-posed machine-learning with a neural network approach,bypassing FD data analysis, to obtain a diagnosticresponse directly [12]. Though this approach has theadvantage of working autonomously, it does not yieldquantitative values for the Young’s modulus. To derivea value for the Young’s modulus, the FD data is com-monly fitted with the Hertz model, which assumes thatthe sample behaves like an isotropic and linear elastic solid[13–15]. Since most biological specimens display vis-coelastic properties, the Young’s modulus obtained withthe Hertz model is often referred to as “apparentYoung’s modulus”. With acquisition rates of approx-imately five curves per minute for biological tissue,2D FD grids can be recorded, yielding quantitativemaps for various parameters such as the apparentYoung’s modulus, the maximum indentation depth, orthe axial position of the contact point between AFMtip and sample.Since AFM measurements can be conducted in physio-
logical buffers and at a controlled temperature range, livebiological specimens can be probed at near-physiologicalconditions. Live tissues can be sectioned for analysis, e.g.microtome sections of embedded tissue [16], or mea-sured directly, e.g. biopsy material [17]. In both cases, thepreparation of the tissue can be challenging and requiresoptimization to obtain a flat surface for probing. Forinstance, the cutting procedure often yields uneven sur-faces. In addition, damaged tissue (cell debris and fat) candisturb the cantilever movement. The resulting artifactsdistort the FD curve and thus invalidate any model fit-ted to it. Therefore, curves exhibiting such artifacts areexcluded from subsequent analysis steps.Figure 1 illustrates several artifacts commonly observed
in nano-indentation experiments. An offset at the con-tact point may be caused by an uneven surface, resultingmerely in a partial contact between the AFM tip andthe sample. Sudden spikes in the indentation part origi-nate from slippage of or within the sample. A tilt duringthe approach part can be caused by contingent contactbetween the AFM tip and a sample which is insufficientlyattached to the cover slide. It is not possible to distin-guish between good and poor curves by quantifying thegoodness of the fit (e.g. χ2 test, data not shown). Thus, ina post-measurement step, FD curves with artifacts mustbe removed manually from the subsequent analysis. How-ever, if the number of curves is large as is the case fordensely sampled FD maps of tissue sections, this sort-ing step becomes too time consuming when performedmanually.Here, we present a machine learning approach that
enables a fully automated analysis of biological FD data.
Fig. 1 Rating of force-distance (FD) curves. a Visualization of severalfeatures that degrade the quality of FD curves. b Three FD curves withcorresponding fits according to Eq. 3 are shown. The colors of the fitlabel the manual rating (1/magenta: poor, 5/yellow: acceptable,10/green: good)
The underlying Python package nanite covers all aspectsof FD analysis, including data import, tip-sample sep-aration, base line correction, contact point retrieval,and model fitting. To automate the removal of artifact-afflicted FD curves, nanite employs supervised learning,here using manually rated FD curves of live zebrafishspinal cord sections. With nanite, all of these functional-ities are made available conveniently via a command-lineinterface. This approach effectively bypasses the man-ual and time-consuming analysis process and opens upnew ways to classify, compare, and visualize large nano-indentation data sets.
ResultsWe applied our rating algorithm to two problems, involv-ing AFM FD data from zebrafish spinal cord sections. Thefirst problem focuses on data quality as a selection crite-rion. The second problem deals with data quality as anadditional imaging dimension.
Sorting by qualityThe elastic properties of the zebrafish spinal cord aretissue-dependent. Gray matter exhibits higher stiffnessthan white matter [18]. Figure 2a illustrates the locationof gray and white matter in an exemplary zebrafish spinalcord section, indicating the probed regions for each ofthe two tissues. We compared a combined dataset fromfour vertebra sections (V4, V12, V20, and V28) of tenspecimens at the age of six months, which has been pre-sented previously (Fig. 3b in [18]). Figure 2b compares thecombined dataset to all curves with an Extra Trees ratingabove and below 4.5. The general trend that gray matter

Müller et al. BMC Bioinformatics (2019) 20:465 Page 3 of 9
Fig. 2 Quality-based sorting. a The schematic representation of theadult zebrafish spinal cord indicates the four vertebral levels (V4, V12,V20, and V28) from where tissue sections were obtained. Anexemplary tissue section is shown, depicting the locality of gray(inside profile) and white (outside profile) matter. The fluorescenceimage shows myelin-rich regions labeled with GFP (green, whitematter) and mitochondria-rich regions labeled with dsRed (magenta,gray matter). For each probed region (red rectangles), four to fiveforce-distance (FD) curves were recorded. Additional FD curves forwhite matter were recorded outside of these regions. In total, tenspecimens at the age of six months were measured (see [18] fordetails). b The first violin plot shows the distribution of apparentYoung’s moduli for gray and white matter. The second and third plotshow the same data filtered with the Extra Trees regressor at aclassification threshold of 4.5. c The first violin plot is identical to thatin (B). The second plot shows the 150 top-rated (Extra Trees regressor)data points for gray and white matter. The third plot shows theremainder of the data points. The number of FD curves in each violinplot is indicated with N1 for gray matter and N2 for white matter
is stiffer than white matter remains. However, there wasa positive correlation between apparent Young’s modulusand curve quality which resulted in a preferred selectionof gray matter over white matter. The lower rating of thewhite matter might be related to a higher viscosity thatresults in a dissipation of energy and thus, worse fits withthe Hertz model. To take into account these differencesin the selection step, we compared the apparent Young’smoduli of the 150 top rated curves for each tissue typein Fig. 2c. This selection strategy makes it possible tocompare gray and white matter with high statistical signif-icance without sacrificing curves due to tissue-dependentquality.
Visualization of data qualityQuantitative AFM image analysis enables the visualizationof regional differences of zebrafish spinal cord sections.
Fig. 3 Data quality mapping. For a reference force-distance (FD) mapand for two FD maps recorded near lesion sites, a-c the normalizedminimum height given by the piezoelectric sensor, d-f the apparentYoung’s modulus obtained with Eq. 3 (gray values are above the colorrange), and g-j the Extra Trees rating are shown. Each pixel representsone FD measurement. Exemplary FD curves and corresponding fitsEq. 3 whose location is indicated with white arrows in (g) are shownfor k the gray matter, l the white matter, andm thesection-embedding agarose. Scale bar in (c), 100 100 μm
Figure 3a-c shows the surface topography images (nottip-sample separation) of the AFM cantilever for three dif-ferent sections. Gray matter regions appear to protrudefrom the tissue section (see Fig. 2a for orientation). Asdiscussed in the previous section, the apparent Young’smoduli in gray matter regions were higher than in whitematter regions (Fig. 3d-f ). In addition, tissue stiffeningnear lesion sites could be observed (apparent Young’smodulus shown in Fig. 3e, f when compared to Fig. 3d),which has been shown to be correlated to spinal cordrepair [18]. The Extra Trees rating visualizes data qual-ity and, in accordance with the findings of the previoussection, also correlates with the tissue type (Fig. 3g-j).To give a deeper insight, three exemplary FD curves
for gray matter, white matter, and the embedding agarose(indicated in Fig. 3g) are shown in Fig. 3k-m. It shouldbe noted that the low quality attributed to the embeddingagarose gel is a consequence of the experimental designand the Extra Trees training step. The indenter was toolarge to probe the agarose gel with sufficient accuracy and

Müller et al. BMC Bioinformatics (2019) 20:465 Page 4 of 9
the cantilever was too soft for measuring the large stiff-ness of the agarose gel. As a result, the indentation depthwas comparatively short and the corresponding fit exhib-ited high residuals. Thus, given the features defined inTable 1 and visualized in Fig. 4, the agarose data exhib-ited incommensurable conditions resulting in a low ExtraTrees rating. Clearly, the analyzed data must be of thesame nature as the training data.
DiscussionPerformanceThe performance of our approach is defined by the choiceof the features shown in Table 1, the choice of the regres-sor (e.g. Extra Trees regressor), and the size of the trainingset. Most importantly, it is possible to quantify the per-formance of the regressor as a function of the training
Table 1 Summary of quality-dependent features used forsupervised learning
Number Feature name Short description
1 Area of IDT spikes Area of spikes appearing inthe indentation part
2 Curvature at CP Curvature of the force-distance data at the con-tact point
3 Flatness of APR residuals Fraction of the positive-gradient residuals in theapproach part
4 Maxima in IDT residuals Sum of the indentationresiduals’ maxima in threeintervals in-between 25%and 100% relative to themaximum indentation
5 Monotony of IDT Change of the gradient inthe indentation part
6 Overall IDT residuals Sum of the residuals in theindentation part
7 Relative APR size Length of the approachpart relative to the inden-tation part
8 Residuals at CP Mean value of the resid-uals around the contactpoint
9 Residuals in 75% IDT Sum of the residuals inthe indentation part in-between 25% and 100%relative to the maximumindentation
10 Residuals of APR Absolute sum of the resid-uals in the approach part
11 Slope of BLN Slope obtained from a lin-ear least-squares fit to thebaseline
12 Variation in BLN Comparison of the forcesat the beginning and atthe end of the baseline
The features are visualized in Fig. 4; Abbreviations in feature names: indentation(IDT), contact point (CP), approach (APR), baseline (BLN)
Fig. 4 Visualization of the twelve features defined in Table 1. Thistwelve-dimensional feature space is the training set that weemployed for supervised learning. The color of the points indicate themanual rating from magenta (0, poor) to green (10, good)
set size (see “Methods” section for details). Our approachachieved an average MSE of less than 1.0 rating pointsand a binary classification accuracy above 87%, which issufficiently accurate to visualize AFM data quality and tofacilitate quality-based sorting.Sorting FD curves according to data quality allows the
exclusion of unusable data from a subsequent analysis.In principle, two thresholding strategies could be applied(see “Regressor selection” section): maximizing the accu-racy (classification threshold at 4.5 in Fig. 5c) or reducingthe false positive rate (classification threshold at 6 inFig. 5c). While the former strategy maximizes the numberof curves in subsequent analysis steps, the latter strat-egy ensures that only a very small percentage of poor FDcurves (here 2.1%) is used in the final analysis. Thus, it ispossible to dynamically balance quality and quantity in thesorting step.
ConsistencyIn order for our approach to work, the features extractedfrom the analyzed data and those extracted from thetraining data must represent data quality in similar ways.This can be achieved by enforcing the same measure-ment protocol (setup used, sample preparation, mea-surement conditions) and by using the same type oftissue for training and analysis. For instance, differentAFM setups might exhibit different levels of backgroundnoise or differing readout frequencies. An extreme caseof mismatch between training and analysis data isshown in Fig. 3m for agarose, which is discussed in“Visualization of data quality” section. Thus, the perfor-mance of a regressor that is trained with data from onesetup but applied to data from another setup could beimpaired due to feature inconsistency.

Müller et al. BMC Bioinformatics (2019) 20:465 Page 5 of 9
Fig. 5 Quantification of regressor performance. aMean squared error(MSE) in dependence of the training fraction. The training fraction isshown in percent of the total number of samples (N = 1132); thetesting fraction consists of the remaining samples. For all regressors(color code), the average (solid lines) and the standard deviation(shaded regions) were computed from 100 repetitions, each with adifferent random split into training and testing fraction. Theregressors are described in the main text. b Average receiveroperating characteristics (ROC) graphs. For all regressors (same colorcode), an average was computed from 100 ROC graphs, eachcomputed using a random split of the samples into two equal partsfor training and testing. The points indicate the position of highestaccuracy (zoom in inset). The dashed diagonal line indicates the ROCgraph of a random classifier. c Accuracy and false positive rate for theclassification with the Extra Trees regressor. The expectedclassification threshold at a rating of 4.5 (vertical line), which wasdefined in the manual rating process, is close to the maximum of theclassification accuracy. d Visualization of the Extra Trees performancein dependence of the training set size. The training set was randomlysplit into a testing fraction of 200 samples and a training fraction.From the training fraction, 33%, 67%, or 100% were used for trainingthe Extra Trees regressor which was then applied to the testingfraction with the resulting ratings rounded to integer values. The areaof each circle represents the number of samples rated with the ExtraTrees regressor normalized to the number of curves per manualrating. Colors represent the manual rating. The MSE and the ROCclassification accuracy (threshold at 4.5) are shown in the bottom rightcorner of each plot. The gray-shaded line indicates a slope of one
OutlookThere are multiple more or less obvious ways to enhancedata analysis and improve compatibility with existinganalysis pipelines. For instance, there might be otherregressors than those discussed here that could achieveeven higher accuracies. In addition, for other experimen-tal data, different hyper-parameters might yield betterresults than those presently defined in nanite. In principle,
it could be possible to achieve higher accuracies byincreasing the training set size (here N=1132). However,a more promising approach would be to improve the qual-ity of the training set. For instance, the integer-valuedmanual ratings could be mapped from a discrete to a con-tinuous space via an additional comparison of FD curveswithin the training set. At the same time, new featurescould be found that allow a better characterization ofFD curves. The future development of nanite will alsoinclude the implementation of existing models for addi-tional tip geometries or for extended models that include,for instance, the contribution of adhesion work. This willallow tobettercapture thedata quality of biological FD data.
ConclusionsWe have demonstrated a novel method that automates theassessment of AFM FD data quality for biological tissues.Our machine learning approach introduces data quality asa new dimension for quantitative AFM image analysis andallows the automated sorting of measurements accordingto quality. The automation of loading, fitting, and ratingexperimental data, as provided by nanite, heavily speedsup current analysis pipelines which are mostly based onproprietary software and on software that does not byitself take into account data quality during analysis. Forthe average FD curve, preprocessing and fitting typicallytakes less than 40ms while computing the features andrating takes approximately 250ms on a modern computer.Thus, the proposed rating method could in principle beemployed in real-time applications. In addition, the tun-able discrimination between good and poor FD data hasthe potential to greatly simplify prevalent data analysisprocedures. For instance, this would allow tomap biopsiesin an automated manner over a large area for diagnosticpurposes, not requiring the presence of highly special-ized personnel. In addition, it should be noted that ourapproach is not limited to the analysis of tissues, but canbe applied to other problems, e.g. the measurement ofmany cells, in the same way. To our knowledge, naniteis the first software that quantifies the quality of FDdata. This achievement is seminal for the biomechani-cal characterization of cells and tissues, as it enables theimplementation of reproducible analysis pipelines fromraw data to data evaluation without manual intervention.
MethodsOur approach can be summarized as follows. Experi-mental FD curves are fitted with an appropriate modelfunction and are manually rated. In addition, a set of pre-defined features is extracted for each curve automatically.Together, these features and the manual ratings form thetraining set. A regressor that is trained with this trainingset is then used to predict the ratings of other curves basedon their features.
Müller et al. BMC Bioinformatics (2019) 20:465 Page 6 of 9
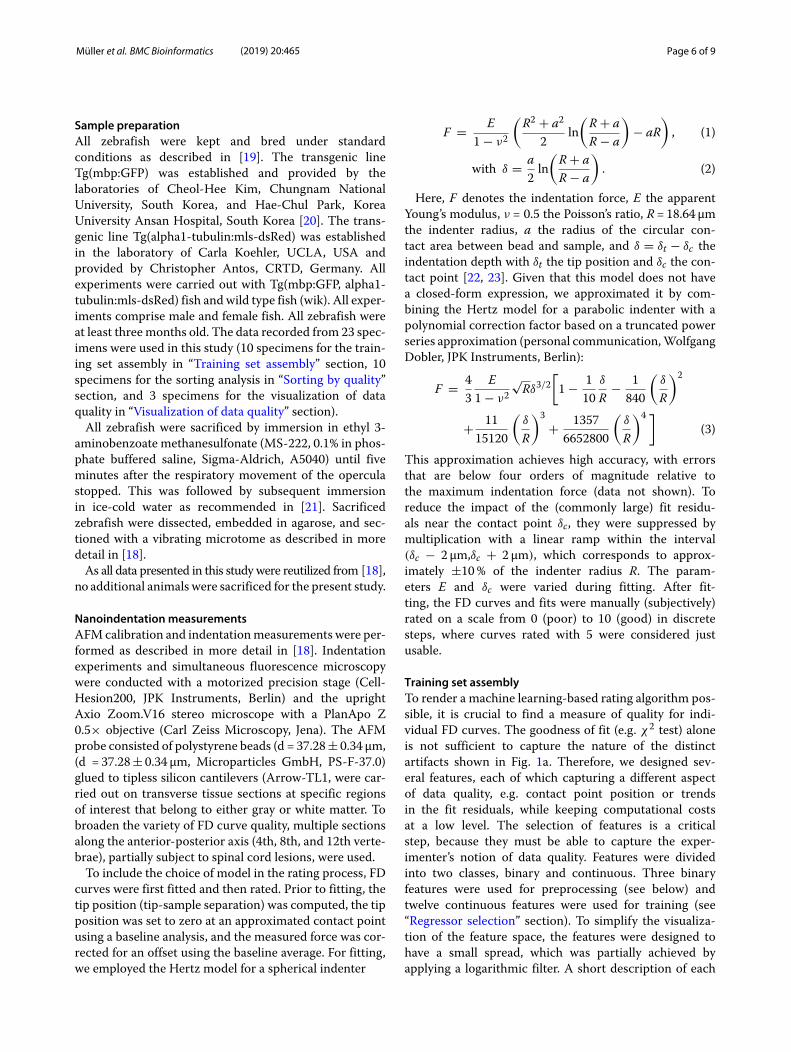
Sample preparationAll zebrafish were kept and bred under standardconditions as described in [19]. The transgenic lineTg(mbp:GFP) was established and provided by thelaboratories of Cheol-Hee Kim, Chungnam NationalUniversity, South Korea, and Hae-Chul Park, KoreaUniversity Ansan Hospital, South Korea [20]. The trans-genic line Tg(alpha1-tubulin:mls-dsRed) was establishedin the laboratory of Carla Koehler, UCLA, USA andprovided by Christopher Antos, CRTD, Germany. Allexperiments were carried out with Tg(mbp:GFP, alpha1-tubulin:mls-dsRed) fish and wild type fish (wik). All exper-iments comprise male and female fish. All zebrafish wereat least threemonths old. The data recorded from 23 spec-imens were used in this study (10 specimens for the train-ing set assembly in “Training set assembly” section, 10specimens for the sorting analysis in “Sorting by quality”section, and 3 specimens for the visualization of dataquality in “Visualization of data quality” section).All zebrafish were sacrificed by immersion in ethyl 3-
aminobenzoate methanesulfonate (MS-222, 0.1% in phos-phate buffered saline, Sigma-Aldrich, A5040) until fiveminutes after the respiratory movement of the operculastopped. This was followed by subsequent immersionin ice-cold water as recommended in [21]. Sacrificedzebrafish were dissected, embedded in agarose, and sec-tioned with a vibrating microtome as described in moredetail in [18].As all data presented in this study were reutilized from [18],
no additional animals were sacrificed for the present study.
Nanoindentation measurementsAFMcalibration and indentationmeasurements were per-formed as described in more detail in [18]. Indentationexperiments and simultaneous fluorescence microscopywere conducted with a motorized precision stage (Cell-Hesion200, JPK Instruments, Berlin) and the uprightAxio Zoom.V16 stereo microscope with a PlanApo Z0.5× objective (Carl Zeiss Microscopy, Jena). The AFMprobe consisted of polystyrene beads (d = 37.28± 0.34 μm,(d = 37.28± 0.34 μm, Microparticles GmbH, PS-F-37.0)glued to tipless silicon cantilevers (Arrow-TL1, were car-ried out on transverse tissue sections at specific regionsof interest that belong to either gray or white matter. Tobroaden the variety of FD curve quality, multiple sectionsalong the anterior-posterior axis (4th, 8th, and 12th verte-brae), partially subject to spinal cord lesions, were used.To include the choice of model in the rating process, FD
curves were first fitted and then rated. Prior to fitting, thetip position (tip-sample separation) was computed, the tipposition was set to zero at an approximated contact pointusing a baseline analysis, and the measured force was cor-rected for an offset using the baseline average. For fitting,we employed the Hertz model for a spherical indenter
F = E1 − ν2
(R2 + a2
2ln
(R + aR − a
)− aR
), (1)
with δ = a2ln
(R + aR − a
). (2)
Here, F denotes the indentation force, E the apparentYoung’s modulus, ν = 0.5 the Poisson’s ratio, R= 18.64 μmthe indenter radius, a the radius of the circular con-tact area between bead and sample, and δ = δt − δc theindentation depth with δt the tip position and δc the con-tact point [22, 23]. Given that this model does not havea closed-form expression, we approximated it by com-bining the Hertz model for a parabolic indenter with apolynomial correction factor based on a truncated powerseries approximation (personal communication,WolfgangDobler, JPK Instruments, Berlin):
F = 43
E1 − ν2
√Rδ3/2
[1 − 1
10δ
R− 1
840
(δ
R
)2
+ 1115120
(δ
R
)3+ 1357
6652800
(δ
R
)4 ](3)
This approximation achieves high accuracy, with errorsthat are below four orders of magnitude relative tothe maximum indentation force (data not shown). Toreduce the impact of the (commonly large) fit residu-als near the contact point δc, they were suppressed bymultiplication with a linear ramp within the interval(δc − 2 μm,δc + 2 μm), which corresponds to approx-imately ±10% of the indenter radius R. The param-eters E and δc were varied during fitting. After fit-ting, the FD curves and fits were manually (subjectively)rated on a scale from 0 (poor) to 10 (good) in discretesteps, where curves rated with 5 were considered justusable.
Training set assemblyTo render a machine learning-based rating algorithm pos-sible, it is crucial to find a measure of quality for indi-vidual FD curves. The goodness of fit (e.g. χ2 test) aloneis not sufficient to capture the nature of the distinctartifacts shown in Fig. 1a. Therefore, we designed sev-eral features, each of which capturing a different aspectof data quality, e.g. contact point position or trendsin the fit residuals, while keeping computational costsat a low level. The selection of features is a criticalstep, because they must be able to capture the exper-imenter’s notion of data quality. Features were dividedinto two classes, binary and continuous. Three binaryfeatures were used for preprocessing (see below) andtwelve continuous features were used for training (see“Regressor selection” section). To simplify the visualiza-tion of the feature space, the features were designed tohave a small spread, which was partially achieved byapplying a logarithmic filter. A short description of each

Müller et al. BMC Bioinformatics (2019) 20:465 Page 7 of 9
feature is given in Table 1. All features are extractedautomatically and form the so-called sample of an FDcurve.The training set was assembled using the samples and
the corresponding manual ratings. We preprocessed thetraining set by removing unusable curves using the binaryfeatures. These binary features identify measurementswhose fitted contact point is outside of the data range,whose size (combined approach and indentation) is lessthan 600 data points, or whose indentation part exhibitsmore than five distinct spikes (see e.g. Fig. 1a). In addi-tion, FD curves for which a feature could not be computedwere removed from the training set. For this study, wemanually rated 1132 FD curves from zebrafish spinal cordsections. To assure that the training set exhibited a broadquality range, we used a heterogeneous set of samples(different vertebral levels, healthy and scarred tissue, grayand white matter). The resulting training set, visualized inFig. 4, gives a brief insight into which feature combinationscould be relevant for defining the global quality of an FDcurve.
Regressor selectionTo connect the features in the training set to the cor-responding manual rating, we used a supervised learn-ing approach. Supervised learning utilizes the connectionbetween the computed features and the manual ratings inthe training step. Predicting the quality of FD curves basedon predefined features is a regression problem. Since eachfeature captures a different aspect of data quality and,thus, a particular rating may encompass a complex inter-play of features, we put our main focus on regressorsbased on decision trees.For the present study, we made extensive use of the
Python library scikit-learn [24] which comes with a com-prehensive set of regressors and associated tools for super-vised learning. Their working principles are not discussedhere for brevity reasons. The training set was weightedaccording to the occurrence of ratings. Depending onwhich regressor was used, we applied an additional pre-processing step to the training set. For the support vectormachine regressors (SVR), a linear discriminant analysiswas applied and the training set was scaled such that thefeatures were centered at zero with a variance that wascomparable for all features. The hyper-parameters of eachregressor were determined using an extensive grid search.Thereby, we obtained a set of regressors of which each wasoptimized for the given training set.An overview of the performance of all regressors is
shown in Fig. 5a. The training set was randomly splitinto training fraction (used to train the regressor) andtesting fraction (used to test the prediction of the regres-sor) at different percentages. For each percentage, thisprocess was repeated 100 times and the average mean
squared error (MSE) was compared. The average MSEquantifies by how many rating points on average a pre-diction deviates from the manual rating. The basic Deci-sion Tree regressor and the linear SVR performed worst,indicating either overfitting or lack of complexity toaddress the regression problem. Ensemble methods suchas AdaBoost, Random Forest, Gradient Tree Boosting,and Extra Trees better captured the rating process. TheExtra Trees regressor yielded the best results, with anaverage MSE reaching values below 1.0. Thus, the ExtraTrees regressor was used in the present study.Figure 5b shows the receiver operating characteristics
(ROC) graphs for all regressors. ROC graphs visualize theperformance for classification problems [25], plotting thetrue positive rate
tp rate = positives correctly classifiedtotal positives
(4)
versus the false positive rate
fp rate = negatives incorrectly classifiedtotal negatives
. (5)
The ROC graph of a random classifier corresponds tothe diagonal (0, 0) → (1, 1) (dashed line in Fig. 5b). Aperfect classifier would follow the path (0, 0) → (0, 1) →(1, 1). Thus, the further an ROC curve extends towardsthe upper left in ROC space, the better its associated clas-sifier. Here, we consider a classification into good (ratingabove 4.5) and poor (rating below 4.5) data quality. Thetraining set was randomly split into two equal-sized frac-tions. The first half was used to train the regressor andthe second half was used for testing. This process wasrepeated 100 times with random splits to obtain an aver-age ROC graph. For all regressors, the ROC graphs runalong the upper half space above the diagonal, indicatinggood classification performance. The best classificationperformance was achieved by the Extra Trees regressor,with an ROC graph closest to the upper left corner (seeinset in Fig. 5b). For each of the averaged ROC graphs, thepoint of maximum accuracy
accuracy = true positives + true negativestotal testing set size
. (6)
is depicted as a point. The Extra Trees classifier achievedthe highest accuracy (87.4%) at a classification thresholdof 4.64. Thus, the result of the ROC analysis is consistentwith that of the MSE analysis described above.Figure 5c further visualizes the performance of the
Extra Trees regressor in the classification problem. At theexpected classification threshold of 4.5, the Extra Treesregressor achieved a classification accuracy of 87.1%. Thediscrepancy between expected (4.5) and actual (4.64) posi-tion of the classification threshold is small, consideringthe fact that the manual ratings are integers. Notably, athreshold of 6 has a false positive rate of only 2.1%, but
Müller et al. BMC Bioinformatics (2019) 20:465 Page 8 of 9
still achieves a classification accuracy of 79.9%. Thus, FDcurves can be sorted into good and poor curves with atunable specificity.Figure 5d visualizes the improvement in rating predic-
tion for 200 randomly chosen FD curves when the numberof curves used for training is increased. As expected, alarger training fraction reduced the MSE and increasedthe classification accuracy, improving the prediction per-formance. In addition, a larger training fraction caused ahigher correlation between the Extra Trees rating and themanual rating, as can be seen by an increased alignmentof the data points to a slope of 1. Thus, learning-based rat-ing with the Extra Trees regressor in combination with thegiven training set forms a robust framework that is suf-ficiently accurate to rate other experimental FD curves,especially, but not limited to, zebrafish spinal cord tissuesections.
AbbreviationsAFM: Atomic force microscopy; FD: Force-distance; GFP: Green fluorescentprotein; MSE: Mean squared error; SVR: Support vector machine regressor
AcknowledgementsWe thank the fish facility at BIOTEC, TU Dresden for excellent fish care and JPKInstruments, Berlin for technical support.
Authors’ contributionsPM, SA, SM, EU, and AT designed the quality-dependent features used forsupervised learning. SM carried out all measurements. PM implemented thesoftware, performed the manual rating, and carried out the data analysis. SAimplemented the model functions used. PM, AT, SA, and JG drafted themanuscript. JG supervised the study. All authors read and approved the finalmanuscript.
FundingThis work was supported by the Volkswagen Foundation [grant number92847 to JG]; the Marie Sklodowska-Curie Actions under the European Union’sHorizon 2020 research and innovation programme [grant number 641639 toSA. and JG]; and the Alexander von Humboldt Stiftung (Alexander vonHumboldt Professorship to JG). The funders had no role in the design of thestudy and collection, analysis, and interpretation of data and in writing themanuscript.
Availability of data andmaterialsThe datasets generated and analyzed during the current study are available onFigshare (https://ndownloader.figshare.com/files/13481393) [26].The employed method is implemented in the Python package nanite,available at https://github.com/AFM-Analysis/nanite. The documentation ofnanite is available online at https://nanite.readthedocs.io.
Ethics approval and consent to participateAll animal experiments were conducted according to the guidelines of theGerman Animal Welfare Act and under the supervision of theRegierungspräsidium Dresden (DD24.1-5131/339/5 and D24-5131/338/52).Zebrafish were maintained and bred at the Biotechnology Center of the TUDresden. The initial study [18] was approved and licensed by the local animalethics committee (Landesdirektion Sachsen, Germany; license no AZ Biotec:24-9165.40-1/2007).
Consent for publicationNot applicable.
Competing interestsThe authors declare that they have no competing interests.
Author details1Biotechnology Center, Center for Molecular and Cellular Bioengineering,Technische Universität Dresden, Tatzberg 47/49, 01307 Dresden, Germany.2JPK BioAFM Center, Colditzstr. 34-36, 012099 Berlin, Germany. 3Max PlanckInstitute for the Science of Light, Staudtstr. 2, 91058 Erlangen, Germany.
Received: 1 February 2019 Accepted: 29 July 2019
References1. Levental KR, Yu H, Kass L, Lakins JN, Egeblad M, Erler JT, Fong SFT,
Csiszar K, Giaccia A, Weninger W, Yamauchi M, Gasser DL, Weaver VM.Matrix crosslinking forces tumor progression by enhancing integrinsignaling. Cell. 2009;139(5):891–906.
2. Bonnans C, Chou J, Werb Z. Remodelling the extracellular matrix indevelopment and disease. Nat Rev Mol Cell Biol. 2014;15(12):786–801.
3. Smith LR, Cho S, Discher DE. Stem cell differentiation is regulated byextracellular matrix mechanics. Physiology. 2018;33(1):16–25.
4. Janmey PA, Wells RG, Assoian RK, McCulloch CA. From tissue mechanicsto transcription factors. Differentiation. 2013;86(3):112–20.
5. Müller D. J., Helenius J, Alsteens D, Dufrêne YF. Force probing surfaces ofliving cells to molecular resolution. Nat Chem Biol. 2009;5(6):383–90.
6. Alcaraz J, Buscemi L, Grabulosa M, Trepat X, Fabry B, Farré R, Navajas D.Microrheology of human lung epithelial cells measured by atomic forcemicroscopy. Biophys J. 2003;84(3):2071–9.
7. Darling EM, Wilusz RE, Bolognesi MP, Zauscher S, Guilak F. Spatialmapping of the biomechanical properties of the pericellular matrix ofarticular cartilage measured in situ via atomic force microscopy. BiophysJ. 2010;98(12):2848–56.
8. Moreno-Flores S, Benitez R, dMVivancoM, Toca-Herrera JL. Stress relaxationmicroscopy: Imaging local stress in cells. J Biomech. 2010;43(2):349–54.
9. Moeendarbary E, Valon L, Fritzsche M, Harris AR, Moulding DA, ThrasherAJ, Stride E, Mahadevan L, Charras GT. The cytoplasm of living cellsbehaves as a poroelastic material. Nat Mater. 2013;12(3):253–61.
10. Rother J, Noding H, Mey I, Janshoff A. Atomic force microscopy-basedmicrorheology reveals significant differences in the viscoelastic responsebetween malign and benign cell lines. Open Biol. 2014;4(5):140046.
11. Hecht FM, Rheinlaender J, Schierbaum N, Goldmann WH, Fabry B,Schäffer TE. Imaging viscoelastic properties of live cells by AFM:power-law rheology on the nanoscale. Soft Matter. 2015;11(23):4584–91.
12. Minelli E, Ciasca G, Sassun TE, Antonelli M, Palmieri V, Papi M, MaulucciG, Santoro A, Giangaspero F, Delfini R, Campi G, Spirito MD. Afully-automated neural network analysis of AFM force-distance curves forcancer tissue diagnosis. Appl Phys Lett. 2017;111(14):143701.
13. Radmacher M, Fritz M, Kacher CM, Cleveland JP, Hansma PK. Measuringthe viscoelastic properties of human platelets with the atomic forcemicroscope. Biophys J. 1996;70(1):556–67.
14. Lekka M, Pabijan J. Measuring Elastic Properties of Single Cancer Cells byAFM. In: Santos N. CF, editor. Atomic Force Microscopy. Methods inMolecular Biology. Humana Press, New York: Springer; 2018. p. 315–24.
15. Krieg M, Fläschner G, Alsteens D, Gaub BM, Roos WH, Wuite GJL, GaubHE, Gerber C, Dufrêne YF, Müller DJ. Atomic force microscopy-basedmechanobiology. Nat Rev Phys. 2018. Springer Nature America, Inc.
16. Christ AF, Franze K, Gautier H, Moshayedi P, Fawcett J, Franklin RJM,Karadottir RT, Guck J. Mechanical difference between white and graymatter in the rat cerebellum measured by scanning force microscopy. JBiomech. 2010;43(15):2986–92.
17. Plodinec M, Loparic M, Monnier CA, Obermann EC, Zanetti-Dallenbach R,Oertle P, Hyotyla JT, Aebi U, Bentires-Alj M, Lim RYH, Schoenenberger C-A.The nanomechanical signature of breast cancer. Nat Nanotechnol.2012;7(11):757–65.
18. Möllmert S., Kharlamova M, Hoche T, Taubenberger AV, Abuhattum S,Kuscha V, Kurth T, Brand M, Guck J. Zebrafish spinal cord repair isaccompanied by transient tissue stiffening. bioRxiv. 2019. Cold SpringHarbor Laboratory. https://doi.org/10.1101/666032.
19. Brand M, Granato M. Keeping and raising zebrafish. Zebrafish, a practicalapproach. Edited by: Nüsslein-Volhard C, Dahm R. New York: OxfordUniversity Press; 2002.
20. Jung S-H, Kim S, Chung A-Y, Kim H-T, So J-H, Ryu J, Park H-C, Kim C-H.Visualization of myelination in GFP-transgenic zebrafish. Dev Dyn.2009;239(2):592–7.

Müller et al. BMC Bioinformatics (2019) 20:465 Page 9 of 9
21. Wilson JM, Bunte RM, Carty AJ. Evaluation of rapid cooling and tricainemethanesulfonate (ms222) as methods of euthanasia in zebrafish (daniorerio). J Am Assoc Lab Anim Sci. 2009;48(6):785–9.
22. Hertz H. Ueber die berührung fester elastischer körper. J Reiner AngewMath (Crelle’s J). 1882;1882(92):156–71.
23. Sneddon IN. The relation between load and penetration in theaxisymmetric boussinesq problem for a punch of arbitrary profile. Int JEng Sci. 1965;3(1):47–57.
24. Pedregosa F, Varoquaux G, Gramfort A, Michel V, Thirion B, Grisel O,Blondel M, Prettenhofer P, Weiss R, Dubourg V, Vanderplas J, Passos A,Cournapeau D, Brucher M, Perrot M, Duchesnay E. Scikit-learn: Machinelearning in Python. J Mach Learn Res. 2011;12:2825–30.
25. Fawcett T. An introduction to ROC analysis. Pattern Recogn Lett.2006;27(8):861–74.
26. Müller P, Möllmert S, Guck J. Atomic force microscopy indentation dataof zebrafish spinal cord sections. 2018. https://doi.org/10.6084/m9.figshare.7297202.v1.
Publisher’s NoteSpringer Nature remains neutral with regard to jurisdictional claims inpublished maps and institutional affiliations.